Embed Size (px)
Citation preview

BUSINESS OUTLOOKGLOBAL ELECTRONICS
INDUSTRYWALT CUSTERCUSTER CONSULTING GROUPwww.custerconsulting.comMarch 2012
20120301

BUSINESS CYCLE Components & Capital Equipment
OEMEMSPCBsRaw MaterialsCapital Equipment
0
RecessionExpansionTime
6-9Month Lag
20111205

Global Electronic Supply Chain Forecast 2012 vs 2011
3
5
2
4
-20
Combined GDP
Electronic Equipment
Rigid & Flex PCBs
Semiconductors
Semi Capital Spending
0 5 10-5-10-15-20-25% Change
20120205
Henderson Ventures
Gartner
Henderson Ventures
Custer Consulting Group
Henderson Ventures

Global "Purchasing Managers" Index
JPMorgan
1 3 5 7 9111 3 5 7 9111 3 5 7 9111 3 5 7 9111 3 5 7 9111 3 5 7 9111 3 5 7 9111 3 5 7 9111 3 5 7 9111 303 04 05 06 07 08 09 10 11 12
32
34
36
38
40
42
44
46
48
50
52
54
56
58
60DIFFUSION INDEX
0
10
20
30
40
50
60
70
EXPANSIONCONTRACTION
20120301
Global Manufacturing PMIT Summary50 = no change on previous month.
Jan Feb Change SummaryGlobal PMI 51.3 51.1 - Expanding, slower rateOutput 51.9 52.5 + Expanding, faster rateNew Orders 51.7 51.3 - Expanding, slower rateInput Prices 52.6 56.6 + Rising, faster rateEmployment 51.0 51.1 + Rising, faster rate

World Purchasing Managers' Indices
3 6 9123 6 9123 6 9123 6 9123 6 9123 6 9123 6 9123 6 9123 6 9123 6 9123 6 9123 6 912300 01 02 03 04 05 06 07 08 09 10 11 12
CALENDAR YEAR
0.5
0.7
0.9
1.1
1.3
1.5
1.73/12 rate of change
USA "0" Growth ChinaEurope World
Source: Custer Consulting Group
20120301
Electronic Equipment
20050118

BUSINESS
COMMUNICATION
CONSUMER
AUTO
COMPUTER
GOVMILITARY
INDUSTRIAL
INSTRUMENT
1.7%22.9%
13.2%
6.6%29.8%
9.3%
8.6%
8.1%
Electronic Outlook 10/11
20111006
World Electronic Equipment by Type 2011
$2,019 Billion @ 2010 exchange

Electronic Equipment SuppliersComposite of 105 Public Companies
Revenue, Net Income & Inventory
1 2 3 4 1 2 3 4 1 2 3 4 1 2 3 4 1 2 3 4 1 2 3 4 1 2 3 4 1 2 3 4 1 2 3 4 1 2 3 4 1 2 3 4 1 2 3 400 01 02 03 04 05 06 07 08 09 10 11
0
50
100
150
200
250
300
350
-50
$ Billion
Revenue 139146151159137142135145129133135148137144150168163172169190176184186206192201206226211225234260239252254245212224235264243255269298273286287311Income 12 12 11 8 -1 -5 -12 0 3 -10 0 1 6 5 8 12 12 14 13 16 14 15 14 23 17 12 18 20 19 21 20 22 20 20 19 -2 11 16 19 25 21 24 28 35 29 31 27 37
Inventory 63 65 68 70 72 65 58 53 52 50 48 45 45 46 45 46 48 49 50 49 51 51 52 51 54 57 60 60 59 62 64 65 68 71 71 65 62 62 62 62 63 66 69 72 73 78 79 76
+4%
20120226
Computer 13, Internet 5, Storage 10, Communication 12, SEMI 20, Medical 24, Instruments 11, Military 6

Electronic Equipment SuppliersComposite of 104 Public Companies
Quarterly Revenue Growth
1 2 3 4 1 2 3 4 1 2 3 4 1 2 3 4 1 2 3 4 1 2 3 4 1 2 3 4 1 2 3 4 1 2 3 4 1 2 3 4 1 2 3 401 02 03 04 05 06 07 08 09 10 11
0.0
5.0
10.0
15.0
20.0
25.0
-5.0
-10.0
-15.0
% Growth (quarter vs same quarter in prior year)
20120226
Computer 11, Internet 5, Storage 10, Communication 11, SEMI 13, Medical 24, Instruments 6, Military 6

Global Electronic Equipment Shipment Growth3/12 & 12/12 Rate of Change
1 2 3 4 1 2 3 4 1 2 3 4 1 2 3 4 1 2 3 4 1 2 3 4 1 2 3 4 1 2 3 4 1 2 3 4 1 2 3 4 1 2 3 4 101 02 03 04 05 06 07 08 09 10 11 12
CALENDAR YEAR
0.85
0.9
0.95
1
1.05
1.1
1.15
1.2Rate of Growth (1.0=no growth)
12/12 3/12 Series 3
Custer Consulting Group based upon Industry Sector Composite Data, 104 companies
20120226

Inventory/Sales RatioLarge Component Distributors, Semiconductor, EMS &
OEM Companies
3 4 1 2 3 4 1 2 3 4 1 2 3 4 1 2 3 4 1 2 3 4 1 2 3 4 1 2 3 4 1 2 3 4 1 2 3 4 1 2 3 4 1 2 3 4 1 200 01 02 03 04 05 06 07 08 09 10 11 12
CY
0.200.250.300.350.400.450.500.550.600.650.700.750.800.850.90
Quarterly Inventory/Sales ($)
SemiconductorEMSOEMComponent Distrib
20120226
4 Component Distributor, 18 Semiconductor, 12 EMS and 104 OEM Company Composite
EMS
Chips
OEM
Distr

European Computer, Electronic & Optical products Production
Eurostat, C26 category, EU 27 countries
1 4710147101 471014 7101 4710147101 4710147101 4710147101 4710147101 471014710198 99 00 01 02 03 04 05 06 07 08 09 10 11 12
CALENDAR YEAR
70
80
90
100
110
120
130
Index (2005=100), Seasonally Adjusted
20120215

Japan Electronic Equipment Production2000 to Present
JEITA www.jeita.or.jp/
1 3 5 7 9111 3 5 7 9111 3 5 7 9111 3 5 7 9111 3 5 7 9111 3 5 7 9111 3 5 7 9111 3 5 7 9111 3 5 7 9111 3 5 7 9111 3 5 7 9111 3 5 7 91100 01 02 03 04 05 06 07 08 09 10 11
CALENDAR YEAR
0
500
1000
1500
2000Yen billion
Consumer Electronic EquipmentElectronic Measuring InstrumentationCommunications EquipmentComputers & Related EquipmentElectronic Business MachinesElec Application Equip
-24% -2%+1%
-23%
20120227
-3%+9%
-13%
+17%-10%
-3%

Taiwan/China Electronic Equipment ProducersComposite of 101 Manufacturers
1 3 5 7 9111 3 5 7 9111 3 5 7 9111 3 5 7 9111 3 5 7 9111 3 5 7 9111 3 5 7 9111 3 5 7 9111 3 5 7 9111 3 5 7 911102 03 04 05 06 07 08 09 10 11 12
CALENDAR YEAR
0
200
400
600
800NT$ (billions)
20120212
Taiwan listed companies, often with significant manufacturing in China
2011/2010 up 5%

US Electronic Equipment Orders & ShipmentsCommunications, Computer, Military, Instruments
http://www.census.gov/indicator/www/m3/
1 4 7101 4 7101 4 7101 4 7101 4 7101 4 7101 4 7101 4 7101 4 7101 4 7101 4 7101 4 7101 4 7101 4 710198 99 00 01 02 03 04 05 06 07 08 09 10 11 12
CALENDAR YEAR
14
16
18
20
22
24
26
28
30
32
34$B (Monthly Orders - Seasonally Adjusted)
OrdersShipments
20120229

Global Electronic Equipment Shipment Growth
1 4 7 101 4 7 101 4 7 101 4 7 10 1 4 7 10 1 4 7 10 1 4 7 10 1 4 7 10 1 4 7 10 1 4 7 101 4 7 101 4 7 10100 01 02 03 04 05 06 07 08 09 10 11 12
CALENDAR YEAR
0.6
0.7
0.8
0.9
1
1.1
1.2
1.3
1.4
1.5
1.63/12 rate of growth in local currency
Taiwan/ChinaEuropeJapanUSA0 Growth
20120229
Europe = Eurostat EU27 NACE C26 (computer, electronic & optical products)

World Electronic Equipment Monthly Shipments
Converted @ Constant 2010 Exchange Rates
1357911135791113579111357911135791113579111357911135791113579111357911135791113579111300 01 02 03 04 05 06 07 08 09 10 11 12
CALENDAR YEAR
0
20
40
60
80
100$ Billions
N America W Europe Japan SE Asia ROW
Source: Custer Consulting Group
20120229

World Electronic Equipment Monthly Shipments
Converted @ Constant 2010 Exchange Rates
1 3 5 7 9111 3 5 7 9111 3 5 7 9111 3 5 7 9111 3 5 7 9111 3 5 7 9111 3 5 7 9111 3 5 7 9111 3 5 7 9111 3 5 7 9111 3 5 7 9111 3 5 7 911100 01 02 03 04 05 06 07 08 09 10 11 12
CALENDAR YEAR
80
90
100
110
120
130
140
150
160
170
180$ Billions
Source: Custer Consulting Group
20120229

TopicsEconomy
Electronic Equipment
Semiconductors
Other Components
EMS/ODM
PCB
Summary & Forecasts
20091008
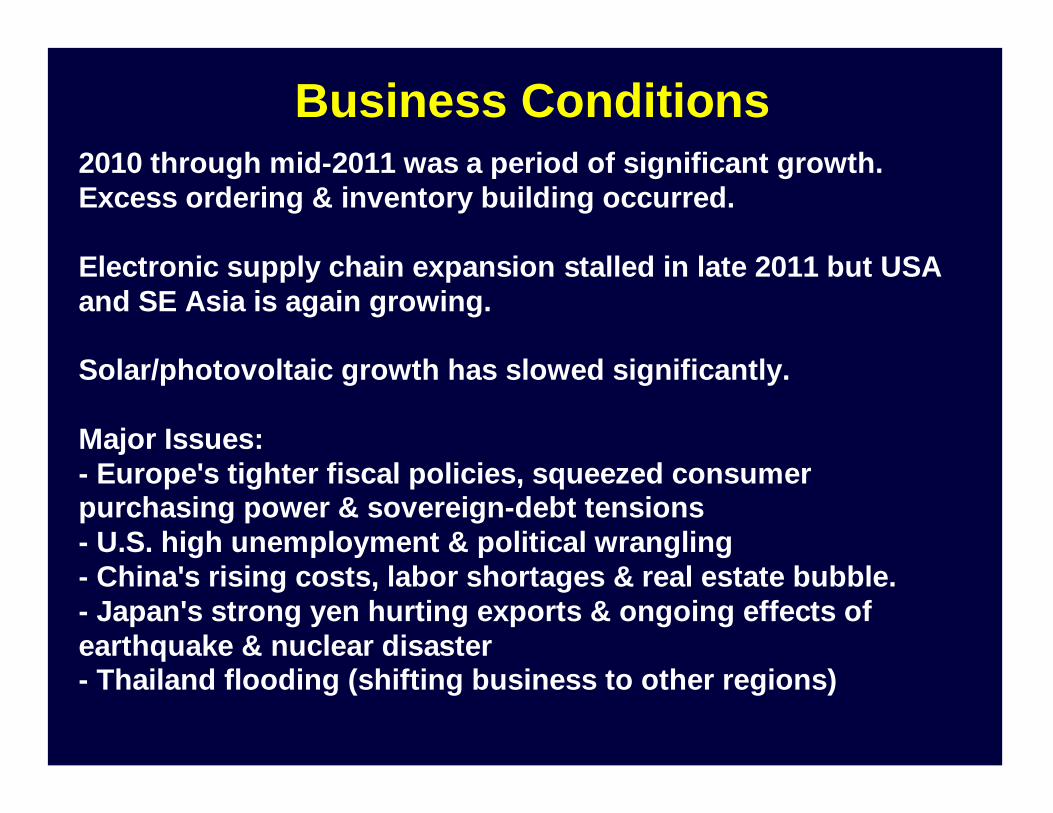
Business Conditions2010 through mid-2011 was a period of significant growth. Excess ordering & inventory building occurred.
Electronic supply chain expansion stalled in late 2011 but USA and SE Asia is again growing.
Solar/photovoltaic growth has slowed significantly.
Major Issues:- Europe's tighter fiscal policies, squeezed consumer purchasing power & sovereign-debt tensions- U.S. high unemployment & political wrangling- China's rising costs, labor shortages & real estate bubble.- Japan's strong yen hurting exports & ongoing effects of earthquake & nuclear disaster- Thailand flooding (shifting business to other regions)
2005011820110705

Global Electronic Supply Chain Forecast 2011 vs 2010
3
2
-1
0
14
Combined GDP
Electronic Equipment
Rigid & Flex PCBs
Semiconductors
Semi Capital Spending
0 5 10 15% Change
20120205
Henderson Ventures
Gartner
Henderson Ventures
Custer Consulting Group
Henderson Ventures

Global Economy
20050118

Industrial Production - World% Change vs. One Year Earlier
Economist 2/2012 http://www.economist.com Output, prices and jobs
20120229

Europe- EU27Manufacture of computer, electronic & optical products
3/12 & 12/12 Rate of Change
3 6 9 12 3 6 9 12 3 6 9 12 3 6 9 12 3 6 9 12 3 6 9 12 3 6 9 12 3 6 9 12 3 6 9 12 3 6 9 12 3 6 9 12 3 6 9 12 3 6 9 1299 00 01 02 03 04 05 06 07 08 09 10 11
CALENDAR YEAR
0.75
0.8
0.85
0.9
0.95
1
1.05
1.1
1.15
1.2
1.25Rate of Growth (1.0=no growth)
12/12 3/12 Zero Growth
Eurostat, class C26
20120215

Japan Electronic Equipment Production by Month - 2000 to Present
JEITA www.jeita.or.jp/
1 3 5 7 9111 3 5 7 9111 3 5 7 9111 3 5 7 9111 3 5 7 9111 3 5 7 9111 3 5 7 9111 3 5 7 9111 3 5 7 9111 3 5 7 9111 3 5 7 9111 3 5 7 911100 01 02 03 04 05 06 07 08 09 10 11 12
CALENDAR YEAR
0
100
200
300
400
500
600
700
800Yen Billion
Consumer Electronic EquipmentElectronic Measuring InstrumentationCommunications EquipmentComputers & Related EquipmentElectronic Business MachinesElec Application Equip
20120227

U.S. Electronic Equipment - Orders, Shipments &
Inventories
20050118

U.S. Electronic Equipment Book/Bill Ratio3-Month Average
1.0731.01710.9831 4 7101 4 7101 4 7101 4 7101 4 7101 4 7101 4 7101 4 7101 4 7101 4 7101 4 7101 4 7101 4 7101 4 7101 4 7101 4 710196 97 98 99 00 01 02 03 04 05 06 07 08 09 10 11 12
0.85
0.9
0.95
1
1.05
1.1
1.15B/B (3 Month Avg)
http://www.census.gov/indicator/www/m3/
20120229
1-monthB/B =0.96

U.S. Electronic Equipment OrdersAdjusted vs Non Seasonally Adjusted
www.census.gov/indicator/www/m3/
1 7 1 7 1 7 1 7 1 7 1 7 1 7 1 7 1 7 1 7 1 7 1 7 1 7 1 7 1 7 1 7 1 71/1295 96 97 98 99 00 01 02 03 04 05 06 07 08 09 10 11
CALENDAR YEAR
8
12
16
20
24
28
32
36
40$ B
AdjustedNot Adjusted
20120205

U.S. Electronic Equipment Order & Shipment GrowthComputer, Communications, Measurement & Control and Military
1 4 7101 4 7101 4 7101 4 7101 4 7101 4 7101 4 7101 4 7101 4 7101 4 7101 4 7101 4 7101 4 7101 4 7101 4 7101 4 7101 4 710195 96 97 98 99 00 01 02 03 04 05 06 07 08 09 10 11 12
CALENDAR YEAR
0.6
0.7
0.8
0.9
1
1.1
1.2
1.33/12 rate of growth
Shipments Orders Zero Growth
http://www.census.gov/indicator/www/m3/
20120229

US Electronic Equipment OrdersMonthly Data
http://www.census.gov/indicator/www/m3/
1 4 7101 4 7101 4 7101 4 7101 4 7101 4 7101 4 7101 4 7101 4 7101 4 7101 4 7101 4 7101 4 710199 00 01 02 03 04 05 06 07 08 09 10 11 12
CALENDAR YEAR
0
2
4
6
8
10
12
14
$ B (Seasonally Adjusted)Search & NavigationElectromedical, Instruments & ControlsCommunicationComputerDefense
20120229

U.S. Electronic Equipment Orders
http://www.census.gov/indicator/www/m3/
1 4 7 10 1 4 7 10 1 4 7 10 1 4 7 10 1 4 7 10 1 4 7 10 1 4 7 10 1 4 7 10 1 4 7 10 1 4 7 10 1 4 7 10 1 4 7 1000 01 02 03 04 05 06 07 08 09 10 11
CALENDAR YEAR
0
5
10
15
20
25
30
35$ Billion
Military-CommunicationsMilitary-Search & NavigationComputer & RelatedCommunications- non MilitarySearch & Navigation - non MilitaryMedical, Measuring & Control
Military
20120205
Instruments
Communication
Computer

U.S. Electronic Equipment Orders
http://www.census.gov/indicator/www/m3/
1 4 7 10 1 4 7 10 1 4 7 10 1 4 7 10 1 4 7 10 1 4 7 10 1 4 7 10 1 4 7 10 1 4 7 10 1 4 7 10 1 4 7 10 1 4 7 1000 01 02 03 04 05 06 07 08 09 10 11
CALENDAR YEAR
0%
20%
40%
60%
80%
100%
Military-CommunicationsMilitary-Search & NavigationComputerCommunications- non MilitarySearch & Navigation - non MilitaryMedical, Measuring & Control
Military
20120205
Computer
Communication
Instruments

US Electronic Equipment InventoriesMonthly Data
http://www.census.gov/indicator/www/m3/
1 1 1 1 1 1 1 1 1 1 1 1 1 1 1 1 1 195 96 97 98 99 00 01 02 03 04 05 06 07 08 09 10 11 12
CALENDAR YEAR
0
2
4
6
8
10
12
14
16
18
$ B (Seasonally Adjusted)
SEARCH & NAVIGATIONELECTROMEDICAL, MEASURE & CONTROLCOMMUNICATIONCOMPUTERDEFENSE
20120229

Value of U.S. "Computers & Electronic Products" Inventories by Stage of Fabrication
Decemberber 2011
www.census.gov/indicator/www/m3/hist/naicsinvp.xls
Materials & Supplies39.1%
Work in Process36.7%
Finished Goods24.2%
TOTAL: $47.3 Billion
20120205

Value of U.S. "Computers & Electronic Products" Inventories by Stage of Fabrication
1 1 1 1 1 1 1 1 1 1 1 1 1 1 1 1 1 1 1 1 192 93 94 95 96 97 98 99 00 01 02 03 04 05 06 07 08 09 10 11 12
CALENDAR YEAR
5
10
15
20
25
30$ Billions
Materials & Supplies Work in Process Finished Goods
http://www.census.gov/indicator/www/m3/hist/naicsinvp.xls
20120205

U.S. Electronic Equipment InventoriesInventories vs. Orders
www.census.gov/indicator/www/m3/
1 1 1 1 1 1 1 1 1 1 1 1 1 1 1 1 1 1 1 1 192 93 94 95 96 97 98 99 00 01 02 03 04 05 06 07 08 09 10 11 12
CALENDAR YEAR
1
1.2
1.4
1.6
1.8
2
2.2
2.4
20120229

Market Segments2005011820050118
Volume (Shift to Low Cost Areas)Personal ComputersMobile PhonesOther Consumer ElectronicsDatacom/TelecomAutomotive
"Protected"MilitaryMedicalInstruments & ControlsHigh IP Content
Prototype, Quick Response, Short Run, Need for Local Support
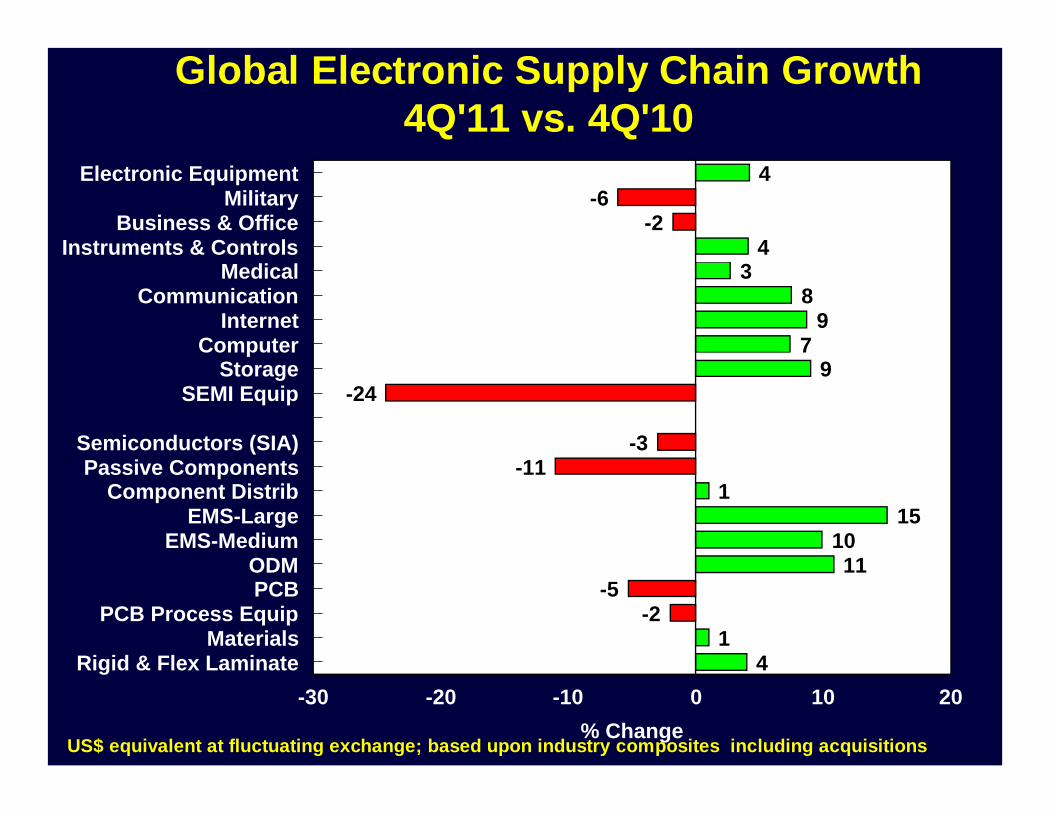
Global Electronic Supply Chain Growth 4Q'11 vs. 4Q'10
4-6
-24
38
97
9-24
-3-11
115
1011
-5-2
14
Electronic EquipmentMilitary
Business & OfficeInstruments & Controls
MedicalCommunication
InternetComputer
StorageSEMI Equip
Semiconductors (SIA)Passive Components
Component DistribEMS-Large
EMS-MediumODMPCB
PCB Process EquipMaterials
Rigid & Flex Laminate0 10 20-10-20-30
% Change
20120226
US$ equivalent at fluctuating exchange; based upon industry composites including acquisitions

Instruments & Control EquipmentComposite of 12 Public Companies
Revenue, Net Income & Inventory
1 2 3 4 1 2 3 4 1 2 3 4 1 2 3 4 1 2 3 4 1 2 3 4 1 2 3 4 1 2 3 4 1 2 3 4 1 2 3 4 1 2 3 4 1 2 3 400 01 02 03 04 05 06 07 08 09 10 11
0.0
5.0
10.0
15.0
20.0
-5.0
US$ Billions
Revenue 9.2 9.410.29.5 9.6 8.7 7.9 7.4 7.5 7.9 8.1 7.5 7.8 8.08.3 8.3 8.8 9.0 9.3 9.2 9.3 9.8 9.7 9.710.110.710.911.012.313.113.813.414.115.015.113.111.912.112.512.712.813.214.214.114.615.516.014.6Income 0.9 0.9 1.00.8 0.8 0.3 0.3-0.1-0.0 0.2 0.2 0.0 0.2-1.0 0.5 0.5 0.6 0.7 0.8 0.8 0.8 0.8 0.8 3.7 0.9 1.1 1.0 1.2 1.6 1.2 1.4 1.3 1.3 1.4 1.5 0.9 0.6 0.8 0.9 1.0 1.1 1.4 1.6 1.6 1.4 2.1 1.2 1.2
Inventory 6.4 6.5 5.56.2 5.9 5.6 5.2 5.0 4.8 4.7 4.4 4.4 4.4 4.44.1 4.3 4.4 4.3 4.6 4.7 4.7 4.6 4.5 4.5 4.6 4.9 4.8 6.0 5.7 5.9 5.8 6.1 6.4 6.5 6.2 6.3 6.0 5.7 5.4 5.5 5.7 5.9 6.1 6.2 6.7 7.0 6.7 7.0
Agilent, Ametek, Emerson, Itron, Keithly, LeCroy, PerkinElmer, Rockwell Automation, Teledyne, ThermoFisher, Varian, Woodward Govenor
+4%
20120226
4Q'11 estimate based upon partial data
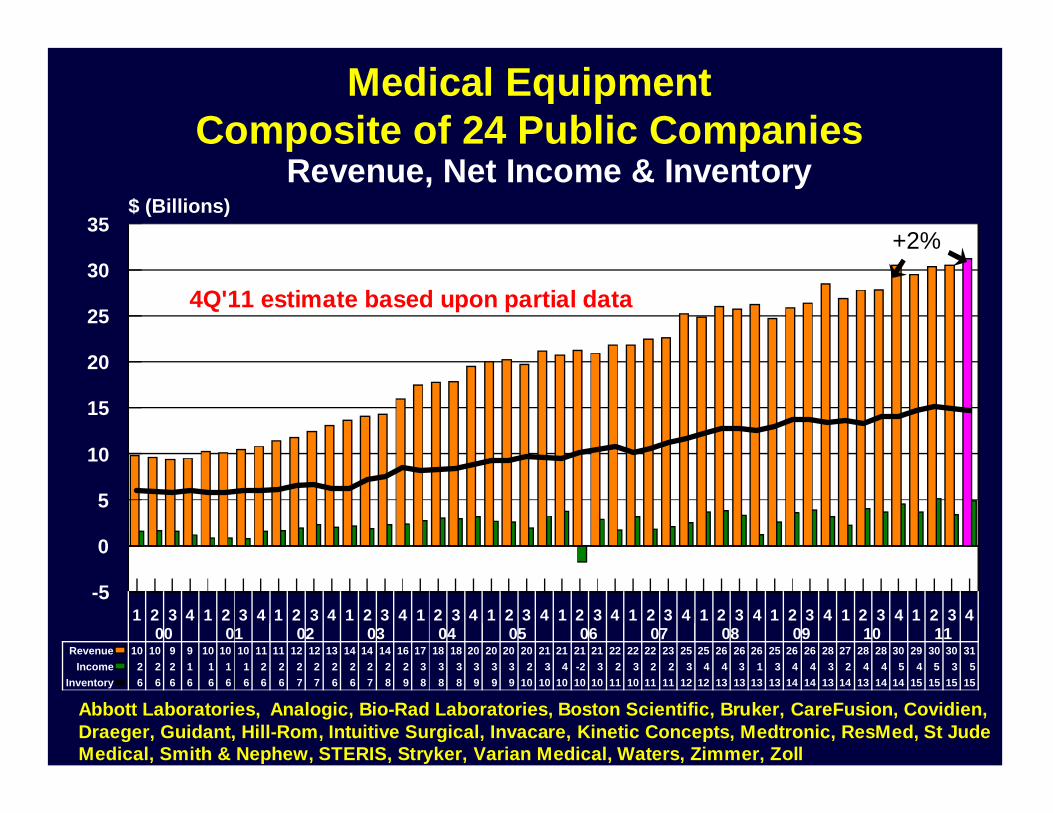
Medical EquipmentComposite of 24 Public Companies
Revenue, Net Income & Inventory
1 2 3 4 1 2 3 4 1 2 3 4 1 2 3 4 1 2 3 4 1 2 3 4 1 2 3 4 1 2 3 4 1 2 3 4 1 2 3 4 1 2 3 4 1 2 3 400 01 02 03 04 05 06 07 08 09 10 11
0
5
10
15
20
25
30
35
-5
$ (Billions)
Revenue 10 10 9 9 10 10 10 11 11 12 12 13 14 14 14 16 17 18 18 20 20 20 20 21 21 21 21 22 22 22 23 25 25 26 26 26 25 26 26 28 27 28 28 30 29 30 30 31Income 2 2 2 1 1 1 1 2 2 2 2 2 2 2 2 2 3 3 3 3 3 3 2 3 4 -2 3 2 3 2 2 3 4 4 3 1 3 4 4 3 2 4 4 5 4 5 3 5
Inventory 6 6 6 6 6 6 6 6 6 7 7 6 6 7 8 9 8 8 8 9 9 9 10 10 10 10 10 11 10 11 11 12 12 13 13 13 13 14 14 13 14 13 14 14 15 15 15 15
Abbott Laboratories, Analogic, Bio-Rad Laboratories, Boston Scientific, Bruker, CareFusion, Covidien, Draeger, Guidant, Hill-Rom, Intuitive Surgical, Invacare, Kinetic Concepts, Medtronic, ResMed, St Jude Medical, Smith & Nephew, STERIS, Stryker, Varian Medical, Waters, Zimmer, Zoll
+2%
20120226
4Q'11 estimate based upon partial data

Military EquipmentComposite of 6 Public Companies
Revenue, Net Income & Inventory
1 2 3 4 1 2 3 4 1 2 3 4 1 2 3 4 1 2 3 4 1 2 3 4 1 2 3 4 1 2 3 4 1 2 3 4 1 2 3 4 1 2 3 4 1 2 3 400 01 02 03 04 05 06 07 08 09 10 11
0.0
10.0
20.0
30.0
40.0
50.0
-10.0
$ Billions
Revenue 16.115.915.518.014.317.517.921.218.219.119.322.321.723.924.827.226.332.126.830.227.329.629.131.929.031.230.833.130.032.933.735.632.635.534.636.834.736.135.437.935.236.937.139.433.935.135.537.0Income 0.3 0.6-0.1 0.7 0.4 0.4 0.2-1.0 0.2 0.3 0.7-0.1 0.9 0.9 0.7 1.2 1.0 1.2 1.2 1.4 1.4 1.5 1.5 1.7 1.8 2.2 1.9 2.2 2.2 3.3 2.4 2.7 2.2 2.7 2.7-0.6 2.4 2.2 2.6 2.6 2.4 2.7 2.8 2.8 2.4 2.6 2.7 2.6
Inventory 8.9 8.3 8.7 8.3 8.6 9.6 9.2 8.6 8.7 8.6 7.9 7.8 7.6 7.7 7.4 7.6 7.7 7.5 7.2 6.8 7.0 7.0 7.2 7.0 7.5 7.8 8.1 6.1 6.0 6.1 6.0 6.3 6.4 6.3 6.6 7.0 7.1 7.0 7.3 7.5 7.7 7.4 7.3 7.8 7.7 7.9 7.5 8.0
General Dynamics, Harris, Lockheed, Northrop Grumman, Raytheon, Rockwell Collins
-6%
20120206

U.S. Defense Capital GoodsOrders & Shipments
http://www.census.gov/indicator/www/m3/
147101471014 71014710147101471014710147101471014 7101471014710147101 4710147101471014710147101471014710192 93 94 95 96 97 98 99 00 01 02 03 04 05 06 07 08 09 10 11 12
CALENDAR YEAR
1
6
11
16
21
26
$ Billions
OrdersShipments
20120229

Computer, Data Storage, Datacom & Telecom Equipment Suppliers
Composite of 43 Public Companies
1 2 3 4 1 2 3 4 1 2 3 4 1 2 3 4 1 2 3 4 1 2 3 4 1 2 3 4 1 2 3 4 1 2 3 4 1 2 3 4 1 2 3 4 1 2 3 400 01 02 03 04 05 06 07 08 09 10 11
0
50
100
150
200
250
-50
$ Billion
Revenue 100107111117 99 103 96103 89 90 91 101 91 94 99 112105107109125114119122137125130135153139148156179160169173164138147156179161169181205185195196221Income 8 9 8 5 -3 -7-13 0 1 -13 -3 0 3 3 5 8 7 8 8 11 9 9 10 13 9 9 11 14 11 14 13 14 12 11 11 -2 7 11 12 18 14 15 18 24 19 19 18 28
Inventory 39 41 45 47 48 41 35 31 28 26 26 23 23 23 23 23 24 25 25 25 26 26 27 27 28 30 32 32 32 35 36 36 38 39 39 34 31 30 31 31 31 34 36 38 38 41 43 40
+8%
20120226
Computer 13, Internet 9, Storage 10, Communication 12
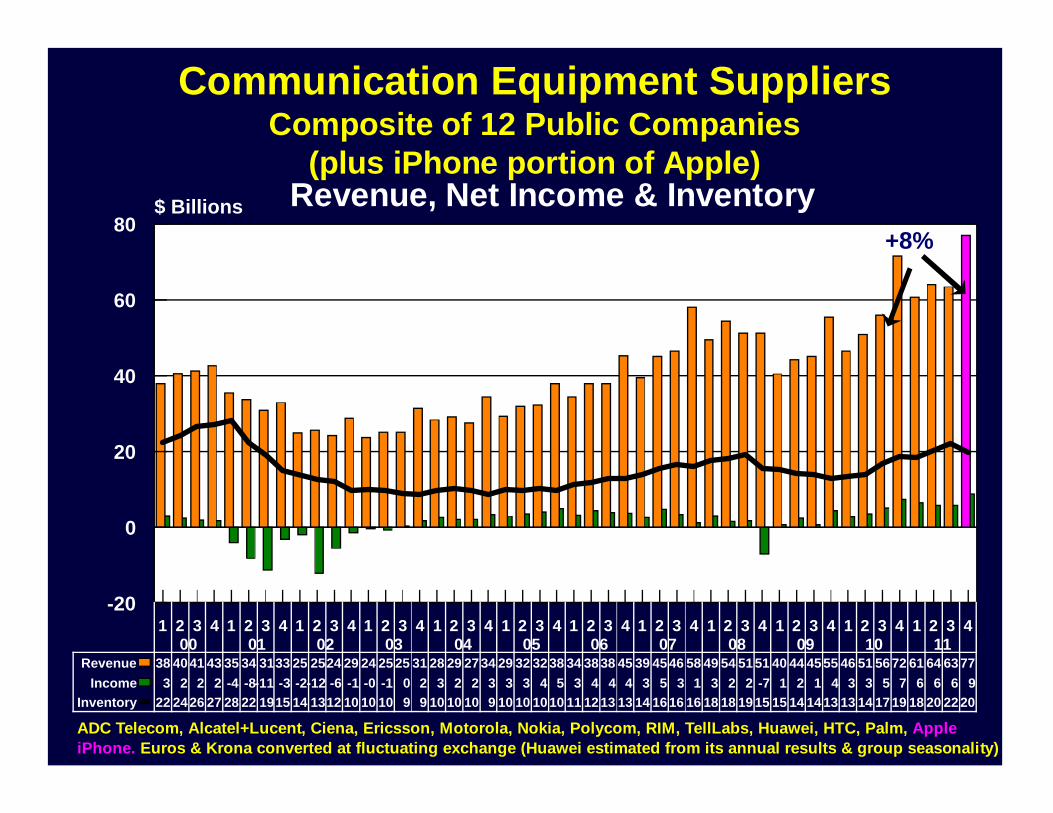
Communication Equipment SuppliersComposite of 12 Public Companies
(plus iPhone portion of Apple)Revenue, Net Income & Inventory
1 2 3 4 1 2 3 4 1 2 3 4 1 2 3 4 1 2 3 4 1 2 3 4 1 2 3 4 1 2 3 4 1 2 3 4 1 2 3 4 1 2 3 4 1 2 3 400 01 02 03 04 05 06 07 08 09 10 11
0
20
40
60
80
-20
$ Billions
Revenue 38 4041 43 35 34 3133 25 2524 29 24 2525 31 28 29 2734 29 32 3238 34 3838 45 39 4546 58 49 54 5151 40 44 4555 46 51 5672 61 64 6377Income 3 2 2 2 -4 -8-11 -3 -2-12 -6 -1 -0 -1 0 2 3 2 2 3 3 3 4 5 3 4 4 4 3 5 3 1 3 2 2 -7 1 2 1 4 3 3 5 7 6 6 6 9
Inventory 22 2426 27 28 22 1915 14 1312 10 10 10 9 9 10 10 10 9 10 10 1010 11 1213 13 14 1616 16 18 18 1915 15 14 1413 13 14 1719 18 20 2220
ADC Telecom, Alcatel+Lucent, Ciena, Ericsson, Motorola, Nokia, Polycom, RIM, TellLabs, Huawei, HTC, Palm, Apple iPhone. Euros & Krona converted at fluctuating exchange (Huawei estimated from its annual results & group seasonality)
+8%
2007021320120215

World Mobile Phone Unit ShipmentsTotal Sales - Analog & Digital
Gartner Dataquest 2/12, ABI Research (2012 data forecast) 1/12
108172
284413 400 432
520
674817
991
1,1531,2221,211
1,388
1,597
1,775
1997 1998 1999 2000 2001 2002 2003 2004 2005 2006 2007 2008 2009 2010 2011 20120
500
1,000
1,500
2,000
20120218

Smartphone Unit Shipments to End UsersWorld
Gartner DataQuest 11/11, IDC 2/12
4 1 2 3 4 1 2 3 4 1 2 3 4 1 2 3 407 08 09 10 11
0
20
40
60
80
100
120
140
160
180Units (Millions)
20120209

Computer Equipment SuppliersComposite of 13 Public Companies
Revenue, Net Income & Inventory
1 2 3 4 1 2 3 4 1 2 3 4 1 2 3 4 1 2 3 4 1 2 3 4 1 2 3 4 1 2 3 4 1 2 3 4 1 2 3 4 1 2 3 4 1 2 3 400 01 02 03 04 05 06 07 08 09 10 11
0
20
40
60
80
100
120
-20
$ Billion
Revenue 51 54 57 60 52 58 55 59 54 54 56 61 57 58 62 68 64 65 68 76 70 71 75 82 74 75 79 88 80 83 88 97 88 92 98 92 79 83 89 99 90 9410010899104105116Income 4 5 4 4 2 2 1 3 2 -1 2 0 3 3 3 5 3 4 4 5 4 4 3 6 4 4 5 7 5 6 6 9 6 7 6 8 5 7 8 10 7 8 10 1310 11 9 15
Inventory 14 14 15 15 16 15 12 13 12 11 11 11 11 11 11 11 12 12 13 13 12 13 13 13 13 14 14 15 14 15 15 15 15 16 15 14 12 12 13 13 13 15 14 1414 15 15 15
+7%
20120225
Acer+Gateway, Apple, Creative Tech, Cray, Dell, HP, IBM, Lenovo, Mercury, NCR, Sun Micro, Unisys
Apple iPhone financials reported in Communication sectorMedia tablets included with "Computer Equipment"

Media Tablet ShipmentsEmerging & Mature Markets
DisplaySearch 10/11
20
64
110
163
209
259
311
367
2010 2011 2012 2013 2014 2015 2016 20170
100
200
300
400
Emerging 4 25 40 64 88 119 148 185Mature 17 39 70 99 120 140 163 182
20110925

Semiconductors
20050118

Global Semiconductor Shipments3-Month Growth Rates on $ Basis
Total $ Shipments from All Countries to an AreaSIA website: www.sia-online.org/
1 5 9 1 5 9 1 5 9 1 5 9 1 5 9 1 5 9 1 5 9 1 5 9 1 5 9 1 5 9 1 5 9 1 5 9 1 5 9 1 5 9 1 5 9 1 5 9 1 5 9 1 5 9 1 5 9 1 5 9 1 5 9 1 5 9 1 5 9 1 5 9 1 5 9 1 5 9 1 5 9 1 5 9 184 85 86 87 88 89 90 91 92 93 94 95 96 97 98 99 00 01 02 03 04 05 06 07 08 09 10 11 12
0.4
0.6
0.8
1
1.2
1.4
1.63/12 Rate of Change
1
2 3
4
5
6
7
8
9
10
20120205
11 12
13

World Semiconductor Shipments Monthly US$
SIA
1 1 1 1 1 1 1 1 1 1 1 1 1 1 1 1 1 1 1 1 1 1 1 1 1 1 1 1 1 183 84 85 86 87 88 89 90 91 92 93 94 95 96 97 98 99 00 01 02 03 04 05 06 07 08 09 10 11 12
0
5
10
15
20
25
30US$ Billions (3-month average)
20120205
2009 recession much sharper but shorter than 2001
Record high

Monthly Semiconductor Shipments$ Billions (3-month average)
SIA www.sia-online.org/
12/10 12/11 % CH
Americas 4.57 4.36 -4.6%
Europe 3.30 2.78 -15.8%
Japan 3.97 3.59 -9.5%
Asia Pacific 13.31 13.10 -1.6%
Total 25.15 23.83 -5.3%
20120205

CCG Semiconductor Leading Indicator vs. Global Semiconductor Shipments
1 7 1 7 1 7 1 7 1 7 1 7 1 7 1 7 1 7 1 7 1 7 1 7 100 01 02 03 04 05 06 07 08 09 10 11 12
CALENDAR YEAR
0.30.40.50.60.70.80.9
11.11.21.31.41.51.61.7
3/12 rate of growthCCG Semiconductor Leading IndicatorZero GrowthSIA Semiconductor Shipments
http://www.census.gov/indicator/www/m3/
20120301
2-monthlead

Semiconductor Shipments to N. Americavs. U.S Electronic Equipment Production
Total $ Semiconductor Shipments from All Countries to N. America www.sia-online.org/U.S. Electronic Equipment Shipments www.census.gov/indicator/www/m3/
1357911135791113579111357911135791113579111357911135791113579111357911135791113579111357911199 00 01 02 03 04 05 06 07 08 09 10 11 12
0.4
0.6
0.8
1
1.2
1.4
1.6
1.83/12 Rate of Change (US$)
SemiconductorsEquipment
20120229
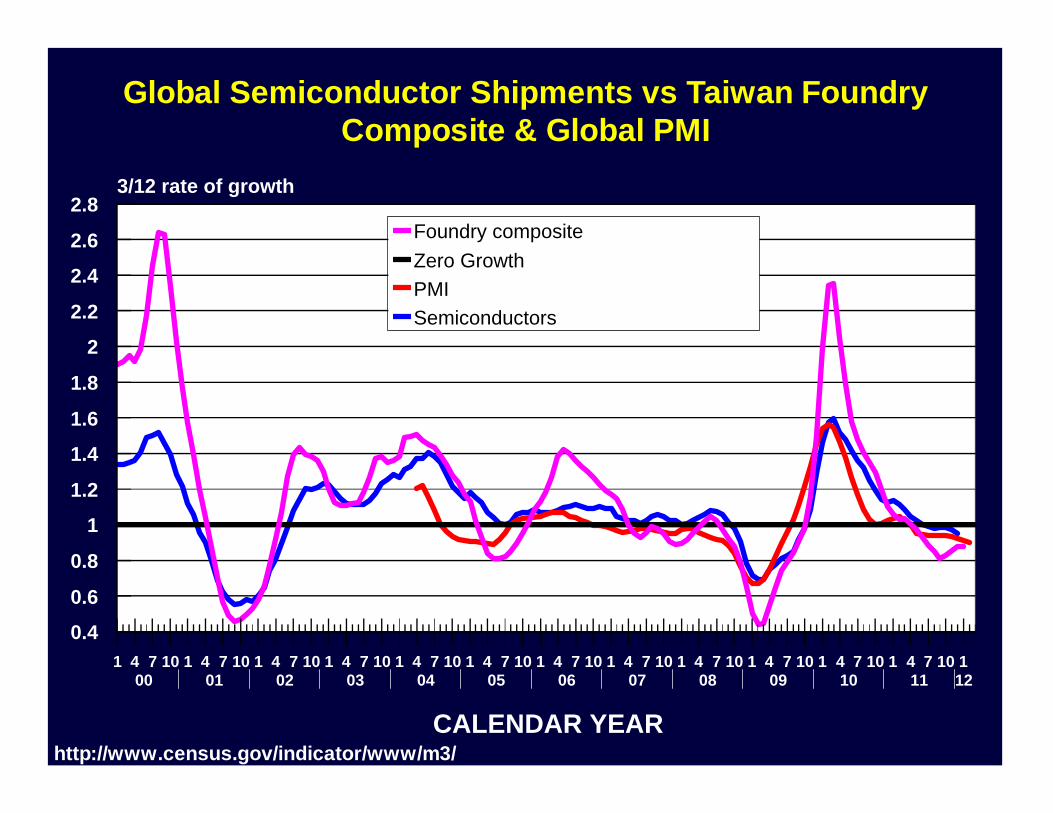
Global Semiconductor Shipments vs Taiwan Foundry Composite & Global PMI
1 4 7 10 1 4 7 10 1 4 7 10 1 4 7 10 1 4 7 10 1 4 7 10 1 4 7 10 1 4 7 10 1 4 7 10 1 4 7 10 1 4 7 10 1 4 7 10 100 01 02 03 04 05 06 07 08 09 10 11 12
CALENDAR YEAR
0.4
0.6
0.8
1
1.2
1.4
1.6
1.8
2
2.2
2.4
2.6
2.83/12 rate of growth
Foundry compositeZero GrowthPMISemiconductors
http://www.census.gov/indicator/www/m3/
20120301

Semiconductor Fab, Assembly, Packaging,Test & Measurement
Equipment
20050118
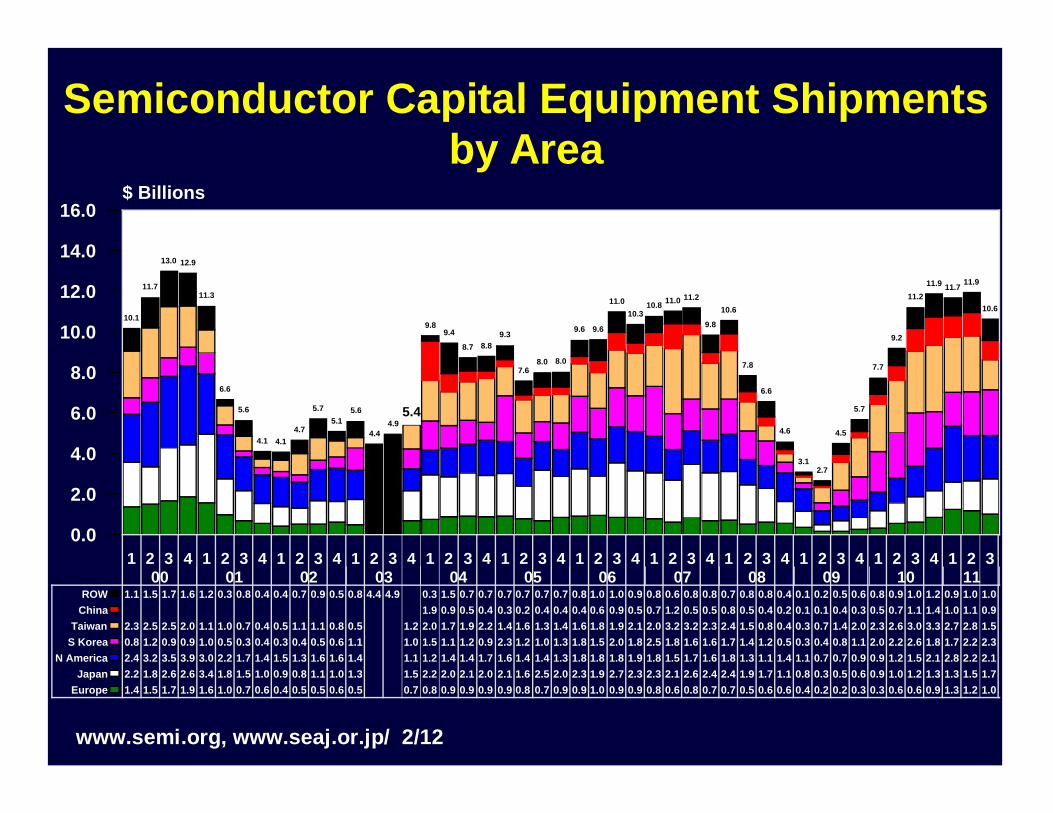
Semiconductor Capital Equipment Shipments by Area
5.4
10.1
11.7
13.0 12.9
11.3
6.6
5.6
4.1 4.14.7
5.75.1
5.6
4.44.9
9.89.4
8.7 8.89.3
7.68.0 8.0
9.6 9.6
11.010.3
10.8 11.0 11.2
9.8
10.6
7.8
6.6
4.6
3.12.7
4.5
5.7
7.7
9.2
11.211.9 11.7 11.9
10.6
1 2 3 4 1 2 3 4 1 2 3 4 1 2 3 4 1 2 3 4 1 2 3 4 1 2 3 4 1 2 3 4 1 2 3 4 1 2 3 4 1 2 3 4 1 2 300 01 02 03 04 05 06 07 08 09 10 11
0.0
2.0
4.0
6.0
8.0
10.0
12.0
14.0
16.0$ Billions
Europe 1.4 1.5 1.7 1.9 1.6 1.0 0.7 0.6 0.4 0.5 0.5 0.6 0.5 0.7 0.8 0.9 0.9 0.9 0.9 0.8 0.7 0.9 0.9 1.0 0.9 0.9 0.8 0.6 0.8 0.7 0.7 0.5 0.6 0.6 0.4 0.2 0.2 0.3 0.3 0.6 0.6 0.9 1.3 1.2 1.0Japan 2.2 1.8 2.6 2.6 3.4 1.8 1.5 1.0 0.9 0.8 1.1 1.0 1.3 1.5 2.2 2.0 2.1 2.0 2.1 1.6 2.5 2.0 2.3 1.9 2.7 2.3 2.3 2.1 2.6 2.4 2.4 1.9 1.7 1.1 0.8 0.3 0.5 0.6 0.9 1.0 1.2 1.3 1.3 1.5 1.7
N America 2.4 3.2 3.5 3.9 3.0 2.2 1.7 1.4 1.5 1.3 1.6 1.6 1.4 1.1 1.2 1.4 1.4 1.7 1.6 1.4 1.4 1.3 1.8 1.8 1.8 1.9 1.8 1.5 1.7 1.6 1.8 1.3 1.1 1.4 1.1 0.7 0.7 0.9 0.9 1.2 1.5 2.1 2.8 2.2 2.1S Korea 0.8 1.2 0.9 0.9 1.0 0.5 0.3 0.4 0.3 0.4 0.5 0.6 1.1 1.0 1.5 1.1 1.2 0.9 2.3 1.2 1.0 1.3 1.8 1.5 2.0 1.8 2.5 1.8 1.6 1.6 1.7 1.4 1.2 0.5 0.3 0.4 0.8 1.1 2.0 2.2 2.6 1.8 1.7 2.2 2.3Taiwan 2.3 2.5 2.5 2.0 1.1 1.0 0.7 0.4 0.5 1.1 1.1 0.8 0.5 1.2 2.0 1.7 1.9 2.2 1.4 1.6 1.3 1.4 1.6 1.8 1.9 2.1 2.0 3.2 3.2 2.3 2.4 1.5 0.8 0.4 0.3 0.7 1.4 2.0 2.3 2.6 3.0 3.3 2.7 2.8 1.5
China 1.9 0.9 0.5 0.4 0.3 0.2 0.4 0.4 0.4 0.6 0.9 0.5 0.7 1.2 0.5 0.5 0.8 0.5 0.4 0.2 0.1 0.1 0.4 0.3 0.5 0.7 1.1 1.4 1.0 1.1 0.9ROW 1.1 1.5 1.7 1.6 1.2 0.3 0.8 0.4 0.4 0.7 0.9 0.5 0.8 4.4 4.9 0.3 1.5 0.7 0.7 0.7 0.7 0.7 0.7 0.8 1.0 1.0 0.9 0.8 0.6 0.8 0.8 0.7 0.8 0.8 0.4 0.1 0.2 0.5 0.6 0.8 0.9 1.0 1.2 0.9 1.0 1.0
www.semi.org, www.seaj.or.jp/ 2/12
20120225

Worldwide Semiconductor Capital Equipment Market by Geography (with forecast)
19.8 22.2
37.132.9
40.5 42.8
29.5
15.9
39.9 41.837.3
40.1
2002 2003 2004 2005 2006 2007 2008 2009 2010 2011 2012 20130.0
10.0
20.0
30.0
40.0
50.0$ Billions
N America 5.9 4.7 5.8 5.7 7.3 6.6 5.6 3.4 5.8 8.8 6.8 7.2Japan 3.9 5.6 8.3 8.2 9.2 9.3 7.0 2.2 4.4 5.8 5.2 5.7
Taiwan 3.5 2.9 7.8 5.7 7.3 10.7 5.0 4.4 11.3 8.1 6.9 8.3Europe 2.1 2.6 3.4 3.3 3.6 2.9 2.5 1.0 2.3 3.9 3.4 3.5
S Korea 1.7 3.2 4.6 5.8 7.0 7.4 4.9 2.6 8.6 8.0 8.6 8.4China 1.2 2.7 1.3 2.3 2.9 1.9 0.9 3.7 3.8 3.5 3.8ROW 2.7 2.1 4.5 2.9 3.7 3.1 2.6 1.4 3.8 3.5 2.9 3.2
SEMI 11/2011 (and prior reports)
20111207

Global Semiconductor & Semiconductor Capital Equipment3-Month Shipment Growth Rates on $ Basis
Sources: SIA; Semiconductor Equipment Association of Japan, www.semi.org
159159159159159159159159159159159159159159159159159159159159159159159159159159159159184 85 86 87 88 89 90 91 92 93 94 95 96 97 98 99 00 01 02 03 04 05 06 07 08 09 10 1112
0.20.40.60.8
11.21.41.61.8
22.22.42.62.8
33.23.43.6
3/12 Rate of Change
SemiconductorsSEMI Capital EquipSeries 5
Chips
Capital Equipment
20120226

Solar/Photovoltaic
20050118
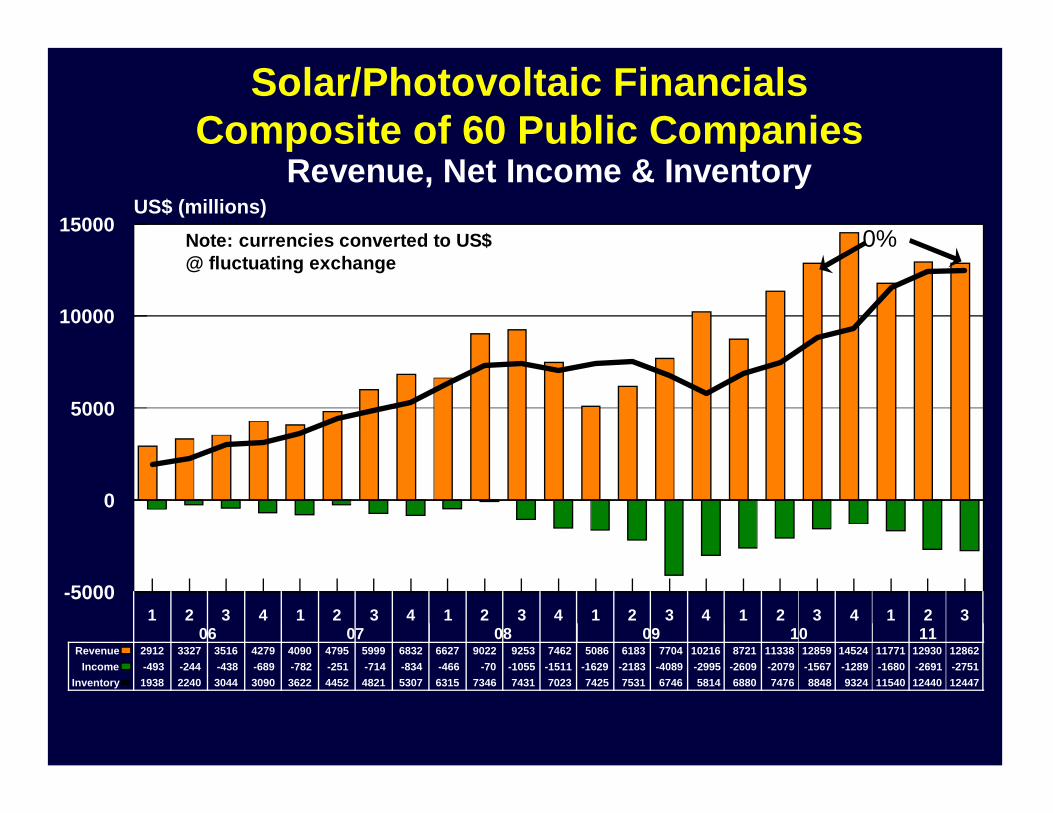
Solar/Photovoltaic FinancialsComposite of 60 Public Companies
Revenue, Net Income & Inventory
1 2 3 4 1 2 3 4 1 2 3 4 1 2 3 4 1 2 3 4 1 2 306 07 08 09 10 11
0
5000
10000
15000
-5000
US$ (millions)
Revenue 2912 3327 3516 4279 4090 4795 5999 6832 6627 9022 9253 7462 5086 6183 7704 10216 8721 11338 12859 14524 11771 12930 12862Income -493 -244 -438 -689 -782 -251 -714 -834 -466 -70 -1055 -1511 -1629 -2183 -4089 -2995 -2609 -2079 -1567 -1289 -1680 -2691 -2751
Inventory 1938 2240 3044 3090 3622 4452 4821 5307 6315 7346 7431 7023 7425 7531 6746 5814 6880 7476 8848 9324 11540 12440 12447
0%
20120102
Note: currencies converted to US$ @ fluctuating exchange

Taiwan Solar/Photovoltaic Panel CompaniesComposite of 17 Manufacturers
135791113579111357911135791113579111357911135791113579111357911135791113579111357911100 01 02 03 04 05 06 07 08 09 10 11 12
CALENDAR YEAR
0
2
4
6
8
10
12
14
16
18
20NT$ billions
20120212
Big Sun Energy Technology, Daxon, DelSolar, e_TON Solar Tec, Eversol, Gintech, Green Energy Technology (GET), Ligitek, Motech, Neo Solar Power, Phoenixtec Power Co (PPC), Precision Silicon, Sino-American Silicon Products, Sonartech, Sysgration, Tyntek, Wafer Works
2011/2010 Revenuedown 18%

Component Distributors
20050118

DMASS European Semiconductor Distribution Industry
DMASS 2/2012 http://dmass.com/
598
434
139 118126 117110 96
203 209199142
4Q 4Q10 11
0
200
400
600
800Euros (millions)
GermanyItalyUKFranceE EuropeNordic
20120215
Only GrowthRegions
Georg Steinberger, chairman of DMASS, commented on the results: "As expected, 2011 remained positive and set another sales record for semiconductor distribution. However, the last quarter displayed very precisely the current market trends of cautious ordering behaviour in some and inventory corrections in some other industry segments. The two halves of 2011 couldn't have been more different, from 23% plus to 7% minus. Predictions under the current climate would be dangerous, but I would not be surprised to see exactly the opposite in 2012 - weak first half and stronger second half."

DMASS
1121
1027983 967
120012201170
1060
1185115310931130
138014001340
1270
1480
13701310
1210
13721340
1220
1075992
869926 960
1345
15001560
1470
1810
1710
1500
1350
1 2 3 4 1 2 3 4 1 2 3 4 1 2 3 4 1 2 3 4 1 2 3 4 1 2 3 4 1 2 3 4 1 2 3 403 04 05 06 07 08 09 10 11
0
500
1000
1500
2000Euros (millions)
Germany 342 297 274 368 348 342 292 357 342 343 333 439 438 434 393 491 435 434 380 461 437 419 347 329 289 315 314 457 498 551 494 640 603 531 434Italy 161 152 158 171 138 140 175 166 131 144 198 193 159 160 201 182 155 152 183 174 132 117 116 99 91 104 155 166 153 143 200 183 136 118UK 157 144 149 154 154 133 137 138 138 140 149 158 154 142 146 133 127 109 117 116 110 101 86 82 86 83 112 128 138 125 144 138 128 117
France 116 103 122 125 118 118 124 116 105 107 133 130 118 113 129 117 107 102 114 111 96 93 91 78 73 78 111 118 109 112 130 122 104 96Other 346 331 983 693 403 422 418 377 392 391 376 406 461 481 475 462 513 503 487 467 497 502 464 417 370 321 361 381 510 590 609 596 696 664 601 585
20120215
European Semiconductor Distribution Industry
http://dmass.com/

EMS & ODM Companies
20050118

Large Global EMS Providers2010 vs. 2011 Sales ($M)
2010 2011 Growth %Hon Hai (Foxconn) Taiwan 74,341 94,122 +27%Flextronics Singapore 27,761 29,944 +8%Jabil Circuit USA 14,403 16,763 +16%Celestica Canada 6,526 7,213 +11%Sanmina-SCI USA 6,503 6,442 - 1%Benchmark Elec USA 2,402 2,253 -6%Plexus USA 2,149 2,195 +2%Venture Mfg Singapore 1,967 1,935 -2%Sypris USA 267 339 +27%
Total 136,319 161,206 +18%
Sources: Company data Local currency converted at fluctuating exchange
2011/2010
20120226

Large EMS Providers Composite of 9 Public Companies
Revenue, Net Income & Inventory
1 2 3 4 1 2 3 4 1 2 3 4 1 2 3 4 1 2 3 4 1 2 3 4 1 2 3 4 1 2 3 4 1 2 3 4 1 2 3 4 1 2 3 4 1 2 3 4 100 01 02 03 04 05 06 07 08 09 10 11 12
0
10
20
30
40
50
-10
US$ Billions @ fluctuating exchange
Revenue 12 15 17 21 18 16 15 15 14 15 15 16 15 15 16 18 17 18 19 20 19 20 20 23 20 22 25 28 23 25 28 31 26 27 32 30 21 22 25 28 27 31 38 41 35 39 40 47 43Income 0 -0 0 0 0 0 -0 0 -0 -0 -3 -0 0 -3 -0 0 0 0 0 -0 -1 0 1 1 0 1 1 1 1 1 -0 0 0 1 0 -7 -1 0 1 1 1 1 1 1 1 1 1 1
Inventory 7 9 11 12 13 11 10 9 8 7 7 6 6 6 7 7 8 8 8 8 8 8 8 9 9 11 12 12 12 12 13 12 11 13 13 10 9 9 9 9 10 11 13 12 13 13 14 14
Benchmark+Pemstar, Celestica, Flextronics+Solectron, Foxconn, Jabil, Plexus, Sanmina-SCI, Sypris, Venture Mfg
+15%
20120226
+23%Q1'12/Q1'11
Guidance
Most of growth due to Foxconn

Large EMS Providers Composite of 8 Public Companies
Quarterly Revenue Growth
1 2 3 4 1 2 3 4 1 2 3 4 1 2 3 4 1 2 3 4 1 2 3 4 1 2 3 4 1 2 3 4 1 2 3 4 1 2 3 4 1 2 3 401 02 03 04 05 06 07 08 09 10 11
0.0
20.0
40.0
60.0
-20.0
-40.0
Benchmark+Pemstar, Celestica, Flextronics+Solectron, Jabil, Plexus, Sanmina-SCI, Sypris,Venture Mfg
20120226
Excludes Foxconn

Large Taiwan ODM Providers 2011 vs. 2010 Sales ($M)
2010 2011 Growth %Foxconn (Hon Hai) 78,705 94,361 20%Quanta Computer 36,184 36,084 0%Compal Electronics 28,734 22,099 -23%Wistron 18,573 19,937 7%Chimei Innolux 17,986 16,516 -8%Inventec 11,887 11,515 -3%Asustek Computer 10,086 10,809 7%Lite On Technology 3,480 3,219 -8%Mitac International 1,689 1,144 - 32%Inventec Appliance 1,490 842 - 44%Total 208,813 216,526 + 4%
Source: Company data, NT$ converted at constant avg 2011 exchange (29.39 NT$ = 1US$)
2011/2010
20120112

Taiwan ODM CompaniesComposite Sales of 10 Large Manufacturers
Company Financial Releases
13579111357911135791113579111357911135791113579111357911135791113579111357911135791113579111357911198 99 00 01 02 03 04 05 06 07 08 09 10 11 12
CALENDAR YEAR
050
100150200250300350400450500550600650700
NT$ (Billions)
Asustek Computer, Chei Mei, Compal Electronics, Foxconn, Chimei Innolux , Inventec, Inventec Appliance, Lite On Technology, Mitac International, Quanta Computer, Wistron, Chei Mei Display replacing Chei Mei & Innolux Display 3/10 & later
20120212
2010/2009+34%

Large ODM Companies Composite of 10 Public Manufacturers
Quarterly Revenue Growth
1 2 3 4 1 2 3 4 1 2 3 4 1 2 3 4 1 2 3 4 1 2 3 4 1 2 3 4 1 2 3 4 1 2 3 4 1 2 3 4 1 2 3 4 1 2 3 4 1 2 3 499 00 01 02 03 04 05 06 07 08 09 10 11
0
20
40
60
80
-20
20120113
Asustek Computer, Compal Electronics, Foxconn, Chimei Innolux, Inventec, Inventec Appliance, LiteOn Technology, Mitac International, Quanta Computer, Wistron
Foxconn major cause of growth

PCB Fabrication
20050118
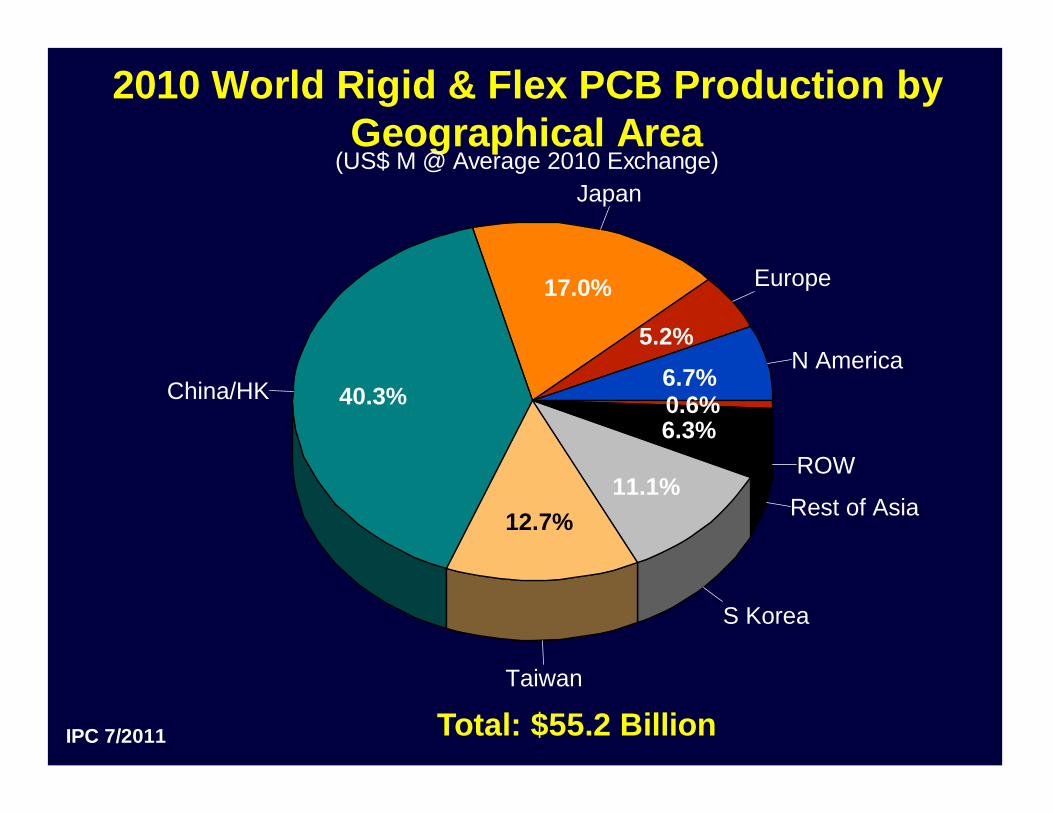
2010 World Rigid & Flex PCB Production by Geographical Area
IPC 7/2011
N America
Europe
Japan
China/HK
Taiwan
S Korea
Rest of Asia
ROW
6.7%5.2%
17.0%
40.3%
12.7%11.1%
6.3%0.6%
Total: $55.2 Billion
20110914
(US$ M @ Average 2010 Exchange)

Japan PCB Shipments
1 1 1 1 1 1 1 1 1 1 1 1 1 1 1 1 1 1 1 1 1 1 1 1 1 1 1 1 1 1 182 83 84 85 86 87 88 89 90 91 92 93 94 95 96 97 98 99 00 01 02 03 04 05 06 07 08 09 10 11 12
CALENDAR YEAR
0
20
40
60
80
100Yen (billion)
www.jpca.org/kikaitoukei/kikai2011.xls
20120227
2010/2009+16%

Taiwan Shipments42 Rigid PCB & 8 Laminate Manufacturers
Company Financial Releases
13579111357911135791113579111357911135791113579111357911135791113579111357911101 02 03 04 05 06 07 08 09 10 11 12
CALENDAR YEAR
7
10
13
16
19
22
25
28
31
34PCB - NT$ (billions)
0
500
1000
1500
2000
2500
3000
3500Laminate - NT$ (millions)
PCB Laminate
20120212

2010 European PCB Companies
M Gasch 6/2011
20100711
Rank Maker Rank Maker1 Wurth 26 Greule2 AT&S 27 Cistel-Laier3 Schweizer Electronic 28 Optiprint4 Multek 29 LPP Pfullingen5 KSG 30 Rohde & Schwarz6 Ruwel Int. 31 Precoplat7 Elvia Group 32 Technoflex8 Mektec Europe 33 ACB9 Cire Group 34 Eltos10 PPC 35 Freudenberg Mechatronic11 Somacis 36 Europrint Eger12 Schoeller 37 Ilfa13 GS Swiss PCB 38 Exception14 Dyconex 39 Ramaer15 Cicor Group 40 Cofidur-Tecchi16 Invotec 41 Graphic17 Hausermann 42 Elekonta Marek18 Flacon Group 43 Cimulec19 Varioprint 44 TW Elektronek20 Polytron Print 45 Jenaer Lp21 Schaltungsdruck Storz 46 Fela22 Elco 47 Pri Dana23 hmp 48 ggp Peters24 Aspocomp 49 Cebisa25 OMR 50 Cipsa
Total 1,957 Million Euros (production in Europe only)
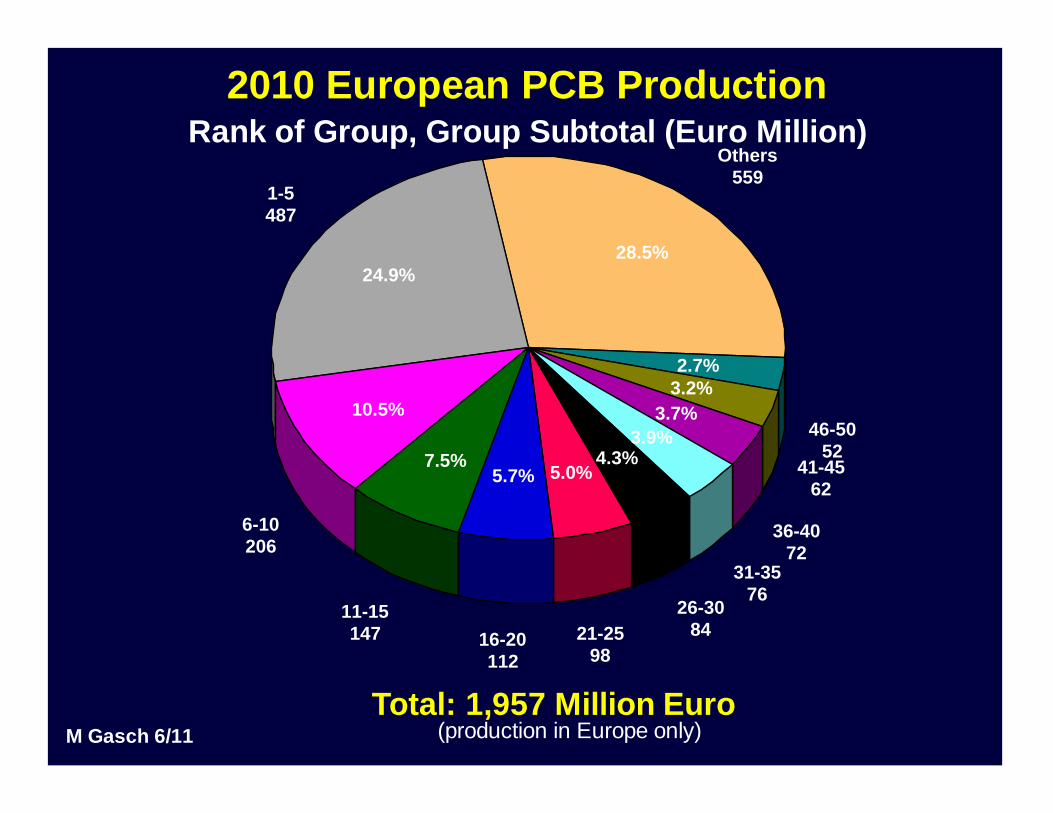
2010 European PCB Production
M Gasch 6/11
1-5487
6-10206
11-15147 16-20
11221-25
98
26-3084
31-3576
36-4072
41-4562
46-5052
Others559
24.9%
10.5%
7.5%5.7% 5.0%
4.3%3.9%
3.7%3.2%2.7%
28.5%
Total: 1,957 Million Euro
20110711
Rank of Group, Group Subtotal (Euro Million)
(production in Europe only)

European PCB Monthly Shipments
1357911135791113579111357911135791113579111357911135791113579111357911135791113579111357911199 00 01 02 03 04 05 06 07 08 09 10 11 12
CALENDAR YEAR
0
100
200
300
400
500
600Euros (fluctuating exchange)
Source: Custer Consulting Group estimate based upon industry data
20120118

N AMERICAN PCB GROWTH INDICATORS% GROWTH - Jan 2012 vs Jan 2011
RIGID PCB $ SHIPMENTSDown 3.1%
RIGID PCB $ BOOKINGSUp 10.9%
RIGID PCB BOOK/BILL RATIO3-MONTH AVG 1.01
1-MONTH 1.07FLEX CIRCUIT $ SHIPMENTS
Down 7.9%FLEX CIRCUIT $ BOOKINGS
Down 29.4%FLEX CIRCUIT BOOK/BILL RATIO
3-MONTH AVG 1.05 1-MONTH 1.09
20120301

N American Rigid PCB Shipments & Orders
IPC
1 2 3 4 5 6 7 8 91011121 2 3 4 5 6 7 8 91011121 2 3 4 5 6 7 8 91011121 2 3 4 5 6 7 8 9101112108 09 10 11 12
CALENDAR YEAR
0
50
100
150
200$M (statistical sample of about 50% of producers)
OrdersShipments
20120301
2011/2010 Rigid PCB Shipment Growth:
-2.3%
Note: IPC survey captures "market" not domestic production. About 15% of the above represents imported boards resold by N American PCB producers in survey.

U.S. Electronic Equipment vs Rigid PCBs$ Order Growth
IPC & U.S. Dept of Census
147101471014710147101471014710147101471014710147101471014710147101471014710147101471014710194 95 96 97 98 99 00 01 02 03 04 05 06 07 08 09 10 11 12
0.30.40.50.60.70.80.9
11.11.21.31.41.51.6
3/12 RATE OF CHANGE
EQUIPMENT
PCB
20120301
Inventory builds and excess orders
Inventory/order corrections

Materials&
Process Equipment
20050118

Copper, High Grade (HG, Comex)
http://futures.tradingcharts.com/chart/CP/B9
j 4 7101 4 7 101 4 7 101 4 7 101 4 7 101 4 7101 4 7101 4 7 101 4 7 101 4 7 101 4 7 101 4 7 10100 01 02 03 04 05 06 07 08 09 10 11 12
$0.50
$1.00
$1.50
$2.00
$2.50
$3.00
$3.50
$4.00
$4.50
$5.00

Material Suppliers (excluding laminate)Composite of 13 Companies
1 2 3 4 1 2 3 4 1 2 3 4 1 2 3 4 1 2 3 4 1 2 3 4 1 2 3 4 1 2 3 4 1 2 3 403 04 05 06 07 08 09 10 11
CY
0
500
1000
1500
2000
2500
3000
3500Thousands
Revenue 153915431617168818991905199320571900190022162139197721972043202921652408239324712699292426431940147118061922193620872348229422852481271225992315
+1%
Momentive, OM Group, Taiwan Glass, Baotech, Glotech, Shenmao, Wahlee,Topoint, Cabot Micro, Chemtura, Cookson Elec, Eternal Chemical , Hexcel, Chang Wah
20120213
NT$ & GBP converted to US$ at fluctuating exchange
4Q'11 estimate based upon partial data

Rigid & Flex Laminate SuppliersComposite of 11 Companies
1 2 3 4 1 2 3 4 1 2 3 4 1 2 3 4 1 2 3 4 1 2 3 4 1 2 3 4 1 2 3 4 1 2 3 4 1 2 3 402 03 04 05 06 07 08 09 10 11
CY
0
100
200
300
400$ Millions
Revenue 153 160 162 156 160 165 185 235 246 276 268 257 259 267 284 318 314 333 375 365 316 320 368 326 303 305 323 222 192 222 258 246 286 335 333 302 370 356 371 315
+4%
Arisawa, Elite Materials, Hwa Woei, Iteq, Microcosm,Park Electrochemical, Rogers, Shinemore, Taiflex, Top Union, Uniplus
NT$ converted at fluctuating exchange
20120208
4Q'11 estimate based upon partial data

Process Equipment Related SuppliersComposite of 8 Companies
1 2 3 4 1 2 3 4 1 2 3 4 1 2 3 4 1 2 3 4 1 2 3 4 1 2 3 4 1 2 3 4 1 2 3 4 1 2 3 402 03 04 05 06 07 08 09 10 11
CY
0
200
400
600
800
1000$ Millions
Revenue 401 409 440 410 416 406 436 468 552 607 648 588 580 564 619 588 658 673 708 650 656 682 767 713 743 743 710 600 492 514 549 589 721 795 838 811 877 940 937 798
-2%
C-Sun,Tailing Technology, Camtek, ESI, GSI Group, Orbotech,Nordson, Coherent
20120226
PCBFlat Panel DisplaysTouch ScreensPhotovoltaic
4Q'11 estimate based upon partial data

World PCB Model
20050118

2011 World Rigid & Flex PCB Production by Geographical Area
Henderson Ventures 10/11
N America
Europe
Japan
China/HK
Taiwan
S Korea
Rest of Asia
ROW
6.5%5.3%
14.1%
42.3%
13.1%11.7%
6.5%0.6%
Total: $55.7 Billion
20111006
(US$ M @ Average 2010 Exchange)

Regional PCB Shipment Growth
1 4 7 10 1 4 7 10 1 4 7 10 1 4 7 10 1 4 7 101 4 7 101 4 7 101 4 7 101 4 7 10 1 4 7 10 1 4 7 10 1 4 7 10 100 01 02 03 04 05 06 07 08 09 10 11 12
CALENDAR YEAR
0.40.50.60.70.80.9
11.11.21.31.41.51.61.71.81.9
3/12 rate of growth in local currency
Taiwan/ChinaEuropeJapanN America0 Growth
20120227
Sources: IPC, JPCA, Taiwan/China composite; modified SIA chip shipments to approximate Europe

World PCB Monthly ShipmentsConverted @ Constant 2010 Exchange Rates
1357911135791113579111357911135791113579111357911135791113579111357911135791113579111357911199 00 01 02 03 04 05 06 07 08 09 10 11 12
CALENDAR YEAR
0
1
2
3
4Thousands
N America Europe Japan ROA
Source: Custer Consulting Group
20120227

World PCB Shipments (with forecast)Converted @ Constant 2010 Exchange Rates
1 3 5 7 9111 3 5 7 9111 3 5 7 9111 3 5 7 9111 3 5 7 9111 3 5 7 9111 3 5 7 9111 3 5 7 9111 3 5 7 9111 3 5 7 9111 3 5 7 9111 3 5 7 9111 3 5 7 9111 3 5 7 911199 00 01 02 03 04 05 06 07 08 09 10 11 12 13
CALENDAR YEAR
20
30
40
50
60$ Billion
Source: Custer Consulting Group - 2010 base year expanded by monthly growth of N. American, European, Japanese & Taiwan/China monthly PCB shipments
20120227
51.742.937.631.729.4
Growth calculations:Europe = composite European SIA & local PCB assoc dataJapan & N. America from JPCA & IPC dataTaiwan/China:46 rigid & flex company compositeRest of Asia growth = Taiwan/China 44 company composite
38.6 31.231.6 54.3 53.2 45.9 54.5
-14%+19%
53.9
-1%
+2%
54.8

World Global PMI, Electronic Equipment, PCB & Semiconductor Shipments
3 6 9123 6 9123 6 9123 6 9123 6 9123 6 9123 6 9123 6 9123 6 9123 6 9123 6 9123 6 912300 01 02 03 04 05 06 07 08 09 10 11 12
CALENDAR YEAR
0.5
0.7
0.9
1.1
1.3
1.5
3/12 rate of change
PCB "0" Growth SIAEl Equip Global PMI
Source: Custer Consulting Group
20120301

Final CommentsGrowth slowed in late 2011
USA & SE Asia are now in early recovery. Europe and Japan have unique challenges and are lagging.
Timely global data sources are available.
Early 2012 will be difficult, but good opportunties will still exist.
Focus on the high growth markets and customers.
Watch the leading indicators.
2012 is the year to take market share from your competitors!
2005011820110622