Embed Size (px)
Citation preview

Global Ecology and Conservation 17 (2019) e00554
Contents lists available at ScienceDirect
Global Ecology and Conservation
journal homepage: http: / /www.elsevier .com/locate/gecco
Original Research Article
Integrating habitat and partial survey data to estimate theregional population of a globally declining seabird species,the sooty shearwater
Tyler J. Clark a, *, 1, Jason Matthiopoulos a, Anne-Sophie Bonnet-Lebrun b, c,Letizia Campioni d, Paulo Catry d, Ilaria Marengo e, Sally Poncet f,Ewan Wakefield a
a Institute of Biodiversity, Animal Health and Comparative Medicine, University of Glasgow, Glasgow, G12 8QQ, UKb Department of Zoology, University of Cambridge, Cambridge, CB2 3EJ, UKc Centre d’Ecologie Fonctionnelle et Evolutive CEFE UMR 5175, CNRS - Universit�e de Montpellier - Universit�e Paul-Val�ery Montpellier eEPHE, Franced MARE e Marine and Environmental Sciences Centre, ISPA - Instituto Universit�ario, 1149-041, Lisboa, Portugale SAERI - South Atlantic Environmental Research Institute, Stanley, Falkland Islands, FIQQ 1ZZ, UKf The Antarctic Research Trust, Stanley, Falkland Islands, FIQQ 1ZZ, UK
a r t i c l e i n f o
Article history:Received 21 November 2018Accepted 3 February 2019
Keywords:Ardenna griseaBurrowing petrelsHabitat preferencePuffinus griseusResource selection functionSpecies distribution model
* Corresponding author.E-mail address: [email protected] (T.J.
1 Current address: Wildlife Biology Program, DepUniversity of Montana, Missoula, Montana 59812, U
https://doi.org/10.1016/j.gecco.2019.e005542351-9894/© 2019 The Authors. Published by Elsevie0/).
a b s t r a c t
Many animal populations are thought to be in flux due to anthropogenic impacts. How-ever, censusing organisms to understand such changes is often impractical. For example,while it is thought that over half of pelagic seabird populations are declining, most breedin burrows or on cliffs, in large, remote colonies, making them difficult to count. Burrow-nesting sooty shearwaters (Ardenna grisea) are abundant but declining in their core (SouthPacific) breeding range, potentially due to introduced rodents and habitat loss. In contrast,Kidney Island, their largest colony in the Falkland Islands (Southwest Atlantic), purportedlygrew by several orders of magnitude since the mid-1900s. This island is rodent-free, andnative tussac grass (Poa flabellata) has increased following cessation of historical exploi-tation. To estimate the sooty shearwater population in the Falkland Islands, and its rela-tionship with breeding habitat availability, we sampled burrow density and occupancy onKidney Island and modeled these as functions of habitat. Both indices responded positivelyto a proxy for historical increases in tussac cover. We estimate that breeding sootyshearwaters occupy ~140,000 (95% CI: 90,000e210,000) burrows on Kidney Island.Moreover, using additional survey data and Generalized Functional Response models toaccount for intra-island variation in habitat availability, we estimate that 25,000 (95% CI:20,100 - 30,500) burrows could be occupied on nearby islands from which non-nativerodents have been recently eradicated. Our study shows that habitat selection functions,generalized where necessary, not only improve population estimates but provide biolog-ical insights needed to reverse declines in seabirds and other species.© 2019 The Authors. Published by Elsevier B.V. This is an open access article under the CC
BY license (http://creativecommons.org/licenses/by/4.0/).
Clark).artment of Ecosystem and Conservation Sciences, W.A. Franke College of Forestry and Conservation,SA.
r B.V. This is an open access article under the CC BY license (http://creativecommons.org/licenses/by/4.

T.J. Clark et al. / Global Ecology and Conservation 17 (2019) e005542
1. Introduction
Many animal populations are thought to be in decline due to human activities (Halpern et al., 2008) while others aregrowing following the alleviation of historical impacts (Buxton et al., 2014). As a result, the structure, function, and resilienceof ecosystems are changing rapidly, sometimes in unexpected ways (Baum and Worm, 2009; Estes et al., 2011). In order todetect, monitor, and understand these changes for conservation, accurate and precise population estimates are required.However, it may not be practicable to count organisms directly, either because they are difficult to observe, too numerous, ortoo widely dispersed. It is common practice therefore to estimate population size based on assumptions about the rela-tionship between species and habitat (Boyce and McDonald, 1999). Simple “design-based” estimation assumes that popu-lation size can be estimated by multiplying the density in a subset of randomly placed sample plots by the area occupied. Thelatter is often defined based on assumptions about what constitutes suitable habitat. However, if these assumptions arewrong the resulting population estimate will be biased. In contrast, by modeling dependencies of population size on resourceor habitat availability, for example using habitat selection functions (HSFs), more accurate “model-based” estimates can bemade (e.g., Scott et al., 2009). This approach has the additional advantage that important insights can be gained into thefactors that drive and potentially limit population size (e.g., Ali et al., 2017). However HSFs fitted to data from one area maypredict poorly in other areas if these have different habitat availability regimes (Mysterud and Ims, 1998). GeneralizedFunctional Response models (GFRs), which account for differences in animals’ responses to changes in habitat availability, canbe used to overcome this (Matthiopoulos et al., 2011) but GFRs have not yet been applied widely to the problem of populationsize estimation.
Pelagic seabirds are an important exemplar of these issues. Over half of their species are thought to be declining due toanthropogenic impacts, including introduced predators, fisheries by-catch, habitat loss, and climate change (Croxall et al.,2012; Phillips et al., 2016). Conversely, a few of their populations are increasing, in response either to conservation in-terventions or natural processes (Buxton et al., 2014). However, relatively few of the world's pelagic seabird populations aremonitored (Croxall et al., 2012), making it difficult to assess these changes or their causes properly. This is partly becauseseabirds are relatively hard to survey: At sea, they typically range 1000's to 10,000's of km, making it largely impracticable touse at-sea surveys to estimate population sizes accurately. It is more practicable to survey breeding colonies, but these areoften very large (up to 106 pairs) and located on remote islands or coastlines. Moreover, within colonies, seabirds often nest oncliffs or in burrows, which they enter or leave only at night (Warham, 1990; Brooke, 2004; Croxall et al., 2012).
Sooty shearwaters (Ardenna grisea) are medium-sized burrowing petrels that breed colonially on temperate coasts of theSouth Pacific and Southwest Atlantic, digging deep and sometimes complex burrows up to 3m long (Hamilton, 1998; Clarket al., 2018). Although sooty shearwaters are highly abundant (global population ~20 million individuals; Brooke, 2004), theyare declining, both at colonies in their core breeding range around New Zealand, in the South Pacific, and in the winteringareas used by birds from this population (Scott et al., 2008; Moller et al., 2009; Waugh et al., 2013). The IUCN classifies sootyshearwaters as “near-threatened” but others have argued that they should be up-listed to “vulnerable” due to the severity ofthese declines (Scott et al., 2008). These declines have variously been attributed to: Predation by introduced species e
principally rodents (Newman et al., 2008, 2010); breeding habitat loss (Jones, 2000; McKechnie et al., 2008); direct harvest(Lyver, 2000; Newman et al., 2010); incidental by-catch (Uhlmann, 2003); and climatic change (e.g., in wind currents and seasurface temperatures; Shaffer et al., 2006).
Contrary to the global trend, sooty shearwaters are thought to be increasing in one area - the Falkland Islands, in theSouthwest Atlantic (Otley et al., 2008). Kidney Island (Fig. 1) is by far the largest known colony of the species in the Falklandsarchipelago (Woods and Woods, 2006). Although it has never been systematically surveyed, periodic subjective estimatessuggest that it has grown by two orders of magnitude, from ~2,000 to ~100,000 breeding pairs since the 1950's (Woods 1988;Woods andWoods, 1996; 2006). It has been hypothesized that this is due to an increase in tussac grass (Poa flabellata), whichprovides the species' principle burrowing habitat in the Falkland Islands. Historically, tussac was harvested for animal fodder(Falklands Conservation, 2006). Tussac cover was also reduced by intentional or accidental fires but these impacts ceased onKidney Island in the 1950's (Carstairs, 1996). Rodents have never occurred on Kidney Island but invasive, non-native pop-ulations occur on many of the other Falkland Islands, including small tussac-covered offshore islands, which therefore havelow numbers of burrowing seabirds (Hall et al., 2002; Poncet et al., 2011). In order to restore native bird populations, rodentshave recently been eradicated from two tussac islands (Top and Bottom) adjacent to Kidney Island and these are now thoughtto hold small but growing breeding populations of sooty shearwaters (Poncet et al., 2012). Sooty shearwaters are also thoughtto breed on at least 21 other islands in the archipelago (Fig. 1, Table 1).
Design-based colony surveys of burrowing seabirds (e.g., Olivier andWotherspoon, 2006; Scott et al., 2009; Pearson et al.,2013) most commonly involve counting burrows in survey plots, calculating the mean density, and then multiplying this bythe total area of available breeding habitat (Rayner et al., 2007a; Sutherland and Dann, 2012). However, breeding habitatselection by seabirds is poorly understood making the delimitation of available habitat prone to bias (Bried and Jouventin,2002). For example, particular types of vegetation cover may facilitate burrow excavation, while steep slopes, facing pre-vailing winds, might be needed for shearwaters to take off effectively (Scott et al., 2009). However, many crowded butapparently stable seabird colonies are surrounded by unused yet seemingly high quality nesting habitat (Warham,1990). Thisindicates either that habitat availability is not limiting or that assumptions regarding habitat selection and suitability arewrong. For example, most seabirds are highly colonial and therefore presumably prefer to nest near conspecifics, perhaps tothe extent that otherwise suitable habitat distant from settled areas remain unoccupied (Warham, 1996). Unless modeled

Fig. 1. Distribution of known or suspected sooty shearwater breeding sites in the Falkland Islands. Breeding is either considered confirmed due to presence of eggsor chicks, likely due to presence of burrows (but eggs and chicks have not been seen), or possible due to other evidence (see Table 1 for details).
T.J. Clark et al. / Global Ecology and Conservation 17 (2019) e00554 3
explicitly, this tendency for nesting seabirds to cluster could manifest in unexplained spatial autocorrelation, which in turnwould result in an overestimate of accuracy (Olivier and Wotherspoon, 2006). Surveying burrow-nesting seabirds is furthercomplicated because not all burrowsmay be occupied so occupancy as well as burrow density must be assessed (Rayner et al.,2007a; Parker and Rexer-Huber, 2015). In a growing colony, new burrowsmay be constructed at themargins in poorer habitat.As such, the dependence of burrow density on habitat may be weaker than the dependence of burrow occupancy on habitat.
We aimed to: (1) quantify how sooty shearwater burrow density and occupancy vary with habitat, including current tussaccover and recent change in tussac cover, on Kidney Island and (2) using these relationships, estimate the size of the breedingpopulation on Kidney Island and onwhat are currently believed to be the other main breeding islands in the Falklands. To doso, we surveyed sooty shearwater burrow density and occupancy on Kidney Island, compiled similar data from previoussurveys of other islands, and modeled density and occupancy as functions of habitat using HSFs and GFR models.
2. Materials & methods
2.1. Data collection, Kidney Island
We surveyed sooty shearwater burrows on Kidney Island (area¼ 0.32 km2; Fig. 2) from January 7 to 21, 2017. Followingprevious surveys of burrowing petrels on islands dominated by tussac grass (Catry et al., 2003; Lawton et al., 2006), werandomly projected a 50� 75m grid onto the vegetated area of the island (Fig. 2). At each grid node (n¼ 66), we counted thenumber of burrows in a circular plot of radius 2.5m (planar area¼ 19.64m2). We ignored burrows shorter than a forearm'slength, as these are unlikely to be viable (Scott et al., 2008). White-chinned petrels (Procellaria aequinoctialis) and Magellanicpenguins (Spheniscus magellanicus) also construct small numbers of burrows on Kidney Island (Woods, 1970) but these arewider and shallower than sooty shearwater burrows, making them easy to exclude (Parker and Rexer-Huber, 2015).
At each plot, we also recorded the following habitat indices: Aspect, soil moisture, mean tussac height, percent tussaccover, presence of bare rock, and presence of other animal species (Table A1). We hypothesized that these indices mightinfluence burrow density or occupancy by affecting (1) shearwaters’ ability to take off from the colony (e.g., distance to coast)(2) their ability to excavate burrows (e.g., soil moisture), or by (3) providing shelter from theweather or predators (e.g., tussacgrass cover). Wemeasured aspect using a magnetic compass and average tussac height (to the nearest quarter-meter) using agradated pole. We estimated approximate percent tussac cover by eye and detected the presence of other species eitherdirectly or indirectly (e.g., over-turned or compressed tussac indicated the regular presence of South American sea lions(Otaria flavescens)). We classified soil moisture on an arbitrary four-point scale derived from Lawton et al. (2006): 1 (dry, well-drained), 2 (intermediate), 3 (saturated, moisture comes to the surface when pressed by hand), and 4 (standing water withinthe plot). In addition, we compiled two types of remotely-sensed habitat data for each plot: Firstly, we calculated distance to
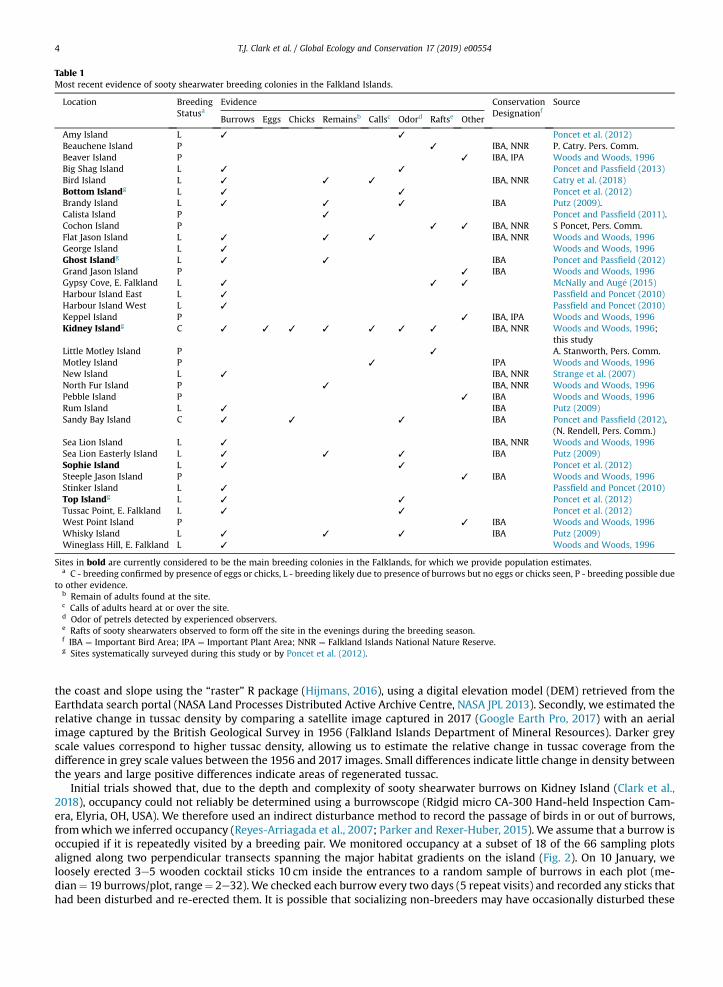
Table 1Most recent evidence of sooty shearwater breeding colonies in the Falkland Islands.
Location BreedingStatusa
Evidence ConservationDesignationf
Source
Burrows Eggs Chicks Remainsb Callsc Odord Raftse Other
Amy Island L ✓ ✓ Poncet et al. (2012)Beauchene Island P ✓ IBA, NNR P. Catry. Pers. Comm.Beaver Island P ✓ IBA, IPA Woods and Woods, 1996Big Shag Island L ✓ ✓ Poncet and Passfield (2013)Bird Island L ✓ ✓ ✓ IBA, NNR Catry et al. (2018)Bottom Islandg L ✓ ✓ Poncet et al. (2012)Brandy Island L ✓ ✓ ✓ IBA Putz (2009).Calista Island P ✓ Poncet and Passfield (2011).Cochon Island P ✓ ✓ IBA, NNR S Poncet, Pers. Comm.Flat Jason Island L ✓ ✓ ✓ IBA, NNR Woods and Woods, 1996George Island L ✓ Woods and Woods, 1996Ghost Islandg L ✓ ✓ IBA Poncet and Passfield (2012)Grand Jason Island P ✓ IBA Woods and Woods, 1996Gypsy Cove, E. Falkland L ✓ ✓ ✓ McNally and Aug�e (2015)Harbour Island East L ✓ Passfield and Poncet (2010)Harbour Island West L ✓ Passfield and Poncet (2010)Keppel Island P ✓ IBA, IPA Woods and Woods, 1996Kidney Islandg C ✓ ✓ ✓ ✓ ✓ ✓ ✓ IBA, NNR Woods and Woods, 1996;
this studyLittle Motley Island P ✓ A. Stanworth, Pers. Comm.Motley Island P ✓ IPA Woods and Woods, 1996New Island L ✓ IBA, NNR Strange et al. (2007)North Fur Island P ✓ IBA, NNR Woods and Woods, 1996Pebble Island P ✓ IBA Woods and Woods, 1996Rum Island L ✓ IBA Putz (2009)Sandy Bay Island C ✓ ✓ ✓ IBA Poncet and Passfield (2012),
(N. Rendell, Pers. Comm.)Sea Lion Island L ✓ IBA, NNR Woods and Woods, 1996Sea Lion Easterly Island L ✓ ✓ ✓ IBA Putz (2009)Sophie Island L ✓ ✓ Poncet et al. (2012)Steeple Jason Island P ✓ IBA Woods and Woods, 1996Stinker Island L ✓ Passfield and Poncet (2010)Top Islandg L ✓ ✓ Poncet et al. (2012)Tussac Point, E. Falkland L ✓ ✓ Poncet et al. (2012)West Point Island P ✓ IBA Woods and Woods, 1996Whisky Island L ✓ ✓ ✓ IBA Putz (2009)Wineglass Hill, E. Falkland L ✓ Woods and Woods, 1996
Sites in bold are currently considered to be the main breeding colonies in the Falklands, for which we provide population estimates.a C - breeding confirmed by presence of eggs or chicks, L - breeding likely due to presence of burrows but no eggs or chicks seen, P - breeding possible due
to other evidence.b Remain of adults found at the site.c Calls of adults heard at or over the site.d Odor of petrels detected by experienced observers.e Rafts of sooty shearwaters observed to form off the site in the evenings during the breeding season.f IBA ¼ Important Bird Area; IPA ¼ Important Plant Area; NNR ¼ Falkland Islands National Nature Reserve.g Sites systematically surveyed during this study or by Poncet et al. (2012).
T.J. Clark et al. / Global Ecology and Conservation 17 (2019) e005544
the coast and slope using the “raster” R package (Hijmans, 2016), using a digital elevation model (DEM) retrieved from theEarthdata search portal (NASA Land Processes Distributed Active Archive Centre, NASA JPL 2013). Secondly, we estimated therelative change in tussac density by comparing a satellite image captured in 2017 (Google Earth Pro, 2017) with an aerialimage captured by the British Geological Survey in 1956 (Falkland Islands Department of Mineral Resources). Darker greyscale values correspond to higher tussac density, allowing us to estimate the relative change in tussac coverage from thedifference in grey scale values between the 1956 and 2017 images. Small differences indicate little change in density betweenthe years and large positive differences indicate areas of regenerated tussac.
Initial trials showed that, due to the depth and complexity of sooty shearwater burrows on Kidney Island (Clark et al.,2018), occupancy could not reliably be determined using a burrowscope (Ridgid micro CA-300 Hand-held Inspection Cam-era, Elyria, OH, USA). We therefore used an indirect disturbance method to record the passage of birds in or out of burrows,fromwhich we inferred occupancy (Reyes-Arriagada et al., 2007; Parker and Rexer-Huber, 2015). We assume that a burrow isoccupied if it is repeatedly visited by a breeding pair. We monitored occupancy at a subset of 18 of the 66 sampling plotsaligned along two perpendicular transects spanning the major habitat gradients on the island (Fig. 2). On 10 January, weloosely erected 3e5 wooden cocktail sticks 10 cm inside the entrances to a random sample of burrows in each plot (me-dian¼ 19 burrows/plot, range¼ 2e32). We checked each burrow every two days (5 repeat visits) and recorded any sticks thathad been disturbed and re-erected them. It is possible that socializing non-breeders may have occasionally disturbed these

Fig. 2. Location of survey plots (black dots) on Kidney Island, Falkland Islands, and perpendicular transects used to establish the subsample of plots for occupancysampling (red lines). (For interpretation of the references to colour in this figure legend, the reader is referred to the Web version of this article.)
T.J. Clark et al. / Global Ecology and Conservation 17 (2019) e00554 5
sticks, leading to inaccurate classification of burrow occupancy (Scott et al., 2009; Parker and Rexer-Huber, 2015). However,we assumed that repeated entrance/exit over 10 days in the chick-rearing period (during which breeders enter their burrowsevery 1e2 nights; Hedd et al., 2014) was indicative of breeding.
2.2. Data from other breeding sites
The known distribution of shearwaters in the Falkland Islands was summarized by Woods and Woods (1996), largelybased on reports received from members of the public. Since then many other breeding locations have been discovered. Wecompiled reports of breeding sites in the archipelago from our own observations, the South Atlantic Environmental ResearchInstitute, Falklands Conservation, the Falkland Islands Government, local observers andWoods andWoods (1996), in order tomap the current known distribution of sooty shearwaters in the Falkland Islands (Fig. 1; Table 1). In order to estimate thenumbers of sooty shearwaters potentially breeding at what are presumed to be the five largest known colonies in theFalklands Islands other than Kidney island (Top, Bottom, Amy, Sophie, and Ghost Islands), we compiled data from previoussurveys (Fig. 1; Table 1). Like Kidney Island, these are small islands, densely covered in tussac grass. However, all hadintroduced rodents that may have suppressed sooty shearwater breeding numbers, until they were eradicated between 2001and 2011. Systematic surveys of sooty shearwater burrows have been carried out at two islands, Top and Bottom (Poncet et al.,2012). Burrow density was surveyed on these islands using strip transects of length 20e100m. Occupancy was confirmed byvisual inspection and audio playback of taped sooty shearwater calls but the rate of occupancy was not estimated (Poncetet al., 2012). No systematic survey data were available for the other islands, so we used a habitat model-based approach toestimate population sizes there (see below).
2.3. Statistical analysis
Unless otherwise stated, we carried out all analysis in R (R Core Team, 2013). To allow effect sizes to be compared on acommon scale, we standardized explanatory covariates prior to model fitting. We modeled burrow density on Kidney Islandas a function of habitat (Model 1; Fig. 3) using generalized linear models (GLMs) with Poisson errors and a log link function.Starting with a model containing all candidate explanatory variables and their biologically plausible interactions (Table A1),we simplified models using backwards selection until we minimized the AIC (Burnham and Anderson, 2003). We assumedthat conspecific attraction would manifest as spatial autocorrelation. To model this, we also considered a “neighborhood”auto-covariate (Augustin et al., 1996), calculated for each plot by averaging burrow density in the four nearest plots. To test forresidual spatial autocorrelation, we calculated Moran's I at 80m, the average distance between plots. For consistency withinformation-based model selection, we quote mean effect sizes and their 85% confidence intervals (Arnold, 2010).
We modeled occupancy as a function of habitat and burrow density (Fig. 3) using a hierarchical Bayesian model fitted inJAGS, via R (Plummer, 2016). To account for the fact that occupancy detection via the disturbance method was imperfect, wemodeled the probability both of correctly and incorrectly detecting occupancy at each burrow (see Supplementary Materialsfor details; Fig. 3). We built a minimum adequate model (Model II) using forwards stepwise model selection by adding

Fig. 3. Relationships between models used to estimate population size in this study. Models I and II predict, respectively, burrow density and occupancy onKidney Island as functions of habitat. Detection uncertainty is defined in Model II by: p, the probability of correctly detecting burrow occupancy; q, the probabilityof correctly detecting burrow vacancy; 1-q, the probability of recording a burrow as occupied when it is not; and 1-p, the probability of recording a burrow asvacant when it is occupied. Models III and IV predict burrow density as functions of habitat in what are currently believed to be the main sooty shearwatercolonies in the Falklands, other than Kidney Island, not all of which have been surveyed. Model III includes Generalized Functional Response terms to account forvariation in habitat selection due to differing habitat availability among islands. Model IV is a conventional Habitat Selection Function.
T.J. Clark et al. / Global Ecology and Conservation 17 (2019) e005546
plausible candidate explanatory variables (Table A1) if they resulted in a reduction in the deviance information criterion (DIC)(Spiegelhalter et al., 2002). To examine the spatial distribution of regions of high burrow density but low occupancy (and viceversa), we standardized gridded burrow occupancy and density, and subtracted the former from the latter.
We estimated the breeding population of sooty shearwaters on Kidney Island, together with its associated uncertainty,using a parametric bootstrapping technique. For each cell on the survey grid, we predicted burrow density and occupancyusing parameter values drawn randomly from the multivariate normal distribution associated with Model I and the posteriordistributions associated with Model II. We then integrated the product of density and occupancy across the survey grid toarrive at an estimate of the number of breeding pairs on the island.We repeated this procedure 1,000 times and calculated themean and its associated 95% confidence intervals. Ideally, occupancy is assessed just after the laying period (11e24 Novemberon Kidney Island; Hedd et al., 2014). Wewere constrained to carry out fieldwork around the beginning of the hatching period(11 January e 1 February), by which time a small but unknown proportion of breeding attempts may have failed. Hence, weregard this as a minimum population estimate.
To predict burrow density on other islands, we fitted a Generalized Functional Response (GFR) habitat selection model(Model III; see Supplementary Materials) to observed burrow densities on Kidney, Top, and Bottom Islands using the Rpackage “HATOPO” (available from JM). GFRs are extensions of traditional HSFs that allow model coefficients to vary withregional habitat availability (Matthiopoulos et al., 2011). We specified Poisson errors with a log-link function, and plot area asan offset. Habitat data for the other islands was limited to DEM-derived covariates (aspect, slope, elevation, and distance tocoast). Additionally, we considered the historical presence (i.e., prior to 2009) of introduced rodents as a categoricalexplanatory covariate. The starting model of burrow density contained all candidate explanatory variables, their biologicallyplausible interactions, and their second-order regional expectations (Matthiopoulos et al., 2011), where regionwas defined asan island. We reduced this model by backwards selection until we reached the lowest AIC (Burnham and Anderson, 2003).After model selection, we modeled conspecific attraction as described above, with the exception that burrow density wasaveraged across the nearest 2 transects andMoran's I was calculated at 72m, the average distance between transects. We alsofitted a conventional HSF model (Model IV), which was equal to Model III, minus the GFR terms, and tested whether thispredicted density as well as the more complex GFR model (Model III).
To estimate the number of occupied burrows on both the surveyed islands (Kidney, Top and Bottom) and those with nosystematic survey data (Ghost and Amy) we first predicted burrow density on grids coving these island using both Models IIIand IV (i.e., using HSF and GFR models). We then multiplied these grids by the mean occupancy rate on Kidney Island pre-dicted by Model II (no other data were available for the other islands) and integrated across each. For comparison, we alsocalculated design-based estimates of the number of burrows on Kidney, Top and Bottom Islands by multiplying the meanobserved density on each island by the extent of their vegetated areas (Rayner et al., 2007a). We converted these to estimatesof the number of occupied burrows by multiplying by the mean observed occupancy rate on Kidney Island.

T.J. Clark et al. / Global Ecology and Conservation 17 (2019) e00554 7
3. Results
3.1. Habitat selection and population size, Kidney Island
Observed mean burrow density on Kidney Island was 0.60 ± 0.06 burrows/m2 (range 0e1.73 burrows/m2, n¼ 66). Theneighborhood covariate improved model fit and removed residual spatial autocorrelation fromModel 1 (Moran's I¼�0.063,p¼ 0.327; AIC¼ 420.9; pseudo R2¼ 70.87% vs. model without this covariate, Moran's I¼ 0.081, p¼ 0.049; AIC¼ 460; pseudoR2¼ 56.47%). Model I suggests a positive relationship between burrow density and slope, elevation, tussac cover, and changein tussac density; and a negative relationship with distance from the coast (Table 2). Tussac cover and tussac height interactedsynergistically to result in a decreased burrow density (Table 2; Fig. A1). Aspect and tussac height and interactions betweendistance to coast and elevation, and slope and elevation, were also retained in Model I, but had only slight and non-significanteffects (Table 2). Ranks of Akaikeweights support the relative importance of these terms (Table A2). Predicted burrow densityon Kidney Island averaged 0.588 (95% CRI¼ 0.466 to 0.709) and was highest in coastal regions, especially at the western endof the island (Fig. 4A).
Model II suggests positive relationships between burrow occupancy on Kidney island and elevation and change in tussacdensity, and a negative relationship with distance to the coast (Table 3). Slope was retained in Model II, but had only a slightand non-significant effect. Burrow density was not retained. Ranks of Akaikeweights support the relative importance of theseterms (Table A3). Predicted burrow occupancy was very high (~100%) in all coastal regions and at the western end of KidneyIsland but almost zero in some inland areas (Fig. 4B). Together, Models I and II predict that 139,674 (95% CI¼ 90,263 to208,121) burrows were occupied on Kidney Island during our study (Fig. 4C). High burrow density but low occupancy waspredicted in western end of the island, especially in steep areas (Fig. 4D). Conversely, low density and high occupancy waspredicted in the northeast and in some coastal regions.
3.2. Population size, other islands
Model III (the GFR model) predicted that Top, Bottom, Amy, Sophie, and Ghost Islands hold 43,087 burrows (95%CI¼ 34,184e51,871; Table 4). Assuming for the sake of expediency that they have the same occupancy rate as Kidney Island,this would equate to 25,335 occupied burrows (95% CI¼ 20,079e30,549). In contrast, Model IV (the conventional HSF model)predicted a total of 264,578 burrows on these islands (95% CI¼ 209,682e319,023), which equates to 155,572 occupiedburrows (95% CI¼ 123,293e187,586). Using Models I and III, we estimated there to be 214,079 sooty shearwater burrows inthe Falklands, occupied by 165,009 breeding pairs (95% CI¼ 110,342e238,669). For comparison, the equivalent design-basedestimate, assuming a mean occupancy rate equal to that observed on Kidney Island, would be ~132,582 breeding pairs (95%CI¼ ~12,189e~188,621). Altogether, our review of available data showed evidence of sooty shearwater presence at 28additional islands in the Falklands archipelago but breeding was either confirmed or probable at only 15 of these (Fig. 1).There were insufficient data to predict population size at these additional unsurveyed islands.
Model III predicted sooty shearwater burrow density on other known breeding islands better than Model IV (likelihoodratio test: c2¼ 99.335, p< 0.0001; AIC¼ 848.2 vs. 1046; pseudo R2¼ 70.0% vs. 54.9%; Fig. A2). Inclusion of the neighborhoodcovariate improved model fit in both models and reduced residual spatial autocorrelation to negligible levels in Model III (forModel III and Model IV with the covariate: Moran's I¼�0.006 and 0.103, p¼ 0.426 and 0.009 vs. Moran's I¼ 0.139 andwithout the covariate: 0.254, p¼ 0.009 and 0.010; AIC¼ 952.1 and 1258).
4. Discussion
Model selection showed that models containing habitat covariates explained burrow density and occupancy better thanthe equivalent intercept-only models. Population sizes predicted using the latter are equivalent to design-based estimates(i.e., mean burrow density x mean occupancy x area). By modeling sooty shearwaters' habitat selection and occupancy, wewere therefore able to estimate the size of their colony on Kidney Island in the Falkland Islands with greater accuracy thanwould have been possible using the conventional design-based estimation techniques. The width of the 95% CI for the habitat
Table 2Standardized parameters estimated byModel I of sooty shearwater burrow density on Kidney Island as a function of habitat.
Parameter Estimate 85% Confidence Interval
Aspect �0.038 �0.147, 0.071Distance to coast �0.261 �0.442, �0.081Elevation 0.192 0.016, 0.369Slope 0.260 0.091, 0.429Distance x Elevation 0.001 �0.183, 0.186Slope x Elevation 0.059 �0.111, 0.229Change in tussac density 0.121 �0.003, 0.246Tussac cover 0.148 0.014, 0.282Tussac height 0.009 �0.119, 0.138Tussac cover x Tussac height �0.115 �0.214, �0.016

Fig. 4. Predicted distribution of breeding sooty shearwaters on Kidney Island, showing, (a) burrow density; (b) burrow occupancy; (c) occupied burrow density;and (d) the relative difference between burrow density and occupancy. Positive differences indicate areas of high burrow density and low occupancy, whereasnegative differences indicate areas of low burrow density and high occupancy.
Table 3Standardized parameters estimated byModel II of sooty shearwater burrow occupancy on Kidney Island as a function ofhabitat.
Parameter Estimate 85% Confidence Interval
Slope �0.823 �1.640, 0.079Distance to coast �5.041 �7.697, �2.245Elevation 2.102 0.589, 3.492Change in tussac density 1.031 0.268, 1.773
Table 4Estimated sizes of sooty shearwater breeding populations at what are currently though to be the main colonies in the Falkland Islands.
Island Burrows Occupied burrows
Design-baseda Model I or III Design-basedb Model I or III Model IV
Kidney 152,760 170,992 115,792 139,674 e
Top 17,400 20,720 13,189 12,183 4,314Bottom 3,750 10,765 2,843 6,330 135,641Amy <800c 10,147 <606 5,966 53,049Sophie <200c 166 <152 98 13,102Ghost NA 1289 NA 758 58,472Total 174,910 214,079 132,582 165,009 e
a Mean observed burrow density x extent of the vegetated area.b Mean observed burrow density x extent of the vegetated area x mean occupancy.c Estimated by Poncet et al. (2012).
T.J. Clark et al. / Global Ecology and Conservation 17 (2019) e005548
model-based estimate was 117,858 occupied burrows, whereas that for the intercept-only model-based estimate would havebeen 176,491 occupied burrows. We therefore conclude that habitat model-based estimates of population size are moreaccurate than design-based estimates. Our results confirm that this colony is nowat least two orders of magnitude larger thanit was in the 1950s. Both burrow density and occupancy were positively dependent on the estimated change in tussac densitybetween 1956 and 2017. That is, colony growth has occurred in areas where tussac has regenerated following the cessation ofharvesting. This indicates that breeding habitat restorationmay help to reverse population declines in the Falklands and otherparts of the species’ breeding range. We also modeled survey data from three other colonies using Generalized FunctionalResponse (GFR) models. Although the efficacy of this method was limited by scant survey data currently available for sootyshearwaters in the Falklands, it allowed us to provide first population estimates for these and several other poorly studiedcolonies in the region.

T.J. Clark et al. / Global Ecology and Conservation 17 (2019) e00554 9
4.1. Habitat selection, Kidney Island
We found that topography on Kidney Island had a large effect on burrow density and occupancy. It has been suggested thatsooty shearwaters breed in areas with high slopes and elevations because these provide better drainage, reducing the risk offlooding or collapse of burrows (Stokes and Boersma, 1991; Rayner et al., 2007a), and large scale geo-morphological features(e.g., cliffs, high points on islands) might serve as aids in nest location (Brandt et al., 1995; Scott et al., 2009). Furthermore,nesting on higher slopes may allow easier takeoff because wind speeds tend to be higher in such areas (Warham, 1990; Scottet al., 2009; Whitehead et al., 2014). This may be particularly important to sooty shearwaters, as they have one of the highestwing loadings of the Procellariidae family (Warham, 1977). Burrow density and occupancy was negatively related to distanceto the coast, possibly because there are more obstacles (e.g., dense tussac) to navigate through prior to take-off as distance tothe coast increases (Oka et al., 1996; Charleton et al., 2009). We noted that sometimes, when birds failed to take off properlywhen leaving the colony, they would walk to the water's edge, swim out some distance, and then take off from the sea.Nesting close to the coast may therefore reduce the cost of failed take-offs.
Other covariates that affected burrow density and occupancy on Kidney Island included tussac cover, tussac height, andchange in tussac density. Vegetation has been found to influence the density of burrows of Cook's petrels (Pterodroma cookii)(Rayner et al., 2007a) and spectacled petrels (Procellaria conspicillata) (Ryan et al., 2006). Denser tussac cover may improvehabitat quality for breeding sooty shearwaters by offering protection from climatic extremes or by leading to the developmentof more favorable substrate for excavation (Stokes and Boersma, 1991; Scott et al., 2009; Clark et al., 2018). The interactionterm between tussac cover and height suggests that when tussac is short, burrow density increases with the proportion ofground covered with tussac (Fig. A1), possibly because greater tussac cover provides better nest protection in those condi-tions. Conversely, when tussac is tall, burrow density decreases with the proportion of ground covered with tussac (Fig. A1).This is perhaps because the advantages of nest protection are eventually outweighed by the barrier that vegetation causes totakeoff or because denser vegetation makes it harder for shearwaters to find their burrows when returning from foragingtrips. We assume that the positive relationship between burrow density (and occupancy) and the difference in aerial imagegrey scale between 1956 and 2017 occurs because this is a proxy for areas of tussac regeneration.
The performance of Model I improved and residual spatial autocorrelation decreased with the addition of the neigh-borhood covariate, which represented conspecific attraction between shearwaters. It is possible that residual spatial auto-correlation was present in Model I prior to the addition of this covariate because an important habitat covariate was missing.However, we considered all covariates suggested by the literature. We conclude therefore that inclusion of the neighborhoodcovariate supports the hypothesis that recruiting sooty shearwaters trade off the costs of nesting in potentially suboptimalhabitat at the margins of colonies against the benefits of colonial breeding. In such situations, design-based survey methodswill tend to overestimate population size because it will be assumed that all suitable habitat is occupied.
We found that burrow occupancy on Kidney Island averaged 0.588, which is within the range observed at other breedingsites (0.23e0.74) (Warham and Wilson, 1982; Jones et al., 2003). The probability of correctly detecting occupancy was 0.934,whereas correctly detecting non-occupancy was 0.697. These figures are similar to those found in studies that used burrow-scopes to estimate occupancy by burrowing petrels (McKechnie et al., 2007; Waugh et al., 2013; Whitehead et al., 2014).Occupancymeasurements can be greatly affected by the time period inwhich the birds are surveyed (Parker and Rexer-Huber,2015). The ideal time to carry out burrowing petrel breeding surveys is early in the breeding season, where few burrows arelikely to be visited by non-breeders and abandonment due to breeding failure is minimal (Schumann et al., 2013; Parker andRexer-Huber, 2015). While we aimed to carry out our survey as early as possible in the breeding season, we were constrainedby tracking work being undertaken at the same time to collect data during the late incubation/early hatching period. It ispossible that some shearwaters had already abandoned breeding attempts by this time, which would result in an under-estimation of the breeding population size (Parker and Rexer-Huber, 2015). On the other hand, socializing non-breedersattend colonies in increasing numbers as the breeding season progresses, possibly resulting in an inflation of our occu-pancy estimates. Future work could refine our population estimate by assessing occupancy early in the breeding season,ideally just after the main laying period (Parker and Rexer-Huber, 2015), which on Kidney Island is the 22nd of November(range¼ 17th e 24th of November; Hedd et al., 2014).
4.2. Population size, Kidney Island
We estimate there to have been 140,000 occupied burrows on Kidney Island during the survey period. This is much higherthan previous population estimates (Table 5), and supports the supposition based on periodic informal estimates that theKidney Island population has grown rapidly since tussac-cutting on the island ceased in the 1950's. Previous estimates of thesize of the Kidney Island populationwere made simply by estimating burrow density in a small area andmultiplying this by arough estimate of the extent of suitable habitat (R.W. Woods, pers. comm.). As discussed above, this may have led to anoverestimate. Nonetheless, the estimates were made by highly competent observers and are probably accurate to an order ofmagnitude. Hence, the Kidney Island colony has grown by at least two orders of magnitude in the past half century, an annualgrowth rate of around 7% (Table 5). This is a rapid but plausible rate, similar to those observed in northern fulmars (Fulmarusglacialus) and northern gannets (Sula bassanus) in the Northeast Atlantic in the 20th century (Nelson,1965; Cramp et al., 1974;Jones, 2002). It is unclear if growth of the Kidney Island colony has been purely due to local production or whether immi-gration has contributed. Natal and adult breeding philopatry are high among Procellariiformes (Warham,1990; Brooke, 2004).

Table 5Estimated numbers of sooty shearwaters breeding on Kidney Island, Falkland Islands and putative annual percent growth rate.
Occupied Burrows Year Reference Annual Growth Ratea
2,000 ~1960 Woods (1970) e
10,000e20,000 1996 Woods and Woods, 1996 11.1e25%100,000 2006 Woods and Woods (2006) 40e90%139,674 2017 This study 3.6%
a Between consecutive estimation periods.
T.J. Clark et al. / Global Ecology and Conservation 17 (2019) e0055410
Nonetheless, immature sooty shearwaters could recruit to Kidney Island from elsewhere. For example, there are thought to beextensive colonies on islands and fjord coastlines of Patagonia and Tierra del Fuego, although little is known about theirpopulation size, trends, or conservation status (Lawton et al., 2006; Reyes-Arriagada et al., 2007). If some fledglings fromthese colonies disperse into the North Atlantic, they would pass the Falklands and might therefore be likely to recruit toKidney Island. A tracking or large-scale mark-recapture study would be required to establish if this were the case.
Single population surveys do not count adults that skip breeding in the survey year (Warham,1990; Newman et al., 2008).It has been estimated that between one-fifth and one-half of breeding petrels miss breeding in any one year (Brooke, 2004).Based on these figures, our figures would equate to a population at Kidney Island of 168,000 to 280,000 breeding pairs ofsooty shearwaters at Kidney Island. Furthermore, we assumed that only one breeding pair occupied a burrow and conse-quently, population size may be underestimated. This is because burrows can be interconnected and shared between con-specifics (Hamilton, 2000). As far as practicable, we modeled detection error caused by false positives (e.g., prospectingbreeders, weather, or vegetation knocking over sticks) and false negatives (e.g., birds escaping via another tunnel, thereby notknocking over sticks). Accounting for this error, as well as spatial variation in occupancy rates, should have improved theaccuracy of our population estimates compared to other studies.
4.3. Population size and distribution, other islands
We estimated that approximately 25,000 burrows are occupied by sooty shearwaters in what current evidence suggestsare the main colonies in the Falkland Islands other than Kidney Island, representing over one-seventh of the total for thearchipelago (Table 4). The number of sites where sooty shearwaters are known or suspected to breed in the Falklands hasincreased from 6 to 21 in the past twenty years. Almost all are located on rodent-free, tussac-covered offshore islands, withmost on the east and south coasts of the Falklands archipelago (Fig. 1; Woods andWoods, 1996). This trend may indicate thatnew breeding sites are being established in the Falklands, perhaps due to the growth evident at Kidney Island. However, thiscould also be an artefact of the increased effort devoted to exploring the avifauna of the Falklands in recent years (Table 1).Some islands not included in our population estimate may hold large numbers of breeding sooty shearwaters. For example,sooty shearwaters are suspected to breed on Cochon Island (0.04 km2), which is only 2.5 km from Kidney Island, but this hasnot been confirmed due to the difficulty of landing there. Similarly, it remains possible that there are substantial sootyshearwater colonies in the archipelago yet to be discovered so we cannot provide an overall population estimate for thearchipelago.
Predictions from Model III (the GFR) to unobserved islands were realistic in some cases but unrealistic in others. This, wesuspect, may result from two separate factors. First, the predictions may be extrapolations not interpolations in environ-mental availability space. To provide better predictions it would have been necessary to sample across the spectrum ofavailability. Predictions for Top, Bottom, and Amy Islands were all higher than survey data suggest, possibly because thesepopulations were more recently established and released from ecological pressures of rodents than on Kidney Island.Recently, Top, Bottom, Ghost, and Amy Island had rodents eliminated and there is evidence of a rapid increase in burrowsalong the coasts of Bottom Island (Poncet et al., 2012). Therefore, predictions from Model III may be better thought of aspopulation sizes likely to be attained on these islands if growth follows the pattern on Kidney Island. The second factor thatmay cause unrealistic results for some islands was that we did not have occupancy data for them. As a first approximation, weestimated their population sizes by assuming that mean occupancy on those islands was the same as on Kidney Island.However, as we have shown, occupancy on Kidney Island was partially dependent on habitat so this assumption may bewrong. Our results for the other islands should therefore be treated with caution. Another approach would have been to useModel II, which we fitted to occupancy data from Kidney Island, to predict occupancy on the other islands as a function oftheir habitats. However, without occupancy data from the other islands, we could not account for any functional responses ofoccupancy to inter-island differences in habitat availability. In future studies it would be valuable to test whether suchfunctional responses occur by surveying both occupancy and habitat at multiple sites.
Traditional techniques of estimating population size, such as the design-based method of multiplying burrow density byobserved breeding habitat and simple HSFs may misrepresent the total breeding population size. We found that the design-basedmethod underestimated population size by over 20% across the Falklands when comparedwith habitat-based results inModels I and III (Table 4). A critical assumption of design-based techniques is that burrow densities from surveyed areasreflect densities in un-surveyed areas. However, as observations from surveys are averaged across space, areas of local ex-tremesmay be lost. Furthermore, as our study and past studies have demonstrated, seabird burrowing density and occupancy

T.J. Clark et al. / Global Ecology and Conservation 17 (2019) e00554 11
rely heavily on breeding micro-habitat (Rayner, Hauber & Clout, 2007b). Thus, utilizing a spatial, model-based approach maycapture the effect of these “hot or cold spots” on population estimates, allowing for a more precise approximation of pop-ulation size. Previous studies of seabirds have shown that design-based procedures often estimate population size poorly(e.g., Rayner et al. 2007; in contrast, see Scott et al., 2009) compared to model-based methods. Our study supports this resultand moreover shows that because occupancy too varies as a function of habitat that assuming a uniform occupancy rateacross space will reduce the accuracy of population estimates.
We used GFRs (Model III) to estimate burrow densities and potential population size for a number of islands using alimited dataset. This modeling technique is useful for areas like the Falklands, where there are a lot of islands and limitedresources available to survey animal populations (Otley et al., 2008). Despite limited survey data from other islands and asmall number of explanatory covariates, we found that Model III (the GFR model) fit much more robustly than Model IV (theconventional HSF model) fitted to burrow observations. This indicates that the form of the functional response of sootyshearwaters to breeding habitat varies with local habitat availability. As such, a habitat selectionmodel fitted to data from oneisland will not necessarily predict burrow density well at another island unless a GFR model is used (Matthiopoulos et al.,2011).
4.4. Conservation and management implications
Our results support the supposition that the breeding population of sooty shearwaters in the Falkland Islands (SouthAtlantic) is increasing, which contrasts with declining populations in the species’ core breeding range in the South Pacific. Itis thought that breeding habitat loss has been one contributory cause of sooty shearwater declines in New Zealand (Jones,2000; McKechnie et al., 2008). Tussac harvesting and fire drastically reduced tussac cover, height, and age on Kidney Islandprior to the 1950s so breeding habitat loss could formerly have limited population size in the Falkland Islands and tussacregeneration following the cessation of these activities facilitated its recent increase. However, there are several otherrodent-free, tussac covered islands in the Falklands, on which it appears that sooty shearwaters could have bred in therecent past but did not. This raises the question of whether breeding habitat availability was really limiting in the past. Inanswer, we note that petrels have a strong propensity to recruit to existing colonies, rather than founding new ones(Warham, 1996). This may be because immature birds tend to locate colonies by following or detecting conspecifics. If so,then new colonies are more likely to be founded near old ones. Our results are consistent with this: Rodents were eradicatedfrom the tussac-covered Top and Bottom Islands, which are only 6 km from Kidney Island, in 2001, since then they appear tobe being rapidly colonized by sooty shearwaters. In contrast, a recent thorough survey of Bird Island, 230 km away on theother side of the Falklands archipelago, which has always been tussac covered and rodent-free, found no confirmed breedingsooty shearwaters (Catry et al., 2018). As such, there could be a large temporal lag between the loss of breeding habitat at onecolony and the establishment of new colonies at alternative but distant locations. If this is so, breeding habitat restorationand the removal of invasive predators should initially be targeted at or near existing or traditional breeding sites. Ongoinghabitat restoration projects in other parts of the Falklands and elsewhere should therefore be regarded as long-termenterprises.
Of course, other factors may also have formerly limited the size of the Falkland Islands sooty shearwater population. Forexample, it may have been impacted by fisheries in the North Atlantic, such as the now defunct Grand Banks cod fishery(Uhlmann, 2003), which occurredwithin the corewintering range of sooty shearwaters from the Falkland Islands (Hedd et al.,2012). Indeed, until relatively recently great shearwaters (Puffinus gravis) were caught in large numbers on baited hooks foruse as bait in this fishery (Bent, 1964). It seems likely that many sooty shearwaters would have been caught at the same time.Sooty shearwaters were also bycaught in large numbers in gillnets in the Northwest Atlantic (Uhlmann et al., 2005; Benjaminset al., 2008) but it is unclear whether bycatch has reduced sufficiently since the 1950s to account for the increased populationin the Falkland Islands.
Ultimately, the apparently opposite breeding population trajectories of sooty shearwaters in and around New Zealandand the Falklands could be caused by multiple interacting effects. Firstly, bycatch rates may differ between waters aroundNew Zealand and those around the Falklands (Uhlmann et al., 2005; Auge and Golding, 2017) or between the North Pacificand Northwest Atlantic where the respective populations winter (Shaffer et al., 2006; Hedd et al., 2012). Secondly, wintersurvival could vary between the two populations due to differential effects of climate change onwind patterns, productivity,etc. (Shaffer et al., 2006; Hazen et al., 2012), but very little is known about this at present. More tangibly, invasive rodentshave been eradicated from or were never present on sooty shearwaters breeding islands in the Falklands (Table 1; Tabaket al., 2014). In contrast, most colonies in New Zealand still harbour rat populations (Newman et al., 2008, 2010). Finallysooty shearwater chicks and fledglings are harvested by indigenous Maori in New Zealand (Lyver, 2000; Newman et al.,2010), while there is no equivalent harvest in the Falklands. Ultimately, comparative studies on the demography andmovements of the two populations may be needed if the reasons for their very different conservation prospects are to beunderstood.
Acknowledgements
Funding was provided by the UK Natural Environmental Research Council (NERC) grant NE/M017990/1, the Seabird Group,the Falkland Islands Government and the Fundaç~ao para a Ciencia e a Tecnologia, Portugal (strategic project UID/MAR/04292/

T.J. Clark et al. / Global Ecology and Conservation 17 (2019) e0055412
2013 granted to MARE, and FCT-SFRH/BPD/89904/2012 granted to LC). The South Atlantic Environmental Research Institutegenerously provided logistical support along with access to datasets through the IMS-GIS Data Centre, and Agnes Olin mademanuscript corrections.
Appendix A
Table A1Summary of covariates considered in Models I and II. Covariates in bold were included in the minimum adequate model of burrow density (Model I) andunderlined variables were included in the minimum adequate model of burrow occupancy (Model II).
Effects Effect on sooty shearwater burrows/occupancy
Aspect Facilitates take-offSlope Facilitates take-off; higher surface area in plots with higher slopeDistance to Coast Facilitates take-offElevation Facilitates take-offSoil Moisture Facilitates easier construction of burrowsTussac Cover Improves drainage; protection from weather; easier construction; etc.Tussac Height Protection from weather; easier construction of burrowsChange in Tussac Density Facilitates easier construction of burrowsRock Presence Impedes construction of burrowsTussac Cover x Tussac Height Improves drainage; protection from weather; easier construction; etc.Tussac Cover x Tussac Age Improves drainage; protection from weather; easier construction; etc.Distance to Coast x Elevation Facilitates take-offSlope x Elevation Facilitates take-offSlope x Distance to Coast Facilitates take-off
Table A2Summary of the selection of Model I. Due to the large number of possible models in the selection process, models below are defined by deletion of maineffects (and all pertinent interactions) from the minimum adequate model. Models are ranked by DAIC.
Model Number of parameters D AIC
Minimum Adequate 12 0.000- aspect 11 2.540- slope 10 6.700- tussac height 10 10.060- tussac cover 10 33.770- change in tussac density 11 38.480- elevation 9 53.690- distance to coast 10 94.310
Intercept only 1 325.270
Table A3Summary of the selection of Model II. Models are ranked by DDIC. See Table 2 for full list of candidate variables.
Model Effective number of parameters* D DIC
Minimum Adequate 21.713 0.000DC þ EL þ SL 21.184 1.895DC þ EL 21.994 2.870DC 24.314 6.527Null 29.891 12.106Full 28.222 15.708
*Estimated following Spiegelhalter et al., (2002). DC¼ distance to the coast; EL¼ elevation; SL¼ slope; Null¼ only intercept term included; Full¼ allcandidate variables and interactions included.

T.J. Clark et al. / Global Ecology and Conservation 17 (2019) e00554 13
Fig. A1. The effect of tussac height and cover on burrow density predicted by Model I.
Fig. A2. Observed vs. predicted burrow counts for (a) Model III and (b) Model IV. Each dot corresponds to survey plots on Kidney Island, Top Island, or BottomIsland. The dashed line has a gradient of one.
Appendix B. Supplementary data
Supplementary data to this article can be found online at https://doi.org/10.1016/j.gecco.2019.e00554.

T.J. Clark et al. / Global Ecology and Conservation 17 (2019) e0055414
References
Ali, A.H., Ford, A.T., Evans, J.S., Mallon, D.P., Hayes, M.M., King, J., Amin, R., Goheen, J.R., 2017. Resource selection and landscape change reveal mechanismssuppressing population recovery for the world's most endangered antelope. J. Appl. Ecol. 54, 1720e1729.
Arnold, T.W., 2010. Uninformative parameters and model selection using akaike's information criterion. J. Wildl. Manag. 74, 1175e1178.Auge, A., Golding, N., 2017. Assessment of Fishing Closure Areas as Sites for Marine Management Areas in the Falkland Islands Waters. Stanley, Falkland
Islands.Augustin, N.H., Mugglestone, M.A., Buckland, S.T., Mugglestonet, M.A., 1996. An autologistic model for the spatial distribution of Wildlife. J. Appl. Ecol. 33,
339e347.Baum, J.K., Worm, B., 2009. Cascading top-down effects of changing oceanic predator abundances. J. Anim. Ecol. 78, 699e714.Benjamins, S., Kulka, D.W., Lawson, J., 2008. Incidental catch of seabirds in Newfoundland Labrador gillnet fisheries, 2001-2003. Endanger. Species Res. 5,
149e160.Bent, A., 1964. Life Histories of North American Petrels and Pelicans and Their Allies. Dover Press, New York, NY, U.S.A.Boyce, M., McDonald, L., 1999. Relating populations to habitats using resource selection functions. Trends Ecol. Evol. 14, 268e272.Brandt, C.A., Parrish, J., Hodges, C.N., 1995. Predictive approaches to habitat quantification: dark-rumped petrels on Haleakala, maui. Auk 112, 571e579.Bried, J., Jouventin, P., 2002. In: Schreiber, E., Burger, J. (Eds.), Site and Mate Choice in Seabirds: an Evolutionary Approach. Biology of Marine Birds. CRC
Press, Boca Raton, pp. 263e305.Brooke, M., 2004. Albatrosses and Petrels across the World. Oxford University Press, Oxford, U.K.Burnham, K.P., Anderson, D., 2003. Model Selection and Multimodel Inference: A Practical Information-Theoretic Approach. Spring Science & Business
Media, New York, NY, U.S.A.Buxton, R.T., Jones, C., Moller, H., Towns, D.R., 2014. Drivers of seabird population recovery on New Zealand Islands after predator eradication. Conserv. Biol.
28, 333e344.Carstairs, D., 1996. Notes on the birds of two Falkland Islands: Kidney and Staats. Falkl. Isl. J. 233, 64e71.Catry, P., Campos, A., Segurado, P., Silva, M., Strange, I., 2003. Population census and nesting habitat selection of thin-billed prion Pachyptila belcheri on New
Island, Falkland Islands. Polar Biol. 26, 202e207.Catry, P., Wakefield, E.D., Stokes, A., Guest, A., Boldenow, M., Clark, T.J., 2018. A Baseline Survey of Breeding Seabirds on Bird Island, West Falklands. Report to
the Falkland Islands Government, SAERI, Stanley, Falkland Islands.Charleton, K., Bragg, C., Knight, B., Fletcher, D., Moller, H., Newman, J., Scott, D., 2009. Spatial variation in burrow entrance density of the sooty shearwater.
Notornis 56, 1e10.Clark, T.J., Bonnet-Lebrun, A.S., Campioni, L., Catry, P., Wakefield, E., 2018. The depth of Sooty Shearwater Ardenna grisea burrows varies with habitat and
increases with competition for space. Ibis 161, 192e197.Falklands Conservation, 2006. Kidney Island Group. Stanley, Falkland Islands.Cramp, S., Bourne, W., Saunders, D., 1974. The Seabirds of Britain and Ireland. Collins, London, U.K.Croxall, J.P., Butchart, S.H.M., Laschelles, B., Stattersfield, A.J., Sullivan, B., Symes, A., Taylor, P., 2012. Seabird conservation status, threats and priority actions:
a global assessment. Bird. Conserv. Int. 22, 1e34.Estes, J.A., Terborgh, J., Brashares, J.S., Power, M.E., Berger, J., Bond, W.J., Carpenter, S.R., Essington, T.E., Holt, R.D., Jackson, J.B.C., Marquis, R.J., Paine, R.T.,
Schoener, T.W., Shurin, J.B., Sinclair, A.R.E., 2011. Trophic downgrading of Planet Earth. Science 333 (6040), 301e306.Google Earth Pro, V., 2017. Kidney Island. 51� 37’ 26.21”S, 151�45’15.01”W, Eye Alt 1.27 Km. CNES/Astrium 2016, 7.1.8.3036. http://www.earth.google.com.Hall, J.R., Woods, R.W., De, M., Brooke, L., Hi Lton, G.M., 2002. Factors affecting the distribution of landbirds on the Falkland Islands. Bird. Conserv. Int. 12,
151e167.Halpern, B., Walbridge, S., Selkoe, K., Kappel, C., MIcheli, F., D'Agrosa, C., Bruno, J., Casey, K., Ebert, C., Fox, H., Fujita, R., Heinemann, D., Lenihan, H., Madin, E.,
Perry, M., Selig, E., Spalding, M., Steneck, R., Watson, R., 2008. A global map of human impact on marine ecosystems. Science 319, 3199e4133.Hamilton, S., 1998. Determining burrow occupancy, fledging success and land-based threats to mainland and near-shore island sooty shearwater (Puffinus
griseus) colonies. N. Z. J. Zool 254, 443e453.Hamilton, S., 2000. How precise and accurate are data obtained using an infra-red scope on burrow-nesting sooty shearwater puffinus griseus? Mar.
Ornithol. 28, 1e6.Hazen, E.L., Jorgensen, S., Rykaczewski, R.R., Bograd, S.J., Foley, D.G., Jonsen, I.D., Shaffer, S.A., Dunne, J.P., Costa, D.P., Crowder, L.B., 2012. Predicted habitat
shifts of Pacific top predators in a changing climate. Nat. Clim. Change 3, 234.Hedd, A., Montevecchi, W., Otley, H., Phillips, R., Fifield, D., 2012. Trans-equatorial migration and habitat use by sooty shearwaters Puffinus griseus from the
South Atlantic during the nonbreeding season. Mar. Ecol. Prog. Ser. 449, 277e290.Hedd, A., Montevecchi, W.A., Phillips, R.A., Fifield, D.A., 2014. Seasonal Sexual Segregation by Monomorphic Sooty Shearwaters Puffinus griseus Reflects
Different Reproductive Roles during the Pre-Laying Period. PLoS One 9, e85572.Hijmans, R.J., 2016. Raster: Geographic data analysis and modeling. In: R Package Version 2, pp. 5e8. https://CRAN.R-project.org/package¼raster.Jones, C., 2000. Sooty shearwater (Puffinus griseus) breeding colonies on mainland South Island, New Zealand: evidence of decline and predictors of
persistence. N. Z. J. Zool 274, 327e334.Jones, C., 2002. A model for the conservation management of a ‘secondary’ prey: sooty shearwater (Puffinus griseus) colonies on mainland New Zealand as a
case study. Biol. Conserv. 108, 1e12.Jones, C., Bettany, S., Moller, H., Fletcher, D., Lyver, P., De Cruz, J., 2003. Burrow occupancy and productivity at coastal sooty shearwater (Puffinus griseus)
breeding colonies, South Island, New Zealand: can markerecapture be used to estimate burrowscope accuracy? Wildl. Res. 30, 377e388.Lawton, K., Robertson, G., Kirkwood, R., Valencia, J., Schlatter, R., Smith, D., 2006. An estimate of population sizes of burrowing seabirds at the Diego Ramirez
archipelago, Chile, using distance sampling and burrow-scoping. Polar Biol. 29, 229e238.Lyver, B., 2000. Sooty shearwater (Puffinus griseus) harvest intensity and selectivity on Poutama Island, New Zealand. N. Z. J. Ecol. 24, 169e180.Matthiopoulos, J., Hebblewhite, M., Aarts, G., Fieberg, J., Fieberg6, J., 2011. Generalized functional responses for species distributions. Ecology 92, 583e589.McKechnie, S., Fletcher, D., Moller, H., Scott, D.S., Newman, J., Bragg, C., 2007. Estimating and correcting for bias in population assessments of sooty
shearwaters. J. Wildl. Manag. 71, 1325e1335.McKechnie, S., Moller, H., Bragg, C., Newman, J., Scott, D.S., Cruz, J.B., 2008. Recovery of a sooty shearwater (Puffinus griseus) breeding area after habitat
destruction. N. Z. J. Ecol. 32, 34e40.McNally, N., Aug�e, A., 2015. Testing and Re-adjusting New Burrow Entrance Nets to Catch Sooty Shearwater, Report to the Falkland Islands Government,
SAERI. Stanley, Falkland Islands.Moller, H., Fletcher, D., Johnson, P.N., Bell, B.D., Flack, D., Bragg, C., Scott, D., Newman, J., McKechnie, S., Lyver, P.O., 2009. Changes in sooty shearwater
(Puffinus griseus) abundance and harvesting on the Rakiura Titi Islands. N. Z. J. Zool 36, 325e341.Mysterud, A., Ims, R.A., 1998. Functional responses in habitat use: availability influences relative use in trade-off situations. Ecology 79, 1435e1441.NASA JPL, 2013. NASA shuttle radar topography mission global arc second version 3. In: NASA EOSDIS LP DAAC, USGS Earth Resources Observation and
Science (EROS) Center. U.S.A, Sioux Falls, South Dakota. https://lpdaac.usgs.gov. (Accessed 1 March 2017). https://doi.org/10.5067/MEaSUREs/SRTM/SRTMGL1.003.
Nelson, J.B., 1965. The breeding biology of the gannet Sula bassana on the bass rock, Scotland. Ibis 108, 584e626.Newman, J., Scott, D., Moller, H., Fletcher, D., 2008. A population and harvest intensity estimate for sooty shearwater, Puffinus griseus, on Taukihepa (Big
South Cape), New Zealand. Pap. Proc. R. Soc. Tasman. 142, 177e184.

T.J. Clark et al. / Global Ecology and Conservation 17 (2019) e00554 15
Newman, J., Scott, D., Bragg, C., McKechnie, S., Moller, H., Fletcher, D., 2010. Estimating regional population size and annual harvest intensity of the sootyshearwater in New Zealand. N. Z. J. Zool 36, 307e323.
Oka, N., Maruyama, N., Kuroda, N., Skira, I., 1996. Colony site selection of short-tailed shearwaters in Tasmania. J. Yamashina Inst. Ornithol. 28, 35e41.Olivier, F., Wotherspoon, S.J., 2006. Modelling habitat selection using presence-only data: case study of a colonial hollow nesting bird, the snow petrel. Ecol.
Model. 195, 187e204.Otley, H., Clausen, A., Ingham, B., 2008. Falkland Islands State of the Environment Report. Stanley, Falkland Islands.Parker, G.C., Rexer-Huber, K., 2015. Literature Review of Methods for Estimating Population Size of Burrowing Petrels Based on Extrapolations from Surveys.
Dunedin, New Zealand.Passfield, K., Poncet, S., 2010. A Survey of Seal Island, High Cliff Island Group, Harbour Islands and Islands at Port King and Bull Point. Stanley, Falkland
Islands.Pearson, S.F., Hodum, P.J., Good, T.P., Schrimpf, M., Knapp, S.M., 2013. A model approach for estimating colony size, trends, and habitat associations of
burrow-nesting seabirds. Condor 115, 356e365.Phillips, R.A., Gales, R., Baker, G.B., Double, M.C., Favero, M., Quintana, F., Tasker, M.L., Weimerskirch, H., Uhart, M., Wolfaardt, A., 2016. The conservation
status and priorities for albatrosses and large petrels. Biol. Conserv. 201, 169e183.Plummer, M., 2016. Rjags: bayesian graphical models using MCMC. R package version 4e6. https://CRAN.R-project.org/package¼rjags.Poncet, S., Passfield, K., 2011. Island Visit Reports for 35 Tussac Islands Surveyed between 2009 and 2011. Stanley, Falkland Islands.Poncet, S., Passfield, K., 2012. Surveys of Islands in the Bleaker Island Group: First, Second, Third, Halt, North Point, Ghost and Sandy Bay Islands. Stanley,
Falkland Islands.Poncet, S., Passfield, K., 2013. Post-baiting Check 2013 of Rat Island, Centre Island, Big Shag and Little Shag in Salvador Waters. Stanley, Falkland Islands.Poncet, S., Poncet, L., Poncet, D., Christie, D., Dockrill, C., Brown, D., 2011. In: Veitch, C., Clout, M., Towns, D. (Eds.), Island Invasives: Eradication and
Management in the Falkland Islands and South Georgia. Island invasives: Eradication and Management. IUCN, Gland, Switzerland, pp. 332e336.Poncet, S., Passfield, K., Rexer-Huber, K., 2012. Burrowing Petrel Surveys: Top and Bottom Islands and Tussac Point in Port William and Sophie and Amy
Islands in Port Pleasant. Stanley, Falkland Islands.Putz, K., 2009. Expedition Des Antarctic Research Trusts Zu Den Sea Lion Islands, Falklandinseln. Stanley, Falkland Islands.R Core Team, 2013. R: A Language and Environment for Statistical Computing. R Foundation for Statistical Computing, Vienna, Austria, ISBN 3-900051-07-0.
http://www.R-project.org/.Rayner, M.J., Clout, M.N., Stamp, R.K., Imber, M.J., Brunton, D.H., Hauber, M.E., 2007a. Predictive habitat modelling for the population census of a burrowing
seabird: a study of the endangered Cook's petrel. Biol. Conserv. 138, 235e247.Rayner, M., Hauber, M., Clout, M., 2007b. Breeding habitat of the Cook's petrel on little barrier island: implications for the conservation of a New Zealand
endemic. Emu 107, 59e68.Reyes-Arriagada, R., Campos-Ellwanger, P., Schlatter, R.P., Baduini, C., 2007. Sooty Shearwater (Puffinus griseus) on Guafo Island: the largest seabird colony
in the world? Biodivers. Conserv. 16, 913e930.Ryan, P.G., Dorse, C., Hilton, G.M., 2006. The conservation status of the spectacled petrel Procellaria conspicillata. Biol. Conserv. 131, 575e583.Schumann, N., Dann, P., Hoskins, A.J., Arnould, J.P.Y., 2013. Optimizing survey effort for burrow-nesting seabirds. J. Field Ornithol. 84, 69e85.Scott, D., Scofield, P., Hunter, C., Fletcher, D., 2008. Decline of sooty shearwaters, puffinus griseus, on the Snares, New Zealand. Pap. Proc. R. Soc. Tasman. 142,
185e196.Scott, D., Moller, H., Fletcher, D., Newman, J., Aryal, J., Bragg, C., Charleton, K., 2009. Predictive habitat modelling to estimate petrel breeding colony sizes:
sooty shearwaters (Puffinus griseus) and mottled petrels (Pterodroma inexpectata) on Whenua Hou Island. N. Z. J. Zool 36, 291e306.Shaffer, S.A., Tremblay, Y., Weimerskirch, H., Scott, D., Thompson, D.R., Sagar, P.M., Moller, H., Taylor, G.A., Foley, D.G., Block, B.A., Costa, D.P., 2006. Migratory
shearwaters integrate oceanic resources across the Pacific Ocean in an endless summer. Proc. Natl. Acad. Sci. U. S. A 103, 12799e12802.Spiegelhalter, D.J., Best, N.G., Carlin, B.P., van der Linde, A., 2002. Bayesian measures of model complexity and fit. J. Roy. Stat. Soc. B 64, 583e639.Stokes, D.L., Boersma, P.D., 1991. Effects of substrate on the distribution of magellanic penguin (Spheniscus magellanicus). Auk 108, 923e933.Strange, I., Catry, P., Strange, G., 2007. New Island, Falkland Islands, a South Atlantic Wildlife Sanctuary for Conservation Management. New Island Con-
servation Trust, London, U.K.Sutherland, D., Dann, P., 2012. Improving the accuracy of population size estimates for burrow-nesting seabirds. Ibis 154, 488e498.Tabak, M.A., Poncet, S., Passfield, K., Martinez Del Rio, C., 2014. Invasive species and land bird diversity on remote South Atlantic islands. Biol. Invasions 16,
341e352.Uhlmann, S., 2003. Fisheries Bycatch Mortalities of Sooty Shearwaters (Puffinus Griseus) and Short-Tailed Shearwaters (P. Tenuirostris). Wellington, New
Zealand.Uhlmann, S., Fletcher, D., Moller, H., 2005. Estimating incidental takes of shearwaters in driftnet fisheries: lessons for the conservation of seabirds. Biol.
Conserv. 151e163.Warham, J., 1977. Wing loadings, wing shapes, and flight capabilities of Procellariiformes. N. Z. J. Zool 4, 73e83.Warham, J., 1990. The Petrels: Their Ecology and Breeding Systems. Academic Press, London, U.K.Warham, J., 1996. The Behaviour, Population Biology, and Physiology of the Petrels. Academic Press, London, U.K.Warham, J., Wilson, G.J., 1982. The size of the sooty shearwater population at the Snares islands, New Zealand. Notornis 29, 23e30.Waugh, S.M., Tennyson, A.J.D., Taylor, G.A., Wilson, K.-J., 2013. Population sizes of shearwaters (Puffinus spp.) breeding in New Zealand, with recom-
mendations for monitoring. TUHINGA 24, 159e204.Whitehead, A.L., O, P., Lyver, B., Jones, C.J., Bellingham, P.J., Macleod, C.J., Coleman, M., Karl, B.J., Drew, K., Pairman, D., Gormley, A.M., Duncan, R.P., 2014.
Establishing accurate baseline estimates of breeding populations of a burrowing seabird, the grey-faced petrel (Pterodroma macroptera gouldi) in NewZealand. Biol. Conserv. 169, 109e116.
Woods, R.W., 1970. The avian ecology of a tussock island in the Falkland Islands. Ibis 112, 15e24.Woods, R.W., 1988. In: Anthony Nelson, L.T.D. (Ed.), Guide to the Birds of the Falkland Islands (Oswestry, U.K).Woods, R.W., Woods, A., 2006. Birds and Mammals of the Falkland Islands. Princeton University Press, Princeton, NJ, U.S.A.Woods, R.W., Woods, A., 1996. In: Anthony Nelson, L.T.D. (Ed.), Atlas of Breeding Birds of the Falkland Islands (Oswestry, U.K).


![eprints.gla.ac.ukeprints.gla.ac.uk/164088/1/164088.pdfMetformin is low cost with an excellent safety profile, other than appreciable rates of gastrointestinal upset [1], which can](https://img.dokumen.tips/doc/110x75/6014450977c00f7d0a130635/metformin-is-low-cost-with-an-excellent-safety-profile-other-than-appreciable-rates.jpg)