Embed Size (px)
Citation preview

THE MARTEC GROUP CONFIDENTIAL
1
Legal Statement
The purpose of the information in this presentation is to guide ICA programs and provide members information to make independent business decisions.
Based on primary interviews conducted in the industry and publically available information. The Martec Group in cooperation with MetalsPlus are the sources of the forecasted data in this presentation.

THE MARTEC GROUP CONFIDENTIAL
2
Antitrust Guidelines
Antitrust Guidelines for Copper Industry
Trade Association Meetings
The following guidelines with respect to compliance with antitrust laws of the United States, Japan and European Community1
are intended to govern the conduct of participants in copper industry trade association meetings, both at the meeting itself and
in informal discussions before or after the formal meeting.
Price: Competitors should not discuss future prices (including terms of sale) of their products. There is no blanket prohibition
against the mention of or reference to current or past prices but limits must be observed. Such references or mentions should
occur only when necessary in connection with the development of association programs. For example, reference to a particular
price level in comparing the cost of a copper product to a competing product is permitted. Whenever possible, such references
should be discussed in advance with legal counsel.
Competitive Information: Competitors should not discuss the market share of a particular copper producer or copper
fabricator’s products. Furthermore, nothing should be said at a meeting which could be interpreted as suggesting prearranged
market shares for such products or producer production levels. The overall market share of copper products may be discussed
with regard to competition with non-copper products and general market acceptance.
New Products: Competitors should not encourage or discourage the introduction of a new product by another competitor or
reveal a particular copper company’s plans to change the production rate of an existing product or to introduce a new product.
No company should disclose to another company whether it is in a position to make or market a new product. New products
may be discussed in a technical manner or from the standpoints of competition with non-copper products and general market
acceptance. In addition, proposed methods for and results of field and laboratory testing can be considered.
The Role of Legal Counsel: Legal counsel attends association meetings to advise association staff and other meeting
attendees regarding the antitrust laws and to see that none of the matters discussed or materials distributed raise even the
appearance of antitrust improprieties. During the course of a meeting, if counsel believes that the discussion is turning to a
sensitive or inappropriate subject, counsel will express that belief and request that the attendees return the discussion to a less
sensitive area.
A paper entitled ‘Copper Industry Trade Associations and Antritrust Laws’ is available upon request.
10/92, 5/93, 10/10
1. Other foreign competition laws apply to International Copper Association, Ltd. (ICA)’s activities worldwide.

THE MARTEC GROUP CONFIDENTIAL
3
Competitive Analysis of the
Appliances Market
Keith Miller Business Director, The Martec Group
London, October 2018

THE MARTEC GROUP CONFIDENTIAL
4
Methodology/Interviews
Martec has completed 70 interviews with various key industry respondents:
• Leading global Appliance OEMs, Suppliers and other industry experts:
Whirlpool, GE-Haier, BSH, LG, Samsung, Electrolux, Frigidaire, Panasonic, Keurig, Indesit, Zanussi, Vestel, Gorenje, Vestel, Candy, Elica, Insinkerator, Hoover, SharkNinja, Puppy Vacuums, Puti, Huadi, Rinnai, Gree, Prestige, Venus, Godrej, Rallison, Shanghai Highly, Nidec, A.O. Smith, Galanz Motor, Jinda Motor, Media Fans and various others
• Across the following key appliances: Refrigerators, freezers, washers, dryers,
ovens/hobs/cooking ranges, microwaves, dishwashers, range hoods, garbage disposals, mixers, hot water heaters, space heaters (non-home HVAC), air purifiers, coffee/tea machines, personal care appliances, etc.
Home HVAC including air conditioners were excluded
22 15
20 13

THE MARTEC GROUP CONFIDENTIAL
5
Important Industry Topics
- -
- -
Other
Another important factor for manufacturers is keeping the products cost competitive
Increase functionality of appliances while keeping them efficient and low-cost
Affordability of appliances is a big factor in fast paced middle-class countries such as China and India
Energy Efficiency
*NOTE: Based on respondents ranking in order by priority.
2.16
Product
Offering consistent products can help lead to product and brand loyalty.
Differentiating products through innovative designs can help gain the favor of consumers
The product is the brand and needs to keep consistent quality
Many product changes today are directly related to the image of the product
1.50
Design/Function
Changing functionality to meet customer’s needs while keeping costs low is very important to manufacturers.
Providing a function that another brand or product does not have can differentiate an appliance enough for purchase
Consumers are looking to save money without losing functionality
− Appliance OEMs trying to increase functionality while decreasing cost/price
− Failures are a concern with usage of alternative materials
China and India scored Design/Functionality higher in importance than ROW
2.10
Technology
Increasing integration of smart technologies will help separate great appliances from good appliances.
Companies will need to introduce new technologies to compete in the changing market
Innovations may be expensive, but there are ways to make up for the losses
Electrical efficiency is a major trend with regard to product technological improvements
Technology scored much higher in importance in NA (1.44) and Europe (1.13) vs. China & India

THE MARTEC GROUP CONFIDENTIAL
6
High Level Trends
Leading Trends:
• Higher efficiency rated appliances
• Larger capacity appliances
• New product configurations with new/advanced controls
Both large and small appliances
• Cost effective touch UI w/ color graphics and multi-color LEDs
• Connectivity / Smart appliance technology
• Value engineering / Product diversification / Broader portfolios / Increased functionality
• Cost reduction targets / Increase affordability
• Unique features across brands and price points
Materials, finishes, capabilities, extended warranties

THE MARTEC GROUP CONFIDENTIAL
7
Challenges for Alternative Materials
• Conductivity differences and losses vs. using Copper
Environmental effects in performance over time of alternative materials and issues with creep and electrolysis
• Changes to control algorithms due to electronic properties
Appliance process timing changes due to motor / pump / compressor performance such as torque or heating
• Reduced product / component life span with alternative materials
Impact on brand differentiation, may require or result in more maintenance, service & warranty
• Solve cross-regional procurement issues and procurement complexities
Need to provide reliable and low cost supply globally; 2 – 3 years to put into production and at least 2 – 3 to realize value
• Heating / Material expansion (especially w/ aluminum)
Effects contacts electrical properties & reliability
• Diameters and ability of suppliers in forming effective diameters for windings w/ Al for smaller motors and components
Aluminum and alternatives will increase motor size or will have to accept reduced performance and/or life span
Limited supply of reliable vendors capable to support material change

THE MARTEC GROUP CONFIDENTIAL
8
Simple
Difficult
Geometrics of Design
(fit in appliance)
Effect on other Components
Connection Reliability
Control System Changes
Small Component Geometries
CU embedded into design
(i.e. PCBs, UIs, Wire Harness)
Difficult to model & test (i.e. Connectivity)
Difficult for appliance OEMs to test wireless technology (high frequency equipment) with alternative materials due to unknown quantity vs. Cu. Significant investment & expertise required.
These are strongholds for Cu due to performance risks of alternative materials. Will take time to displace if it even will be displaced.
Very challenging to utilize Al in small geometries without sacrificing performance, especially with significant space restrictions or smaller appliances.
Technical Matters that Defend Copper
Ongoing problems with alternative materials vs. Cu as alt. materials have issues with creep, electrolysis over time and soldering issues. May require tradeoffs in life expectancy of appliance.
Change to alternative materials can create issues with another component or architecture that needs to be compensated for or balanced out (i.e., noise, vibration, heat management, etc.). Require dampening or mounting changes.
Size of components will change or changes in architecture design are required in order to fit in appliance. Aluminum windings can increase motor size up to 1/3 vs. Cu windings.
Heat management, motor cycling or recalibrating & programing control systems or error codes due to changes. Must evaluate whole system.
Challenges over time to OEMs
Meeting Energy Efficiency
Based on history and experience, easier path for Appliance OEMs to design and meet energy efficiency standards and maintaining desired life cycles with using Cu.
THE MARTEC GROUP CONFIDENTIAL
9
Growth Opportunities
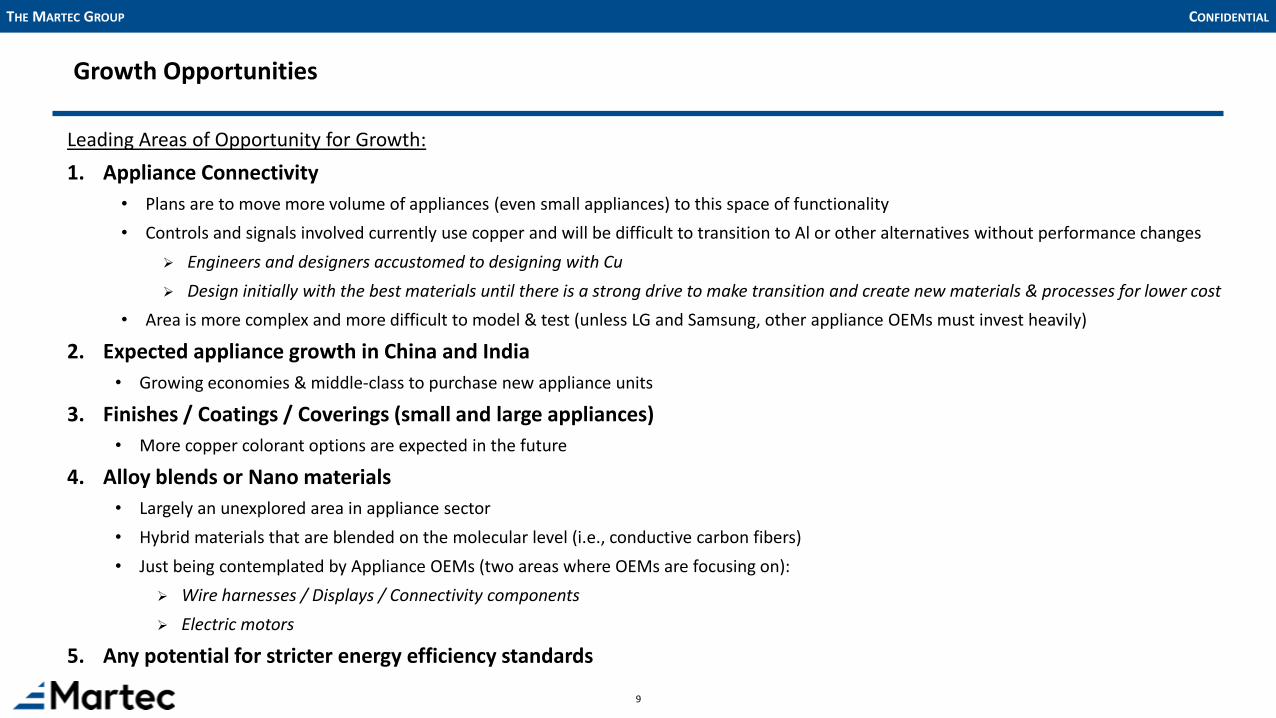
Leading Areas of Opportunity for Growth:
1. Appliance Connectivity
• Plans are to move more volume of appliances (even small appliances) to this space of functionality
• Controls and signals involved currently use copper and will be difficult to transition to Al or other alternatives without performance changes
Engineers and designers accustomed to designing with Cu
Design initially with the best materials until there is a strong drive to make transition and create new materials & processes for lower cost
• Area is more complex and more difficult to model & test (unless LG and Samsung, other appliance OEMs must invest heavily)
2. Expected appliance growth in China and India
• Growing economies & middle-class to purchase new appliance units
3. Finishes / Coatings / Coverings (small and large appliances)
• More copper colorant options are expected in the future
4. Alloy blends or Nano materials
• Largely an unexplored area in appliance sector
• Hybrid materials that are blended on the molecular level (i.e., conductive carbon fibers)
• Just being contemplated by Appliance OEMs (two areas where OEMs are focusing on):
Wire harnesses / Displays / Connectivity components
Electric motors
5. Any potential for stricter energy efficiency standards

THE MARTEC GROUP CONFIDENTIAL
10
Oven/Stove/Range/Hobs Overview – Large Appliance Example
Fan motor windings
Induction Coils
Contact Points & PCB for controls
Power Cord/Wiring
0.8kg <2%
Common Copper Components
Avg. Copper per Oven/Stove/Range
Copper as % of all materials in a Oven/Stove/Range
Oven/Stove/Range/Hobs Sold per Household
Fan motor windings
Induction cols (in process to copper-clad /
aluminum)
Piping (typically aluminum, some copper)
Cu Alt.
Regional
Country
.01
.09
.09 .12
0.9 Ovens/Stoves/ Ranges/Hobs per Household (total)
4.2 people per Oven/Stove/Range/
Hobs (total)
.05
ROW
-
25
50
75
100
125
150
175
2015 2016 2017 2018(F) 2022(F)
North America Europe China India ROW
Global Units per Year (in millions)

THE MARTEC GROUP CONFIDENTIAL
11
Global Large and Small Appliance Sales: Year over Year 2012 – 2022(F)
1,852 1,928
1,997 2,042 2,100
2,166 2,228
2,289 2,350
2,405 2,461
0
500
1,000
1,500
2,000
2,500
3,000
0
500
1000
1500
2000
2500
3000
2012 2013 2014 2015 2016 2017 2018 2019 2020 2021 2022
Small Appliances Large Appliances TOTAL
In M
illio
ns
of
Un
its
Total CAGR 2012-2017 3.2% Total CAGR 2017-2022 2.6% Total CAGR 2012-2022 2.9%
Large Appliances CAGR 2012-2017 2.7% Large Appliances CAGR 2017-2022 2.8% Large Appliances CAGR 2012-2022 2.8%
Small Appliances CAGR 2012-2017 3.4% Small Appliances CAGR 2017-2022 2.5% Small Appliances CAGR 2012-2022 3.0%
Large & Small Appliances

THE MARTEC GROUP CONFIDENTIAL
12
Small Appliances Sold by Region: 2012 – 2022(F)
0
100
200
300
400
500
600
700
North America Europe China India ROW
Small Appliances Total CAGR 2012-2017 3.4% Total CAGR 2017-2022 2.5% Total CAGR 2012-2022 3.0%
North America CAGR 2012-2017 1.1% North America CAGR 2017-2022 1.5% North America CAGR 2012-2022 1.3%
Europe CAGR 2012-2017 1.3% Europe CAGR 2017-2022 1.0% Europe CAGR 2012-2022 1.1%
China CAGR 2012-2017 8.2% China CAGR 2017-2022 3.7% China CAGR 2012-2022 6.0%
India CAGR 2012-2017 7.8% India CAGR 2017-2022 7.4% India CAGR 2012-2022 7.6%
Bulk of unit volume growth coming
from China & India due to growing economies and
middle class growth.
Small Appliances
In M
illio
ns
of
Un
its

THE MARTEC GROUP CONFIDENTIAL
13
Large Appliances Sold by Region: 2012 – 2022(F)
Large Appliances
0
50
100
150
200
250
2012 2013 2014 2015 2016 2017 2018 2019 2020 2021 2022
North America Europe China India ROW
Total CAGR 2012-2017 2.5% Total CAGR 2017-2022 2.8% Total CAGR 2012-2022 2.6%
North America CAGR 2012-2017 3.4% North America CAGR 2017-2022 1.4% North America CAGR 2012-2022 2.4%
Europe CAGR 2012-2017 1.3% Europe CAGR 2017-2022 1.4% Europe CAGR 2012-2022 1.1%
China CAGR 2012-2017 4.8% China CAGR 2017-2022 4.4% China CAGR 2012-2022 4.6%
India CAGR 2012-2017 9.4% India CAGR 2017-2022 8.6% India CAGR 2012-2022 9.0%
Bulk of unit volume growth coming
from China & India due to growing economies and
middle class growth.
Large Appliances
In M
illio
ns
of
Un
its

THE MARTEC GROUP CONFIDENTIAL
14
16 15 16 16 17 17 17 17 18 19 19
43 40 41 43 44 44 44 45 46 47 49
34 33 34 34 34 35 36 38 39 41 44
164 170 182 188
196 201 208
216 225
233 241
100 98 100 96 95 96
99 102
107 111
117
356 357 374 378 385 393
405 419
436 452
469
0
50
100
150
200
250
300
350
400
450
500
0
50
100
150
200
250
300
350
400
450
500
2012 2013 2014 2015 2016 2017 2018(F) 2019(F) 2020(F) 2021(F) 2022(F)
North America European Union India China ROW TOTAL
Electric Motors
• Motors represent approximately 25% of overall Cu usage • Growth in copper usage has been slower for North America &
Europe due to further movement of manufacturing to China • China has experienced the most growth at 4% annually driven by
unit volume production growth
Global CAGR 2012-2017 2.0% Global CAGR 2017-2022 3.6% Global CAGR 2012-2022 2.8%
North America CAGR 2012-2017 1.5% North America CAGR 2017-2022 2.8% North America CAGR 2012-2022 2.1%
Europe CAGR 2012-2017 0.4% Europe CAGR 2017-2022 2.0% Europe CAGR 2012-2022 1.2%
China CAGR 2012-2017 4.2% China CAGR 2017-2022 3.7% China CAGR 2012-2022 4.0%
India CAGR 2012-2017 0.7% India CAGR 2017-2022 4.5% India CAGR 2012-2022 2.6%
*NOTE: Based on production.
In k
iloto
nn
es
Copper Use (kt Cu) – Motors

THE MARTEC GROUP CONFIDENTIAL
15
Copper Use (kt Cu) – Equipment Wire
31 31 31 30 30 29 28 28 28 27 27
77 78 81 82 83 86 88 90 92 94 96 31 32 35 37 40 42 45 47 49 51 53
209 218 226 233 240
248 260
273 285 297
308
157 157 160 161 161
163 169
174 178
183 188
504 515 533 543 553
568 590
612 632
653 673
0
100
200
300
400
500
600
700
800
0
100
200
300
400
500
600
700
800
2012 2013 2014 2015 2016 2017 2018(F) 2019(F) 2020(F) 2021(F) 2022(F)
North America European Union India China ROW TOTAL
Equipment Wire
• Equipment wire represents ~35% of total Cu usage • Copper usage in equipment wiring has been decreasing
in North America due to shifts in manufacturing • Growth in India is expected to slow down from a high of
nearly 7% while China is expected to increase growth to >4% per year over the next 5 years
Global CAGR 2012-2017 2.4% Global CAGR 2017-2022 3.4% Global CAGR 2012-2022 2.9%
North America CAGR 2012-2017 -1.6% North America CAGR 2017-2022 -0.9% North America CAGR 2012-2022 -1.2%
Europe CAGR 2012-2017 2.2% Europe CAGR 2017-2022 2.2% Europe CAGR 2012-2022 2.2%
China CAGR 2012-2017 3.5% China CAGR 2017-2022 4.4% China CAGR 2012-2022 4.0%
India CAGR 2012-2017 6.7% India CAGR 2017-2022 4.8% India CAGR 2012-2022 5.7%
*NOTE: Based on production.
In k
iloto
nn
es

THE MARTEC GROUP CONFIDENTIAL
16
Total Copper Use (kt Cu)
91 90 90 90 90 88 89 89 89 90 90
183 182 187 190 192 196 198 200 202 203 206
96 98 102 104 107 111 116 122 127 133 139
643 665 697 721
750 770 801
832 864
895 926
452 449 454 447
443 449 463
477 491
506 520
1,465 1,484 1,530 1,552 1,582 1,614
1,667 1,720
1,773 1,827
1,881
0
200
400
600
800
1,000
1,200
1,400
1,600
1,800
2,000
0
200
400
600
800
1000
1200
1400
1600
1800
2000
2012 2013 2014 2015 2016 2017 2018(F) 2019(F) 2020(F) 2021(F) 2022(F)
North America European Union India China ROW TOTAL
Total Copper
• Overall, the total amount of copper used globally in appliance products is expected to project at around 3% growth annually over the next 5 years Global CAGR 2012-2017 2.0%
Global CAGR 2017-2022 3.1%
Global CAGR 2012-2022 2.5%
North America CAGR 2012-2017 -0.7%
North America CAGR 2017-2022 0.5%
North America CAGR 2012-2022 -0.1%
Europe CAGR 2012-2017 1.4%
Europe CAGR 2017-2022 1.0%
Europe CAGR 2012-2022 1.2%
China CAGR 2012-2017 3.7%
China CAGR 2017-2022 3.8%
China CAGR 2012-2022 3.7%
India CAGR 2012-2017 3.0%
India CAGR 2017-2022 4.6%
India CAGR 2012-2022 3.8%
*NOTE: Based on production.
In k
iloto
nn
es