Embed Size (px)
Citation preview

T H E W O R L D B A N K
Global DevelopmentFinanceFinancing the Poorest Countries
2002A N A L Y S I S A N D S U M M A R Y T A B L E S

© 2002 The International Bankfor Reconstruction and Development / The World Bank1818 H Street, NWWashington, DC 20433
All rights reserved.
1 2 3 4 04 03 02
The findings, interpretations, and conclusions expressed here do not necessarily reflect the views of the Board ofExecutive Directors of the World Bank or the governments they represent.
The World Bank cannot guarantee the accuracy of the data included in this work. The boundaries, colors, denominations, and other information shown on any map in this work do not imply onthe part of the World Bank any judgment of the legal status of any territory or the endorsement or acceptance ofsuch boundaries.
Rights and Permissions
The material in this work is copyrighted. No part of this work may be reproduced or transmitted in any form or by any means, electronic or mechanical, including photocopying, recording, or inclusion in any informationstorage and retrieval system, without the prior written permission of the World Bank. The World Bank encouragesdissemination of its work and will normally grant permission promptly.
For permission to photocopy or reprint, please send a request with complete information to the CopyrightClearance Center, Inc., 222 Rosewood Drive, Danvers, MA 01923, USA, telephone 978-750-8400, fax 978-750-4470, www.copyright.com.
All other queries on rights and licenses, including subsidiary rights, should be addressed to the Office of thePublisher, World Bank, 1818 H Street NW, Washington, DC 20433, USA, fax 202-522-2422, [email protected].
Cover design by W. Drew Fasick, Serif Design GroupCover photo: Curt Carnemark, World Bank Photo Library
ISBN 0-8213-5085-4ISSN 1020-5454

The Report Team vii
Preface viii
Acronyms and Abbreviations ix
Overview 1
Chapter 1 Challenges for Developing Countries during the Coming Global Recovery 5Recession and recovery in the industrial world 7Bust and boom in world trade 13Regional developments 19Risks to the forecast 26Notes 28References 29
Chapter 2 Private Capital Flows to Emerging Markets 31The global slowdown reduced capital market flows to developing countries 31Net resource flows 32Capital market flows 32Trends in FDI 37Emerging market financial crises in 2001 43The prospects for capital market flows and FDI 47Annex 2.1: Forecasts of private flows to developing countries 49Annex 2.2: Measuring resource flows to developing countries 51Notes 51References 52
Chapter 3 The Poor Countries’ International Financial Transactions 55Poor countries have benefited from the growth of global capital flows 55Financial integration in the poor countries 55FDI to the poor countries 59Improved investment climate is associated with rapid growth of FDI 61Effective competition policies are critical 63The participation of foreign banks in poor countries’ financial systems 64Capital outflows 69Annex 3.1: Econometric analysis of foreign bank participation 78Notes 81References 83
iii
.
Table of Contents

iv
Chapter 4 Strengthening Official Financial Support for Developing Countries 89Mixed results from aid have led to a fall in aid 89The policy framework 89Trends in aid 90The macroeconomic impact of aid 96Conditionality and adjustment lending 101Aid and debt relief 104Strengthening the effectiveness of official guarantees 107Annex 4.1 110Notes 111References 113
Appendix 1 Debt Burden Indicators and Country Classifications 119Appendix 2 Commercial Debt Restructuring 133Appendix 3 Official Debt Restructuring 151Appendix 4 Regional Economic Developments and Prospects 165
East Asia and Pacific 166Europe and Central Asia 170Latin America and the Caribbean 174Middle East and North Africa 178South Asia 183Sub-Saharan Africa 186
Appendix 5 Global Commodity Price Prospects 191
Summary tables
Tables1.1 Global conditions affecting growth in developing countries and world GDP growth 71.2 Initiating factors: turning points to downturn and recovery in OECD recessions 101.3 Developing-country forecast summary, 1991–2004 20
2.1 Net long-term resource flows to developing countries, 1991–2001 322.2 Capital market commitments to developing countries, 1991–2001 332.3 Debt ratios during recessions, East Asia and Latin America 332.4 International equity placement and performance of stock markets 342.5 Capital market commitments and spreads for developing countries 382.6 Projected capital market flows to developing countries 472A.1 How representative is the forecasting model? 492A.2 Comparison of forecasts with actual capital market flows to developing countries 502A.3 Statistics for the forecast of FDI 51
3.1 Net external financial flows to developing countries, 1999 563.2 Net long-term capital flows to poor countries, 1986–99 563.3 Annual change in policy performance and FDI as ratio to GDP, 1991–99 613.4 FDI as ratio to GDP and policy performance index in poor countries 613.5 Mining sector performance in three countries, before and after reforms 653.6 Cumulated outflows during 1980–99 703.7 Volatility of capital flows, 1990–99 703.8 Cumulated outflows as a share of GDP, 1999 71
G L O B A L D E V E L O P M E N T F I N A N C E

v
T A B L E O F C O N T E N T S
3A.1 Foreign bank presence and domestic bank performance 783A.2 Panel-VAR results for all developing countries 803A.3 Summary of impulse response functions, all developing countries 803A.4 Results of panel-VAR regression for poor countries 803A.5 Summary of impulse response functions, poor countries 80
4.1 Net official aid to developing countries, by type and source, 1990–2001 934.2 Trends in aid allocation 954.3 Forgiveness of ODA claims, 1970–2000 1054.4 Impact of HIPC Initiative in 24 decision-point cases 1064.5 Export credit commitments to HIPCs, 1990–2000 110
Figures1.1 World and industrial and developing country GDP growth, 1997–2004 61.2 Manufacturing production in the G-3 countries 2000–02 81.3 U.S. manufacturing output, high-tech and non-high-tech industries 91.4 Consumer confidence in the United States, the Euro Area, and Japan 91.5 OECD GDP growth and fiscal balance, 1970–2000 121.6 GDP growth in the industrial countries, 2001–04 121.7 World export growth, 1999–2001 131.8 World industrial production and import volumes 141.9 Shipping cost index (Baltic Dry) 151.10 Real non-oil commodity prices since 1980 181.11 Per capita agricultural production 181.12 Oil prices and OECD oil stocks 191.13 GDP growth in developing regions 211.14 Forecasting the 2001 U.S. slowdown 271.15 Two recessions in the United States, 1990–91 and 2001 27
2.1 Performance of developing-country stock markets by sector 342.2 Bank lending standards and bank credit to developing countries, 1990–2001 352.3 Corporate default rate and risk premiums, 1990–2001 372.4 FDI and M&A in developing countries, 1991–2001 382.5 FDI as ratio to GDP, 1991–2001 402.6 Regional trends of FDI flows, 1991–2001 422.7 North-South and South-South FDI, 1991–1999 42
3.1 Five-year rolling correlation between savings and investment, 1974–1999 573.2 FDI-to-GDP ratios, 1991–2000 593.3 Foreign direct investment in mining exploration and government policies 643.4a Foreign bank presence in poor countries 653.4b Foreign bank presence in Africa 653.5 Effect of greater foreign bank presence on intermediation costs and domestic bank
profitability 663.6 Effect of greater foreign bank presence on international bank lending to poor countries 673.7 Effect of greater foreign bank presence on nonperforming loans 683.8 Capital outflows from developing countries, 1985–99 703.9 Cumulated outflows and minerals exports 733.10 Capital account restrictions 74

vi
G L O B A L D E V E L O P M E N T F I N A N C E
4.1 ODA from donor countries in relation to their GNP, 1990–2000 944.2 Compliance with conditionality and economic performance 1014.3 NPV of external debt of the 24 countries that reached their HIPC decision point 105
Boxes1.1 The Doha Development Agenda 17
2.1 Evidence of changes in the appetite for risk and capital market flows 362.2 The concentration of FDI flows 392.3 Round-tripping of capital flows between China and Hong Kong 412.4 Financial market contagion from the Argentine crisis 442.5 Moral hazard and rescue packages 46
3.1 Improving market access through future-flow securitization 583.2 The investment climate and domestic investment 603.3 Capital outflows from the middle-income countries 723.4 Narrowly focused capital controls in emerging markets 75
4.1 The PRSPs 914.2 The Financing for Development (FfD) process 924.3 The relationship between private and multilateral flows in poor countries 984.4 Official guarantees and the Mozal project 109
vii
THIS REPORT WAS PREPARED BY THE ECO-
nomic Policy and Prospects Group, anddrew on resources throughout the Devel-
opment Economics Vice-Presidency, the EconomicPolicy Sector Board, the World Bank operationalregions, the International Finance Corporation,and the Multilateral Investment Guarantee Asso-ciation. The principal author was William Shaw,with direction by Uri Dadush. Chapter 1 was ledby Hans Timmer, with contributions by JohnBaffes, Betty Dow, Caroline Farah, FernandoMartel Garcia, Bernard Hoekman, Robert Key-fitz, Annette I. De Kleine, Robert Lynn, DonaldMitchell, Mick Riordan, Virendra Singh, ShaneStreifel, Dominique van der Mensbrugghe, andBert Wolfe. Chapters 2–4 were largely prepared bythe international finance team of the EconomicPolicy and Prospects Group, including GholamAzarbayejani, Shweta Bagai, Maria Pia Iannarello,Himmat Kalsi, Eung Ju Kim, Aparna Mathur,Sanket Mohapatra, Shoko Negishi, Bilin Neyapti,Malvina Pollock, Dilip Ratha, and Jeff Ziarko.Additional contributions and background paperswere provided by Dilek Aykut, Punam Chuhan,and Barry Eichengreen (chapter 2); Sara Calvo,Stijn Claessens, Susan Collins, Sebastian Edwards,Simon Evenett, Nagesh Kumar, Jeffrey Lewis,Deepak Mishra, Koh Naito, Claudine Ndayiken-gurutse, Andrew Powell, Jaya Prakash Pradhan,Felix Remy, Tony Thompson, Esen Ulgenerk,Aristomene Varoudakis, and Peter van der Veen(chapter 3); and Paul Collier, David Dollar, RobertKeyfitz, and Dan Morrow (chapter 4). Appendix1 was prepared by Ibrahim Levent, appendix 2 byEung Ju Kim, and appendix 3 by Malvina Pollock.Appendix 4 was prepared by Caroline Farah,Robert Keyfitz, Annette I. De Kleine, Robert Lynn,
Mick Riordan, and Virendra Singh, and benefitedfrom the guidance of the Bank’s regional chiefeconomists. Appendix 5 was prepared by JohnBaffes, Betty Dow, Don Mitchell, and ShaneStreifel. The financial flow and debt estimateswere developed in a collaborative effort by PunamChuhan, Nevin Fahmy, Shelley Fu, Ibrahim Lev-ent, and Gloria Moreno of the Financial DataTeam along with Himmat Kalsi, Eung Ju Kim, andMalvina Pollock of the Economic Policy and Pros-pects Group. The report was prepared under thegeneral direction of Nicholas Stern.
Many others from inside and outside the Bankprovided input, comments, guidance, and supportat various stages of the report’s publication. Ger-ard Caprio, Paula Donovan, Guy Pfeffermann,and Sanjivi Rajasingham were discussants at theBankwide review. Sebastian Edwards, ShahrokhFardoust, Jan Willem Gunning, Jim Hanson, andStephen O’Connell provided extensive reviews ofindividual chapters. Comments were provided byJehan Arulpragasam, Amarendra Bhattacharya,Jaime Biderman, Gerard Caprio, Haydee Celaya,James Emery, Alan Gelb, Ian Goldin, CharleenGust, Daniel Kaufman, Jeni Klugman, Stefan Koe-berle, Jacob Kolster, Richard Newfarmer, JohnPage, Enrique Rueda-Sabater, Sudhir Shetty, PhilipSuttle, Axel van Trotsenburg, and Ulrich Zachau.Comments were also received from the Interna-tional Monetary Fund. Mark Feige edited the re-port to highlight the main messages. AwatifAbuzeid and Katherine Rollins provided assis-tance to the team. Robert King managed dissemi-nation and production activities by the EconomicPolicy and Prospects Group. Book design, editing,production, and dissemination were coordinatedby the World Bank Publications team.
.
The Report Team

viii
GLOBAL DEVELOPMENT FINANCE WAS
formerly published as World Debt Tables.The new name reflects the report’s ex-
panded scope and greater coverage of private fi-nancial flows.
Global Development Finance consists of twovolumes: Analysis and Summary Tables and Coun-try Tables. Analysis and Summary Tables containsanalysis and commentary on recent developmentsin international finance for developing countries.Summary statistical tables are included for selectedregional and analytical groups comprising 148countries.
Country Tables contains statistical tables onthe external debt of the 136 countries that reportpublic and publicly guaranteed debt under theDebtor Reporting System. Also included are tablesof selected debt and resource flow statistics for in-dividual reporting countries, as well as summarytables for regional and income groups.
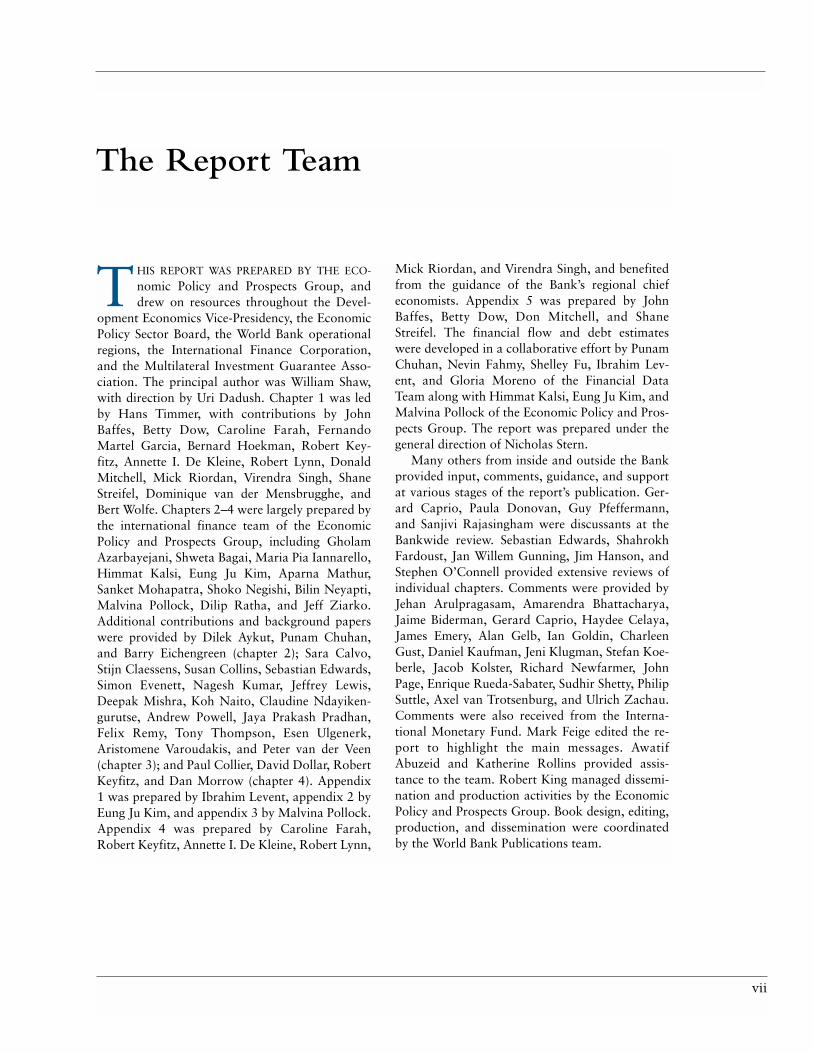
For the convenience of readers, charts on pagesx to xii summarize graphically the relation between
debt stock and its components; the computation offlows, aggregate net resource flows, and aggregatenet transfers; and the relation between net resourceflows and the balance of payments. Exact defini-tions of these and other terms used in Global De-velopment Finance are found in the Sources andDefinitions section.
The economic aggregates presented in the ta-bles are prepared for the convenience of users;their inclusion is not an endorsement of their valuefor economic analysis. Although debt indicatorscan give useful information about developments indebt-servicing capacity, conclusions drawn fromthem will not be valid unless accompanied by care-ful economic evaluation. The macroeconomic in-formation provided is from standard sources, butmany of them are subject to considerable marginsof error, and the usual care must be taken in inter-preting the indicators. This is particularly true forthe most recent year or two, when figures are pre-liminary or subject to revision.
Preface
.

ix
CIS Commonwealth of Independent StatesCPPR Country Portfolio Performance ReviewDAC Development Assistance Committee
(of the OECD)DCB debt conversion bondDDSR debt and debt service reductionDRS Debtor Reporting System (of the World Bank)EI eligible interest bondEMBI Emerging Market Bond IndexEPZ export processing zoneEU European UnionFDI foreign direct investmentFfD Financing for DevelopmentFLIRB front-loaded interest reduction bondFRN floating-rate noteG-7 Group of Seven (Canada, France,
Germany, Italy, Japan, United Kingdom,United States)
GATS General Agreement on Trade in ServicesGDP gross domestic productGNI gross national incomeHIPC heavily indebted poor countriesHIV human immunodeficiency virusIBRD International Bank for Reconstruction and
Development (of the World Bank Group)ICT information and communications technologyIDA International Development Association
(of the World Bank Group)IFC International Finance CorporationIMF International Monetary FundLIBOR London interbank offered rateLILIC less indebted low-income countryLIMIC less indebted middle-income countryM&A mergers and acquisitions
Mercosur Southern Cone Common Market (Argentina,Brazil, Paraguay, Uruguay; Bolivia andChile are associate members)
MILIC moderately indebted low-income countryMIMIC moderately indebted middle-income countryMUV manufacturing unit valueMYRA multiyear rescheduling agreementNAFTA North American Free Trade AgreementNBC National Bank of Commerce (Tanzania)NGO nongovernmental organizationNIE newly industrialized economyNPV net present valueOA official aidODA official development assistanceOECD Organisation for Economic Co-operation
and DevelopmentOPEC Organization of Petroleum Exporting
CountriesPRSC Poverty Reduction Support CreditPRSP Poverty Reduction Strategy PaperREER real effective exchange rateSDR special drawing right (of the International
Monetary Fund)SILIC severely indebted low-income countrySIMIC severely indebted middle-income countrySMEs small and medium enterprisesU.N. United NationsUNCTAD United Nations Conference on Trade
and DevelopmentURR unremunerated reserve requirementVAR vector autoregressionWTO World Trade OrganizationXGS exports of goods and services
.
Acronyms and Abbreviations
Dollars are current U.S. dollars, unless otherwise specified.
x
Debt stock and its components
Total external debt(EDT)
Short-term debtLong-term debt
(LDOD)
by debtor
Private nonguaranteed debt
Public and publiclyguaranteed debt
by creditor
Private creditors
Multilateral Bilateral Commercialbanks
Bonds Other
Use of IMF credits
Official creditors

xi
Principal repayments
Aggregate net resource flows and net transfers (long-term) todeveloping countries
Loan disbursements
Foreign direct in-vestment (FDI), portfolio equity
flows, and officialgrants
Net transfers ondebt
Interest payments
minus
equals
minus
equals
Debt service(LTDS)
Aggregate net resource flows
Aggregate nettransfers
Loan interest and FDI profits
minus
equals
Net resource flows on debt
plus equals
Note: Includes only loans with an original maturity of more than one year (long-term loans). Excludes IMF transactions.

xii
Credits Debits
• Exports of goods and services • Imports of goods and services
• Income received • Income paid
• Current transfers • Current transfersIncluding workers’ remittances andprivate grants
• Official unrequited transfers (by foreign • Official unrequited transfers (by national governments) government)
• Official unrequited transfers (by foreign • Official unrequited transfers (by national governments) government)
• Foreign direct investment (by nonresidents) • Foreign direct investment (by residents)(disinvestment shown as negative) (disinvestment shown as negative)
• Portfolio investment (by nonresidents) • Portfolio investment (abroad by (amortizations shown as negative) residents) (amortizations shown as
negative)
• Other long-term capital inflows (by • Other long-term capital outflow (by nonresidents) (amortizations shown residents) (amortizations shown as as negative) negative)
• Short-term capital inflow • Short-term capital outflow
Net changes in reserves
Aggregate net resource flows (long-term) and the balance of payments
Current account
Capital and financial account
Reserve account
Aggregate net resource flows
Net resource flows on debt (long-term)


Overview: International Finance and the Poorest Developing Countries
THE INTEGRATION OF DEVELOPING COUN-
tries into the global economy increasedsharply in the 1990s with improvements in
their economic policies; the massive expansion ofglobal trade and finance driven by technologicalinnovations in communications, transport, anddata management; and the lowering of barriers totrade and financial transactions. Many of the poor-est developing countries1 participated strongly inthis process despite their limited access to capitalmarkets. This report analyzes the interaction be-tween the global expansion of finance and im-provements in domestic policies in the poor coun-tries over the 1990s, and the implications forgrowth and poverty reduction. Three main mes-sages are developed: (a) a strong investment cli-mate is critical to attracting foreign capital andusing it productively; (b) poor countries’ increas-ing integration in the global economy means that they face similar policy challenges as middle-incomecountries, including how to deal with capital mo-bility; and (c) achieving the Millennium Develop-ment Goals will require a substantial rise in aidflows, an increased allocation of aid to countrieswith good policies, and improvements in policiesby both developing countries and donors.
A greater integration of poor countries and private capital—The surge in foreign direct investment (FDI) flowsand the decline in aid have transformed external fi-nance to the poor countries. FDI flows to the poorcountries rose from 0.4 percent of the gross domes-tic product (GDP) in the late 1980s to 2.8 percentin the late 1990s in response to the globalization ofproduction and improvements in domestic policies(see pages 59–61). Aid to these countries fell by 20
1
.
percent in real terms over the same period. Thepoor countries now receive about the same level ofFDI as middle-income countries, relative to the sizeof their economies. In addition, the global expan-sion of international banks coupled with the liber-alization of domestic financial systems in the poorcountries increased the average share of foreignbank assets to more than 40 percent of total assets,more than double the share of 1995 and compara-ble to that of many middle-income countries thathave recently benefited from increased foreignbank participation (see pages 64–66).
—good policies and governance, along withstrong institutions, are critical to using privateflows productivelyA rise in private flows can have a substantial im-pact on investment in the poor countries and, ifproductively used, on growth. However, the policyframework must be right. Improvements in the in-vestment climate (a term that refers to the numer-ous ways in which government affects the produc-tivity of investment, including policies, governance,and the strength of institutions) have boosted theimpact of international financial transactions onproductivity in the poor countries. Domestic firmsin countries with strong investment climates aremore able to absorb the foreign technology andskills that come with FDI (see pages 62–63). Betterpolicies have enabled some poor countries to at-tract more diversified FDI flows—the share ofcountries that export natural resources in the poorcountries’ FDI dropped from half in 1991 to 20percent toward the end of the decade. Countriesthat established the competitive conditions re-quired to attract foreign banks experienced an im-provement in the efficiency of their domestic banks

G L O B A L D E V E L O P M E N T F I N A N C E
and thus a decline in the cost of financial interme-diation (see pages 66–69).
Poor countries face similar challengesfrom globalization as middle-incomecountries
The events of the past year underlined the risksof capital mobility for the middle-income
emerging markets. The current global economicslowdown, exacerbated by the bursting of the high-tech bubble at the end of 2000 and the terrorist at-tacks in September 2001, is exceptionally deep andbroad (see pages 7–11). Capital market flows onceagain proved to be procyclical: the growth slow-down in industrial countries reduced both emerg-ing markets’ export revenues and their access to ex-ternal finance (see pages 32–36). By contrast, thelevel of FDI in 2001 was virtually unchanged fromthe previous year despite adverse global conditions,including a drop in global FDI flows (see pages37–40). The crisis in Argentina illustrates howopen capital accounts can compound the effects ofunsustainable macroeconomic policies and highpublic sector debt, thus seriously complicating sta-bilization efforts (see pages 43–47).
The poor countries are also vulnerable to capi-tal mobility. While most still impose restrictions oncapital account transactions, controls have hadonly limited success in controlling capital outflowsin the context of a weak investment climate, wheredomestic investment opportunities are limited andfears of confiscation or reduction in the value ofassets provide considerable incentive to put moneyabroad (see pages 69–78). Poor countries with bet-ter than average policies (as measured by theWorld Bank) had more success in retaining domes-tic capital: a rough estimate of the stock of theircapital outflows relative to GDP was about one-sixth the size in poor countries with worse than av-erage policies. Capital outflows have been morevolatile in the poor countries than in the middle-in-come countries, while volatility can be more costly(in terms of welfare) in poor countries becausemore people live close to subsistence and have littleprivate insurance or public safety nets. Thus poli-cymakers in poor countries need to recognize thepotential impact of capital mobility on both stabi-lization policies and long-term development.
Good policies and strong governanceare also key to improving aideffectiveness
Earlier empirical studies consistently found aweak relationship between aid and investment,
with even less of an impact of aid on growth. How-ever, more recent research shows that aid makes an effective contribution to growth and poverty re-duction in countries with good economic policies,sound institutions, and strong governance, but haslittle effect in countries with poor policies. A dou-bling of aid flows would help ensure that develop-ing countries achieve the Millennium DevelopmentGoals, provided that this aid is allocated to coun-tries with good policies and large numbers of poorpeople (pages 99–100).
Aid continued to decline in 2001, and the pros-pects for a substantial rise in the medium term arelimited (pages 90–94). Most countries with goodpolicies can continue to absorb additional aid re-sources without seriously impairing the effective-ness of that aid (see pages 96–99). Aid does not, ingeneral, increase the volatility of government re-sources, and appropriate policies can ensure thataid does not contribute to inflationary pressures orcause excessive exchange-rate appreciation. It istrue that even in many countries with good poli-cies, lack of administrative capacity lowers themarginal productivity of aid as aid levels rise.However, recent research indicates that aid levelsto most countries with strong economic programsare well below the threshold where aid becomesineffective.
Better aid policies by donors alsocontribute to poverty reduction
There is evidence that donors have made pro-gress in improving their own policies, through
increasing resources to debt relief for good per-formers, easing complex administrative require-ments that can strain limited government capacity,and reducing the share of tied aid (see pages101–104). Modifications of adjustment assistancehave helped to preserve the use of conditionality inchanneling aid resources to good performers andsupporting the credibility of government policies,while ensuring adequate government flexibilityand domestic stakeholder commitment to the pro-
2

3
O V E R V I E W : I N T E R N A T I O N A L F I N A N C E A N D T H E P O O R E S T D E V E L O P I N G C O U N T R I E S
gram. Here also, recipient government policies arekey: strong leadership and effective administrationby the government can help promote aid coordina-tion and make it easier for donors to adopt moreflexible policies.
Note1. The poor countries are defined to represent developing
countries with relatively low per capita income and almostno access to international capital markets. The group in-cludes all IDA-only countries plus a few blend countries thathave had few IBRD loans over the past few years. The coun-tries included are Afghanistan, Albania, Angola, Armenia,Bangladesh, Benin, Bhutan, Bolivia, Burkina Faso, Burundi,
Cambodia, Cameroon, Cape Verde, Central African Repub-lic, Chad, Comoros, the Democratic Republic of Congo, theRepublic of Congo, Côte d’Ivoire, Djibouti, Eritrea, Ethi-opia, The Gambia, Georgia, Ghana, Guinea, Guinea-Bissau,Guyana, Haiti, Honduras, Kenya, Kiribati, the Kyrgyz Re-public, the Lao People’s Democratic Republic, Lesotho,Liberia, Madagascar, Malawi, Maldives, Mali, Mauritania,Moldova, Mongolia, Mozambique, Myanmar, Nepal,Nicaragua, Niger, Nigeria, Pakistan, Rwanda, Samoa, SãoTomé and Principe, Senegal, Sierra Leone, Solomon Islands,Somalia, Sri Lanka, Sudan, Tajikistan, Tanzania, Togo,Tonga, Uganda, Vanuatu, Vietnam, Republic of Yemen,Zambia, and Zimbabwe. These countries’ average per capitaincome is under $500 per year compared with $2,900 forother developing countries. And most of them are small; onlyPakistan, Bangladesh, Nigeria, Vietnam, Ethiopia, and theDemocratic Republic of Congo have more than 50 millionpeople.


1Challenges for Developing Countries during the Coming Global Recovery
THE CURRENT GLOBAL ECONOMIC SLOW-
down is exceptionally deep and broad.Global growth in 2001, at 1.2 percent, was
2.7 percentage points lower than in 2000 (figure1.1). In the last 40 years the deceleration in grossdomestic product (GDP) was sharper only in1974, during the first oil crisis. The current slow-down is also broad in that the deceleration isequally rapid for industrial countries and develop-ing countries. The slowdown in economic activitycoincides with an unprecedented 14 percentagepoint deceleration of world trade, from recordgrowth of 13 percent in 2000 to a 1 percent de-cline in 2001 (table 1.1). However, contrary tomany earlier downturns, inflationary pressures re-mained very subdued and this allowed monetaryauthorities to loosen their policies substantially.
The bursting of the high-tech bubble at the endof 2000 and the terrorist attacks in September2001 made the deceleration of the global economyso exceptionally sharp. The unpredictable charac-ter of these events made it difficult to anticipate thedepth of the downturn. Nevertheless, after the ter-rorist attacks the expectations—a deeper recessionand a delay of the recovery by one or two quar-ters—appear to be materializing.1 Several of thestrong market reactions to the terrorist attackshave been reversed and signs of a recovery in theUnited States and the high-tech sectors have startedto mount.
Even during this unusually synchronized down-turn, the intensity and character of the economicmalaise differ across countries, sectors, and incomegroups. Especially hard hit are countries dependenton commodity exports, with many commodityprices at historical lows; highly indebted emergingeconomies, because private investors have reduced
5
.
their exposure in emerging markets in reaction toincreased uncertainty, reduced value of portfolios inindustrial countries, and increased default provi-sions; high-tech sectors, with many firms decimatedafter the high-tech bubble burst; and tourism indus-tries, suffering from the aftermath of the terroristattacks. As in every severe downturn, poor peoplepay a high price. Without buffers or safety nets torely upon, their ability to satisfy basic needs is im-mediately at stake when incomes decline.
The current sharp deceleration in economicactivity largely follows a typical investment andinventory cycle, even if it was triggered by otherfactors, such as the bursting of the high-tech bub-ble or the terrorist attacks. Likewise, the standardinvestment cycle is expected to play a major role in recovery. The steep decline in investment andstock building in recent quarters carries seeds for aforceful cyclical recovery. As capital stocks and in-ventories are adjusted downward to reflect lowergrowth expectations, the decline in investment andstock-building tends to become less steep and ac-tivity starts to rebound. The rebound will be fur-ther fueled by aggressive monetary and fiscal stim-ulus, especially in the United States. The currentsynchronism of the cycles in different parts of theworld will likely be reflected in a strong global re-covery, even if recovery in individual countries isnot exceptionally vigorous.
The economic consequences of the terroristattacks probably delayed this rebound by abouttwo quarters, implying strong growth in the sec-ond half of 2002. Weak growth in the second half of 2001 and the first half of 2002 is expectedto keep global growth in 2002 at 1.3 percent,slightly above growth rates for 2001. This outlookimplies a downward adjustment since the publica-

G L O B A L D E V E L O P M E N T F I N A N C E
tion of Global Economic Prospects 2002 (WorldBank 2001), mainly reflecting more pessimisticviews on Japan and Latin America. World tradecould very well decline in 2002 for a second yearin a row. However, an anticipated acceleration inthe second half of 2002 will likely result in a strongrecovery in annual growth for 2003. Althoughglobal GDP growth in 2003 of 3.6 percent wouldfall short of the strong 3.9 percent performance of 2000, advances in world trade are expected tobreach 8 percent.
Not all economies will benefit immediately fromthe robust global rebound. Argentina’s financialstrains have resulted in defaults and devaluation,heralding a protracted period of painful adjustment;but there is also hope that a new base can be cre-ated for resumption of long-term growth. As finan-cial weakness in Japan has worsened during theglobal downturn, a recovery of the external environ-ment can probably not avert, but only alleviate,structural adjustments. Commodity exporters, in-cluding oil producers, have experienced large terms-of-trade losses that will limit their short-term ability to rebound. The speed of recovery toward normaltrends in tourism is uncertain, leaving the prospectscloudy for many of the developing countries that areheavily dependent on this revenue source.
On average, however, developing countries’growth is expected to be robust in 2003 and 2004,reaching 5 percent per year. A strong recovery seems
achievable in the absence of additional adverseshocks to the global economy. Such a recoverywould be supported by modest inflation—medianinflation in the developing world is around 5.5percent, only half the average rate during the1990s—relatively low interest rates after the re-cent easing of U.S. monetary policy, rapidly grow-ing import demand in the industrial countries, anda slight rebound in real commodity prices. Ex-porters of high-tech products are likely to benefitmore than average from this recovery. The mainrisks to this favorable outlook are to be found infinancial markets. The fragile Japanese bankingsector may trigger more adverse developments thanis currently assumed, and the full complement oframifications stemming from financial crises in Ar-gentina and Turkey remains uncertain.
Many developing countries, even those thatcurrently do not have large financial imbalances,face difficult challenges. The global downturn andcountry-based policy responses to slowing growthhave reversed the trend of declining fiscal deficitsin many countries, and deterioration of deficitstend to persist well after economic growth has re-turned to normal levels. Some oil exporters—suchas Nigeria, the República Bolivariana de Vene-zuela, and Indonesia—are particularly vulnerable,as oil prices are expected to continue their down-ward trend. Furthermore, the global downturn im-plies a deterioration of the current account for
6
Percentage change
Figure 1.1 World and industrial and developing country GDP growth, 1997–2004
Source: World Bank Economic Policy and Prospects Group calculations.
0
1
2
3
4
5
6
1997 1998 1999
Forecast
Developingcountries
World
Industrialcountries
2000 2001 2002 2003 2004

C H A L L E N G E S F O R D E V E L O P I N G C O U N T R I E S D U R I N G T H E C O M I N G G L O B A L R E C O V E R Y
many developing countries. Together with limitedavailability of international private capital, thiscould generate new financial strains, which couldimpede further recovery.
Recession and recovery in theindustrial world
The United States, Japan, Germany, and severalsmaller industrial countries in Europe entered
into—or came close to—recession in the course of2001. Aggregate annual growth in the industrialworld decelerated from 3.4 percent in 2000 to 0.9percent in 2001. With almost all recessions havingstarted in the second half of 2001, it is unlikely thataggregate annual growth in 2002 will exceed 2001growth, even with a solid rebound in the secondhalf of the year. Indeed, measured growth is likelyto decline further, to only 0.8 percent. The advancein output in 2003, in contrast, is expected to returnto 3.1 percent, assuming that no major crisis evolves
7
Table 1.1 Global conditions affecting growth in developing countries and world GDP growth(percentage change from previous year, except interest rates and oil prices)
CurrentEstimate Current Forecasts GEP 2002 forecasts
2000 2001 2002 2003 2004 2001 2002 2003
Global conditionsWorld trade (volume) 13.1 –0.8 1.8 8.3 7.3 1.0 4.0 10.2
Inflation (consumer prices) G-7 OECD countriesab 1.9 1.7 0.9 1.6 1.8 1.8 1.4 1.5United States 3.4 2.8 1.5 2.4 2.6 2.8 2.2 2.3
Commodity prices (nominal dollars) Commodity prices, except oil (dollars) –1.3 –9.1 1.3 7.3 6.4 –8.9 1.6 8.1Oil price (dollars, weighted average),dollars a barrel 28.2 24.4 20.0 21.0 19.0 25.0 21.0 20.0
Oil price, percent change 56.2 –13.7 –17.9 5.0 –9.5 –11.3 –16.0 –4.8Manufactures export unit value (dollars)c –2.0 –1.4 –0.5 3.6 3.7 –4.6 4.0 4.4
Interest rates LIBOR, 6 months (dollars, percent)c 6.7 3.3 2.3 4.0 4.6 3.6 2.8 3.0EURIBOR, 6 months (euro, percent)d 4.5 4.0 3.0 4.0 4.2 4.1 3.3 3.3
World GDP (growth) 3.9 1.2 1.3 3.6 3.1 1.3 1.6 3.9High-income countries 3.5 0.8 0.8 3.2 2.6 0.9 1.1 3.5
OECD countries 3.4 0.9 0.8 3.1 2.5 0.9 1.0 3.4United States 4.1 1.1 1.3 3.7 3.1 1.1 1.0 3.9Japan 2.2 –0.8 –1.5 1.7 1.1 –0.8 0.1 2.4Euro Area 3.5 1.4 1.2 3.3 2.7 1.5 1.3 3.6
Non-OECD countries 6.6 –1.0 1.7 4.4 4.0 0.6 3.2 5.7Developing countries 5.4 2.8 3.2 5.0 4.9 2.9 3.7 5.2
East Asia and Pacific 7.4 4.6 5.2 6.9 6.5 4.6 4.9 6.8Europe and Central Asia 6.4 2.2 3.2 4.3 4.0 2.1 3.0 4.2Latin America and the Caribbean 3.8 0.6 0.5 3.8 3.8 0.9 2.5 4.5Middle East and North Africa 4.2 3.1 2.7 3.3 3.3 3.4 2.9 3.6South Asia 4.0 4.3 4.9 5.3 5.2 4.5 5.3 5.5Sub-Saharan Africa 3.1 2.6 2.6 3.6 3.6 2.7 2.7 3.9
Memorandum items East Asian crisis–affected countriese 7.1 2.3 3.5 5.9 5.5 2.3 3.4 5.4Transition countries of ECA 6.2 4.4 3.4 4.0 4.0 4.0 3.1 3.8Developing countries, Excluding the transition countries 5.3 2.6 3.2 5.2 5.0 3.1 3.8 5.5Excluding China and India 5.1 1.8 2.2 4.4 4.2 1.9 2.9 4.5
a. The G-7 countries are Canada, France, Germany, Italy, Japan, the United Kingdom, and the United States.b. Unit value index of manufactures exports for G-5 countries (G-7 minus Canada and Italy) to developing countries, expressed in dollars.c. London interbank offered for dollars.d. Interbank offered rate for euros.e. Indonesia, the Republic of Korea, Malaysia, the Philippines, and Thailand.Source: World Bank Economic Policy and Prospects Group, February 2002 forecast; Global Economic Prospects (GEP) 2002 projections ofOctober 2001.
G L O B A L D E V E L O P M E N T F I N A N C E
from the fragilities in the Japanese banking systemor other sources of tension in the forecast. Growthin 2004 is assumed to fall back to near its long-termtrend of 2.5 percent.
In the fall of 2000 the downturn still hadcharacteristics of a soft landing, with cyclical cor-rections that did not suggest one of the most se-vere decelerations in economic activity in decades.However, in two steps—the first initiated by theburst of the high-tech bubble at the end of 2000,and the second by terrorist attacks in September2001—the global economy decelerated further.
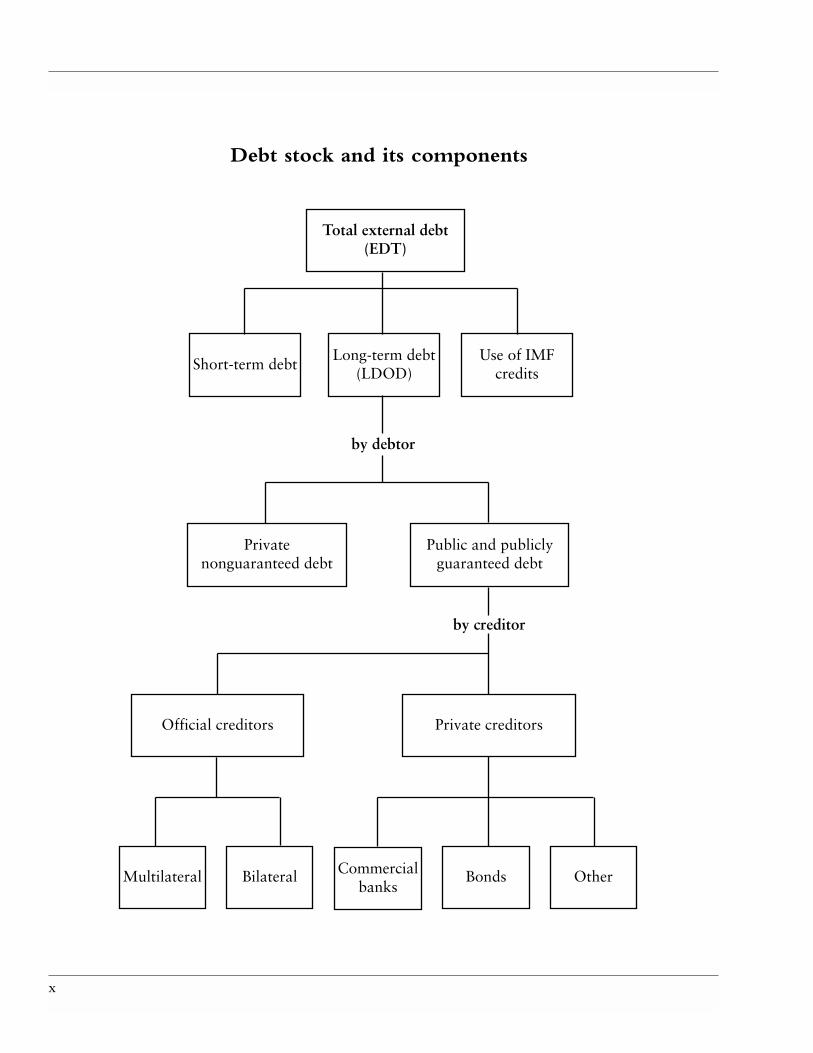
A three-phase slowdown—At the root of the simultaneous economic down-turn in all major industrial countries was a severeslowdown in manufacturing sectors (figure 1.2).That slowdown went through three phases. Thefirst phase began in the middle of 2000 with theslowdown in the United States, which was partly a reaction to the tightening of monetary policy by the Federal Reserve Board, a move designed to slow an economy that had been growing wellabove capacity. Production of traditional durablesdeclined, and production in high-tech sectorsstarted to slow. The latter was partly a reaction tothe high-tech investment bubble that had beenswelling since 1998, especially in the United States,and then burst. Japan and the European economiesclearly lagged in the downturn.
The second phase began at the end of 2000when the recession in durable goods had begun tobottom out, but the high-tech bubble burst yet fur-ther, forcing stock markets into sharp declinewhile high-tech production started to fall at dra-matic rates (figure 1.3). Japanese output, highlydependent on high-tech exports, declined precipi-tously. The fall in exports and the accompanyingdrop in equity prices exacerbated the bad-loanproblems in the Japanese banking sector, whichcould not escape the spiral of defaults and thinmargins in a deflationary environment. In Europe,signals were mixed in the beginning of this phase.Since European growth in 2000 hardly exceededits long-term capacity trend, the internal cyclicalforces were much weaker than in the United States.However, the slowdown in world trade affectedthe manufacturing sectors, while the Europeantelecommunications industry shared the fate of theglobal high-tech sectors as future profitability wassuddenly reassessed. The European Central Bankhesitated to ease monetary policy in the face of in-flationary pressures originating from temporaryincreases in food prices due to livestock diseases,high oil prices, and a weak euro. The slowdown,first apparent in Germany, gradually spread to sev-eral other European countries.
The terrorist attacks in September 2001marked the start of the third phase. At that time therecessions in manufacturing production had more
8
Percentage change, three-month/three-month, seasonally adjusted annual rate
Figure 1.2 Manufacturing production in the G-3 countries 2000–02
Source: National statistics and World Bank Economic Policy and Prospects Group calculations.
–18
Jan.2000
March2000
May2000
July2000
Sept.2000
Germany
United States
Japan
Nov.2000
Jan.2001
March2001
May2001
July2001
Sept.2001
Nov.2001
Jan.2002
–12
–6
0
6
12
18

C H A L L E N G E S F O R D E V E L O P I N G C O U N T R I E S D U R I N G T H E C O M I N G G L O B A L R E C O V E R Y
or less bottomed out, albeit for Japan and theUnited States at still large declining rates. The pe-riod immediately after the terrorist attacks wascharacterized by an extraordinary, but temporary,loss of consumer confidence and deterioration ofbusiness sentiment (figure 1.4). Equity prices plum-meted 15 percent immediately after the attacks,spreads on junk bonds jumped 200 basis points
within weeks, and commodities prices fell 7 percentwithin one month. Industrial production dippedonce again, although it seemed that the high-techcycle was less affected (figure 1.3). While these firstmarket reactions were reversed within one quarter,economic recovery will probably be delayed byabout two quarters as a result of supply disruptionsand shaken confidence.
9
Percentage change, three-month moving average, seasonally adjusted annual rate
Figure 1.3 U.S. manufacturing output, high-tech and non-high-tech industries
Source: Federal Reserve, through Datastream.
10.0
7.5
5.0
2.5
0.0
–2.5
–5.0
–7.5
–10.0
Excluding high-tech(left axis)
High-tech(right axis)
–30
–15
0
15
30
45
60
75
Jan.2000
March2000
May2000
July2000
Sept.2000
Nov.2000
Jan.2001
March2001
May2001
July2001
Sept.2001
Nov.2001
Jan.2002
EC: diffusion Index; U.S. and Japan Indexes, January 2001=100
Figure 1.4 Consumer confidence in the United States, the Euro Area, and Japan
Source: U.S.: Conference Board; Japan: ERISA; Euro Area: European Commission.
65Jan. 2001 March 2001 May 2001 July 2001 Sept. 2001 Nov. 2001 Jan. 2002
Euro Area(right axis)
Japan (left axis)
United States(left axis)
75
85
95
105
115
–12
–10
–8
–6
–4
–2
0
2

Table 1.2 Initiating factors: turning points to downturn and recovery in OECD recessions(changes in contribution to growth, at seasonally adjusted annualized rates)
Downturn Contributions Recovery Contributions
Change in Change in Starting quarter GDP growth Principal sources Ending quarter GDP growth Principal sources
United StatesMid-1970s Q1, 1974 –6.4 S: –4.6 C: –1.6 Q2, 1975 6.0 S: 3.6 I: 1.9Early 1980s Q4, 1981 –9.5 S: –4.8 C: –3.2 Q4, 1982 3.8 I: 1.4 C: 1.3Early 1990s Q4, 1990 –2.8 C: –1.5 I: –1.0 Q1, 1991 2.8 C: 2.1 S: 0.9Current Q3, 2001 –1.3 I: –1.1 C: –0.7 — — — —
JapanMid-1970s Q3, 1973 –6.1 S: –3.3 I: –3.3 Q1, 1975 5.5 C: 2.4 I: 2.3Early 1990s Q2, 1993 –3.5 G: –1.7 S: –0.8 Q3, 1992 1.0 S: 0.9 G: 0.6Asia crisis–present Q2, 1997 –7.3 C: –7.1 I: –1.5 — — — —
EuropeMid-1970s Q4, 1974 –3.6 S: –3.8 C: –1.6 Q3, 1975 3.4 I: 1.4 S: 1.4Early 1980s Q2, 1980 –3.5 C: –2.1 I: –1.4 Q3, 1980 1.2 X: 0.8 I: 0.5Mid-1990s Q2, 1992 –2.4 I: –1.0 C: –0.9 Q2, 1993 2.0 C: 2.1 I: 0.7Current Q2, 2001 –1.7 X: –1.9 C: –0.6 — — — —
— Not available.Notes: GDP growth and contributions by expenditure component are expressed as the change in GDP growth and contributions to growth,measured (1) for “downturn”: average of one or two quarters prior to the turning point, and (2) for “recovery”: turning point to the averageof two quarters following. Principal sources: C=private consumption, G=government expenditures, I=gross fixed investment, S=change instocks, X=net exports of goods and services. Source: World Bank Economic Policy and Prospects Group calculations.
G L O B A L D E V E L O P M E N T F I N A N C E
The prolongation and deepening of the down-turn in the aftermath of the terrorist attacks madethis recession comparable in intensity to the reces-sions of the early 1980s and 1990s, at least for in-dustrial countries. Although the downturn in indi-vidual countries has not necessarily been as deep asduring those two severe recessions, its simultane-ous character made the current slowdown espe-cially sharp for the industrial world as a whole.Experience during the last decades suggests that the turning point to positive growth will probablybe triggered by the investment cycle, and that reces-sions of this magnitude tend to result in a dete-rioration of fiscal balances that typically lasts forthree or more years. The sharp fall in privatespending implies an improvement of the currentaccount in the short run, despite increased fiscaldeficits. The mirror image of the industrial coun-tries’ reduced current account deficit is the ten-dency of current account surpluses to narrow anddeficits to widen in the developing world. The re-mainder of this section will discuss triggers of turn-ing points in economic activity and the behavior ofgovernment balances in the industrial world. In-creased trade linkages have made developing coun-tries more dependent on these turning points in theindustrial countries’ business cycles, and as the cur-
rent account surpluses of developing countries startto decline, a deterioration of government balancescould increase tensions in global capital markets.
—largely driven by investment cyclesThe deep recessions and subsequent recoveries inthe United States during the last three decadeswere primarily the reflection of inventory and in-vestment cycles.2 Table 1.2 summarizes the mainsources of change in GDP growth at the beginningand end of recessions. In the majority of U.S. re-cessions since the 1970s, changes in investment orinventories were the main source of changes inGDP growth, both at the start and close of eachrecession. With the structural decline in invento-ries through the use of new technologies and just-in-time supply systems, the inventory cycle, stilldominant in the 1970s and 1980s, has become lessimportant. The investment cycle was the maincontributing factor in the current recession, andinvestment will likely be the force that brings GDPgrowth out of negative territory. As capital stocksadjust downward, the decline in investment rateswill soften, reversing the downward spiral.
Table 1.2 highlights the fact that net exportshave been a relatively more important factor de-termining the dynamics of recessions in Europe
10

C H A L L E N G E S F O R D E V E L O P I N G C O U N T R I E S D U R I N G T H E C O M I N G G L O B A L R E C O V E R Y
than in the United States. The inventory cycle hasnever been as important in Europe as in the UnitedStates. This could reflect the less pronounced do-mestic business cycles in Europe, which has moreautomatic stabilizers in place, as well as greaterregional diversity in monetary and fiscal policies.Note that the recent downturn in Europe was trig-gered mainly by swings in international trade,rather than by changes in domestic consumption,investment, or inventories. It is thus likely that theinternational trade cycle will also be an importantingredient of the recovery, in which case Europewill lag behind the United States in the rebound.
Japan is the odd one out in this picture. Re-cessions were avoided during the 1980s due tostrong, continuous growth in investment and pro-ductivity. However, investment growth has beendeclining since the early 1990s, when structuralgrowth rates fell, financial bubbles burst, andproblems in the banking sector began to mount.This trend was so strong that it overwhelmed thetendency for investment to experience sharp cycli-cal changes. As a result, investment failed to playthe standard role of initiating a turning point ineconomic activity. This is one reason why Japanstaggered from one recession into another duringthe 1990s, and why it is not easy to identify asource that could reverse the current downturn.
Policy is supportive, but will operate with some delay—Policies will play an important role in the recoveryof the industrial countries. Monetary policy hasnow turned highly expansionary in the UnitedStates, and with some delay, has eased in the EuroArea. In Japan the economy remains in a state ofdeflation (consumer prices have declined for thepast two years), and interest rates can hardly fallany further. Given the lack of headroom for alter-native action, the Bank of Japan initiated a pro-gram of liquidity injections—potentially weakeningthe yen as a way to combat deflation and stimulateexports.
The effects of monetary easing are likely to befelt with some lag, and should provide a neededfillip to demand for consumer durables and hous-ing across the Organisation for Economic Co-operation and Development (OECD) countries.But there is concern that the eventual impact oflower interest rates on business investment may belimited. In particular, investor risk aversion has
risen significantly, depressing investment in high-risk assets, especially in the United States. In Japan,financial markets are burdened by the accumulateddebt of failed businesses, which has reached ¥50trillion ($420 billion) since 1999, of which ¥16trillion accrued during 2001. This has exacerbatedthe “bad loan” problems of the commercial bank-ing system, adding new nonperforming assets al-most as quickly as “old” nonperforming loans arewritten off. Under these circumstances, additionalBank of Japan liquidity is unlikely to greatly in-crease the willingness of Japanese commercialbanks to lend, and signs of a credit crunch for thesmall-business sector may be emerging.
Fiscal policy also offers promise for boostinggrowth, especially in the United States. The U.S.Congress approved more than $40 billion in emer-gency and industry-support funds in the immedi-ate aftermath of September 11. Moreover, tax re-ductions enacted earlier in 2001 will continue tobe implemented over the next few years. In theEuro Area, automatic stabilizers will tend to in-crease public deficits, but the constraints inherentin the Stability and Growth Pact of the EuropeanUnion could limit government support for slowingeconomies.3 In Japan debate continues regardingthe degree and nature of supplemental budget pro-grams, against the background of Prime MinisterJunichiro Koizumi’s stated limits to bond-marketfunding of such efforts. On balance, fiscal stimulusis likely to be a significant additional driving forcefor recovery in the major industrial economies,particularly for the United States.
However useful and needed the fiscal stimulusmay be in the short term, increased deficits couldbecome a burden in the medium run. Historically,deficits that originated in severe downturns tend tolast well beyond the recovery in economic activity(figure 1.5). After the brief and steep recession fol-lowing the first oil crisis in the mid-1970s, the aver-age fiscal deficit (as a share of GDP) in the OECDturned from positive to negative, never again to re-turn to positive territory. After the second oil crisis,it took a decade for the deficits to come back closeto precrisis levels, and after the Gulf War this tookfive years. The stubbornness of deficits is partlydue to the vicious circle of higher debt and increas-ing debt service, and partly due to the temptationto see recessions as unique, temporary phenomenaand a subsequent recovery as a permanent im-provement. While the deterioration of government
11

G L O B A L D E V E L O P M E N T F I N A N C E
deficits is often abrupt, the restoration tends to besmoothed out over time. Of course, many regionaldifferences and different policy decisions deter-mined the trend in the average deficit. Neverthe-less, the historical pattern of persistent deficits isclear, and the main challenge in the current reces-sion is to keep the necessary stimulus confined tothe short run. In the medium run, improvement inthe industrial countries’ fiscal deficits will facilitatea resumption of capital flows toward developingcountries.
—auguring a strong recovery in 2003 Taking into account the likely impact of the inven-tory and investment cycles, and the policy re-sponses, we anticipate that the United States willcome out of the recession in the beginning of 2002and European countries will follow one or twoquarters later, but Japan will hardly reach positivegrowth during the year—resulting in annual 2002growth rates of 1.3, 1.2, and –1.5 percent respec-tively for these countries (figure 1.6). As industrialproduction, investment, and global trade pick uprapidly over the course of the year, 2003 is ex-pected to provide a much rosier picture, with GDPgrowth climbing to 3.7, 3.3, and 1.7 percent in thethree industrial centers. If banking problems inJapan remain unsolved, a relapse into low or nega-tive growth after a temporary export-led recoveryin that country cannot be excluded.
The U.S. current account deficit, which al-ready diminished to $420 billion in 2001 from$445 billion in 2000, as a result of recession andfalling oil prices, is expected to deteriorate onlymodestly over the next two years. The adjustmentin 2002 and coming years is expected to be accom-panied by a gradual weakening of the dollar and awidening of current account deficits in some Euro-
12
GDP percentage change; fiscal balance: percentage of GDP
Figure 1.5 OECD GDP growth and fiscal balance, 1970–2000
Source: OECD.
–6
1970 1973 1976
GDP growth
Fiscal balance
1979 1982 1985 1988 1991 1994 1997 2000
–4
–2
0
2
4
6
Figure 1.6 GDP growth in the industrialcountries, 2001–04
Source: World Bank Economic Policy and ProspectsGroup calculations.
United States Euro Area Japan–2
0
2
4
2001 2002 2003 2004
Percentage change
C H A L L E N G E S F O R D E V E L O P I N G C O U N T R I E S D U R I N G T H E C O M I N G G L O B A L R E C O V E R Y
pean countries. The Japanese current account sur-plus declined substantially in 2001 because thelatest recession in Japan was driven mainly by adecline in exports instead of a deceleration in in-vestment. Because Japanese investment is also notlikely to recover strongly in the near future, thecurrent account surplus is expected to widen againwhen world trade, and Japanese exports, rebound.The current account deficit for the industrial coun-tries as a whole is expected to decline from $280billion in 2000 to $240 billion by 2004, most ofthe improvement being realized in the near term.The mirror image of this development is a reducedcurrent account surplus in the developing coun-tries, partly reflecting declining oil prices and partlyreflecting reduced export opportunities.
Bust and boom in world trade
World trade, already undergoing the sharpestdeceleration on record, suffered additional
setbacks following the terrorist attacks of Septem-ber 11. These events delayed the expected recoveryin output, which will in turn delay the rebound inmerchandise trade for one or two quarters. More-over, security concerns disrupted trade flows, as didincreased shipping and insurance costs, althoughmedium-term effects arising from these develop-ments are more uncertain. The attacks also reduceddeveloping countries’ revenues from internationaltourism. However, longer-run prospects for globaltrade have improved after a first important step to-ward a new round of trade negotiations was madeat the World Trade Organization (WTO) minister-ial conference in Doha, Qatar, in November 2001.
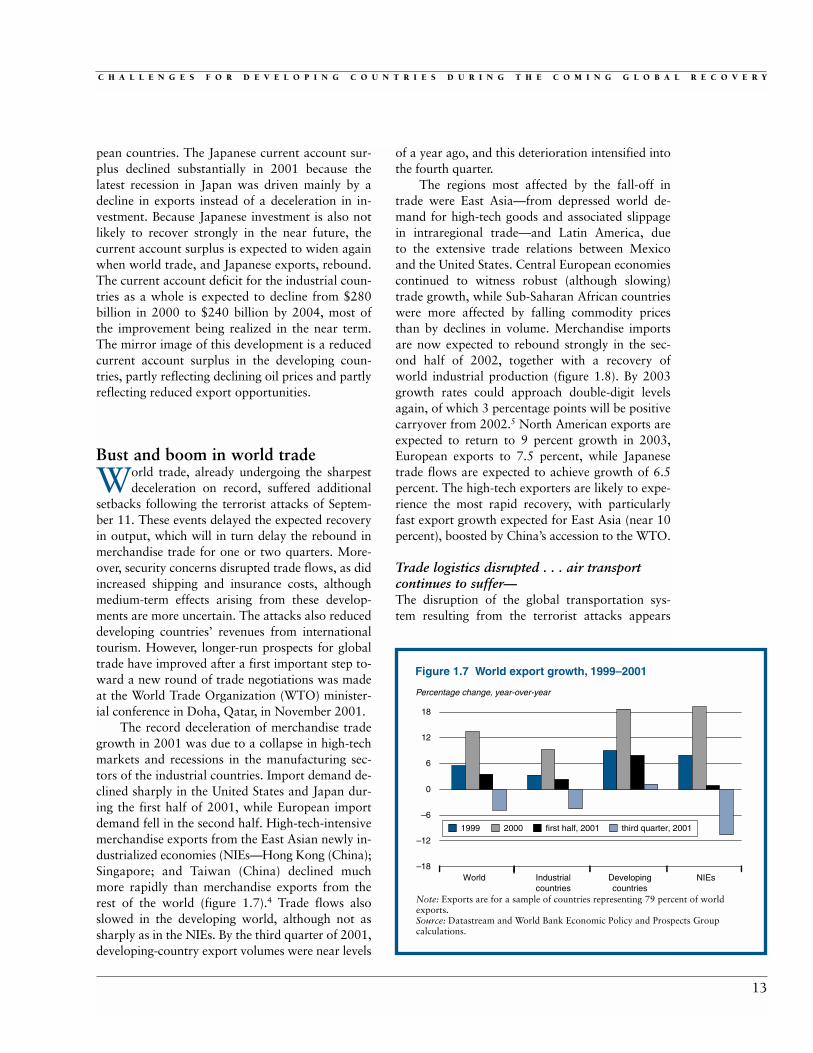
The record deceleration of merchandise tradegrowth in 2001 was due to a collapse in high-techmarkets and recessions in the manufacturing sec-tors of the industrial countries. Import demand de-clined sharply in the United States and Japan dur-ing the first half of 2001, while European importdemand fell in the second half. High-tech-intensivemerchandise exports from the East Asian newly in-dustrialized economies (NIEs—Hong Kong (China);Singapore; and Taiwan (China) declined muchmore rapidly than merchandise exports from therest of the world (figure 1.7).4 Trade flows alsoslowed in the developing world, although not assharply as in the NIEs. By the third quarter of 2001,developing-country export volumes were near levels
of a year ago, and this deterioration intensified intothe fourth quarter.
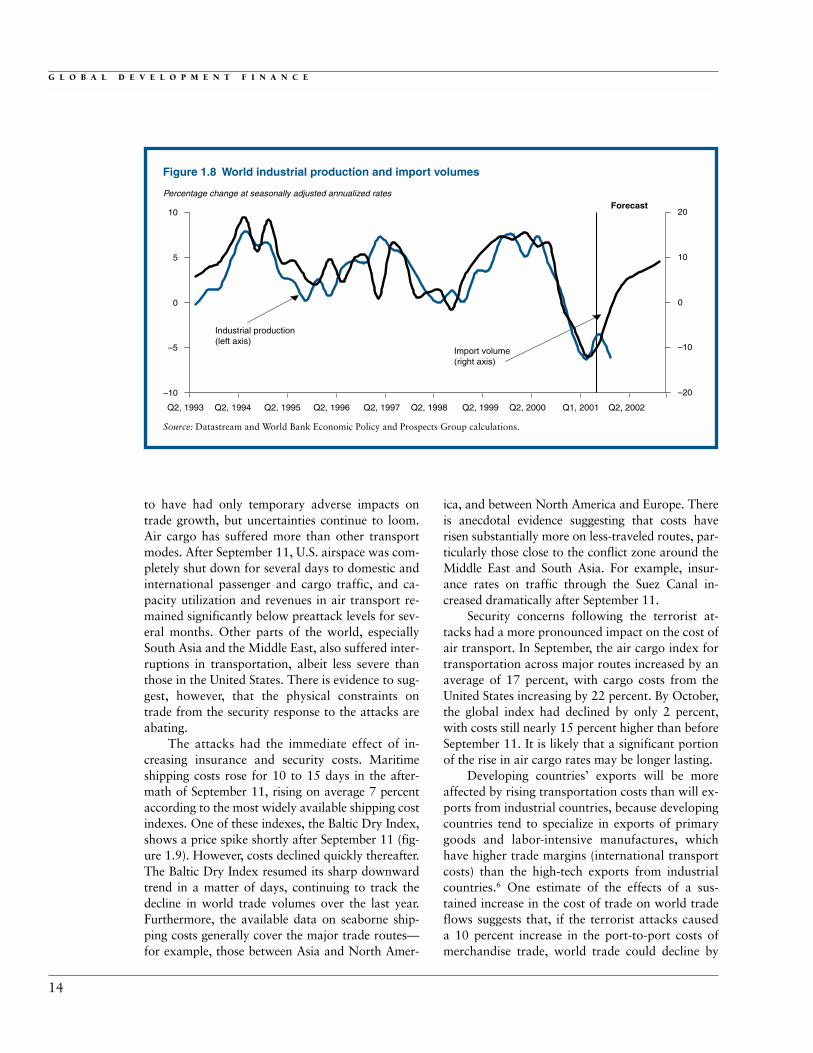
The regions most affected by the fall-off intrade were East Asia—from depressed world de-mand for high-tech goods and associated slippagein intraregional trade—and Latin America, due to the extensive trade relations between Mexicoand the United States. Central European economiescontinued to witness robust (although slowing)trade growth, while Sub-Saharan African countrieswere more affected by falling commodity pricesthan by declines in volume. Merchandise importsare now expected to rebound strongly in the sec-ond half of 2002, together with a recovery ofworld industrial production (figure 1.8). By 2003growth rates could approach double-digit levelsagain, of which 3 percentage points will be positivecarryover from 2002.5 North American exports areexpected to return to 9 percent growth in 2003,European exports to 7.5 percent, while Japanesetrade flows are expected to achieve growth of 6.5percent. The high-tech exporters are likely to expe-rience the most rapid recovery, with particularlyfast export growth expected for East Asia (near 10percent), boosted by China’s accession to the WTO.
Trade logistics disrupted . . . air transportcontinues to suffer—The disruption of the global transportation sys-tem resulting from the terrorist attacks appears
13
Percentage change, year-over-year
Figure 1.7 World export growth, 1999–2001
Note: Exports are for a sample of countries representing 79 percent of worldexports.Source: Datastream and World Bank Economic Policy and Prospects Groupcalculations.
–18
World Industrialcountries
Developingcountries
NIEs
–12
–6
0
6
12
18
1999 2000 first half, 2001 third quarter, 2001
G L O B A L D E V E L O P M E N T F I N A N C E
to have had only temporary adverse impacts on trade growth, but uncertainties continue to loom.Air cargo has suffered more than other transportmodes. After September 11, U.S. airspace was com-pletely shut down for several days to domestic andinternational passenger and cargo traffic, and ca-pacity utilization and revenues in air transport re-mained significantly below preattack levels for sev-eral months. Other parts of the world, especiallySouth Asia and the Middle East, also suffered inter-ruptions in transportation, albeit less severe thanthose in the United States. There is evidence to sug-gest, however, that the physical constraints ontrade from the security response to the attacks areabating.
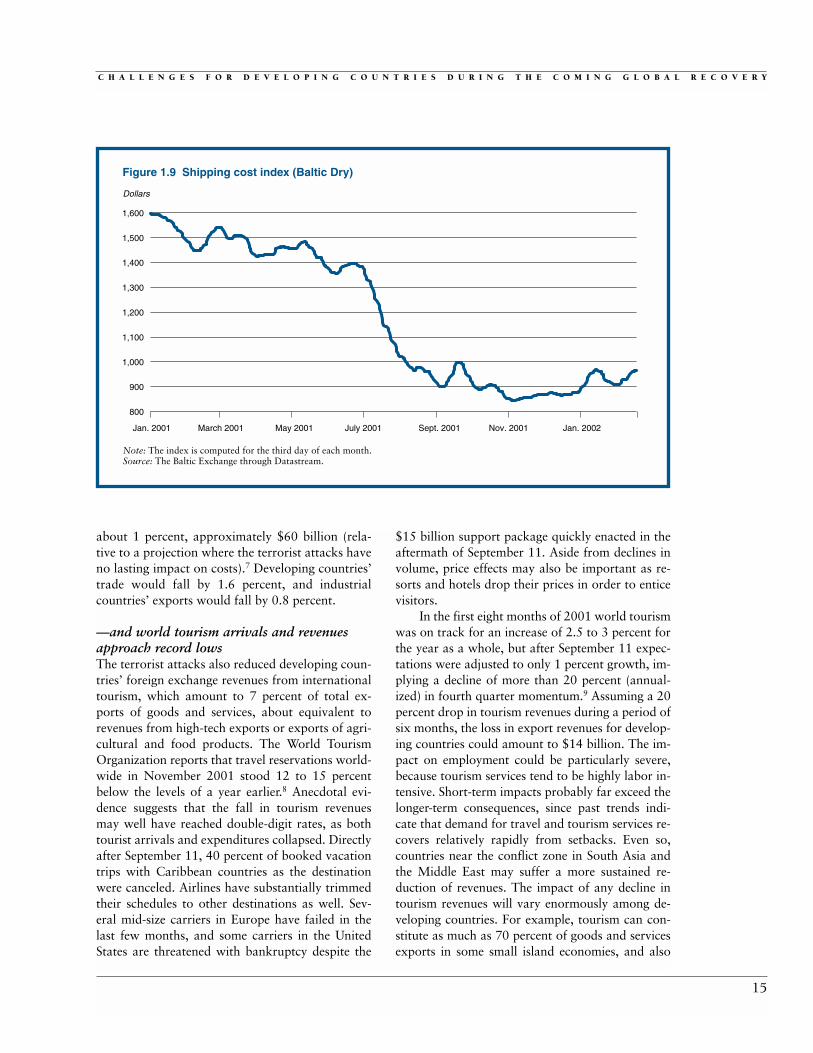
The attacks had the immediate effect of in-creasing insurance and security costs. Maritimeshipping costs rose for 10 to 15 days in the after-math of September 11, rising on average 7 percentaccording to the most widely available shipping costindexes. One of these indexes, the Baltic Dry Index,shows a price spike shortly after September 11 (fig-ure 1.9). However, costs declined quickly thereafter.The Baltic Dry Index resumed its sharp downwardtrend in a matter of days, continuing to track thedecline in world trade volumes over the last year.Furthermore, the available data on seaborne ship-ping costs generally cover the major trade routes—for example, those between Asia and North Amer-
ica, and between North America and Europe. Thereis anecdotal evidence suggesting that costs haverisen substantially more on less-traveled routes, par-ticularly those close to the conflict zone around theMiddle East and South Asia. For example, insur-ance rates on traffic through the Suez Canal in-creased dramatically after September 11.
Security concerns following the terrorist at-tacks had a more pronounced impact on the cost ofair transport. In September, the air cargo index fortransportation across major routes increased by anaverage of 17 percent, with cargo costs from theUnited States increasing by 22 percent. By October,the global index had declined by only 2 percent,with costs still nearly 15 percent higher than beforeSeptember 11. It is likely that a significant portionof the rise in air cargo rates may be longer lasting.
Developing countries’ exports will be moreaffected by rising transportation costs than will ex-ports from industrial countries, because developingcountries tend to specialize in exports of primarygoods and labor-intensive manufactures, whichhave higher trade margins (international transportcosts) than the high-tech exports from industrialcountries.6 One estimate of the effects of a sus-tained increase in the cost of trade on world tradeflows suggests that, if the terrorist attacks caused a 10 percent increase in the port-to-port costs ofmerchandise trade, world trade could decline by
14
Percentage change at seasonally adjusted annualized rates
Figure 1.8 World industrial production and import volumes
Source: Datastream and World Bank Economic Policy and Prospects Group calculations.
–10
Q2, 1993 Q2, 1994 Q2, 1995
Forecast
Industrial production(left axis)
Import volume(right axis)
Q2, 1996 Q2, 1997 Q2, 1998 Q2, 1999 Q2, 2000 Q1, 2001 Q2, 2002
–5
0
5
10
–20
–10
0
10
20
C H A L L E N G E S F O R D E V E L O P I N G C O U N T R I E S D U R I N G T H E C O M I N G G L O B A L R E C O V E R Y
about 1 percent, approximately $60 billion (rela-tive to a projection where the terrorist attacks haveno lasting impact on costs).7 Developing countries’trade would fall by 1.6 percent, and industrialcountries’ exports would fall by 0.8 percent.
—and world tourism arrivals and revenuesapproach record lowsThe terrorist attacks also reduced developing coun-tries’ foreign exchange revenues from internationaltourism, which amount to 7 percent of total ex-ports of goods and services, about equivalent torevenues from high-tech exports or exports of agri-cultural and food products. The World TourismOrganization reports that travel reservations world-wide in November 2001 stood 12 to 15 percentbelow the levels of a year earlier.8 Anecdotal evi-dence suggests that the fall in tourism revenuesmay well have reached double-digit rates, as bothtourist arrivals and expenditures collapsed. Directlyafter September 11, 40 percent of booked vacationtrips with Caribbean countries as the destinationwere canceled. Airlines have substantially trimmedtheir schedules to other destinations as well. Sev-eral mid-size carriers in Europe have failed in thelast few months, and some carriers in the UnitedStates are threatened with bankruptcy despite the
$15 billion support package quickly enacted in theaftermath of September 11. Aside from declines involume, price effects may also be important as re-sorts and hotels drop their prices in order to enticevisitors.
In the first eight months of 2001 world tourismwas on track for an increase of 2.5 to 3 percent forthe year as a whole, but after September 11 expec-tations were adjusted to only 1 percent growth, im-plying a decline of more than 20 percent (annual-ized) in fourth quarter momentum.9 Assuming a 20percent drop in tourism revenues during a period ofsix months, the loss in export revenues for develop-ing countries could amount to $14 billion. The im-pact on employment could be particularly severe,because tourism services tend to be highly labor in-tensive. Short-term impacts probably far exceed thelonger-term consequences, since past trends indi-cate that demand for travel and tourism services re-covers relatively rapidly from setbacks. Even so,countries near the conflict zone in South Asia andthe Middle East may suffer a more sustained re-duction of revenues. The impact of any decline intourism revenues will vary enormously among de-veloping countries. For example, tourism can con-stitute as much as 70 percent of goods and servicesexports in some small island economies, and also
15
Dollars
Figure 1.9 Shipping cost index (Baltic Dry)
Note: The index is computed for the third day of each month.Source: The Baltic Exchange through Datastream.
800
Jan. 2001 March 2001 May 2001 July 2001 Sept. 2001 Nov. 2001 Jan. 2002
900
1,000
1,100
1,200
1,300
1,400
1,500
1,600

G L O B A L D E V E L O P M E N T F I N A N C E
has become a key export sector in many Sub-Saharan African countries. Revenues from tourismfor the 14 Sub-Saharan African countries with thehighest dependency on tourism revenues average 22 percent of total export revenues.10 In absoluteterms, Turkey is the largest recipient of tourism rev-enues, and the sharp fall in these receipts since Sep-tember 11 has complicated efforts to overcome thefinancial crisis.
Improved prospects for a development roundof multilateral trade negotiations The Doha Development Agenda—which emergedfrom the WTO Ministerial Conference held inDoha, Qatar, in November 2001—demonstratesthe increased prominence of development con-cerns in WTO deliberations, in turn reflecting in-creased participation by developing countries inthe international trading system. Doha launchednegotiations on market access for manufactures,dispute settlement, WTO rules, environmentalpolicies, and intellectual property protection.These negotiations will complement ongoing talkson market access in agriculture and services, whichare mandated by the Uruguay Round agreements.Negotiations will be launched on four so-calledSingapore issues—competition, investment, tradefacilitation, and transparency in government pro-curement—at the next WTO ministerial meetingin 2003, if consensus can be reached on the modal-ities of such negotiations at that time. Completingnegotiations by January 1, 2005, as envisaged inthe Doha Ministerial Declaration, represents amajor challenge (box 1.1), but success in doing sowould imply large welfare gains for both develop-ing and industrial countries.
Secular declines and cyclical swings incommodities pricesNon-oil commodities. The global economic slow-down, a strong dollar, and large supplies of mostcommodities reduced the average dollar price ofdeveloping countries’ non-oil primary commodityexports by 9 percent in 2001. Demand for metalswas most affected by the economic slowdown,while agricultural commodities continued to facelarge supply increases despite falling prices. Non-oil commodity prices are now one-third belowtheir cyclical high of 1997. Currency depreciationin major commodity exporters in East Asia andLatin America resulted in sharp price declines for
coffee, oilseeds, sugar, and raw materials such asrubber. Continued rapid technological progresscontributed to supply increases in a number ofcommodities,11 and improved policies in some de-veloping countries contributed to large increases inexports.12 Coffee prices were especially hard hit(down 30 percent in 2001 compared with 2000)due to a 20 percent increase in global productionover the past three years with little increase in con-sumption. Cotton prices declined 20 percent in2001 due to large production increases in Chinaand the United States, and rice prices fell 15 per-cent due to the large exports from Thailand andVietnam. Copper prices fell by 12 percent in 2001,and prices would have declined even further ifmajor producers had not cut production by about5 percent in an effort to prevent additional pricedeclines.
The price declines have been especially hardfor exporters in Africa, where non-oil commodi-ties often account for 70 percent or more of ex-port revenues. Ethiopia, for example, derivesnearly two-thirds of total export revenues fromcoffee, and Mali derives about 40 percent of totalexports from cotton. Moreover, the prices of com-modities that account for a large share of Sub-Saharan exports (such as cocoa, coffee, and cop-per) have fallen by more than the prices of com-modities exported by other developing countries(figure 1.10). Since 1980, the index of real non-oilcommodity export prices of Sub-Saharan Africancountries has declined by 10 percent relative to theindex of all developing countries. On top of that,the African index tends to be more volatile overthe price cycle, implying a sharper fall during adownturn. African producers have been unable tomake up for the decline in prices through highervolumes, since African agricultural production hasbeen flat over the past two decades, while agricul-tural production increased rapidly in developingcountries as a whole (figure 1.11). Sub-SaharanAfrica’s non-oil commodity export revenuesdropped at least $3 billion between 1997 and2001—equal to 3.6 percent of non-oil export rev-enues in 1997 and 25 percent of total official de-velopment aid to these countries in 1999.
We expect a recovery of only 15 percent innon-oil commodity prices from current cyclicallows over the interval through 2004. This will leavenon-oil commodity prices 22 percent below their1997 level. The short-term recovery will be driven
16

C H A L L E N G E S F O R D E V E L O P I N G C O U N T R I E S D U R I N G T H E C O M I N G G L O B A L R E C O V E R Y
by a rebound in global economic activity, reducedsupplies and stocks in response to current lowprices, and some weakening of the dollar. There isuncertainty associated with the factors that underliethe recovery of commodities prices, but the impactsof the uncertainties on prices differ markedly. Whilethe timing of the rebound of demand is uncertain,
a recovery that is further delayed will have only alimited negative impact on prices. The potential forunexpected supply increases may be a greater risk.During the 1990s rapid technological progress,combined with improved policies, led to the emer-gence of major producers in a relatively short pe-riod of time, resulting in sharp declines in prices (as
17
The Doha agenda has great potential to be beneficialfrom a development perspective. A great deal of re-
search has documented that there is still a large market-access agenda and that dealing with this agenda willsignificantly increase real incomes and reduce poverty indeveloping countries (World Bank 2001). Research alsosuggests that care is required to determine the develop-ment relevance and payoffs of extending the WTO intoregulatory areas (Hertel, Hoekman, and Martin 2002).The key areas of concern for developing countries in thenew trade round will be market access, regulatory issues,and the magnitude and effectiveness of the technical assis-tance that was promised in Doha.
Improving market access remains a key goal of multi-lateral trade negotiations. Industrial countries will need tomobilize the political will to reduce remaining pockets ofprotection in key sectors such as agriculture, labor-basedservices, and labor-intensive manufactures. Developingcountries also need to be willing to liberalize access totheir markets for goods and services. The relatively highbarriers to trade in goods and services that continue toprevail in many developing countries implies that theyhave a lot to bring to the table in a mercantilist sense.Identifying a set of “concessions” that are of interest topolitically powerful groups in OECD countries and thatare beneficial to developing countries is the major chal-lenge confronting policymakers in the coming years. Theresearch and development communities need to help iden-tify what such issues might be and assist in mobilizing theaffected constituencies.13
As far as multilateral rule-making on regulatory issuesis concerned, better understanding of the issues in develop-ing countries is required, not just by government officialsbut also by the private sector and civil society. Despite fiveyears of studying trade and investment-competition link-ages in WTO working groups set up for that purpose,many low-income countries were fearful in Doha oflaunching negotiations in these areas. There is clearly aneed to provide greater assistance to build capacity andundertake analysis in developing countries to determinethe merits and implications of multilateral disciplines.
Whether it makes sense to rely on negotiation and bindingdispute settlement to address behind-the-border policies inthe WTO is a question that developing countries need toanswer for themselves. The Doha ministerial meeting re-vealed that many countries had an answer to that question,but that many others did not.
The Doha declaration contains numerous commit-ments by high-income WTO members to provide technicalassistance. However, there is no mention of the magnitudeof assistance that will be offered, nor is there discussion of any mechanism to determine what the needs are andhow they should be addressed (that is, what the deliverymechanism might be). Embedding technical assistance in abroader development framework is critical in ensuring thatthe assistance focuses on the priority needs of each countryand is consistent with its development strategy. The sepa-rate section in the Doha declaration on technical coopera-tion and capacity building provides scope to move in thisdirection: Ministers “instruct the Secretariat, in coordina-tion with other relevant agencies, to support domesticefforts for mainstreaming trade into national plans foreconomic development and strategies for poverty reduc-tion” (paragraph 38). A concerted effort will be needed toensure aid is targeted at national priorities, and to ensurethat assistance is provided in an effective manner byagencies with a comparative advantage in an area.
Ensuring that the new round of trade negotiationsachieves a pro-development negotiating outcome is a major challenge. Resistance to liberalization of agricultureand textiles is very strong. Conversely, many low-incomecountries are unwilling to extend the reach of the WTO tocover issues such as competition and investment policies. A major question confronting WTO members is whether adeal should be constructed that involves linking old marketaccess issues to disciplines on new issues such as invest-ment and competition. The feasibility of any such linkagewill depend greatly on what is done in the coming years toaddress developing-country concerns regarding implemen-tation of Uruguay Round agreements and the magnitudeand effectiveness of the technical assistance that waspromised in Doha.
Box 1.1 The Doha Development Agenda

G L O B A L D E V E L O P M E N T F I N A N C E
in the case of coffee). While such supply increasesare difficult to predict, they remain an importantrisk to the forecast. Conversely, abnormal weatherconditions are more likely to lead to higher prices,since bad harvests tend to result in much larger fallsin production than would be the case when goodweather conditions boost production.
Oil prices. The global economic slowdowncontributed to a reduction of oil prices from $28.2a barrel in 2000 to $24.4 in 2001.14 Oil prices
spiked briefly to $31 a barrel immediately follow-ing September 11, but when it became apparentthat there were no immediate threats to oil sup-plies, prices quickly fell, ending the year at $18.5.World oil demand grew little in 2001, and actuallyfell by 1 percent year-on-year in the second half ofthe year as a result of the after-effects of the attacks(such as reduced jet travel, for example), the deep-ening economic slowdown, and mild weather. Withnon-OPEC (Organization of Petroleum ExportingCountries) production growing moderately overall(increases occurred mainly in the Commonwealthof Independent States, or CIS), oil inventories haverisen back to a more comfortable range comparedwith the low levels of 2000 (figure 1.12).
OPEC reduced production three times prior toSeptember 11 to keep the price of its crude basketwithin its target range of $22 to $28 a barrel. But,with the changed political environment after Sep-tember 11 and as the economic slowdown wors-ened, OPEC chose not to activate its “automaticmechanism” that reduces output when the price of oil falls below $22 for 10 consecutive days. In-stead, OPEC countries relied on reducing their pro-duction above quota (estimated at 0.54 millionbarrels a day in November) to help support prices.
With oil prices well below $20 a barrel inNovember, OPEC agreed to reduce quotas by 6.5percent or 1.5 million barrels per day (mb/d) be-ginning January 1, 2002—but only if non-OPECproducers firmly committed to reducing produc-tion by 0.5 mb/d. OPEC threatened a price war ifa deal could not be reached. Non-OPEC producersresponded in part, with major producers Norwayand the Russian Federation each agreeing to cutproduction by 0.15 mb/d. While non-OPEC cutsfell short of the 0.5 mb/d demanded, they werelarge enough for OPEC to follow through on itsproposed cuts, which will last “as long as neces-sary” according to OPEC’s secretary general.
We expect oil prices to average $20 a barrel in 2002, somewhat above current levels but wellbelow the 2001 average. It will be difficult to liftprices to 2000 levels, mainly because of the under-lying weakness in demand and because non-OPECcapacity has been increased during the recent pe-riod of high prices. But with an economic recoveryin the second half of 2002, oil demand is expectedto increase marginally, following sharp declines inthe prior year. Non-OPEC supplies are expected torise by 1 mb/d, excluding any temporary, volun-
18
Index, 1980 = 100; deflated by MUV
Figure 1.10 Real non-oil commodity prices since 1980
Note: MUV is the unit value of manufactures exports from the G-5 countries todeveloping countries, expressed in U.S. dollars.Source: World Bank Economic Policy and Prospects Group calculations.
40
1980 1982 1984 1986 1988
Developing countries
Sub-Saharan Africa
1990 1992 1994 1996 1998 2000
60
80
100
Index, 1980 = 100
Figure 1.11 Per capita agricultural production
Source: United Nations Food and Agricultural Organization Statistical Office (FAOSTAT).
1980 1982 1984 1986 1988
Developing countries
Sub-Saharan Africa
1990 1992 1994 1996 1998 200090
100
110
120
130
140
150

C H A L L E N G E S F O R D E V E L O P I N G C O U N T R I E S D U R I N G T H E C O M I N G G L O B A L R E C O V E R Y
tary reductions. Consequently, OPEC will be re-quired to produce less oil in 2002. If oil producersmaintain low levels of output throughout the year,oil inventories could begin to tighten; that wouldhelp firm prices later in 2002 and into 2003, to av-erage $21 for the latter year. In 2004 non-OPECsupplies are expected to capture much of the ex-pected growth in demand, and oil prices are ex-pected to weaken, to $19 a barrel, as OPEC mem-bers continue to lose market share. The increase innon-OPEC supply is expected to exceed the rise indemand when global economic growth solidifies.
The risks to the price forecast are mainly onthe downside, since the agreement between OPECand non-OPEC producers is likely to be fragileunder expected weak demand conditions. How-ever, while the potential for supply disruptions isthought to be small, disruptions could have a largeimpact if they do occur. The major uncertainties in-clude the prospects for exports from Iraq, whichwill depend on that country’s reactions to changesin the sanctions regime, and any military conflict inthe Middle East due to the war on terrorism. Theimpact of the latter could be extremely significant.For example, the loss of 5 mb/d of Iranian produc-tion in 1980 caused a 150 percent rise in priceswithin several months, and the similar-size loss ofIraq and Kuwait production in 1990 caused a tem-porary doubling of prices within three months.
Regional developments
Severe recession in the rich countries, unprece-dented deceleration in world trade, weak com-
modity prices, and heightened risk perceptions andincreased selectiveness in financial markets af-fected all developing regions during 2001.15 GDPgrowth for the aggregate of developing and transi-tion countries fell from a record 5.4 percent in2000 to 2.8 percent in the year, and per capitagrowth declined to 1.4 percent, both rates wellbelow the averages of the 1990s (table 1.3). Theintensity of the international effects differed acrosscountries and regions, tied to—among other fac-tors—market orientation and product speciali-zation in patterns of trade; initial conditions indomestic financial markets, and different policymeasures adopted in response to the slowdown.Country-specific conditions are likely to shape therecovery onto differing paths of growth by regionfollowing the expected rebound in industrial-country activity and trade.
The movement from boom to bust in the ex-ternal environment is reflected distinctly in the fallof export market growth from 13 percent to 1.1percent, and the concomitant decline in developing-country export performance from 15 percent to 4percent—although this movement still implies apick-up in market share for the group. Terms oftrade, expressed as a proportion to GDP, dropped
19
Price in dollars per barrel Stock in million barrels
Figure 1.12 Oil prices and OECD oil stocks
Source: International Energy Agency; World Bank staff estimates.
10
Jan. 1996 Jan. 1997
Oil price
Oil stocks
Jan. 1998 Jan. 1999 Jan. 2000 Jan. 2001 Jan. 2002
15
20
25
30
35
2,400
2,450
2,500
2,550
2,600
2,650
2,700
2,750
2,800
2,850

G L O B A L D E V E L O P M E N T F I N A N C E
by 0.1 percent. These developments pushed exportrevenues into negative territory (a decline of 1.3percent), and contributed to a narrowing of the ag-gregate current account surplus to 0.4 percent ofGDP in the year. At the same time, however, under-lying inflation trends have continued on a path ofdeceleration, central government budget balanceshave narrowed from the averages of the 1990s, anda general improvement in the investment climate inmany countries, including new emphases on gover-nance and institutional reforms, have helped main-tain the flow of FDI into selected developing andtransition economies at high levels. These factorshave opened the door—for those countries with afavorable climate—to pursue countercyclical policyoptions to help mitigate the full brunt of the exter-nal shocks of 2001. For example, large levels of re-serves, low inflation, and manageable governmentdebt enabled many countries in East Asia to reduceinterest rates and to implement fiscal stimuli. Othercountries, with weaker initial conditions (includ-ing, for example, Indonesia), several countries inLatin America, and Turkey, were forced to persistin fiscal consolidation, or even to tighten further,
and many did not see lower international interestrates reflected in reductions in domestic rates.
An important challenge for most developingcountries during the current downturn has beencoping with much-reduced export revenues, at thesame time that access to international capital hasgrown more limited. Decline in export receipts ($26billion or 1.3 percent of regional GDP), was largestfor East Asia, the origin of some 80 percent of de-veloping countries’ high-tech exports. And oil ex-porters throughout the developing world have seentheir export revenues fall more than $100 billion asthe price of oil fell sharply. For these countries,though, financing difficulties are not as pressing,since most East Asian and oil-exporting countriesaccumulated substantial current account surplusesand reserves over the last several years. More vul-nerable are countries that depend largely on non-oilcommodities exports, or on tourism, other servicesreceipts, and transfers; these countries usually haveless-than-creditworthy borrowing status. Mostpressing are the financing problems for countriessuch as Turkey and Argentina that had amassedvery large financial imbalances.
20
Table 1.3 Developing-country forecast summary, 1991–2004(percent per year)
Estimate Forecast
Growth rates/ratios 1991–2000 1999 2000 2001 2002 2003 2004
Real GDP growth 3.2 3.3 5.4 2.8 3.2 5.0 4.9Consumption per capita 0.9 1.0 3.2 1.5 1.8 3.0 3.1GDP per capita 1.6 1.8 3.9 1.4 1.8 3.7 3.5
Population 1.6 1.5 1.5 1.4 1.4 1.3 1.3Gross domestic investment/GDPa 23.5 23.2 24.0 24.2 24.6 24.8 25.0
Inflationb 11.7 5.4 6.4 5.3 4.4 4.2 4.1Central government budget balance/GDP –3.6 –4.0 –3.2 –3.2 –3.5 –3.5 –3.1
Export market growthc 7.6 5.3 12.9 1.1 2.5 7.7 7.4Export volumed 7.1 4.9 14.6 3.7 6.1 9.6 9.4Terms of trade/GDPe –0.2 0.6 0.4 –0.1 –1.1 –0.2 –0.3Current account/GDP –1.2 0.4 1.2 0.4 –0.2 –0.4 –0.7
Memorandum itemsGDP growth: developing excludingthe transition countries 4.8 3.3 5.3 2.6 3.2 5.2 5.0Excluding China and India 2.1 2.3 5.1 1.8 2.2 4.4 4.2Excluding transition, China, India 3.7 2.1 4.8 1.3 2.0 4.4 4.3
a. Fixed investment, measured in real terms.b. Local currency GDP deflator, median.c. Weighted average growth of import demand in export markets.d. Goods and nonfactor services.e. Change in terms of trade, measured as a proportion to GDP (percent).Source: World Bank baseline forecast, February 2002.

C H A L L E N G E S F O R D E V E L O P I N G C O U N T R I E S D U R I N G T H E C O M I N G G L O B A L R E C O V E R Y
For developing and transition countries as agroup, recovery is anticipated to build momentumover the course of 2002. Growth is expected toreach 3.2 percent in 2002, and rise to 5 percentduring 2003–04 (table 1.3). A rebound in exportmarket growth to rates near 8 percent by 2003would suggest a return of export performance to-ward double-digit gains. Terms of trade for the ag-gregate of developing countries is likely to worsenin the short to medium term, since it is tied in partto the large weight of oil exporters in the group, aswell as to anticipated increases in the dollar cost of manufactures imports from the industrial coun-tries.16 Nonetheless, strong export volume growthshould underpin domestic investment, with posi-tive multiplier effects, and falling inflation shouldboost real incomes and consumption. A gradualreturn of private capital to emerging markets willaccentuate these developments, so that by 2003growth will be returning toward 5 percent. More-over, recent developments, including the DohaRound, China’s accession to the WTO (and theRussian Federation’s expressed interest in the or-ganization), offer promise of a broader scope forfuller participation in global trade, which will ben-efit the new members and their trading partnersalike.
Recovery in the developing world is likely tobegin, and to be strongest, in East Asia, wherecountries have benefited from domestic stimuli,and where strong dynamics in the high-tech sec-tors could once again work in their favor (figure1.13). In contrast, little recovery for the aggregateof Latin American countries is anticipated, giventheir much less favorable starting points, since fi-nancial strains remain elevated and commodityprices are expected to rebound only modestly. Sub-dued commodity prices will also continue to re-strain economic growth in Sub-Saharan Africa.The war on terrorism could hamper growth inSouth Asia and the Middle East and North Africain the short run as trade and tourism flows remaindisrupted, while at the same time financial flowsto frontline states should ease current account ten-sions. In the medium run, necessary fiscal austerityin South Asia is expected to dampen growth ratesin the region somewhat. Recovery in Central andEastern Europe will hinge critically upon develop-ments in the European Union (EU), suggestingsomewhat delayed recovery relative to East Asia,while the Russian Federation and other countriesof the CIS are likely to see recent stronger rates of growth—linked in large measure to the price ofoil—fade gradually over the next years.
21
Percent
Figure 1.13 GDP growth in developing regions
0
East Asiaand Pacific
South Asia Latin Americaand the Caribbean
Central and Eastern Europe/
Commonwealth ofIndependent States
Middle Eastand North Africa
Sub-SaharanAfrica
1
2
3
4
5
6
7
8
2001 2002 2003 2004
Source: World Bank Economic Policy and Prospects Group data and projections.

G L O B A L D E V E L O P M E N T F I N A N C E
East Asia and PacificGrowth in East Asian developing countries slowedto 4.6 percent in 2001 from the 7.4 percent regis-tered during the 2000 boom. The growth slow-down in the region, excluding China, was moredramatic—from 7 percent in 2000 to 2.3 percent.Chinese growth remained above 7 percent, boostedby large-scale fiscal stimulus.
The collapse of global demand for high-techproducts, compounded by progressively weakereconomic conditions in the United States and Ja-pan, hit exports, industrial production, and invest-ment in most countries quite hard and raised un-employment rates. Regional export volume growthslowed sharply to 3 percent—in contrast to the ro-bust 22 percent advance of 2000—with the largestgrowth decline occurring in the five countries mostaffected by the 1997–98 Asian crisis. Manufactur-ing output in the larger countries, excluding China,dropped by some 7.5 percent, fixed investmentslowed by 4 percentage points, and liquidation ofunwanted inventories played a substantial role inthe downturn, subtracting more than 1 percentagepoint from the regions’ output in the year. Thehigh-income, high-tech-dependent entrepôt centersof the NIEs were battered into recession despitestrong monetary and fiscal stimuli; this led to asharp compression of East Asia’s intricate networkof intraregion trade. The events of September 11only exacerbated the difficult external environmentfacing the region, especially for tourism revenues,as tourist arrivals in the five leading Association of Southeast Asian nations countries are thought tohave fallen by 10 to 15 percent in October (year-over-year).
Low and declining inflation rates allowed mostcountries to use fiscal and monetary stimuli to miti-gate the downturn. For example, the Republic ofKorea lowered interest rates by 140 basis points,stepped up fiscal outlays—with the central govern-ment balance deteriorating from a surplus of 1.3percent of GDP in 2000 to a small deficit in 2001—and tapped international capital markets for grossflows of some $21 billion in the year. These mea-sures provided cushion for domestic demand whileincreasing reserve levels. Similar policy measures byseveral other economies in the region (with theexception of Indonesia) yielded a widening of theaverage fiscal deficit to 3 percent of GDP from 2.5percent in 2000, while the current account surplusposition diminished by 1.5 percent of GDP. Finan-
cial difficulties in Indonesia—and to a lesser degree,in the Philippines—were being addressed throughagreements with the International Monetary Fundand multilateral development banks.
East Asia may be the first developing region to emerge from the current global downturn, andgrowth there is expected to pick up to 5.2 percent in2002—reflecting the positive impact of looser mon-etary and fiscal positions and improvement in exter-nal conditions. But the strength of recovery willhinge upon the revival of world trade and rise inglobal demand for technology-based products.There are some early signs of encouragement in the information and communications technology(ICT) sector, as world semiconductor sales appearto have reached a trough. Industrial production isnow rising across key ICT-producing economies ofthe region—notably Korea, but also Malaysia, thePhilippines, Thailand, and the NIEs. As demand is unlikely to gain substantial momentum until the second half of 2002, however, a more robustexport-led recovery in East Asia is not likely until2003, with GDP growth expected to reach about 7percent, before moderating toward potential growthof 6.5 percent in 2004. Challenges will remain dur-ing recovery, especially the potential widening offiscal balances and the need to re-address fragilebanking systems in several countries. China’s recentaccession to the WTO offers the broader regionboth substantial opportunities, in an opening of thelarge Chinese market to the region, and potentialcompetitive pressures in third markets, becausethese open wider to Chinese products.
Latin America and the CaribbeanRegional GDP grew 0.6 percent in 2001 in LatinAmerica and the Caribbean, a substantial slow-down from the 3.8 percent advance registered in2000. The weak growth performance reflects ad-verse external conditions alongside a progressiveworsening of the political and economic situation inArgentina. Output in Latin America, excluding Ar-gentina, increased by 1.3 percent in the year. Fol-lowing September 11, economic conditions wors-ened for the region as Argentina’s crisis deepened,commodity prices fell, secondary market spreadsrose, and capital flows fell from already subduedlevels in July and August. The Caribbean regionwitnessed a steep decline in tourist bookings, whileweakening labor markets in North America led to aslackening of remittances to Central American and
22

C H A L L E N G E S F O R D E V E L O P I N G C O U N T R I E S D U R I N G T H E C O M I N G G L O B A L R E C O V E R Y
Caribbean countries. Few countries (among them,Chile and the República Bolivariana de Venezuela)were able to pursue countercyclical fiscal policy ormonetary expansion to mitigate the growth slow-down, due to generally high public debt and rela-tively large external financing requirements. Thesedevelopments translated into a rise in regional un-employment, with falling inflation rates in mostcountries, but little change in real interest rates orfiscal balances.
International developments were a major con-straint on external revenues in 2001. The regionaltrade balance moved from a deficit of $35 billionin 1998 to a surplus of almost $10 billion in 2000on the back of rising surpluses for major oil ex-porters. During 2001, however, aggregate dollarexports declined 1.5 percent and imports fell 1 per-cent, narrowing the trade surplus by about $3.6billion. Oil exporters saw their surpluses diminishwhile Argentina and Brazil raised their surplusessignificantly. In combination with these trends, asoftening of receipts from tourism and remittancescontributed to a widening of the region’s currentaccount deficit by $5 billion. With declines in fi-nancing from international capital markets, thecurrent account deficit was balanced by a draw-down of reserves and increased support from theinternational financial institutions.
The outlook for 2002 has dimmed, with GDPnow expected to rise by 0.5 percent—assumingthat the repercussions of the Argentine default anddevaluation have been discounted by financial mar-kets, and that regional contagion remains limited.The forecast revision is also due to a much weakerfourth quarter 2001 outturn for most countries—implying delay to the recovery, the growth-erodingeffects of crisis for Argentina itself, and a decidedlyweaker outlook for private-capital market andbusiness-related foreign direct investment (FDI) in-flows. Fiscal deficits were deteriorating sharply atthe end of 2001 for a number of countries due toslowing growth and continued declines in theprices of commodity exports, and government debtlevels have risen. Hence fiscal consolidation may berequired in 2002 to avoid excessive debt burdens,and this may constrain governments’ ability to sup-port growth through increased spending. Growthis expected to recover to 3.8 percent in 2003—yetwith considerable downside risks, should Argen-tina’s output decline become more protracted—maintaining growth at that rate during 2004, as the
industrial world eases. By that time private capitalflows will have increased again, and earlier recov-ery in industrial countries should boost the price ofthe region’s primary commodities and the volumeof manufactured exports.
Europe and Central AsiaEurope and Central Asia grew by 2.2 percent in2001, contrasted with 6.4 percent growth in 2000.The sharp deceleration was due to a 7.5 percentcontraction in Turkish output, the fall in Russiangrowth to 4.8 percent following robust 8.3 percentperformance in 2000, and a 0.9 percentage pointdeceleration in Central and Eastern European out-put. Growth for the region, excluding Turkey,amounted to 4.4 percent, down from 6.2 percentin 2000. Most transition economies witnessed de-clining inflation and interest rates, reflecting lowerimport prices and falling international interestrates. However, adoption of accommodative fiscaland monetary policies in the face of slowing growthled to a slight deterioration of fiscal deficits in sev-eral Central European countries.
Developments during the year served to nar-row current account surpluses for those countriesrecently attaining positive balances (for example,Kazakhstan, the Russian Federation, and Ukraine)and widened deficits for countries whose externalbalances have remained persistently negative (suchas Bulgaria, Croatia, Romania, and the SlovakRepublic). This reflects delayed spending of oilrevenues (as in the Russian Federation and Ka-zakhstan), and a deterioration in the external en-vironment, particularly weaker external demandfrom the EU area. There are exceptions. In Turkey,the current account deficit shifted into a $3 billionsurplus in 2001, as net external finance plummetedand the February 2001 crisis resulted in drasticmeasures to reduce domestic demand, and to switchexpenditure, including a 56 percent depreciation ofthe lire. In Poland compressed domestic demand(linked to previously tight monetary policy, easingas of late 2001) has contained imports, translatinginto a narrowing of the current deficit, from $10billion to $7 billion in 2001.
Growth in the region is expected to pick upmodestly in 2002, to 3.2 percent from 2.2, butlargely based on the assumed strength of recoveryin Turkey. In contrast, among the transition econ-omies, growth in the CIS is anticipated to declineto 3.8 percent in 2002, driven principally by a sharp
23

G L O B A L D E V E L O P M E N T F I N A N C E
decline in Russian oil revenues. Growth may easemoderately in Central and Eastern Europe from2.9 percent to 2.8, while recovery in the Euro Areadevelops only gradually and fiscal consolidationmay be necessary for potential accession countriesto the EU. The region as a whole should see an ac-celeration of growth to between 4 and 4.5 percentin 2003–04, as the eventual pickup in Europe in-creases demand for the region’s exports, althoughcontinued sluggish oil markets will partially con-strain growth in the CIS.
South AsiaAlthough South Asia is relatively less integratedinto the global economy than most developing re-gions, trends in the external environment served torestrain the pace of growth during 2001. Growthrose from a 4 percent advance in 2000 to 4.3 per-cent in 2001, as a decline in manufacturing out-put offset general improvement in agricultural per-formance (agriculture accounts for 50 percent ormore of output for all countries of the region). Ex-port market growth declined abruptly and sharply,leading to a fall in regional export growth to 1.1percent from the strong 12.3 percent outturn of2000. Indian exports, for example, dropped by 2percent over the period from April to Septembercompared with the levels from a year earlier. Manufacturing output in that country showed nogrowth in the first half of the calendar year. Pak-istan will clearly pay a toll in economic activity forthe duration of the military activities in Afghani-stan, but it will also receive adequate financial sup-port from the international community to reducedebt-servicing requirements, possibly establishinga foundation for renewed growth.
Given the size and relative self-sufficiency ofthe Indian economy, tepid domestic demand is themain culprit behind the current sluggishness ofgrowth, although external factors have played agreater role than was typical in the past. Investmentis slowing, in part due to the slackening of exportgrowth, and capital goods output dropped 8 per-cent during the first half of fiscal 2001. However,positive developments on the inflation front, withthe consumer price index moving below 3 percent,provided some headroom for easing of monetarypolicy in response to increasingly weak conditions.The recent fall in oil prices, continued growth ofsoftware exports (albeit at reduced 30–percent rates),
and slower import growth are expected to keepIndia’s current account deficit well below 2 percentof GDP. FDI inflows ballooned to $4.5 billion inthe year, twice the level of any previous fiscal year.Given a comfortable foreign reserve position, Indiais unlikely to face tight constraints in external fi-nance. But increasing direct government spendingand subsidies, in India as well as in Bangladesh andPakistan, will tend to widen central government fis-cal deficits—to 5.3 percent, 6.3 percent, and 5.3percent respectively—and these deficits are likely toremain impediments to a more robust accelerationof growth in the medium term.
Output in the region is expected to gain mo-mentum over 2002–03, partly on the strength ofglobal trade recovery, although political and mili-tary tensions in the region create large uncertain-ties. Removal of sanctions by the United States onIndia and Pakistan and a potential pick-up in tex-tile and clothing exports linked to eventual openingof rich-country markets are additional favorablefactors that could support the medium-term out-look. And hoped-for progress in addressing struc-tural reforms across countries of the region shouldsupport gains in productivity. Regional output isexpected to register growth of 4.9 percent in 2002,before rising somewhat faster over 2003–04 at apace above 5 percent.
Middle East and North AfricaMiddle East and North Africa region GDP slowedto 3.1 percent in 2001, following above-averagegrowth performance of 4.2 percent during 2000.Cutbacks in oil production by OPEC members ofthe region to support oil prices within a targetband, coupled with volatility—and recent sharpdeclines—in the oil price, depressed growth amongthe major hydrocarbon producers. For example,following a rise of some 4.5 percent in 2000, GDPin Saudi Arabia advanced by slightly less than 2percent in 2001. At the same time, progressiveweakening of conditions in continental Europe(the dominant export market for countries of theMaghreb and several countries of the Mashreq)dampened export performance substantially—Mo-roccan export growth dropped into negative terri-tory during the first half of the year. These trendswere exacerbated by declines in revenues fromtourism and remittances due to heightened securityconcerns after September 11. Against this back-
24
C H A L L E N G E S F O R D E V E L O P I N G C O U N T R I E S D U R I N G T H E C O M I N G G L O B A L R E C O V E R Y
ground output growth for the oil exporters of theregion dropped from 3.6 percent in 2000 to 2.5percent in 2001; and with the exception of Mo-rocco, which was recovering from severe droughtconditions, growth among the diversified exportersof the region slowed to 3.2 percent from 4.7 per-cent in 2000.
An important consequence of these develop-ments has been a substantial waning of externalsurpluses across the region. This is most evidentamong the oil-exporting countries, where currentaccount balances that ballooned to some $59 bil-lion (13 percent of GDP) with the jump in oil pricesin 2000, dropped quickly to less than $40 billionon the back of slumping prices and curtailment ofexports. Although public spending levels were ad-justed in many countries, fiscal deficits increased.In the case of Saudi Arabia, despite public sectorwage restraint, the 2002 budget foresees a deficit ofsome $6 to $7 billion, contrasted with a surplus ofsimilar magnitude in 2000. Similar adverse fiscaltrends are affecting countries such as the Arab Re-public of Egypt, Morocco, and Tunisia, and maybroaden across the diversified exporters as externalrevenue shortfalls become more acute in the nearterm.
Some countercyclical policy actions have beenpossible. Improved inflation performance in Egypthas allowed a full percentage point reduction inthe central bank discount rate; and exchange rateshave been falling relative to the dollar as well asthe euro over the second half of 2001 in Egypt,Morocco, Tunisia, and the Republic of Yemen.These measures may help to mitigate the effects ofthe global slowdown to a modest degree; but giventhe importance of the EU as an export market anda principal source of remittance and tourism in-come, recovery there will be necessary for a returnof more buoyant external conditions in the MiddleEast and North Africa.
Given difficult conditions in the external en-vironment, near-term prospects appear muted:growth recovery in the EU is likely to lag behindthat of North America and East Asia; underlyingdemand for hydrocarbons will require some timeto reach 1999–2000 levels, and uncertainty asso-ciated with the war on terrorism will likely remaina dampening factor for regional dynamism. GDPgrowth is anticipated to fall to 2.7 percent in 2002,while recovery over the following years may be
protracted relative to other developing regions, ris-ing by 3.3 percent over 2003 and 2004.
Sub-Saharan AfricaGrowth in Sub-Saharan Africa eased to 2.6 percentin 2001 from 3.1 percent in 2000, as the globalslowdown exacted a toll on commodity prices andgrowth in the region’s export markets. The slowingof Sub-Saharan Africa’s aggregate growth wasmoderate because oil exporters enjoyed relativelyhigh oil prices for much of the year, and favorableweather conditions boosted agricultural produc-tion in several countries (for example, cocoa pro-duction in West Africa increased sharply). Butterms-of-trade losses as a proportion to GDP were1 percent, the worst performance outside of theMiddle East and North Africa region, and exportmarket growth fell from 11 percent in 2000 to 1 percent. These fundamental conditions were re-flected in African high-frequency data coveringproduction, trade, and financial markets, whichindicate that, as elsewhere, economic conditionsdeteriorated sharply over the course of the year.Growth of regional export volumes dropped by 5.4 percentage points, to 2.1 percent, and revenuesby 24 percentage points, to –4.3 percent from 2000outturns. Moreover, weak tourism demand in thecritical year-end period—and in the wake of Sep-tember 11—further affected a number of countriesdependent on tourism, especially Kenya and Tanza-nia. In South Africa GDP registered growth of 1.2percent (seasonally adjusted annual rate) in thethird quarter, down from a recent peak of 3.4 per-cent in the fourth quarter of 2000. A deteriorationin the country’s trade balance coupled with a de-cline in equity capital flows precipitated a sharpfall in the value of the rand, which lost nearly athird of its value over the fourth quarter.
Looking to 2002, the projected decline in oilprices will adversely affect fiscal and external bal-ances of hydrocarbon exporters, but at the sametime it will provide a degree of relief to the largenumber of oil-importing countries of Sub-SaharanAfrica. Oil contributes 70–80 percent of export rev-enues for Angola, the Republic of Congo, Gabon,and Sudan, and more than 90 percent for Nigeriaand Equatorial Guinea. It is also the source of amajority of government revenues, pointing to a dif-ficult period of fiscal consolidation. At the sametime lower oil prices, if sustained, reduce the attrac-
25

G L O B A L D E V E L O P M E N T F I N A N C E
tiveness of FDI flows into new production facilitiesin southern and western Africa. Elsewhere, rev-enues from tourism are also likely to remain de-pressed pending a resumption of faster growth inthe industrial countries (even without concernsover security in the wake of the September 11 at-tacks), and the recovery in non-oil commodityprices is expected to be relatively muted. This bal-ance of factors suggests that regional output shouldonly maintain growth of 2.6 percent in the year.
Both export revenues and the terms of trademay decline slightly in 2002, requiring a further 3 percentage point reduction in import growth.However, for the 19 Sub-Saharan Africa countriesthat have fulfilled the conditions for debt reliefunder the Heavily Indebted Poor Countries Initia-tive, a reduction in debt service payments by $656million compared to the average of recent yearswill provide some offset to reduced export rev-enues. Conditions in export markets (particularlyin Europe) are expected to improve progressivelythrough the year, setting the stage for 3.6 percentGDP growth over 2003–04, when oil prices maystabilize and non-oil commodity prices rise by acumulative 15 percent.
Risks to the forecast
Uncertainties involved in macroeconomic fore-casts are sizeable, and substantial forecast er-
rors are virtually impossible to avoid. Errors inGDP growth forecasts made one year ahead tendto average around 1.5 percentage points.17 Onceleading indicators or partial data are available, the accuracy of forecasts improves dramatically.Current-year forecasts of GDP growth typicallyhave errors substantially below 1 percentage point.It is extremely difficult to predict cyclical develop-ments well in advance, partly because the timingof turning points is highly uncertain.
The prediction of recessions or severe down-turns is particularly difficult, since they are oftentriggered by the burst of a speculative bubble orother unforeseeable events. Even if some tensionswere observable in advance, the timing of their un-winding is close to random. The U.S. recession inthe early 1990s provided an example of how fore-casters can fail to anticipate recessions. The con-traction of the U.S. economy (that started in thethird quarter of 1990 and ended in the first quarter
of 1991) resulted in a 0.5 percent annual decline ofGDP in 1991 over 1990. From Spring until lateFall of 1990 international organizations forecast anincrease of around 2 percent,18 implying an averageforecast error of 2.5 percentage points. In 1991 theforecast errors were reduced to on average 0.3 per-centage points. The recent U.S. recession—reflectedin the 1.1 percent GDP growth in 2001, comparedto the more than 4 percent growth in 2000—pro-vided an almost identical picture. The average fore-cast error in 2000 (for growth in 2001) was 2 per-centage points, and it dropped to 0.3 percentagepoints in 2001 (figure 1.14).
This experience implies that uncertainty maybe relatively small for the 2002 growth rate fore-casts, but substantially larger concerning thestrength of the recovery in 2003. Figure 1.15 showsthat the current cycle, including the baseline fore-cast, is expected to have a recovery pattern similarto the 1990–91 cycle. Although the recent recessionseems more shallow, the deceleration in growth wasactually quite similar, as could be the acceleration.With the larger share of high-tech production inthe current cycle, and possible further stimuluspackages, the recovery could even turn out to besharper. However, there are also significant down-side risks to this prediction. The prospects for high-tech industries depend, to a large extent, on thesentiment in financial markets, which is notori-ously difficult to predict. Continued nervousnessabout future profitability could make the recoverymore fragile than is currently forecast.
The prospects after the coming recovery areeven more uncertain, particularly given that earlierrecessions were often followed by a second dip.For example, in the beginning of 1993 U.S. GDPgrowth again fell below zero following the Euro-pean recession. Since the current regional cyclesare much more synchronized than a decade ago,such a strong double dip is not foreseen in thebaseline. However, the cumulated financial imbal-ances in the U.S. economy could set off another re-versal in market sentiment, leading to a sharperslowdown after the current recovery than is antici-pated in the baseline forecast. In other words, amajor risk is that the cyclical pattern could bemore pronounced than is assumed in the baseline,with a stronger recovery, but a substantial reversalin the medium run.
Although the recovery may be stronger thancurrently anticipated, possible downside risks de-
26

C H A L L E N G E S F O R D E V E L O P I N G C O U N T R I E S D U R I N G T H E C O M I N G G L O B A L R E C O V E R Y
serve more attention, since they often pose moreserious challenges than do upside risks. Becausethe baseline forecast does not anticipate new majoradverse shocks to the global economy, assumesonly limited contagion from the breakdown of theArgentine economy, foresees an uninterrupted re-covery of Turkey’s economy, and excludes an out-
right Japanese banking crisis in the short run, thedownside risks are significant.
Japan is mired in deep recession and deflation,with corporate profits declining sharply and bank-ruptcies mounting, and is beset by heighteningconcerns about credit availability and the sound-ness of the banking system. Commercial banks
27
Month forecast was made, percent
Figure 1.14 Forecasting the 2001 U.S. slowdown
Source: World Bank; International Monetary Fund; OECD Secretariat.
0
Jan.2000
April2000
July2000
Oct.2000
Jan.2001
Apr.2001
July2001
Oct.2001
Jan.2002
Actualoutcome
1
2
3
4
WBIMFOECDConsensus
Annualized quarterly growth, trough of recession = 0
Figure 1.15 Two recessions in the United States, 1990–91 and 2001
Source: World Bank Economic Policy and Prospects Group.
–4
–2
0
2
4
6
8
10
–12 –10 –8 –6 –4 –2 0 2 4 6 8 10 12
Q1, 1988–Q4, 1994
Q4, 1998–Q4, 2001
Q1, 2002–Q3, 2004 (f)

G L O B A L D E V E L O P M E N T F I N A N C E
have become hesitant to lend, while the banks’capital base is being eroded by falling equityprices—commercial bank stocks dropped 45 per-cent during 2001. Credit availability for smallercompanies is tight, a flight to quality into Japanesegovernment bonds has ensued, and Japanese sov-ereign debt has been downgraded by Moody’s andother credit rating agencies.
However serious these problems are, theprobability of a full-blown crisis seems to be rela-tively low in the near term because the economywill benefit from the recovery of export demand,possibly fueled by a weakening of the yen. Such adepreciation could help to fight deflation throughan increase in exports and a rise in import prices.This could have a negative impact on emergingcountries in Asia who compete with Japanese ex-porters, depend on Japanese imports, or are recipi-ents of Japanese FDI. However the adverse im-pacts are likely to be limited in the case of amodest depreciation, since the yen has appreciatedin recent years, most countries in the region haveadopted flexible exchange rate systems, and agradual real depreciation of the yen seems war-ranted from a structural perspective.
Whatever happens in the current rebound ofthe global economy, the challenges are formidablein the medium term. The escalation of Japan’s fis-cal deficit has limited the scope for large injectionsof public funds for re-capitalization or closure ofinstitutions. The major risk of a severe credit crunchis growing rather than shrinking. A sharp fall inJapanese domestic demand would be a major set-back for developing economies in East Asia, with,for example, 15 percent of Chinese exports and 11 percent of Korean exports going to Japan.
Notes1. See Global Economic Prospects 2002 (World Bank
2001).2. The so-called accelerator mechanism makes inven-
tory and investment cycles much more pronounced thancyclical developments in other components of aggregate de-mand. Firms generally attempt to keep the stock of invento-ries and capital goods at a desired ratio to GDP. This impliesthat the flows of inventory accumulation and investment arelinked to changes in GDP. Thus as stocks reach desired lev-els, the change in inventory accumulation and investmentfrom the previous period can be quite large, generatingsharp changes and turning points in GDP growth.
3. The Stability and Growth Pact, setting out the rulesfor budgetary behavior in stage three of the EuropeanUnion’s (EU’s) Economic and Monetary Union, provides for
a degree of budgetary flexibility during severe recessions.While the projected downturn in European economic activ-ity could not be described as a severe recession, the Septem-ber 11 attacks would certainly qualify as unusual eventsoutside the control of member states. And some flexibility infiscal positions may be witnessed in the short run.
4. On a momentum basis (quarter-over-quarter), theseeconomies experienced the deceleration earlier, with a de-cline of 9 percent (seasonally adjusted annualized rate) inthe last quarter of 2000 and the first quarter of 2001, be-fore reaching 25 percent decline at the trough in the secondquarter.
5. Almost 40 percent of each year’s annual growth rateis determined by the quarterly growth pattern in the previ-ous year. The contribution of the previous year’s quarterlygrowth to the current year’s annual growth is called “carry-over.”
6. The average trade margin for total exports from in-dustrial countries toward developing countries is 3.8 per-cent, but is 5.5 percent for developing-country exports to-ward industrial countries.
7. The impacts of higher international trade marginswere evaluated using the World Bank’s global computablegeneral equilibrium model of world trade (van der Mens-brugghe 2001).
8. World Tourism Organization, Tourism IndustryTakes Action to End Crisis, November 12, 2001. www.world-tourism.org.
9. World Tourism Organization third quarter 2001news release. Other information confirms the sharp drop intourism: two months after September 11 worldwide travelreservations were 12 to 15 percent below levels of the previ-ous year.
10. Not all of the countries highly dependent on travelservices are tourist destinations. A few countries affected byconflict (for example Sierra Leone and Rwanda) are depen-dent on revenues from travel services, probably due to thepresence of staff from international organizations and non-governmental organizations, as well as the presence of peace-keepers. The data from IMF’s Balance of Payments databaselack sufficient detail to separate out the different purchasersof travel services for these countries.
11. An interesting example of the impact of technologyon commodity production is the new technique for cuttingtwo-by-fours from logs. In the past a curved log could notbe used to produce a straight board without huge wastage.However, lasers and computers are now used to scan a logand cut with the curve of the log. The two-by-fours are thenpressed and dried to produce a straight board from a crookedlog.
12. Vietnam reformed coffee marketing, which re-sulted in a large increase in the producer’s share of interna-tional prices and led to a significant increase in exports.
13. To some extent this has already begun. A notewor-thy difference between Doha and previous ministerials wasthe active involvement of representatives of developmentministries on national delegations. National developmentcommunities and stakeholders represent a potentially pow-erful constituency in many European countries.
14. The price used to represent oil market conditions isthe average of West Texas Intermediate and Brent and Dubaicrudes, and is roughly equivalent to the Brent price.
28

C H A L L E N G E S F O R D E V E L O P I N G C O U N T R I E S D U R I N G T H E C O M I N G G L O B A L R E C O V E R Y
15. See appendix 4 for a fuller treatment of recentmacroeconomic and financial developments and prospectsfor the developing regions.
16. The manufacturing unit value (MUV) of exports indollar terms from the G-5 countries to developing countriesis anticipated to rise by 3.6 and 3.7 percent respectively in2003–04, reflecting market expectations for a likely weak-ening of the dollar against the euro over the next years,counterbalanced by a trend of strength relative to the yen.For non-oil developing-country exporters, such develop-ment is likely to offset part of the firming of non-oil com-modity prices, while mitigating gains from lower fuel im-port prices. For hydrocarbons exporters, the up-trend inMUV will serve to pressure terms of trade yet further.
17. See, for example, Batchelor 2001 and Loungani2000.
18. IMF 1990a and 1990b. The World Bank did notproduce annual forecasts at that time.
ReferencesThe word processed describes informally reproduced worksthat may not be commonly available through libraries.
Batchelor, R. A. 2001. “How Useful Are Forecasts of Inter-governmental Agencies? The IMF and OECD versusthe Consensus.” Applied Economics 33 (2): 225–35.
Hertel, Thomas W., Bernard M. Hoekman, and Will Mar-tin. 2000. “Developing Countries and a New Round ofWTO Negotiations.” World Bank, Washington, D.C.Processed.
IMF (International Monetary Fund). 1990a. World Eco-nomic Outlook. Washington, D.C.
———. 1990b. World Economic Outlook. Washington,D.C.
Loungani, Prakash. 2000. “How Accurate Are Private Sec-tor Forecasts? Cross-Country Evidence from Consen-sus Forecasts of Output Growth.” IMF Working PaperWP/00/77. IMF, Washington, D.C.
OECD (Organisation for Economic Co-operation and De-velopment). 1990a. OECD Economic Outlook 47(June).
———. 1990b. OECD Economic Outlook 48 (December).van der Mensbrugghe, Dominique. 2001. “Linkage Techni-
cal Reference Document.” World Bank, Washington,D.C.
World Bank 2001. Global Economic Prospects 2002. Wash-ington, D.C.
World Tourism Organization. 2001: “Tourism IndustryTakes Action to End Crisis.” November 12. www.world-tourism.org
———. News bulletin. Third quarter 2001 news release.
29


2Private Capital Flows to Emerging Markets
The global slowdown reduced capitalmarket flows to developing countries
The global economic slowdown in 2001 trans-lated into reduced private capital flows to de-
veloping countries. The reevaluation of prospectivereturns in technology investments severely reduceddemand for developing countries’ technologystocks. Further, the global slowdown and collapseof equities prices increased the riskiness of the debtof highly leveraged corporations, reduced investors’appetite for risk, and increased economic uncer-tainty. All of these had the effect of tightening banklending criteria and reducing access by speculative-grade borrowers, which sharply depressed banklending to developing countries. By contrast, bondissues by developing countries remained stable, be-cause the share of developing-country investment-grade borrowers is greater among bond issuers thanbank borrowers. The level of foreign direct invest-ment (FDI) in 2001 was virtually unchanged fromthe previous year, with changes in flows largely dri-ven by changes in the domestic economic environ-ment, by large privatization transactions, or by afew major private sector acquisitions.
Financial crises highlighted the problems ofrescue packagesThe crisis in Argentina highlighted the challengesfacing the international community in assistingcountries in crisis. Fixed exchange rate regimes arevulnerable to asymmetric shocks. There are severecosts associated with hanging on to a pegged, over-valued exchange rate. The success of multilateralrescue packages depends critically on strong ad-justment by recipient countries. Contagion can becontained through prudent external financial man-agement, including flexible exchange rates, disci-
31
.
plined domestic monetary polices, and lowershort-term debt. Finally, there is more work to bedone on private sector involvement in crisis pre-vention and resolution. Recent experience has un-derlined the importance of a clear definition of thelimits on official resources and of the role and re-sponsibilities of the official sector, debtor coun-tries, and their private creditors. This challengepoints to the need to consider more ambitious pro-posals for facilitating orderly workouts of prob-lematic private sector debts, and the recent pro-posal by the International Monetary Fund (IMF)to provide for a standstill of debt payments toallow time for an orderly restructuring will, nodoubt, be debated in the year ahead.
No significant recovery in capital flows until 2003Capital market flows are forecast to decline furtherin 2002. Investors are likely to remain cautiousabout emerging markets, because low growth andrecession in industrial countries limits demand fordeveloping countries’ exports, financing constraintson banks and other investors remain tight, and theappetite for risk remains low. The recovery antici-pated to begin in the second half of 2002, coupledwith low interest rates, should spark a rise in capi-tal market flows in 2003–04. Nevertheless, the in-crease in flows will remain modest, since commod-ity exports will continue to experience low exportrevenues, investors will remain concerned after thestring of emerging market crises since the mid-1990s, and low rates of capacity utilization will re-duce the need for capital in some of the more cred-itworthy developing countries. FDI flows shouldremain high, and perhaps rise somewhat, over thenext few years, while growth in developing coun-

G L O B A L D E V E L O P M E N T F I N A N C E
tries accelerates and they continue to enjoy the ben-efits from sustained improvements in policies overthe past 10 years. FDI flows are likely to remain thelargest source of external finance for developingcountries.
Net resource flows
The global slowdown has depressed capitalflows to developing countriesDeveloping countries’ net long-term flows (grossinflows of capital less amortization) fell to an esti-mated $196 billion in 2001, $65 billion below theprevious year’s level and $145 billion less than thepeak in 1997 (see table 2.1, and see annex 2.2 for a definition of the measurement of capital flowsused). Expressed as a share of gross domestic prod-uct (GDP), net long-term flows have fallen from5.3 percent in 1997 to 3.1 percent in 2001. Deteri-orating prospects for developing countries, the col-lapse in the price of technology stocks, the crises inArgentina and Turkey, and increased concern overrisk have reduced demand for developing-countrydebt. Speculative-grade borrowers saw a sharp fallin access, with much higher spreads and sharplyreduced flows. By contrast, investment-grade bor-rowers enjoyed improved terms from the decline ininterest rates.1 The decline in access to capital mar-kets exacerbated the impact of the global growthslowdown on developing countries. This experi-ence contrasts sharply with the early 1990s, when
lower interest rates and increased access by devel-oping countries helped to cushion the impact ofthe global recession. FDI, which is less sensitive tocyclical changes in output than capital marketflows, was little changed from the previous year,and remained only $16 billion below the peak levelof 1999.
Capital market flows
Developing countries’ access to capital marketsdeteriorated substantially in 2001. Total cap-
ital market commitments (bank loans, bond issues,and portfolio equity) declined to an estimated$171 billion, about one-quarter less than the levelin 2000 (see table 2.2). External factors played thepredominant role in reducing external finance.The slowdown in industrial countries led to a de-cline in developing countries’ export revenues, theimpact of which was only in part mitigated by the drop in international interest rates. Becausemost developing-country borrowers are specula-tive grade, they were hurt by a widespread retreatfrom speculative-grade investments. Slower growthand the collapse of technology stock prices in-creased uncertainty and sharply reduced the wealthof investors in high-risk assets, and thus reducedtheir appetite for risk. Private flows failed to com-pensate for adverse cyclical conditions; the fall indeveloping countries’ market access exacerbatedthe impact on growth of reduced demand for theirexports.
32
Table 2.1 Net long-term resource flows to developing countries, 1991–2001(billions of dollars)
1991 1992 1993 1994 1995 1996 1997 1998 1999 2000a 2001b
Net long-term resource flows 124.2 153.7 220.9 222.4 260.2 306.6 341.4 336.7 271.8 261.1 196.5Official flows 62.2 54.3 53.4 46.0 54.1 30.3 40.7 53.4 47.4 35.3 36.5Private flows 62.0 99.4 167.6 176.4 206.1 276.2 300.7 283.3 224.4 225.8 160.0
Capital markets 26.4 52.2 101.0 86.3 99.3 145.5 128.2 105.0 40.1 59.1 –8.3Debt flows 18.8 38.2 50.0 51.2 63.3 96.5 98.1 89.4 5.6 8.2 –26.8
Bank lending 5.0 16.3 4.1 9.3 30.9 32.2 45.6 51.9 –23.3 –6.1 –32.3Bond financing 11.0 11.1 36.7 38.1 30.7 62.3 49.6 40.9 29.5 16.9 9.5Other 2.9 10.8 9.2 3.7 1.7 2.1 2.9 –3.4 –0.5 –2.5 –4.0
Equity flows 7.6 14.1 51.0 35.2 36.1 48.9 30.1 15.6 34.5 50.9 18.5FDI 35.7 47.1 66.6 90.0 106.8 130.8 172.5 178.3 184.4 166.7 168.2
a. Preliminary.b. Estimate.Source: World Bank.

P R I V A T E C A P I T A L F L O W S T O E M E R G I N G M A R K E T S
Slowdown in world trade partially offset bylower interest ratesThe growth slowdown in industrial countries re-duced developing countries’ export revenues, butthe direct impact on borrowing capacity, at leastfor investment-grade borrowers, was softened bythe fall in interest rates. The drop in world tradegrowth coupled with the continued fall in com-modity prices (see chapter 1) reduced developingcountries’ export revenues by almost 1 percent indollar terms in 2001.2 The export revenues of theEast Asian and Latin American regions, which ac-counted for almost three-fourths of developingcountries’ private-source debt in 2000, fell by 2percent in 2001 (compared with a rise of 20 per-cent in the previous year). This decline would haveincreased the aggregate debt to exports ratio of thetwo regions by 3 percentage points (from 123 to126 percent), if there had been no net borrowing in2001. However, slower growth in industrial coun-tries also resulted in a significant fall in short-terminterest rates, because the demand for funds de-clined and central banks in the United States andEurope cut policy rates. The fall in interest rates re-sulted in improved terms on new lending for manydeveloping countries. For example, in 2001 the in-terest rate on new bond issues by investment-gradesovereign borrowers among developing countriesfell by 130 basis points, compared with the previ-ous year. At unchanged debt levels, the two regionswould have seen a decline in the ratio of interestpayments to exports from 7.6 percent in 2000 to 7 percent in 2001.3 Thus, the direct impact of thegrowth slowdown on borrowing capacity was rela-tively modest, particularly in comparison with thesharp deterioration in debt ratios during the reces-sion of the mid-1970s and early 1980s (although
debt ratios improved in the early 1990s reces-sion—see table 2.3).
The impact of the technology crashThe reevaluation of prospective returns in technol-ogy sectors also had a role in reducing flows to de-veloping countries. By the middle of 2000, marketsperceived that the investment boom in telecommu-nications had created massive overcapacity, andthat many of the newly formed Internet companieswould be unlikely to generate the profits requiredto justify the investments made. This reevaluationof the likely profits from technology investmentsled to a general drop in technology stocks, whilethe slowdown depressed equities prices in general.The technology-heavy Nasdaq index fell 21 per-cent in 2001, and an index of global informationtechnology and telecommunications stocks (theMorgan Stanley Global Industry Indices) fell 28percent. By contrast, the more broad-based DowJones industrial index fell 7 percent.
Just as the boom in global stock markets in1995–99 encouraged greater equity placementsfrom developing countries, it appears that thesharp fall in stock markets is now associated witha decline in placements. Developing-country aver-age stock market prices, after falling by 33 percentin 2000, dropped another 5 percent in 2001. The
33
Table 2.2 Capital market commitments to developing countries, 1991–2001(billions of dollars)
1991 1992 1993 1994 1995 1996 1997 1998 1999 2000 2001a
Total 77 80 116 135 173 236 316 189 178 228 171Bond issuance 11 20 50 46 53 98 114 73 68 68 68Bank lending 61 54 57 73 113 125 179 108 90 125 93Equity Placement 5 6 8 17 8 14 22 9 20 35 10
Note: The data in this table are gross commitments, and thus differ significantly from the data in table 2.1 which are gross disbursementsminus amortization. The data on equity placements refer only to initial offerings of equity transactions marketed across borders, and do notinclude net purchases of securities by foreigners in domestic stock markets (which are included in the line “equity flows” in table 2.1).a. Estimate.
Table 2.3 Debt ratios during recessions,East Asia and Latin America(percent)
1973 1975 1980 1982 1991 1993
Debt to export 123 135 124 169 140 127Interest to export 6.6 8.7 11.7 17.9 7.5 6.4
Source: World Bank.
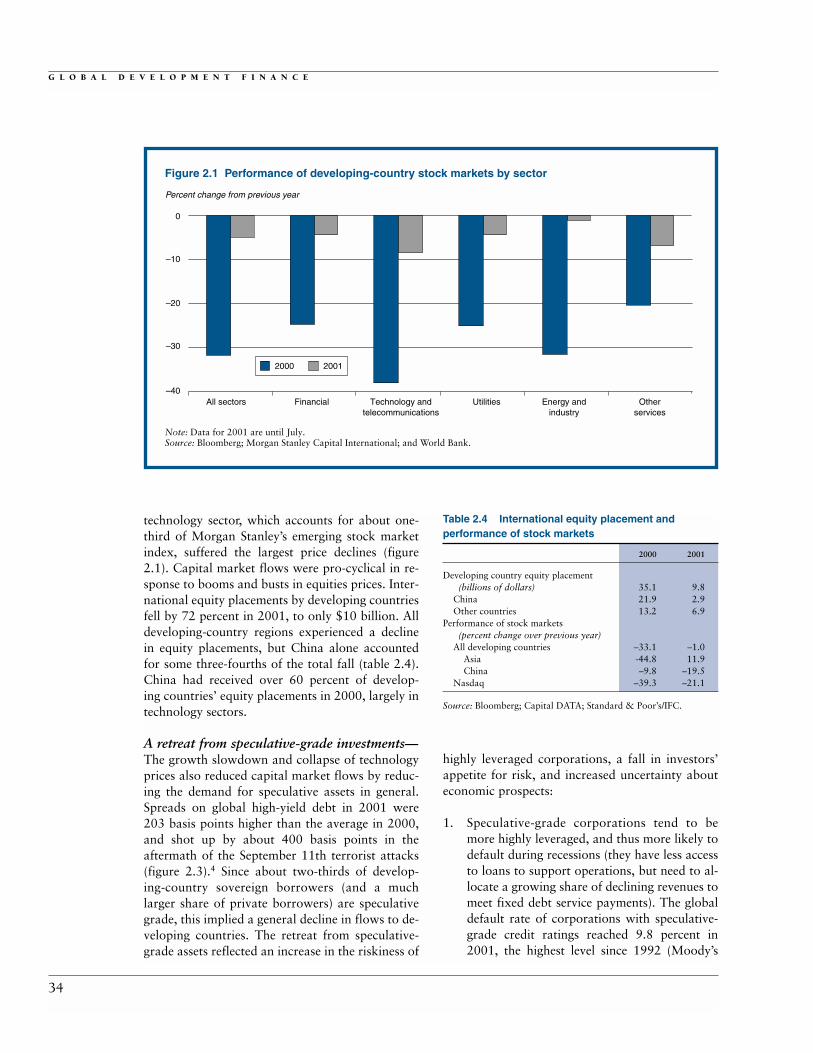
G L O B A L D E V E L O P M E N T F I N A N C E
technology sector, which accounts for about one-third of Morgan Stanley’s emerging stock marketindex, suffered the largest price declines (figure2.1). Capital market flows were pro-cyclical in re-sponse to booms and busts in equities prices. Inter-national equity placements by developing countriesfell by 72 percent in 2001, to only $10 billion. Alldeveloping-country regions experienced a declinein equity placements, but China alone accountedfor some three-fourths of the total fall (table 2.4).China had received over 60 percent of develop-ing countries’ equity placements in 2000, largely intechnology sectors.
A retreat from speculative-grade investments—The growth slowdown and collapse of technologyprices also reduced capital market flows by reduc-ing the demand for speculative assets in general.Spreads on global high-yield debt in 2001 were203 basis points higher than the average in 2000,and shot up by about 400 basis points in the aftermath of the September 11th terrorist attacks(figure 2.3).4 Since about two-thirds of develop-ing-country sovereign borrowers (and a muchlarger share of private borrowers) are speculativegrade, this implied a general decline in flows to de-veloping countries. The retreat from speculative-grade assets reflected an increase in the riskiness of
highly leveraged corporations, a fall in investors’appetite for risk, and increased uncertainty abouteconomic prospects:
1. Speculative-grade corporations tend to bemore highly leveraged, and thus more likely todefault during recessions (they have less accessto loans to support operations, but need to al-locate a growing share of declining revenues tomeet fixed debt service payments). The globaldefault rate of corporations with speculative-grade credit ratings reached 9.8 percent in2001, the highest level since 1992 (Moody’s
34
Percent change from previous year
Figure 2.1 Performance of developing-country stock markets by sector
Note: Data for 2001 are until July.Source: Bloomberg; Morgan Stanley Capital International; and World Bank.
0
–10
–20
–30
–40All sectors Financial Technology and
telecommunicationsUtilities Energy and
industryOther
services
2000 2001
Table 2.4 International equity placement and performance of stock markets
2000 2001
Developing country equity placement (billions of dollars) 35.1 9.8
China 21.9 2.9Other countries 13.2 6.9
Performance of stock markets (percent change over previous year)
All developing countries –33.1 –1.0Asia -44.8 11.9China –9.8 –19.5
Nasdaq –39.3 –21.1
Source: Bloomberg; Capital DATA; Standard & Poor’s/IFC.

P R I V A T E C A P I T A L F L O W S T O E M E R G I N G M A R K E T S
Investor Service). Therefore, when growthslows banks tend to tighten their credit stan-dards to restrict loans to speculative-gradeborrowers, both in reaction to the deteriora-tion in the banks’ portfolios while default ratesincrease and in anticipation of the impact ofrecession on highly leveraged corporations.The percentage of U.S. banks tightening theirlending conditions exceeded that of the reces-sion of the early 1990s (figure 2.2), and thevolume of global cross-border bank lendingcommitments fell by 13 percent in 2001. Whilebank credit contracted in all categories ofcredit risk, the most severe pull back was fromthe high-risk borrowers.5
2. Reduced demand for speculative-grade assetsalso may have reflected investors’ reducedappetite for risk after their wealth declined(see box 2.1), exacerbated by the events ofSeptember 11. Investors in high-risk assetshave experienced a sharp fall in wealth: sinceits peak in early 2000, the market capitaliza-tion of the Nasdaq stock index has fallen byover $3 trillion.
3. Reduced demand for speculative assets mayalso reflect increased uncertainty about eco-nomic prospects. The collapse of technologystocks and the industrial countries’ plunge from3.4 percent growth in 2000 to 1 percent in
2001 may have increased the range of out-comes that investors feel they should consider.Increased uncertainty can cause risk-averse in-vestors to reduce the share of high-risk assetsin their portfolios.
For all of these reasons, the past year has seen awidespread retreat from speculative-grade borrow-ers. Because their share in total developing-countryborrowers is three times that of industrial-countryborrowers, the decline in loan commitments to de-veloping countries was relatively large. Bank lend-ing to developing countries dropped to $93 billionin 2001, or less than 75 percent of the 2000 fig-ure—the second-lowest annual level since 1994.The decline in commitments was biased againstnew entrants to the market: the share of bankcredit attributed to refinancing rose from 26 per-cent in 2000 to 34 percent in 2001. The cost ofrefinancing for investment-grade borrowers roseminimally. By contrast, the cost of refinancing forborrowers rated below-investment-grade rosesharply and loan maturities fell. Unlike the case forbonds (see next paragraph), the decline in banklending affected most developing countries. Evenexcluding Argentina and Turkey, which are suffer-ing severe domestic crises, and Brazil, which hadbeen greatly affected by developments in Argentinaduring most of 2001, the decline in bank lending
35
Billions of dollars Percent
Figure 2.2 Bank lending standards and bank credit to developing countries, 1990–2001
Note: Data for 2001 are until the second quarter. Tightening of lending materials refers to the share of banks in the United Statesthat reported a tightening of their standards and terms on commercial and industrial loans over the past three months, as reported in the quarterly survey of the U.S. Federal Reserve Board.Source: Capital DATA Loanware; U.S. Federal Reserve Board.
1990 1991 1992 1993 1994 1995 1996 1997 1998 1999 2000
Bank lending to developing countries
Tightening of bank lending standards
20010
50
100
150
200
–20
0
20
40
60

G L O B A L D E V E L O P M E N T F I N A N C E
was about 25 percent. Bank lending is less tolerantof changes in risk than are bond markets, reflect-ing banks’ high leverage and the greater concentra-tion of their loan portfolio compared to investorsin bonds.
—might benefit developing-country bondsPerhaps surprisingly, the reduced demand for high-risk assets may have helped support developingcountries’ bond issues, which remained stable in2001, at $68 billion. Developing-country bond is-suers have higher credit ratings, on average, thandeveloping-country bank borrowers. Thus bond is-sues were less affected by increased uncertainty andreduced appetite for risk. Moreover, the decline ininterest rates and a slight reduction in investment-grade spreads implied a significant reduction in in-terest rates for investment-grade borrowers, thusencouraging more of them to come to the market.
The stability in bond volume in 2001 was sup-ported by increased borrowing by higher qualityborrowers (rated either investment grade or justbelow), including China, Hungary, Malaysia, Mex-ico, and Poland, as well as smaller borrowers, suchas Colombia, Latvia, Panama, and Uruguay.
Reduced capital flows partially reflect a fall in demandDeclines in the demand for capital played a mod-est role in determining the volume of capital mar-ket commitments in 2001. Most developing coun-tries’ access to foreign capital is constrained by thewillingness of foreign investors and lenders to sup-ply funds. However, a few countries could borrowmore even at the current interest rate, but do notbecause their demand for capital is low. For exam-ple, during 1998–99 the demand for funds fromthe East Asian crisis countries collapsed with the
36
Changes in investors’ appetite for risk are often associ-ated with changes in developing-country access to
private capital flows. The appetite for risk under condi-tions of uncertainty in part depends on the level of wealth(Guay 1999 shows this in a theoretical model of man-agers’ behavior). Because each dollar of income becomesmore important as wealth declines, risk-averse investorsare less willing to undertake greater risks at lower levels ofwealth. Clark (1998) finds that one reason for capitalflows from rich to poor countries is that the higher wealthof rich countries’ investors makes them more willing toundertake risky investments. The converse of this effectwas important during the Russian devaluation of 1998,when huge losses suffered by investors in Russian securi-ties reduced the appetite for risk (Kumar and Persaud2001; Institute of International Finance 1998), and capitalflows to developing countries collapsed.
However, apart from crises that are clearly related tochanges in investors’ wealth, it is difficult to determinewhether changes in the appetite for risk have had an im-portant impact on market access. The appetite for risk isextremely difficult to measure. Market sources, includingChase Securities, J. P. Morgan, and Credit Suisse–FirstBoston, do provide statistical approaches to measuring in-vestors’ appetite for risk. These indices generally includemeasures of market liquidity: for example, spreads be-tween recently issued and off-the-run Treasury securities;6
and measures of credit risk, including spreads betweenrisk-free and high-risk assets, differences between theriskier small-cap stocks and the S&P 500, foreign ex-change volatility, and changes in the price of options rela-tive to their value if exercised (referred to as impliedvolatility). In general these indices do record reductions inthe appetite for risk during periods when it is likely thatsuch declines occurred, for example the Russian devalua-tion of August 1998. In addition, the J.P. Morgan indexregisters a substantial rise in risk aversion during July 2001when the Argentine crisis deteriorated, and then immedi-ately following the September 11th attacks.
However, these indicators face difficulties in distin-guishing between changes in risk appetite and changes inthe riskiness of assets. For example, deterioration ingrowth could harm credit quality and thus raise high-riskspreads in general. While risk appetite may also decline,the change in spreads would be a combination of the tworather than predominantly a measure of the appetite forrisk. Similarly, greater willingness to hedge against risk(measured by increases in the implied volatility of optionscontracts) may represent reduced appetite for risk or theperception that the environment has become more risky(Kumar and Persaud 2001). Thus, the indicators havevalue in alerting market observers to changes in the de-mand for risky assets, but are less effective in determiningthe cause.
Box 2.1 Evidence of changes in the appetite for riskand capital market flows

P R I V A T E C A P I T A L F L O W S T O E M E R G I N G M A R K E T S
30 percent fall in investment, and they ran largecurrent account surpluses. Capital market com-mitments to the crisis countries fell to about $30billion per year during this period, compared with$74 billion in 1997. It appears that demand alsoremained low in the five crisis countries in 2001,since investment fell slightly and the governmentdeficit improved by almost 1 percent of GDP. Cap-ital market commitments fell to $34 billion. Thuslow demand from the crisis countries most likelyreduced the level of capital market commitmentscompared with what would have happened with arobust recovery. Nevertheless, there was no repeatof the experience of the 1998–99 period, when thedrop in capital market commitments in the crisiscountries had a noticeable impact on the total for developing countries. A few of the richer oil-exporting developing countries also reduced theircapital market commitments in 2001, presumablychoosing to increase saving in response to contin-ued high oil prices.
Capital market commitments declined untillate in the yearThe overall decline in capital market commitmentsaccelerated in 2001 while the global slowdowndeepened. Capital market commitments fell to about
$16 billion per month during the first half of 2001(compared with $19 billion per month in 2000),and then dropped to only $9 billion per month fol-lowing the September 11 terrorist attacks (table2.5). Spreads on developing countries shot up to924 basis points in the aftermath of the attacks,compared with 716 basis points in the first half of2001, although the rise in spreads (excluding Ar-gentina and Turkey, the two major countries mostaffected by domestic economic crises) was modest.Commitments recovered during the last quarter, butremained well below the 2000 level. The averagespread excluding Argentina and Turkey fell to 400basis points (100 basis points below the average ofthe previous year) while interest rates fell and opti-mism about an early recovery increased.
Trends in FDI
Net FDI to developing countries is estimated at $168 billion in 2001, almost unchanged
from the previous year, and just 8 percent belowthe peak reached in 1999. The stability of FDIflows was achieved in the face of a significant fallin global FDI flows. Changes in FDI flows to de-veloping countries in 2001 were driven more by
37
Risk premium (basis point) Default rate (percent)
Figure 2.3 Corporate default rate and risk premiums, 1990–2001
Source: Moody’s Investor Service; Merrill Lynch.
0
Dec.1990
Industrial-country high-risk corporate default rate
Developing-countryrisk premium
Industrial-countryhigh-risk premium
200
400
600
800
1,000
1,200
0
2
4
6
8
10
12
14
Dec.1991
Dec.1992
Dec.1993
Dec.1994
Dec.1995
Dec.1996
Dec.1997
Dec.1998
Dec.1999
Dec.2000
Dec.2001
1,555 1,485

G L O B A L D E V E L O P M E N T F I N A N C E
domestic economic developments (for example de-cisions over privatization transactions and policyimprovements) in a few of the large FDI recipientsthan by changes in the global economy.
Global FDI in downturn—Preliminary estimates from the United Nations Con-ference on Trade and Development (UNCTAD) in-dicate that global FDI flows fell massively in 2001,to $760 billion from about $1.3 trillion in the pre-vious year. Global mergers and acquisitions (M&A)activity show a 45 percent drop in 2001. Slowgrowth or recession is often associated with a de-cline in FDI outflows (paralleling the decline indomestic investment) since multinational corpora-tions face stringent financing constraints with the
decline in profits and tightening of bank creditstandards. For example, FDI outflows from theUnited States dropped from $19 billion in 1980 toonly $1 billion during the 1982 recession year, andthen recovered to $13 billion in 1984.
—but developing countries were less affectedThe past years have seen considerable stability inFDI flows to developing countries, although theirshare of global FDI flows was cut in half in thewake of the Asian crisis. Essentially, the trends ob-served since FDI flows plateaued in the late 1990shave remained constant. Developing countries’share of global FDI flows turned up with the dropin global flows, but remained well below the 36percent level reached in 1997 (see figure 2.4). FDI
38
Table 2.5 Capital market commitments and spreads for developing countries
2000 2001
January–June July–August September–October November–December
(monthly average, billions of dollars)Capital market commitments 19.3 15.8 12.7 9.3 16.6
Bonds 5.7 6.9 4.1 2.5 6.8Banks 10.6 7.7 7.9 6.7 9.1Equity 3.0 1.2 0.6 0.2 0.7
(basis points)Developing-country spreads 707 716 844 924 865
without Argentina and Turkey 507 440 416 447 404
Note: Developing-country spreads refer to J. P. Morgan Chase’s Emerging Market Bond Index Global, which uses country weights based onmarket capitalization of outstanding debt.Source: Dealogic; J. P. Morgan Chase; World Bank staff calculations.
Billions of dollars Percent
Figure 2.4 FDI and M&A in developing countries, 1991–2001
FDI
Source: World Bank, Global Development Finance: Country Tables and sources cited therein, various years; UNCTAD, World Investment Report 2001; World Bank staff estimates for 2001.
0
50
100
150
200
1991 1992 1993 1994 1995 1996 1997 1998 1999 2000 20010
10
20
30
40
Billions of dollars PercentM&A
0
10
20
30
40
50
60
70
80
90
1991 1992 1993 1994 1995 1996 1997 1998 1999 2000 20010
2
4
6
8
10
12
14
16
18
20
Developing countries Share of total (right axis)

P R I V A T E C A P I T A L F L O W S T O E M E R G I N G M A R K E T S
flows continue to decline relative to developingcountries’ GDP, down to 2.3 percent in 2001 from3 percent in 1998. FDI flows remain highly con-centrated: as has been true for the past few years,the top 10 recipients of FDI received over 70 per-cent of total FDI to developing countries (box 2.2).
The stability of FDI flows in 2001 largely re-flects offsetting changes in a few large countries
rather than the impact of the economic slowdownor other global factors. Eight out of the top ten re-cipients saw changes (either increases or decreases)in FDI flows of 20 percent or more from the previ-ous year. These changes were driven largely by in-ternal factors, often privatization, private sectorM&A transactions, or general domestic economicconditions. In Mexico the sale of Banamex-Accival
39
Most FDI flows have remained concentrated in just afew developing countries throughout the 1990s,
when the share of the top 10 has never fallen below 64percent.7 Market size appears to be a major explanation ofconcentration: of the top 10 developing-country FDIrecipients, 6 are also among the top 10 countries in termsof GDP, but market size is not the only factor. The averageratio of FDI to GDP in the top 10 recipients is almost afull percentage point higher than in developing countriesas a group (figure 2.5). While Brazil, China, and Mexicoalone account for about half of developing countries’ FDI,they make up only a little more than one-third of develop-ing countries’ GDP. While FDI flows to India—the fourthlargest developing country—have increased over the1990s, the country remains 14th on the list of developing-country FDI recipients.
FDI is also concentrated in relation to other indica-tors of economic activity. Of the 10 largest FDI recipients,7 are also the developing countries with the largest ex-ports. UNCTAD (2001) developed a more comprehensiveindex that measures FDI inflows relative to economic size,as represented by an unweighted average of three ratios—a country’s share in world FDI inflows to its share inworld GDP, employment, and exports. By this measure,FDI is mildly concentrated; only 30 out of 102 developingcountries had shares of FDI that equaled or exceeded theiraverage shares of world GDP, employment, and exports.Only half the top 10 FDI recipients received more FDIthan expected, based on their shares of global economicactivity. The concentration of FDI flows does not meanthat FDI only benefits the larger countries; all of the 10developing countries with the highest ratio of FDI to GDPare relatively small-scale economies.
FDI to some of the larger recipients has been boostedby good policies. The largest FDI recipients have an aver-age World Bank policy rating of 4.1, compared with 3.3for other developing countries. Perhaps more importantfor determining FDI flows, however, is the change in poli-cies. Countries that have undergone an improvement inthe investment climate may see a large inflow of FDI until
the stock reaches the levels desired by foreign investors.The huge surge in FDI to China with the introduction ofmarket reforms is perhaps the most spectacular example of this phenomenon. Similarly, FDI flows to Mexico wereboosted by Mexico’s entrance into the North AmericanFree Trade Agreement. FDI also has increased to countrieswith strong economic programs that liberalize the rulesgoverning FDI; for example, FDI to the Republic of Korearose from about $2 billion before the East Asian crisis toan average of $7 billion following the easing of rulesagainst foreign investment (see World Bank 2000a). Fi-nally, FDI has responded to government decisions on pri-vatization programs; 7 of the 10 largest FDI recipients re-ceived more than $1 billion in foreign funds to financeprivatization activities in 1999 (World Bank 2001).
The concentration of other flows is similar to that ofFDI. The 10 developing countries with the largest domesticinvestment levels accounted for 70 percent of all investmentin developing countries. This is unsurprising, because for-eign and domestic investors are likely to respond to thesame factors—market size and investment climate. More-over, FDI inflows tend to crowd in domestic investment(World Bank 2001, chapter 3; Bosworth and Collins 1999).The concentration of capital market flows is somewhathigher than FDI; the top 10 recipients accounted for 75 per-cent of total flows. Access to capital market flows dependson the presence of relatively well-developed financial mar-kets (Hausmann and Fernandez-Arias 2000). Thus whilethe poorest developing countries receive significant amountsof FDI, they receive almost no portfolio flows (see chapter3). A concentration of FDI flows is often observed withincountries as well. For example, nearly 90 percent of China’sFDI stock is in the coastal regions, almost all FDI flows toMexico were absorbed in central states and those borderingthe United States (UNCTAD 2001), while in India the topfive recipient states (Maharashtra, Tamil Nadu, Karnataka,Andhra Pradesh, and Delhi) accounted for 75 percent oftotal FDI approvals in 2000. Again, the quality of policiesappears to be a major determinant of the distribution ofFDI flows in India (Dollar, Iarossi, and Mengistae 2001).
Box 2.2 The concentration of FDI flows

G L O B A L D E V E L O P M E N T F I N A N C E
financial group to Citigroup for $12.5 billionboosted FDI flows, and in South Africa, a foreignfirm took over De Beers mining company by ac-quiring shares worth $20 billion. In Poland lowerFDI flows signaled the completion of major privati-zation transactions. In other countries changes inFDI flows reflected changes in the overall economicenvironment rather than the impact of a few trans-actions. Examples include Brazil, where economicuncertainty restrained greenfield FDI; Argentina,where lower FDI flows reflected a slowdown in pri-vate sector M&A transactions with the increasingeconomic difficulties; Korea, where the process ofcorporate and financial restructuring has slowed;8
and China, where FDI boomed with the anticipa-tion of accession to the World Trade Organization.The extent to which FDI inflows in China representadditional resources to the country remains opento question, because a significant portion of regis-tered FDI to China may have originated in thecountry (box 2.3).
These major changes largely determined theregional trends. FDI continued to fall in LatinAmerica, the largest recipient region, becausecross-border M&A activity in the region droppedby around 5 percent. Several privatization planshave been postponed or delayed (examples includeCopel, Brazil’s electricity generation and transmis-sion company, and Cintra, the holding company
of Mexico’s major airlines), whereas some foreigninvestors have withdrawn large-scale offers toacquire stakes in private companies (including twoBrazilian telecommunications companies). FDIflows to Eastern Europe remained stable; whilelarge-scale privatization programs in banking andtelecommunications neared completion, the regionreceived an increase in greenfield investment. NetFDI flows to Middle East and North Africa re-mained at about the level of the past few years.The De Beers sale boosted flows to Sub-SaharanAfrica. FDI to East Asia and Pacific declined de-spite higher FDI to China, because of slow growthin several regional economies, low demand forfunds in the high-tech industries, and reducedM&A transactions in the East Asian crisis coun-tries (figure 2.6).
Developing countries may also be a growingsource of FDIWhile the data are incomplete, it appears that de-veloping countries have become a major source ofFDI flows to other developing countries. Out of$185 billion FDI inflows to developing countries in1999, only $72 billion are identified by the Organ-isation for Economic Co-operation and Develop-ment (OECD) as coming from the industrial coun-tries. Developing countries also receive about $40billion in FDI flows from other high-income coun-tries.9 If these statistics are accurate, the remainderof developing countries’ FDI inflows (about one-third or $70 billion) would have to be from otherdeveloping countries (figure 2.7). South-South FDImay also have contributed to the resiliency of FDIflows during the financial crisis. By these calcula-tions, South-South FDI flows continued to rise in1998 and 1999 despite the financial crises, duringwhich total FDI flows from high-income OECDcountries declined.
South-South FDI has increased at the same timeas South-South trade was rising (intra-developingcountries imports rose from 30 percent of their totalimports in 1990 to 36 percent in 1999). Thus, theproduction and ownership structures of developingcountries seem to have become more integratedthrough FDI, not only with the industrial countries,but also with other developing countries. In addi-tion, major developing-country exporters who facequota restrictions in industrial countries may haveinvested abroad in order to export from countriesthat are less affected by such trade barriers.
40
Percent
Figure 2.5 FDI as ratio to GDP, 1991–2001
Source: World Bank, Global Development Finance: Country Tables and sourcescited therein, various years; World Bank, World Development Indicators, variousyears; World Bank staff estimates for 2001.
0
1991 1992 1993 1994 1995 1996 1997 1998 1999 2000 2001
All developing
Top 10
1
2
3
4
5
All developing countries Top 10 recipients

P R I V A T E C A P I T A L F L O W S T O E M E R G I N G M A R K E T S
41
FDI inflows to China surged in the 1990s, boosted bythe acceleration of market reforms and the introduc-
tion of incentives for FDI, including concessions on tax,leasing of land and property, government guarantees forinvestments, and special arrangements regarding retentionand repatriation of foreign exchange. Preferences for for-eign capital are believed to have encouraged Chinese in-vestors to move money offshore and then bring it back toChina disguised as foreign investment (Sicular 1998). An-other motivation for “round-tripping,” or “recycling,” isthe concern that the government may impose exchange re-strictions on residents, as occurred in July 1993 (Adams1993; Gunter 1996). Some early studies estimated thatround-tripping accounted for nearly a quarter of foreigninflows to China in 1992 (Lardy 1995, p. 1067; Harroldand Lall 1993, p. 24). The extent of recycling may haveincreased in recent years (box figure).
Throughout the 1990s, FDI inflows to China origi-nated mostly outside the industrial countries, notably fromHong Kong (China). For example, FDI inflows from HongKong constituted nearly half of total FDI flows to Chinain 1996. Hong Kong’s share has declined since 1997, tobelow 40 percent by 2000 (see table below). This declinehas been offset by a comparable increase in FDI inflowsreported from the Virgin Islands, however, which suggests
that there is round-tripping through this offshore financialcenter. The FDI inflows from Hong Kong (and the VirginIslands) appear to be highly correlated with outflows fromChina in the form of “other investment assets” (mostlybank deposits) held abroad by Chinese residents, and er-rors and omissions in China’s balance of payments (see fig-ure below). Hong Kong, in its turn, reports large amountsof FDI inflows from mainland China, and from offshore fi-nancial centers such as Bermuda and the Virgin Islands.
Box 2.3 Round-tripping of capital flows between Chinaand Hong Kong
Billions of dollars
Round-tripping of capital flows: China and Hong Kong (China), 1986–1999
Source: World Bank staff estimates.
–5
0
5
10
15
20
25
1986 1987 1988 1989 1990 1991 1992 1993 1994 1995 1996 1997 1998 1999
FDI inflows from Hong Kong (China) and Macao
Net errors and omissions
China’s FDI by source (percent)
1996 1998 1999 2000
Hong Kong (China) 50 42 40 38Virgin Islands (U.K.) 0 9 7 9United States 8 9 10 11Singapore 0 8 7 5Japan 9 8 7 7Taiwan (China) 8 7 6 6Korea, Democratic
People’s Republic of 0 4 3 4Germany 0 2 3 3Netherlands 0 2 1 2France 1 2 2 2Others 24 7 14 13

G L O B A L D E V E L O P M E N T F I N A N C E
The data given above calculate South-SouthFDI by comparing developing countries’ FDI in-flows with recorded outflows from other regions.This is probably more reliable than basing the cal-culation on identified outflows from developingcountries. The problem of under-reporting FDIoutflows is acute in the developing countries,
many of which have capital controls, exchangecontrols, and high taxes on investment incomes,combined with weak accounting rules and tax ad-ministration. Nevertheless, the trend of increasingoutflows of FDI from developing countries is alsoevident from the data on identified outflows re-ported in the country pages of the IMF balance of
42
Billions of dollars
Figure 2.6 Regional trends of FDI flows, 1991–2001
Source: World Bank, Global Development Finance: Country Tables and sources cited therein, various years;World Bank staff estimates for 2001.
East Asiaand Pacific
Europe andCentral Asia
Latin Americaand the Caribbean
Middle East andNorth Africa
South Asia
Sub-Saharan Africa
–10
0
10
20
30
40
50
60
70
80
90
100
1991 1992 1993 1994 1995 1996 1997 1998 1999 2000 2001
FDI flows to developing countries North-South and South-South FDI shares
Billions of dollars Percent
Figure 2.7 North-South and South-South FDI, 1991–99
Source: World Bank staff estimates.
–20
0
20
40
60
80
100
120
1991 1992 1993 1994 1995 1996 1997 1998 1999
–20
0
20
40
60
80
100
1991 1992 1993 1994 1995 1996 1997 1998 1999
North-SouthSouth-South
North-South/total FDISouth-South/total FDI

P R I V A T E C A P I T A L F L O W S T O E M E R G I N G M A R K E T S
payments statistics. However, reported outflowsfrom developing countries, which reached only$12 billion by 1998, are much smaller than the es-timate given above, due to under-reporting of out-flows by source countries.
Emerging market financial crises in 2001
The past year has seen a continuation of the se-vere economic crises of the 1990s that afflicted
major middle-income emerging markets (Mexico in1994–95, East Asia in 1997–98, the Russian Feder-ation in 1998, and Brazil in 1998–99). The causesof each crisis differed in important respects, but inall of them shortcomings in external financial man-agement and defects in corporate and financial sec-tor governance played an important role. The pastyear’s problems in Argentina and Turkey sharedmany features with these earlier crises.
A critical difference, however, is that conta-gion effects to other emerging markets, and otherdebt markets, have been limited (box 2.4). This isespecially noteworthy since Argentina’s crisis de-veloped into a full-blown sovereign default. Theonly recent instance of such an extreme outcomeby a major debtor was the Russian Federation inAugust 1998; that situation produced severe dislo-cation across global financial markets.
The crisis in Argentina has its roots in thebuildup of vulnerabilities after the highly success-ful exchange rate-based stabilization of the early1990s. After a long history of inflation (includinga period of hyperinflation) and failed efforts tostabilize, the adoption of a dollar-based currencyboard in 1991 stopped the country’s inflation in itstracks.10 The country experienced a post-stabiliza-tion boom on the order of 7 percent growth inGDP, while the reduction in interest rates towardworld levels stimulated domestic demand.
However, substantial vulnerabilities remained,and were increasingly exposed during the secondhalf of the 1990s. Despite strong export growth,foreign exchange revenues were insufficient to fi-nance buoyant import demands, rendering thecountry dependent on capital inflows. Fiscal policywas not only too loose on average, but was alsounhelpfully procyclical—too expansionary in therecovery phase of 1996–97, leaving the authoritieswith no scope but to tighten policy into the down-
turn after 1998.11 As a result, public sector debt re-mained high (at 50 percent of GDP in mid-2001),and maturities shortened.
The steady appreciation of the dollar in thesecond half of the 1990s and the sharp Braziliandevaluation led to a 15 percent real exchange rateappreciation between January 1997 and mid-2001,further constraining growth. Most importantly ofall, deflation persisted throughout the economy(consumer prices have fallen by a cumulative 3 per-cent over the past three years), and the real economyremained stuck in recession, leading to a further risein an already intolerably high unemployment rate.With nominal incomes across the economy fallingsharply during 2001, there was little realistic chancefor the authorities to meet the tax revenue projec-tions that were the backbone to a planned “zerodeficit” budget strategy. Market awareness of thesizeable dollar liabilities of both the public and pri-vate sectors completed a picture that made creditorsleery of maintaining, let alone adding to, exposuresas the end of the year approached.
Public disturbances—in part a reaction to lim-its imposed on cash withdrawals from the banks—led to the resignation of the Argentine president inDecember 2001. Soon after, the government for-mally defaulted on its debts and the currency wasdevalued. A floating exchange rate system was in-troduced in mid-February. It remains to be seenwho will bear the considerable losses from the de-valuation, but given all these dislocations, a phaseof renewed output declines and rising unemploy-ment seems inevitable. The only issue now is howlong this situation will persist.
Turkey also faced a severe crisis in 2001,which was marked by efforts to control a largepublic sector deficit (12 percent of gross nationalproduct [GNP] in 2000), high levels of public sec-tor debt (in the range of 90 percent of GNP byend-2001), and difficulties in rolling over short-term debt (100 percent of reserves). Adoption of acrawling peg in 1999 was aimed at reducing highlevels of inflation. Fixing the exchange rate en-couraged large capital inflows with a substantialbuildup of foreign exchange liabilities of the bank-ing system. In February 2001, the government wascompelled to abandon the crawling peg, which ledto a 26 percent real devaluation (year-on-year) by the end of 2001 and large losses in the bank-ing sector that the government is now cleaning up. There are a number of reasons, however, why
43

G L O B A L D E V E L O P M E N T F I N A N C E
Turkey’s difficulties have been less severe thanArgentina’s:
• Despite the crisis, Turkey is making significantprogress in improving the fiscal accounts: theprimary balance of the consolidated publicsector shifted from a deficit equivalent to 2percent of GNP in 1999 to (an estimated) sur-plus of 5.7 percent of GNP in 2001.
• The exchange rate regime was less rigid andthus provided for an easier (albeit still verymessy) exit mechanism.
• Turkey’s debt is higher than Argentina’s (rela-tive to output), but a greater share is owed todomestic residents, which helped facilitate ef-forts at restructuring.
• A larger and more diversified export sectormeans that exchange rate depreciation can havea greater and more rapid impact on production.
• Turkey’s strong ties to Europe and its impor-tance as a front-line state following the Sep-tember 11 attacks have helped to facilitatesubstantial financial support. However, the at-tacks also severely damaged Turkey’s foreign
44
There is little evidence that investors have retreatedfrom most other emerging markets because of the cri-
sis in Argentina. The correlation between secondary mar-kets bond spreads between Argentina and 15 emergingmarkets rose from 0.27 in the months before the exacer-bation of Argentina’s difficulties in October 2000 to 0.47from October 2000 to August 2001.12 However, thisperiod coincided with the global growth slowdown thatwas associated with a general rise in spreads and in thevolatility of spreads (and measured correlations tend torise with increases in volatility), so it is difficult to isolatethe impact of the two crises. Brazil does appear to havebeen affected by the crisis in its neighbor to the south,perhaps because they compete in the same markets.13
The correlation between Brazilian and Argentine spreadsincreased from 0.6 in mid-2000 to between 0.8 and 0.9 in each of the three-month periods from October 2000 toAugust 2001. However, late in the year market sentimenttoward Brazil improved, and spreads narrowed despite theincreasing problems in Argentina.
Looking at specific crisis episodes (October 2000,March/April 2001, July 2001, and December 2001), wecan see some rise in the spreads on other emerging marketbonds. However, the rise in spreads during the crisis peri-ods varied, and spreads tended to return to former levelsrelatively quickly. The index of emerging market spreadswas at almost the same level in December 2001 as inOctober 2000. Overall, spreads in emerging markets ex-cluding the two crisis countries appear to have been littleaffected by the crisis in Argentina, and were stable untilthe September 11 terrorist attacks.14
There are various reasons why the Argentine crisishas generated such limited contagion effects so far, inmarked contrast to the East Asian crisis and the Russian
devaluation. Unlike these earlier crises, which were consid-erable surprises, investors have been aware of the problemsin Argentina for some time. Thus most investors may al-ready have taken whatever steps they felt necessary in ab-sorbing the losses on Argentine bonds. Moreover, manyinvestors are less leveraged this time around than duringthe Asian crisis (particularly after the debacle that highlyleveraged speculators suffered with the Russian devalua-tion), which means that there is a reduced need to liquidateacross-the-board to meet margin calls. At the same time,developing countries are less vulnerable than they were afew years ago. Currently, very few major emerging marketshave pegged exchange rates, which proved to be particu-larly vulnerable to contagion from the collapse of otherpegged exchange rates. Levels of reserves have risen whileshort-term debt levels have fallen, improving a key indi-cator of vulnerability. Several of the Asian countries arepresently running current account surpluses, and so are less dependent on international capital markets. Finally,low international interest rates eased external financingpressures on heavily indebted emerging markets.
Box 2.4 Financial market contagion from theArgentine crisis
Change in spreads during crisis periods, 2000–01(basis points)
October April July December 2000 2001 2001 2001
Argentina 317 363 874 3,806Developing countries
(excluding Argentinaand Turkey) 64 –1 68 –46
Note: Each crisis period is defined as the previous low point of spreads tothe peak. The weights used for developing countries excluding Argentinaand Turkey in December 2001 differ slightly from the previous periods.

exchange receipts, due to the drop in revenuesfrom tourism and slower export growth. Anew IMF standby arrangement to help Turkeyabsorb this additional external shock and sus-tain its reform program is expected to be inplace in February 2002.
Lessons of the turmoil in ArgentinaThe situation in Argentina is difficult, and the roleof clear-sighted economic policy is critical. Thechallenge for the Argentine authorities now is toadopt appropriate measures to allow the economyto take advantage of the newfound flexibility of afloating exchange rate, while also addressing somethe key structural problems that have been ex-posed and worsened by recent developments. It is worth noting that—in the cases of Mexico inearly 1995, Thailand and Korea in the winter of1997–98, the Russian Federation in the fall of1998, and Brazil in early 1999—the early stages inthe move to a free float were very difficult and ittook time for signs of successful stabilization to bevisible. The Argentine crisis is especially complex,since it combines large private sector foreign ex-change exposure and public sector default.
It is not too early to draw important lessonsfrom the developments in Argentina. Most ofthese lessons reinforce those that became evidentduring the East Asian and Russian crises of1997–98. Five stand out:
• Fixed exchange rate regimes are vulnerable toasymmetric shocks. The success of fixed ex-change rate regimes requires that the countriesinvolved are affected similarly by shocks.Events of the past few years, including the de-cline in commodity prices and the Brazilian de-valuation, required a devaluation in Argentinato restore external balance. But at the sametime the dollar was appreciating, respondingto a very different set of economic factors. Theresulting appreciation of the peso depressedoutput, particularly given rigidity in labormarkets which impeded real wage adjustment.The resulting recession in turn underminedsupport for the program.
• There are severe costs associated with hangingon to a pegged, overvalued exchange rate. InMexico (December 1994) and Thailand (thirdquarter of 1997), failed defenses of currencypegs led to country credit crises. The Argen-
tine authorities structured their economicsystem around the inviolability of the one-for-one exchange rate peg against the dollar.However, this structure encouraged investorsto incur mounting dollar liabilities, in the be-lief that the government would maintain thepeg. The size of dollar-denominated debt thengreatly increased the economic costs when thepeso was devalued.
• The success of multilateral rescue packages de-pends critically on strong adjustment by recip-ient countries. Crises can be successfully re-solved only when policy implementation isstrong; government commitment to taking dif-ficult adjustment measures is critical. Multilat-eral financing is designed to support, not sub-stitute for, adjustment. The size of potentialoutflows dwarfs the resources available to themultilaterals. Moreover, greatly increasing thesize of rescue packages could encourage exces-sive risk taking by private investors, althoughso far the evidence that rescue packages havegenerally contributed to risk taking is incon-clusive (box 2.5).
• There is more work to be done on private sec-tor involvement in crisis prevention and resolu-tion. Recent experience has underscored theimportance of clearer definition of the limitson official resources and of the rules and re-sponsibilities of the official sector, debtor coun-tries, and their private creditors. Contingentcredit lines can provide for new money in caseof crisis. But the government’s counter-partiescan avoid increasing their exposure during acrisis by selling other holdings of governmentbonds, thus undermining confidence. In thecase of Argentina voluntary debt exchangeswere relatively easy to organize, but they didlittle to ease the country’s financing difficulties.These challenges point to the need to considermore ambitious proposals for facilitating or-derly workouts of problematic private sectordebts, and the recent proposal by the IMF toprovide for a standstill of debt payments inorder to allow time for an orderly restructuringwill, no doubt, be debated in the year ahead.
• Contagion can be contained through prudentexternal financial management. Most coun-tries in Latin America and Asia that are depen-dent on private capital flows have strength-ened their ability to withstand shocks through
P R I V A T E C A P I T A L F L O W S T O E M E R G I N G M A R K E T S
45

G L O B A L D E V E L O P M E N T F I N A N C E
4646
Considerable concern has been raised that the expecta-tion of multilateral support for crisis-hit countries
may encourage excessive risk taking by investors in emerg-ing market debt (Meltzer 2000; Calomiris 2000).15 It isdifficult to evaluate what might have happened in the ab-sence of rescue packages, and so far the evidence that res-cue packages have encouraged excessive risk taking is in-conclusive. Zhang (1999) finds that spreads on emergingmarket bonds in the seven quarters following recoveryfrom the Mexican crisis were no lower than precrisislevels, after controlling for other determinants of spreads.Lane and Phillips (2000) find no evidence that IMF-relatednews and announcements of rescue packages had an im-mediate impact on spreads. By contrast, Eichengreen andMody (1998) find that, by 1996, spreads on emergingmarket bonds had fallen to levels that failed to adequatelycompensate for the risk of lending, and spreads fell furtherin 1997.
Concern that some investors have escaped the lossesassociated with financial crises has boosted concern overmoral hazard. It is difficult to estimate creditor losses fromrecent emerging market crises, although losses are less than they would have been in the absence of official sup-port. International equity investors may have lost $166 bil-lion during the Asian crisis (International Council of Securi-ties Agencies 1999) and international banks $60 billion (UNCTAD 2001). Losses during the Asian and Russiancrises may have totaled $350 billion (Institute of Interna-tional Finance, various years). Nevertheless, the provision ofmultilateral funds undoubtedly facilitated the repayment ofinternational banks during the Mexican and Asian crises.Authorities had to balance the erosion of market disciplinewith the consequences of a complete collapse, which couldhave had severe effects on many emerging markets.
While the evidence of moral hazard–induced excessivelending is inconclusive, given the uncertainties involved it isprudent to explore means of reducing the potential impactof multilateral support on moral hazard. Of the 15 largestemerging market borrowers in 1997 (which together ac-count for 80 percent of capital market flows to developingcountries), 8 had been the subject of rescue packages by2001. Some of them received several individual loans.Some proposals have focused on limiting the flexibility ofmultilateral institutions by allowing rescue packages onlyfor solvent borrowers who prequalify for loans (Meltzer2000). Other proposals have emphasized prior actions that force private creditors to recognize losses or provideresources during a crisis. For example, eligibility for multi-national assistance during a future crisis could be condi-tioned on the government’s obtaining prior commitment bythe private sector to roll over maturing claims or to providenew money. Still other proposals have focused on ex ante
provisions that would facilitate the private sector absorbinglosses. A modification to collective action clauses could per-mit the restructuring of bond instruments by majority voteof the creditors rather than unanimity. This would reducethe ability of small creditors to force repayment of theirdebts as the price of agreement to restructure and greatlyease the complexity involved in restructuring bonds. Theimplications of such modifications to collective actionclauses are difficult to determine. Eichengreen and Mody(2000) found that collective action clauses with this provi-sion tend to reduce the borrowing costs of more credit-worthy borrowers and raise them for less creditworthyones, which would strengthen market discipline. However,Becker and others (2001) found no evidence that such col-lective action clauses increase yields for either higher- orlower-rated issuers.
Another, complementary, approach is to provide for of-ficially sanctioned standstills that would impose a cooling-off period to avoid investor panic (Eichengreen and Mody2001); still another approach under some conditions is touse IMF facilities to continue lending to countries when bor-rowers are in arrears (Goldstein 1998; Fischer and Citrin2000). The Bank of Canada and Bank of England (2001)have recommended adoption of an officially sanctionedstandstill to provide a “time-out” during which governmentscan demonstrate their commitment to reform, and hence en-courage investors to return. Kaufman and Litan (1998)16
propose that multilateral support be contingent on changesin borrowing country laws that implement automatic write-downs on foreign currency denominated interbank loans.
All of these proposals face difficulties. Prequalificationrequirements could precipitate crises for countries that fail.Banks’ prior commitments to rollover loans during a crisiscan come at the cost of a sell-off of other assets, becausebanks attempt to limit their total exposure to the crisiscountry. It is difficult to define before the crisis what partic-ular institutional arrangements would be most desirable to“bail in” private investors. This may depend, in part, onwhether a liquidity or solvency crisis is involved. Standstillsand write-down requirements could have a chilling effecton the provision of finance to emerging markets (althoughmajority-based collective action clauses could support mar-ket discipline). Nevertheless, there is a growing recognitionthat greater attention to private sector participation in re-solving crises is warranted. For example, the recent IMFloan to Argentina provided that the disbursement of somecommitted resources could be brought forward to support a voluntary and market-based operation to increase the via-bility of Argentina’s debt profile. A review of internationalarrangements for crisis support that provided for greaterprivate sector recognition of losses could help limit thepotential for moral hazard in future lending.
Box 2.5 Moral hazard and rescue packages
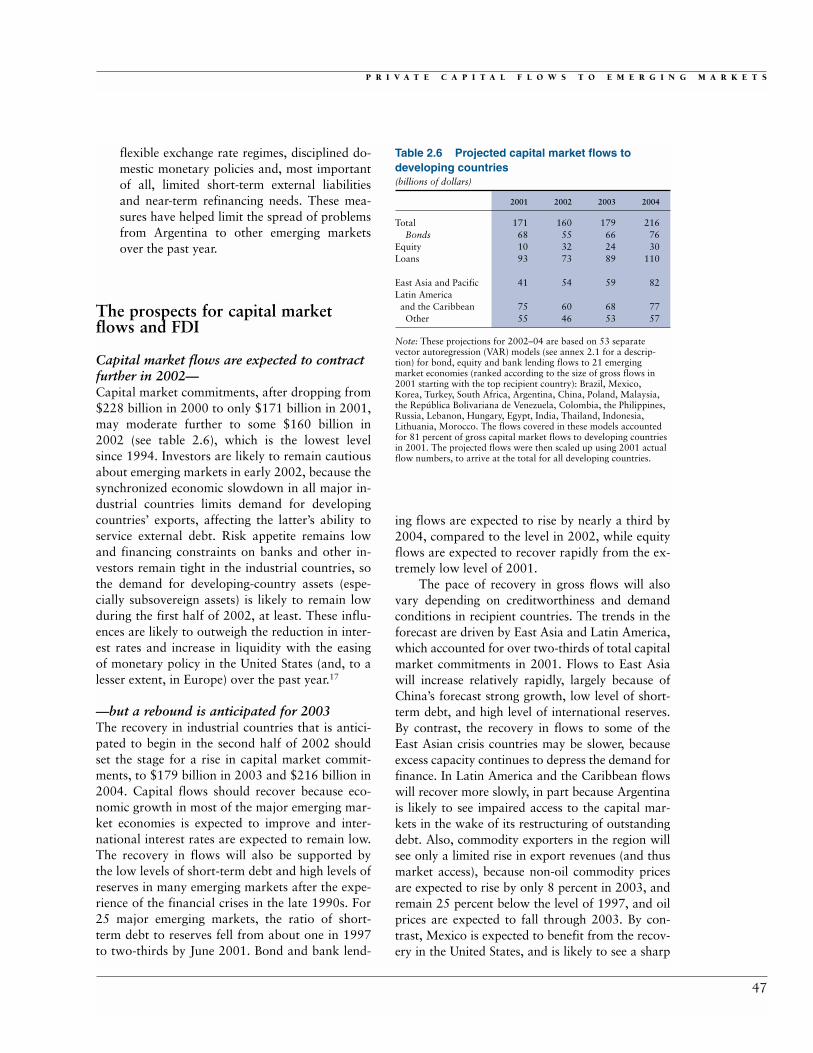
P R I V A T E C A P I T A L F L O W S T O E M E R G I N G M A R K E T S
47
flexible exchange rate regimes, disciplined do-mestic monetary policies and, most importantof all, limited short-term external liabilitiesand near-term refinancing needs. These mea-sures have helped limit the spread of problemsfrom Argentina to other emerging marketsover the past year.
The prospects for capital marketflows and FDI
Capital market flows are expected to contractfurther in 2002—Capital market commitments, after dropping from$228 billion in 2000 to only $171 billion in 2001,may moderate further to some $160 billion in2002 (see table 2.6), which is the lowest level since 1994. Investors are likely to remain cautiousabout emerging markets in early 2002, because thesynchronized economic slowdown in all major in-dustrial countries limits demand for developingcountries’ exports, affecting the latter’s ability toservice external debt. Risk appetite remains lowand financing constraints on banks and other in-vestors remain tight in the industrial countries, sothe demand for developing-country assets (espe-cially subsovereign assets) is likely to remain lowduring the first half of 2002, at least. These influ-ences are likely to outweigh the reduction in inter-est rates and increase in liquidity with the easingof monetary policy in the United States (and, to alesser extent, in Europe) over the past year.17
—but a rebound is anticipated for 2003The recovery in industrial countries that is antici-pated to begin in the second half of 2002 shouldset the stage for a rise in capital market commit-ments, to $179 billion in 2003 and $216 billion in2004. Capital flows should recover because eco-nomic growth in most of the major emerging mar-ket economies is expected to improve and inter-national interest rates are expected to remain low.The recovery in flows will also be supported bythe low levels of short-term debt and high levels ofreserves in many emerging markets after the expe-rience of the financial crises in the late 1990s. For25 major emerging markets, the ratio of short-term debt to reserves fell from about one in 1997to two-thirds by June 2001. Bond and bank lend-
ing flows are expected to rise by nearly a third by2004, compared to the level in 2002, while equityflows are expected to recover rapidly from the ex-tremely low level of 2001.
The pace of recovery in gross flows will alsovary depending on creditworthiness and demandconditions in recipient countries. The trends in theforecast are driven by East Asia and Latin America,which accounted for over two-thirds of total capitalmarket commitments in 2001. Flows to East Asiawill increase relatively rapidly, largely because ofChina’s forecast strong growth, low level of short-term debt, and high level of international reserves.By contrast, the recovery in flows to some of theEast Asian crisis countries may be slower, becauseexcess capacity continues to depress the demand forfinance. In Latin America and the Caribbean flowswill recover more slowly, in part because Argentinais likely to see impaired access to the capital mar-kets in the wake of its restructuring of outstandingdebt. Also, commodity exporters in the region willsee only a limited rise in export revenues (and thusmarket access), because non-oil commodity pricesare expected to rise by only 8 percent in 2003, andremain 25 percent below the level of 1997, and oilprices are expected to fall through 2003. By con-trast, Mexico is expected to benefit from the recov-ery in the United States, and is likely to see a sharp
Table 2.6 Projected capital market flows to developing countries (billions of dollars)
2001 2002 2003 2004
Total 171 160 179 216Bonds 68 55 66 76
Equity 10 32 24 30Loans 93 73 89 110
East Asia and Pacific 41 54 59 82Latin Americaand the Caribbean 75 60 68 77
Other 55 46 53 57
Note: These projections for 2002–04 are based on 53 separatevector autoregression (VAR) models (see annex 2.1 for a descrip-tion) for bond, equity and bank lending flows to 21 emergingmarket economies (ranked according to the size of gross flows in2001 starting with the top recipient country): Brazil, Mexico,Korea, Turkey, South Africa, Argentina, China, Poland, Malaysia,the República Bolivariana de Venezuela, Colombia, the Philippines,Russia, Lebanon, Hungary, Egypt, India, Thailand, Indonesia,Lithuania, Morocco. The flows covered in these models accountedfor 81 percent of gross capital market flows to developing countriesin 2001. The projected flows were then scaled up using 2001 actualflow numbers, to arrive at the total for all developing countries.

G L O B A L D E V E L O P M E N T F I N A N C E
48
rise in flows due to improved economic conditions.Flows to the other regions will also rise, and theygenerally maintain their share of total capital flowsduring the forecast period.
Any rebound depends on developments in Argentina The crisis in Argentina is a major risk to this fore-cast. Before the events of the past year Argentina ac-counted for 16 percent of emerging markets’ bondsoutstanding on the international capital markets.Proposals to restructure Argentina’s bonds couldreduce investors’ willingness to take on emergingmarket assets, particularly if negotiations are lengthyand marked by confrontation.18 However, there areseveral reasons why the contagion effects of the cri-sis could be limited. Over the past year the Argen-tine crisis has had only a limited and fleeting impacton the demand for the debt of other emerging mar-kets (see box 2.4). The crisis in Argentina has beenlong anticipated, which has tended to mute the im-pact on investors in comparison with the crises inEast Asia and the Russian Federation, which weremajor surprises. Secondary market prices on Argen-tine bonds have already fallen substantially, and re-flect relatively low recovery rates. Many currentbondholders are likely to have bought the bonds atlow prices, or to already have adjusted their portfo-lios to account for losses, so they may not react sig-nificantly to a debt restructuring. In fact, a speedysettlement with creditors that involves a debt re-structuring sufficient to enable Argentina to makeregular repayments could improve market senti-ment and increase secondary market prices of Ar-gentine debt. The forecasts assume that any debtrenegotiation will be settled quickly; although Ar-gentina (and Turkey) receive little in the way of newcommitments over the forecast period, these criseshave a relatively limited impact on investors’ will-ingness to lend to other emerging markets.
FDI is expected to rise steadilyFDI flows to developing countries are expected tobe much less sensitive to cyclical developments thancapital market flows.19 In 2002 FDI to developingcountries is forecast at $160 billion, a slight declinefrom the estimated $168 billion in 2001, consistentwith slow growth in global output and little in-crease in world trade. The same resiliency of FDIflows was seen in 2001, when the recession in in-dustrial countries, near stagnation in world trade,
and a decline in global FDI flows were accom-panied by rough stability of FDI flows to develop-ing countries. This resiliency of FDI to developingcountries in the face of adverse global economicconditions reflects the importance of domestic de-terminants of FDI flows (see section above on FDItrends in 2001). In addition, some of the major re-cipients of FDI flows, in particular China, are ex-pected to continue to achieve robust growth despitethe global slowdown.
While FDI flows are expected to remain re-silient, the projected 4 percent per year increasefrom 2001–04 (2 percent in real terms) is less thanhalf the rate experienced over the 1990s. We antic-ipate that the same forces that drove FDI in the1990s—globalization in production due to techno-logical innovations in communications and trans-port, coupled with better policies in developingcountries—will continue over the next few years.However, the stock of FDI in developing countriesis much larger now than 10 years ago, and exports,an important driver of FDI, are expected to growat a much lower pace over the next few years (lessthan 3 percent more rapidly than GDP, comparedwith 6 percent during the 1990s). Moreover, M&Aactivity by multinationals, an important source ofFDI flows, is declining after its peak in 2000. Al-though recent surveys indicate that multinationals’investment plans were relatively unaffected by theSeptember 11th terrorist attacks, the full impact ofthe economic slowdown on multinationals’ invest-ments remains uncertain.20 Thus it is unlikely thatFDI flows would rise as rapidly over the next fewyears as they did over the last decade. Neverthe-less, by 2004 FDI flows would remain the largestsource of finance for developing countries.
The bulk of FDI inflows are forecast to con-tinue to go to countries with relatively large mar-ket size and reasonably good policies. Brazil,China, and Mexico attract more than half of flowsto the sample countries. The growth rate of FDI ishigh to countries with good policies and rapid ex-pansion of trade. FDI in East Asian economies isexpected to rise by over 10 percent per year, due to robust increases in flows to China, where thenew commitments are already rising significantly,as well as to Korea and Thailand, where strongrecovery in GDP and exports is expected. The an-ticipated economic growth is likely to boost FDIflows in South Asia, largely driven by India. Onthe other hand, Latin America’s share of FDI to

P R I V A T E C A P I T A L F L O W S T O E M E R G I N G M A R K E T S
49
developing countries will decline, because privati-zation transactions (which made up a substantialshare of FDI to Latin America in the 1990s—seeWorld Bank, GDF, 2001: appendix 4) is likely toplay a less significant role in attracting FDI.
Annex 2.1: Forecasts of Private Flowsto Developing Countries
Capital market flowsThe econometric framework used for generatingthe forecasts for capital market flows to developingcountries follows Taylor and Sarno 1997, whichextended the framework developed by Fernandez-Arias and Montiel 1996. In this framework equi-librium, or “desired” level, of capital flows to a de-veloping country is affected by both global factorsand country-specific factors. Changes in currentcapital flows are then determined partly by the dif-ference between desired and actual capital flows inthe previous period and partly by the changes inthe factors determining the desired level of capitalflows.
Global factors include growth in the industrialcountries (proxied by the U.S. GDP), global liquid-ity (indicated by the U.S. interest rates), risk aver-sion on the part of international investors (proxiedby U.S. high-yield spread and Emerging MarketBond Index [EMBI] spread), and the prices of oil and non-oil commodities. Developing country–specific variables include domestic economicgrowth (proxied by the index of industrial produc-tion), domestic consumer price index, domesticcredit, domestic interest rates, the level of inter-national reserves relative to short-term debt, and(separately) relative to imports, and the stock priceindex.21 The global variables are assumed to evolveexogenously, without being influenced by develop-ing-country variables. The latter variables, how-ever, are jointly determined along with capitalflows, since they affect and are in turn affected bycapital flows. The econometric framework usesthe vector autoregression (VAR) technique that de-termines country-specific variables endogenouslyon the basis of their lagged values, taking the globalvariables as exogenous.
The model is estimated separately for bonds,equity, and loans for each of the 21 major develop-ing countries, using monthly data for the period
from January 1990 to December 2001.22 The flowforecasts are then summed up, and a scaling factor(equal to actual flows to all developing countriesdivided by the model-generated flows in 2001) isused to compute flows for all developing countriesas a group.
The 21 countries included in this round ac-counted for 81 percent of gross capital marketflows in 2001 (85 percent of bond flows, 96 per-cent of equity flows, and 75 percent of bank lend-ing). The coverage of these countries in varioustypes of flows as well as in different regions issummarized in table 2A.1. Also in 2001, the coun-tries covered in these forecasting exercise ac-counted for 99 percent of all flows to East Asia, 81percent of flows to Latin America, 73 percent forEurope and Central Asia, 83 percent for SouthAsia, 57 percent for Sub-Saharan Africa, and 58percent for the Middle East and North Africa.
Forecasts generated by these VAR models indi-cate that industrial-country growth had a positiveimpact on the supply of capital flows to developingcountries. Increases in interest rates reduced capitalflows, while increases in U.S. high-yield spreadswere positively associated with increases in EMBIspreads, which in turn had a negative effect oncapital flows. In simulations with the model forlast year’s Global Development Finance (WorldBank 2001) changes in industrial-country growthhad a significantly larger impact on capital flowsthan changes in interest rates. Indeed, changes inU.S. interest rates and the U.S. high-yield spreadcaused only a slight deviation in capital flows fromtheir original trends, and flows soon began to re-vert to their original values (Mody and others2001). The effects of oil and non-oil commodityprices varied depending on whether a country was
Table 2A.1 How representative is the forecastingmodel?
Flows to 15 countries aspercent of 2001 actual flows
Bond total 85Equity total 96Loan total 75East Asia and Pacific 99Latin America and the Caribbean 81Europe and Central Asia 73South Asia 83Sub-Saharan Africa 57Middle East and North Africa 58
Total 81

G L O B A L D E V E L O P M E N T F I N A N C E
50
a net exporter or importer of oil and non-oil com-modities in a given year.
Domestic economic factors also played a criti-cal role in determining capital flows to developingcountries. However, these domestic factors are alsotreated as endogenous in the model, so that theyboth affect, and are affected by, capital flows. Adecline in capital flows was generally associatedwith decreases in the level of domestic credit, do-mestic industrial production, and stock prices. In-creases in reserves were associated with higher cap-ital inflows, while increases in short-term debtreduced flows. A moderate increase in the pricelevel was positively associated with capital inflows,whereas a strong upsurge in prices tended to dis-courage capital flows (Mody and others 2001).
Table 2A.2 compares the flows estimated usingthe methodology outlined above with their histori-cal trend. Evidently, the model performs fairly well.
FDIThe forecast of FDI included in the text is based onan econometric model of the determinants of FDI,expressed as a share of developing countries’ GDP.Large and growing markets can accommodatemore suppliers and help them achieve scale andscope economies (UNCTAD 1998), and the size ofthe recipient country’s internal market as measuredby GDP is one of the most frequently applied vari-ables in the past research on determinants of FDI.23
The determinants of FDI include:
1. The average growth rate of GDP over threeyears prior to the current period is a proxy forinvestors’ view of future economic perfor-
mance. GDP growth has been found to be as-sociated with larger FDI inflows in severalstudies (Root and Ahmed 1979; Nigh 1985).
2. The ratio of exports to GDP represents export-orientation, which should increase a country’sattractiveness to multinationals by providinggreater access to export markets (Caves, Por-ter, and Spence 1980; Saunders 1982). A thirdof world trade is accounted for by intrafirmtransactions by multinationals, who also pro-vide the bulk of FDI flows.
3. The GDP growth rate of the top seven indus-trial countries is used to account for a changein the relative attractiveness of emerging mar-kets to international investors. Thus higherindustrial-country growth is associated withlower FDI inflows to developing countries.
4. A better investment climate, in terms of soundmacroeconomic policies, open regimes towardFDI, and nondiscriminatory frameworks forbusiness facilitation, is likely to induce FDI in-flows to the recipient economy (see chapter 3;UNCTAD 1998).
The model is estimated for the panel data from1981–2000, which covers 30 developing countriesthat account for more than 80 percent of FDIflows to developing countries.24 GDP growth indeveloping countries, GDP growth in industrialcountries, and exports are lagged under the as-sumption that FDI is determined largely on thebasis of long-term commitments by multinationals(World Bank 1999). Note that this approach toestimating FDI flows does not take into accountcyclical effects, as was done with the forecasts ofcapital market flows. Such effects are probably ofless importance to FDI, which typically is based onthe prospects for growth over a longer time hori-zon than for capital market flows.
The constant variable {�̂ i} (i=1,..,30) and coef-ficients {�̂k} (k=1,..,5) are estimated from the equa-tion below, and applied to the set of expected val-ues for the independent variables to forecast FDIflows for 2001–04.25
FDIi = �̂i + �̂1 (GGDPi) + �̂2 (EXi) + �̂3 (G7i)+ �̂4 (IC) + �̂5 (T)
FDI, GGDP, EX, IC, G7, and T represent, respec-tively, FDI as ratio to GDP, average growth rate of
Table 2A.2 Comparison of forecasts with actualcapital market flows to developing countries(billions of dollars)
Year Forecast Actual
1990 42 381991 63 681992 76 801993 127 1141994 140 1331995 169 1721996 253 2331997 320 3151998 206 1881999 187 1792000 240 238

51
P R I V A T E C A P I T A L F L O W S T O E M E R G I N G M A R K E T S
GDP over three years, export volume as ratio toGDP, investment climate index, annual growthrate of GDP of the G-7 countries, and time trend.
Annex 2.2: Measuring resource flowsto developing countries
International organizations that collect and re-port data on international financial transactions
use different approaches to measuring the move-ment of financial resources to and from developingcountries. The IMF’s World Economic Outlook re-ports flows in a balance of payments framework.An alternative approach is to aggregate from morespecialized systems that independently compile sta-tistics for different types of flows: the World Banktakes a recipient country or debtor perspective andoperates the Debtor Reporting System. The OECDtakes a donor or creditor country perspective: itsdata are derived from information on aid activitiesreported to the Development Assistance Commit-tee and on export credits reported through theCreditor Reporting System. The Bank for Interna-tional Settlements also takes a creditor perspectiveand compiles information on a quarterly and on asemi-annual basis on the claims of its reportingbanks on developing countries.
In Global Development Finance (GDF) theWorld Bank uses a broad concept of net aggregateresource flows: equal to net disbursements on long-term loans, direct investment, portfolio equityflows, and official and private grants. These dataare presented in the text and summary tables of
volume I of GDF. The World Bank also presents anarrow measure of net flows on debt for individualcountries in volume II of GDF.
The data on net aggregate resource flows pre-sented in GDF reflect liability transactions only(gross disbursements minus repayments). Capitaloutflows (such as net lending by developing-countryresidents abroad), short-term flows, and net use ofIMF credit are not included. This results in a sub-stantial difference between net long-term flows asshown in GDF and net external finance as shownin the balance of payments.
These data are available only on an annualbasis. However, data on certain components (forexample loan commitments and bond issues) areavailable at higher frequency. The analysis of capi-tal flows in this chapter depends heavily on thishigher-frequency data. The quality of the most re-cent year estimates varies depending on the lendingcategory. Reasonably accurate information is avail-able from market sources on gross disbursementsfrom bond markets and commercial banks. Debtrepayments are calculated from information onterms, although actual payments may vary. Data onportfolio equity flows are particularly difficult toestimate: while data on international equity issuesare readily available, estimates of direct foreignpurchases in developing-country stock markets arebased on reports from exchanges that differ in ac-curacy and coverage.
Notes1. Moody’s Investors Service classifies Barbados,
Botswana, Chile, China, Croatia, the Czech Republic, ElSalvador, Estonia, Hungary, the Republic of Korea, Lithua-nia, Malaysia, Mexico, Mauritius, Oman, Poland, SaudiArabia, the Slovak Republic, Thailand, Trinidad and To-bago, Tunisia, Uruguay, and South Africa as investment-grade countries.
2. In part, this reflects dollar appreciation. In SpecialDrawing Rights (SDRs), developing countries’ export rev-enues increased by 2.6 percent.
3. This calculation reflects the fall in European andU.S. interest rates, the share of floating rate debt, and theshare of euro- and dollar-denominated debt. It is a lowerbound of the impact of lower interest rates, since countriescould switch to dollar-denominated debt to take advantageof the larger decline in U.S. interest rates.
4. The largest rise in speculative-grade spreads re-flected, in part, the problems of telecommunications andother technology firms. However, the increase was wide-
Table 2A.3 Statistics for the forecast of FDI
Independent variable
GDP growth rate 0.047a
Exports 0.043a
G-7b GDP –0.046c
Investment climate 1.093a
Time 0.079a
Adjusted R2 0.50
a. Denotes significance at the 1 percent level.b. Group of Seven: Canada, France, Germany, Italy, Japan, theUnited Kingdom, and the United States.c. Denotes significance at the 5 percent level.Source: World Bank, Global Development Finance: Country Tablesand sources cited therein, various years; World Bank, World Devel-opment Indicators, various years; and World Bank staff estimates.

G L O B A L D E V E L O P M E N T F I N A N C E
52
spread (only 5 out of 15 high-yield sectors saw a decline inspreads in 2001).
5. The global volume of credit to investment-gradeborrowers rose by 4 percent in 2001, while credit to specu-lative-grade borrowers fell by 23 percent.
6. The most recently issued Treasury securities tend tobe more frequently traded, and hence more liquid, than se-curities that were issued earlier. Since both recently issuedand off-the-run Treasury securities have the same risk-freereturn, the spread between the two is used by some ob-servers as an indicator of liquidity preference. However, thisspread may also reflect technical market factors (Duffie1996).
7. The top 10 developing country FDI recipients (inorder of the size of flows) are China, Brazil, Mexico, Ar-gentina, Poland, Chile, Malaysia, Korea, Thailand, and theRepública Bolivariana de Venezuela.
8. A number of planned sales of domestic firms havebeen delayed or called off, including a long-standing acqui-sition plan of Daewoo Motors by General Motors and thecancellation of a plan by Deutsche Bank’s subsidiary to pur-chase Seoul Bank.
9. About $25 billion of this amount represents flowsthrough Hong Kong (China) that may have originated inChina.
10. In the face of capital mobility, fixing the exchangerate limits the ability of the central bank to print money. Theexchange rate–induced stabilization of import prices also en-hances credibility by showing evidence that inflation is com-ing down. Agreement to forgo further wage and price in-creases requires a metric against which mark-ups andcontracts can be gauged; a pegged exchange rate provides justsuch a measure. In contrast, other approaches to stabiliza-tion—keying on reductions in the rate of money growth or onthe central bank’s inflation target—are harder to verify andtherefore less credibility-enhancing. Fischer (2001a) observesthat few if any countries have successfully brought down highinflations without first stabilizing the exchange rate.
11. Fiscal policy was tightened by 1.7 percent of GDPin 1999, 1 percent in 2000, and 1.3 percent in 2001, accord-ing to J. P. Morgan estimates (Werling 2001).
12. Similarly, the correlation of spreads on Turkishbonds with other emerging markets rose from 0.12 beforethe crisis to 0.39 afterwards.
13. Twenty-six percent of Argentine exports go toBrazil and 11 percent of Brazilian exports are to Argentina.Moreover, each country’s top 10 markets (which for Ar-gentina and Brazil cover 57 percent and 64 percent of ex-ports, respectively) are also the top 10 for the other country,with the exception of Mexico (for Argentina) and Uruguay(for Brazil).
14. The evidence of contagion effects is even weaker ifwe look at stock market prices. There is almost no evidencefrom stock market prices that the Argentine or Turkishcrises affected other emerging markets, again with the ex-ception of the impact on Brazil.
15. There is also concern that rescue packages may en-courage borrowers to pursue unsustainable policies in antic-ipation of being bailed out. This is unlikely, considering theeconomic costs to countries hit by the crises and the loss ofpower of politicians who governed in the run-up to crises.
16. Cited in Helfer 1998.
17. This forecast for capital market flows is based onan econometric model that takes into account global macro-economic developments (such as industrial-country growthand interest rates) that are largely exogenous to individualdeveloping countries, as well as domestic macroeconomicdevelopments in individual countries (see annex 2.1).
18. The debt workout process may be difficult. Somerecent events have made it more attractive for holdout in-vestors (that is, those who do not agree to a bond restruc-turing). See the case of the Elliott Associates vs. Peru as dis-cussed in World Bank 2001.
19. This forecast is based on an econometric model(estimated from panel data for a sample of 30 countries thataccount for 80 percent of FDI flows to developing coun-tries), where the major determinants of FDI are the level ofGDP, the past growth rate of GDP, growth in industrialcountries, the share of exports in GDP, and the policy envi-ronment (see annex).
20. A. T. Kearney 2001; UNCTAD 2002.21. See World Bank 2001, chapter 2, for more on the
explanation of the choice of variables.22. We did not estimate a VAR model for an individual
type of commitment (bank lending, bond issues, or portfolioequity flow) if it constituted less than 5 percent of totalflows received by the country.
23. Literature includes Root and Ahmed 1979; Schnei-der and Frey 1985; Papanastassiou and Pearce 1990; andWheeler and Mody 1992. See also UNCTAD 1998 for de-tailed discussions.
24. Some adjustments were made to FDI data for selectcountries where a small number of large-scale privatizationtransactions distorted the trend, or the major privatizationprograms have reached completion, or both.
25. The set of constant variables represents fixed ef-fects across countries.
ReferencesThe word processed describes informally reproduced worksthat may not be commonly available through libraries.
Adams, A. H. 1993. “Hong Kong’s Charms.” The ChinaBusiness Review (November–December).
A. T Kearney. 2001. “FDI Confidence Index—Flash Sur-vey.” Presented at OECD Global Forum on Interna-tional Investment—New Horizons and Policy Chal-lenges for Foreign Direct Investment in the 21stCentury, November 26–27, Mexico City.
Bank of Canada and Bank of England. 2001. “Resolution ofInternational Financial Crises.” February. Processed.
Becker, Torbjorn, Anthony Richards, and YungyongThaicharoen. 2001. “Bond Restructuring and MoralHazard: Are Collective Action Clauses Costly?” IMFWorking Paper 01/92. International Monetary Fund,Washington, D.C.
Bosworth and Collins. 1999. “Capital Flows to DevelopingEconomies: Implications for Saving and Investment.”IMF Seminar Series. No. 1999-21, pp. 1–44.
Calomiris, Charles. 2000. “When Will Economics GuideIMF and World Bank Reforms?” Cato Journal 20Spring/Summer.

P R I V A T E C A P I T A L F L O W S T O E M E R G I N G M A R K E T S
53
Caves, R. E., M. E. Porter, and A. M. Spence. 1980. “Com-petition in the Open Economy.” Harvard UniversityPress, Cambridge.
Clark, E. 1998. “Risk Aversion, Wealth and InternationalCapital Flows.” Review of International Economics(U.K.) 6: 507–15.
Dollar, David, Giuseppe Iarossi, and Taye Mengistae. 2001.“Investment Climate and Economic Performance:Some Firm Level Evidence from India.” Prepared forEconomists Forum, May. World Bank, Washington,D.C.
Duffie, Darrell. 1996. “Special Repo Rates.” Journal of Fi-nance. June.
Eichengreen, Barry, and Ashoka Mody. 1998. “What Ex-plains Changing Spreads on Emerging Market Debt:Fundamentals or Market Sentiment?” NBER WorkingPaper W6408, Cambridge, Mass. February.
———. 2000. “Would Collective Action Clauses Raise Bor-rowing Costs?” World Bank Policy Research WorkingPaper 2363. May. Washington, D.C.
Fernandez-Arias, Eduardo, and Peter J. Montiel. 1996.“The Surge in Capital Inflows to Developing Coun-tries: An Analytical Overview.” World Bank EconomicReview 10: 51–77.
Fischer, Stanley. 2001a. “Exchange Rate Regimes: Is the Bipo-lar View Correct?” Finance and Development June.
Fischer, Stanley, and D. Citrin. 2000. “Strengthening the In-ternational Financial System: Key Issues.” World De-velopment: 1133–42.
Goldstein, Morris. 1998. The Asian Financial Crisis:Causes, Cures, and Systemic Implications. Institute forInternational Economics: Washington, D.C.
Guay, W. 1999. “The Sensitivity of CEO Wealth to EquityRisk: An Analysis of the Magnitude and Determi-nants.” Journal of Financial Economics (Netherlands)53 (1): 43–71.
Gunter, Frank R. 1996. “Capital Flight from The People’sRepublic of China: 1984–94.” China Economic Re-view 7 (1): 77–96.
Harrold, P., and R. Lall. 1993. “China, Reform and Devel-opment in 1992–93.” World Bank Discussion Papers215, Washington, D.C.
Hausmann, Ricardo, and Eduarto Fernandez-Arias. 2000.“What’s Wrong with International Financial Mar-kets?” Inter-American Development Bank, ResearchDepartment Working Paper 429, Washington, D.C.
Helfer, R. 1998. “Rethinking IMF Rescues.” Brookings In-stitution Conference Report #1. http://www.brookings.org/pa/conferencereport/cr1/cr1.htm.
IMF (International Monetary Fund). Various years. WorldEconomic Outlook. Washington, D.C.
International Council of Securities Agencies. 1999. “PrivateBurden Sharing: A Voluntary Approach.” http://www.sia.com/international/html/burden.html.
Institute of International Finance. Various years. “CapitalFlows to Emerging Market Economies.”
Kumar, Manmohan S., and Avinash Persaud. 2001. “PureContagion and Investors’ Shifting Risk Appetite: Ana-lytical Issues and Empirical Evidence.” IMF WorkingPaper 01/134, Washington, D.C.
Lane, T., and S. Phillips. 2000. “Does IMF Financing Resultin Moral Hazard?” IMF Working Paper 00/168.
Lardy, N. 1995. “The Role of Foreign Trade and Investmentin China’s Economic Transformation.” China Quar-terly (U.K.) 144: 1065–82.
Meltzer, A. 2000. “Report of the International Financial In-stitutions Advisory Commission.” U.S. Congress,Washington, D. C.
Mody, Ashoka, Mark P. Taylor, and Jung Yeon Kim. 2001.“Modeling Economic Fundamentals for ForecastingCapital Flows to Emerging Markets.” World Bank,Washington, D.C. Processed.
Nigh, D. 1985. “The Effect of Political Events on U.S. Di-rect Foreign Investment: A Pooled Time-Series Cross-Sectional Analysis.” Journal of International BusinessStudies 16: 1–17.
Papanastassiou, M., and R. D. Pearce. 1990. “Host Coun-try Characteristics and the Sourcing Behaviour of U.K.Manufacturing Industry.” Discussion Papers in Inter-national Investment and Business Studies, Series B,Vol. 2 (140), Department of Economics, University ofReading. United Kingdom.
Root, F. R., and A. A. Ahmed. 1979. “Empirical Determi-nants of Manufacturing Direct Foreign Investment inDeveloping Countries.” Economic Development andCultural Change 27: 751–67.
Saunders, R. S. 1982. “The Determinants of Inter-IndustryVariation of Foreign Ownership in Canadian Manu-facturing.” Canadian Journal of Economics 15: 77–84.
Schneider, F., and B. S. Frey. 1985. “Economic and PoliticalDeterminants of Foreign Direct Investment.” WorldDevelopment 13 (2): 161–75.
Sicular, T. 1998 “Capital Flight and Foreign Investment:Two Tales from China and Russia.” World Economy(U.K.) 21: 589–602.
Taylor, Mark P., and Lucio Sarno. 1997. “Capital Flows toDeveloping Countries: Long- and Short-Term Determi-nants.” World Bank Economic Review 11.
UNCTAD (United Nations Conference on Trade and Devel-opment). 1998. World Investment Report: Trends andDeterminants. Geneva.
———. 2001. World Investment Report 2001: PromotingLinkages. Geneva.
———. 2002. “FDI Downturn in 2001 Touches Almost AllRegions.” Press Release TAD/INF/PR36, January 21,Geneva.
Werling, Vladimir. 2001. “Argentine Confidence Crisis: Fac-ing a Policy Dilemma.” Economic Research, MorganGuaranty Trust Company. August 10.
Wheeler, David, and Ashoka Mody. 1992. “International In-vestment Location Decisions: The Case of U.S. Firms.”Journal of International Economics 33: 57–76.
World Bank. 1999. Global Development Finance. Washing-ton, D.C.: World Bank.
———. 2000a. Global Economic Prospects. Washington,D.C.: World Bank.
———. 2000b. Global Development Finance. Washington,D.C.: World Bank.
———. 2001. Global Development Finance. Washington,D.C.: World Bank.
Zhang, Xiaoming Alan. 1999. “Testing of Moral Hazard inEmerging Market Lending.” Institute of International Fi-nance Research Papers, 99–1. August. Washington, D.C.


3The Poor Countries’ InternationalFinancial Transactions
Poor countries have benefited fromthe growth of global capital flows
The globalization of production and financialservices has provided the opportunity for poor
countries to increase their reliance on private sectorinternational financial transactions.1 Poor countrieslack access to capital markets and official flowshave fallen, while total aid has declined along withthe share of the poor countries. However, foreign di-rect investment (FDI) flows have risen substantially:while the poor countries remain dependent on offi-cial external finance, they now receive the sameamount of FDI as other developing countries, in re-lation to the size of their economies (table 3.1). FDIflows to the poor countries have become more di-versified: the share of the mineral- and oil-exportingcountries in total FDI to the poor countries fell fromalmost half in 1991 to 20 percent in 1997. Poorcountries have participated in the global expansionof commercial banks: foreign banks’ assets now ac-count for 40 percent of total bank assets in the poorcountries, twice as high as in 1995. Despite capitalcontrols, poor countries’ residents have placed sig-nificant amounts of capital abroad: the stock ofcapital outflows from the poor countries were largerrelative to cumulated domestic savings and thestock of reserves, and only slightly smaller relativeto gross domestic product (GDP), than outflowsfrom other developing countries.
As in middle-income countries, the quality ofthe investment climate determines the extent ofpoor countries’ access to capital and the extent towhich foreign capital benefits the domestic econ-omy. Countries with sound investment climatestend to attract more FDI, limit capital outflows,and enjoy greater productivity of both foreign anddomestic capital than countries with weak invest-
55
.
ment climates. Those countries that established thestable macroeconomic policies and effective regula-tory regimes necessary to attract foreign bank par-ticipation increased the access of domestic banks to trained personnel and technological advances,while rising competition from foreign banks helpedreduce the costs of financial intermediation. Poorcountries’ greater openness to capital flows meansthat they have to cope with the macroeconomiceffects of capital mobility. Sustainable macroeco-nomic policies marked by low inflation and debtlevels are essential to limit capital outflows, andsharp changes in outflows (or capital repatriation)can complicate efforts at stabilization.
Financial integration in the poor countries
Financial integration has increased since the 1980sThe poor countries’ private international financialtransactions increased substantially during the1990s. Official flows have fallen with the declinein total aid and the fall in the poor countries’ shareof aid (see chapter 4), while capital market flows(bank lending, bond issues, and portfolio equity)have remained relatively small. By contrast, FDIhas risen seven-fold, and now represents over 40percent of all long-term resource flows (table 3.2).2
Nevertheless, the poor countries’ reliance on pri-vate flows remains somewhat below that of otherdeveloping countries, where private flows averagedabout 4 percent of GDP in the late 1990s.
One indicator of the extent of integrationwith the rest of the world is the correlation be-

G L O B A L D E V E L O P M E N T F I N A N C E
tween investment and savings.3 Countries that aretightly integrated into global financial marketsshould exhibit a low correlation between domesticsavings and gross investment. For example, if anatural disaster reduces domestic savings but does not affect the return on new investment, firms inwell-integrated economies can rely on interna-tional capital markets to maintain investment lev-els. At the extremes, in an autarkic economy sav-ings and investment are identical (the correlationis one), while in a perfectly integrated economy thecorrelation would in theory be zero.4 In the poorcountries, the correlation between savings and in-vestment declined sharply in 1995–99, after a steeprise from the late 1980s to the mid-1990s (figure3.1). The variability in the series over time makesit difficult to say whether the recent decline will besustained over the medium term. Again, the cor-relation in the poor countries remains above thatof other developing countries, although the differ-ence has narrowed since the mid-1980s.5
The preference for FDI reflects high risks—While FDI to the poor countries has surged sincethe mid-1980s, net capital market flows to the poorcountries has remained near zero. In other develop-ing countries these resources represent an average
of 1.4 percent of GDP. Albuquerque (2001) hasnoted that countries with worse international creditratings tend to have greater difficulties in attract-ing capital market flows than in attracting FDI.This dependence on FDI rather than capital mar-ket flows reflects a range of higher risks associatedwith investing in poor countries, notably less stablemacroeconomic conditions, weaker institutions,and a less favorable environment for private sec-tor activity. Moreover, the economies of most poorcountries are relatively undiversified. For example,primary commodities account for 70 percent of ex-ports from Sub-Saharan Africa. The poor countriesare thus more prone to exogenous shocks, such aschanges in the terms of trade and, in the case ofagricultural products, adverse weather conditions.Higher risk leads to a bias toward equity finance, inpart because FDI typically includes managementexpertise and branding, which help to compensatefor greater risk. Perhaps more important, banksface difficulties in raising interest rates sufficientlyto compensate for risk, owing to adverse selection.Different entrepreneurs have different (and unob-servable) probability of repaying loans. The morerisky entrepreneurs are willing to pay a higher in-terest rate, so banks limit risk by rationing creditthrough quantity limits, rather than throughchanges in interest rates.
—including asymmetric informationInternational investors often have little informa-tion on poor-country borrowers. Most poor coun-tries often have relatively small markets, littlecoverage in the international media, and signifi-cant geographic and cultural distance from high-income countries. Thus external investors are par-ticularly subject to asymmetric information withrespect to opportunities in poor countries: that is,the owners of firms tend to have much more infor-mation on the firms’ profitability than lenders or
56
Table 3.1 Net external financial flows to developing countries, 1999(percent of GDP)
Capitalmarket Capital
FDI flowsa ODAb outflows
Poor countries 2.8 –0.6 5.6 1.6Other developing
countries 2.8 0.7 0.4 3.2
a. Includes bonds, portfolio equity, and bank lending.b. Official development assistance.Source: World Bank Debtor Reporting System (DRS) and staffestimates.
Table 3.2 Net long-term capital flows to poor countries, 1986–99
Billions of dollars Percent of GDP
1986–88 1991–93 1997–99 1986–88 1991–93 1997–99
Total 15.7 20.9 22.2 6.1 7.8 6.6Official flows 13.9 17.4 13.0 5.4 6.5 3.9Private flows 1.8 3.5 9.2 0.7 1.3 2.8
Capital markets 0.7 0.5 –0.3 0.3 0.2 –0.1Foreign direct investment 1.1 2.9 9.5 0.4 1.1 2.7
Source: World Bank DRS.

T H E P O O R C O U N T R I E S ’ I N T E R N A T I O N A L F I N A N C I A L T R A N S A C T I O N S
outside investors, particularly foreign ones. Highrisk in the presence of asymmetric informationleads to quantity constraints on loans (Stiglitz andWeiss 1981), and debt contracting may not be fea-sible or desirable (Trester 1998). Lending to poorcountries is thus severely constrained, and much ofthe bank lending that occurs must be guaranteed(see chapter 4). By contrast, when foreign firmstake an ownership stake through FDI they canexert more control over local managers, and thusobtain better access to information (compared withbanks) about a project’s current and potentialprofitability (Razin, Sadka, and Yuen 1997).
The preference for FDI also reflectsinstitutional weakness in debt and capital marketsThe institutional and legal structures required toreliably enforce contracts in the debt and capitalmarkets are often lacking in poor countries. Pro-tection of minority shareholders is often limited,disclosure standards are inadequate, and the ad-ministrative processes necessary to buy and sellshares impose high costs and delays, so issuance onthe capital markets is discouraged. Stock marketstend to be very small in the poor countries. For ex-ample, of the 19 African stock markets, almosthalf have market capitalization of less than $1 bil-lion, compared to the $220 billion capitalization of the Johannesburg exchange (Oxford Analytica
2001). On the debt side, the laws and infrastruc-ture necessary to collect on collateral in the case ofloan defaults are often inadequate, so that banksare often unwilling to lend.6 While increased secu-ritization of loans is a potential approach to im-proving access to debt flows, the cost and com-plexity of arranging such deals, and the risksinvolved in reducing the flexibility of foreign ex-change management and taking on large debts atmarket rates, limit the use of securitization by thepoor countries (box 3.1).
Trade credit is often an attractive financing optionAnother means of increasing credit to risky coun-tries in the presence of asymmetric information isto borrow from suppliers rather than banks. Tradecredit, a financial agreement under which an ex-porter (or supplier) extends credit to finance thepurchase by an importing firm, offers a good alter-native for firms that lack access to banks. Suppli-ers are often better placed than banks to lend tofirms in developing countries because suppliershave considerable information on the firm and itsmarkets, and thus are less affected by asymmetricinformation. Suppliers can impose greater sanc-tions in the case of default by cutting off access tosupplies and repossessing goods against whichcredit has been granted. Suppliers have an advan-tage over financial intermediaries in selling repos-
57
Correlation coefficient
Figure 3.1 Five-year rolling correlation between savings and investment, 1974–1999
Source: World Bank data.
0.0
1974 1976 1978 1980 1982 1984 1986 1988 1990 1992 1994 1996 1998
0.1
0.2
0.3
0.4
0.5
0.6
0.7
0.8Other developing Poor

G L O B A L D E V E L O P M E N T F I N A N C E
58
Securitization—the conversion into tradable securities—offuture hard-currency receivables is a potential means of
improving the access of poor countries to international capi-tal markets. At the same time, securitization in the poorcountries must be handled cautiously, due to the limits im-posed on government’s access to foreign exchange and therisks of incurring debt at market rates.
In a typical future-flow transaction, the borrowerpledges the future revenues from sales of a product (forexample, oil) as collateral. By a legal arrangement betweenthe borrower and major international customers, paymentsfor the future product are directly deposited in an offshorecollection account managed by a trustee. The debt is servicedfrom this account, and excess collections are forwarded to theborrowing entity in the developing country. This transactionstructure reduces the ability of the government to interferewith debt servicing, while the market risk arising from priceand volume volatility is mitigated by setting the amount ofcollateral higher than the debt service liability. So far, therehave been no debt defaults on rated future-flow asset-backedsecurities issued by developing-country borrowers, even dur-ing crises. For example, in the telecommunications transac-tion mentioned below, Pakistan continued to service this debteven in the face of selective default on its sovereign debt.
Future-flow securitization in developing countries. Sincethe first important future-flow securitized transaction in adeveloping country (by Mexico’s Telmex in 1987), 150future-flow securitizations (that were rated by major ratingagencies) have raised more than $36 billion. The issuance offuture-flow receivable-backed securities increased especiallyafter the Mexican crisis in 1994–95 (see figure). About 45percent of rated future-flow transactions in U.S. dollar terms(and one-sixth in terms of number of deals) are backed by oiland gas export receivables. Hard-currency future receivablessuch as credit card and telephone receivables, and workers’remittances, and even export receivables to be generated inthe future by new investment projects have also been securi-tized. In Argentina, some provinces have securitized portionsof their future tax receivables from the federal government.
Future-flow securitization. Future-flow securitization hasbeen used rarely in the poor countries. One example is the1997 transaction in which Pakistan TelecommunicationsCompany Limited, a state-owned company, raised $250 mil-lion in bonds backed by future telephone settlement receiv-ables from international telephone companies. This issue wasrated investment grade, four notches higher than the sovereignrating. Given their revenues from commodities, tourism, andremittances, poor countries could potentially raise as much as$11 billion by securitizing exports (using a conservative 5:1overcollateralization ratio on 1998 receivables),7 in additionto the potential for securitization of telephone receivables.
Securitized lending may be useful at the margin to in-crease access to finance and to gain entry to capital markets.There may also be positive externalities associated with secu-ritization: the close scrutiny of the legal and institutional en-
vironment involved in these transactions may identify priori-ties for reform. Public policy to facilitate future-flow-backedsecuritizations could focus on clarifying bankruptcy laws, re-ducing transaction costs by facilitating the pooling of receiv-ables generated by several issuers, and educating policymak-ers and potential issuers about the benefits and risks involved. A number of factors, however, constrain the growth of future-flow transactions in the poor countries, including the highpreparation costs and long lead times involved, and the lackof legal clarity on bankruptcy procedures in many countries.
Securitized lending also presents some risks to poor-country governments. Securitized arrangements that commita substantial share of a country’s foreign exchange resourcesmay also reduce the attractiveness of nonsecuritized debt. Acountry’s securitizations may violate negative pledge commit-ments to multilateral lenders. Escrow accounts reduce the au-thorities’ flexibility in mobilizing and managing foreign ex-change. For example, escrow account arrangements made bya public sector company may make it impossible for a gov-ernment to draw on the company’s foreign exchange receiptsto support imports during a temporary decline in the terms oftrade, thus imposing a costly and perhaps unnecessary adjust-ment. Committing a large share of the public sector’s foreignexchange receipts to securitized arrangements can signifi-cantly increase the economic contraction required due to awithdrawal of flight capital. There is also a danger of prolif-eration: governments that agree frequently to the use of sucharrangements may see creditors insist on them in most cases.This concern may be more muted in the case of a privatecompany, although even here governments with foreign ex-change surrender requirements may see their access to foreignexchange decline. The major issue is that poor-country gov-ernments, and in particular heavily indebted governments,must remain cautious about contracting debt at market rates.Securitized arrangements may facilitate access to capital mar-kets, but they do not necessarily make it prudent for poorcountries to borrow on hard terms.
Box 3.1 Improving market access throughfuture-flow securitization
Source: Fitch, Moody’s, Standard & Poor’s.
10
8
6
4
2
019991998199719961995199419931992
2.0
0.5 0.4
1.5
0.7
3.7
6.1
4.7
7.8
9.2
19911987–90
Billions of dollars
Future-flow securitization, 1987–99

T H E P O O R C O U N T R I E S ’ I N T E R N A T I O N A L F I N A N C I A L T R A N S A C T I O N S
sessed goods, since usually the supplier already hasa network for selling its goods, especially if theyhave not been transformed by the buyer. By con-trast, a bank’s threat to cut off future finance mayhave little influence on the buyer’s immediate op-erations (Petersen and Rajan 1994). Moreover, theprospect of a close and continuing trade relation-ship with the supplier reduces the likelihood that asolvent buyer would default, as the cost of obtain-ing goods from a single firm can be lower thanpurchasing them through separate transactions(Mian and Smith 1994).
FDI to the poor countries
Poor countries benefit from a global surge inFDI flows—The surge in FDI reflects both the increase inglobal FDI flows and improvements in the invest-ment climate in the poor countries. Global FDIflows increased by 24 percent per year during1991–2000 as reduced trade barriers and tech-nological innovations encouraged the growth ofglobally integrated supply networks (World Bank2001a). Developing countries as a group saw FDIflows rise 20 percent at constant prices, and therise in FDI as a share of GDP during the 1990s wasvirtually identical in the poor and other developingcountries (figure 3.2), although the share of thepoor countries in total FDI to developing countriesdeclined during the 1990s. FDI flows to the poorcountries increased to almost 3 percent of GDPand 15 percent of domestic investment, about thesame ratios as in other developing countries.
—and improvements in their investmentclimates The rise in FDI flows to the poor countries overthe 1990s in part reflects significant progress inimproving the investment climate, a term whichrefers to the numerous ways in which governmentpolicies affect the productivity of investment byfostering openness to trade and FDI, macroeco-nomic stability, fair and efficient public sectoradministration, low corruption and effective lawenforcement, strong financial institutions, the pro-vision of effective infrastructure, sound regulation,and measures to ensure the health and educationof the work force. Several empirical studies have
confirmed the importance of the investment cli-mate in determining the level and efficiency of do-mestic investment (box 3.2).
The poor countries have made significantprogress in improving the investment climate. Themedian inflation rate in the poor countries fell tounder 5 percent by the late 1990s, compared withalmost 8 percent early in the decade. The poorcountries’ average fiscal deficit fell from 7 percentof GDP in the early 1990s to 4 percent in the late1990s. Almost half of a sample of 44 poor coun-tries (the choice of countries was based on dataavailability) reduced their fiscal deficit by morethan 2 percent of GDP, and only 12 saw a deterio-ration in the fiscal deficit. Some countries achievedbroader reforms to encourage private sector activ-ity. Restrictions on foreign entry and ownershipwere either eased or removed, and export process-ing zones (EPZs) and various tax and duty reduc-tions were introduced. Twenty-two out of a sampleof 24 poor countries either introduced EPZs orprovided other forms of tax- or duty-exemptionfor imports, or reduced taxes on imports over the1990s. Several countries eased rules on foreign cur-rency transactions, at least as far as the current ac-count is concerned (see below). The poor countriesalso have made some progress in health and educa-tion indicators that reflect improvements in humancapital, a critical component of a strong invest-ment climate. For example, the adult illiteracy ratedeclined from 45 percent in 1990 to 37 percent in
59
Percent
Figure 3.2 FDI-to-GDP ratios, 1991–2000
Source: World Bank, Global Development Finance: Country Tables and sourcescited therein, various years.
1991
3.5
3.0
2.5
2.0
1.5
1.0
0.5
0.0
Poor Nonpoor
1992 1993 1994 1995 1996 1997 1998 1999 2000

G L O B A L D E V E L O P M E N T F I N A N C E
60
The economic literature provides considerable empiri-cal evidence regarding the impact of the investment
climate on the level and productivity of private invest-ment. The elements of the investment climate covered inempirical studies include macroeconomic policy, the legalframework, political instability, infrastructure, and healthand education services. Both the policy framework anduncertainty concerning its administration are important.
Poor macroeconomic policies have a negative impacton the level of investment. Pfeffermann and Kisunko(1999) list inflation among the major deterrents to invest-ment worldwide. Ndikumana (2000) shows that inflationhas had a negative effect on investment in Sub-SaharanAfrica, while Oshikoya (1994) gets the same results for a sample of low-income countries. Other authors havefound that uncertainty about macroeconomic policiesreduces investment (Alesina and Tabellini 1989). Severalauthors have shown that real exchange rate volatility, aproxy for uncertainty, is negatively related to private in-vestment (Aizenman and Marion 1995; Servén 1996 and1998; Servén and Solimano 1993; Brunetti and Weder1998; Hausmann and Gavin 1996).
An appropriate legal framework and its fair enforce-ment have an important impact on investment. Uncer-tainty in property rights enforcement (Knack and Keefer1995) and corruption (Mauro 1995) have significant neg-ative effects on investment.8 Brunetti and Weder (1998), ina cross-sectional study of 60 countries, find that the lackof rule of law and a high level of corruption are especiallydetrimental to investment. Analyses based on surveys (Pf-effermann and Kisunko 1999) and panel data (Bubnova2000) emphasize corruption, crime, and unpredictablepublic administration as deterrents to investment. Individ-ual country studies also provide evidence of the impact ofthe policy environment on investment in Africa. For exam-ple, Devarajan, Easterly, and Pack (2001) find that inap-propriate public policies severely reduced the productivityof the Tanzanian manufacturing sector.
Empirical studies also have found that politicalinstability has a significant negative effect on investment(see studies of large cross-country data sets by Barro[1991] and Alesina and Perotti [1996]). A survey of for-eign-owned firms in 24 African countries found politicaland policy stability to be the most important factors af-fecting their investment decisions (Sievers 2001). Gyimah-
Brempong and Traynor (1999) also provide evidence onthe negative effect of political instability on investment for a cross-section of 39 Sub-Saharan African countriesduring 1975–88. Studies on individual countries in Africahave provided similar evidence (Thomas 1994 for Tanza-nia, and Jenkins 1998 for Zimbabwe). In a study of 18Latin American countries over the period 1970 to 1981,Gyimah-Brempong and Muñoz de Camacho (1998) showthat political instability reduces investment in both humanand physical capital. Using a sample of 40 countries,Bubnova (2000) points out that political disorder aggra-vates risk and therefore reduces private infrastructureinvestment.
The lack of adequate infrastructure and human capitalhas been found to reduce private investment. Pfeffermannand Kisunko (1999) report that inadequate infrastructureconstitutes one of the major obstacles to doing business.Reinikka and Sevensson (1999) identify the role of unreli-able and inadequate power supply in reducing investmentin Uganda, despite considerable progress in establishingmacroeconomic stability and structural reform. Oshikoya(1994) finds a positive relationship between the infrastruc-ture component of public sector investment and privateinvestment in low-income countries. A study on Pakistanshows the complementary effect of public infrastructureinvestment on private sector investment (Sakr 1993). Like-wise, a study of the Caribbean region (Clements and Levy1994) shows that public education investment have signifi-cant effects on private investment.
Analyses of subnational impediments to investmenthave also emphasized the importance of the investmentclimate. In a study of Indian states Dollar, Iarossi, andMengistae (2001) find that after controlling for establish-ment size and industry type, the variation in factor produc-tivity across the states can in part be attributed to the vari-ation in regulatory burden. The study also shows that theaverage annual fixed capital formation is four times higherin states with better investment climates (based on businessmanagers’ rankings) than in others. A survey of percep-tions of business environment in five regions of Russiaidentified inflation, lack of access to financing, poorlyfunctioning judiciary systems, and administrative barriersto investment (that is, high tax rates, tax regulations, andcorruption in the public sector) as the most serious obsta-cles to investment (Coolidge, Kisunko, and Rahman 2001).
Box 3.2 The investment climate and domestic investment

61
T H E P O O R C O U N T R I E S ’ I N T E R N A T I O N A L F I N A N C I A L T R A N S A C T I O N S
1999, and the infant mortality rate dropped from85 per 1,000 live births in 1990 to 73 in 1999.
Nevertheless, the investment climate in mostpoor countries remains less attractive than in manymiddle-income countries. The average fiscal deficitis one percentage point of GDP higher in the poorcountries than in the other developing countries.Health sector indicators are worse, despite the pro-gress outlined above. For example, life expectancyat birth remains 13 years below the level in otherdeveloping counties, and the adult illiteracy rate ismore than twice as high. Growth in the poor coun-tries has been slower: per capita GDP rose by only0.3 percent per year in the 1990s, compared with1.9 percent in other developing countries.9
Improved investment climate isassociated with rapid growth of FDI
Poor countries that made progress in improvingthe investment climate during the 1990s at-
tracted large FDI increases. In the countries wherepolicy and institutional performance improvedmost, FDI as a ratio to GDP increased by 25 per-cent per year, while in the countries whose policiesimproved least, the FDI-to-GDP ratio increased byless than 6 percent annually (table 3.3). The coun-tries that showed relatively good policy and insti-tutional performance in 1995 received more FDIas a ratio to GDP during 1996–99 (table 3.4).
The relationship between improvements in theinvestment climate and increases in FDI flows canalso be seen in the experience of individual poorcountries. Uganda, Tanzania, and Mozambique
achieved the greatest improvement in the invest-ment climate for a sample of 23 African countriesduring 1992–97 (World Economic Forum 1998),and the ratio of FDI to GDP rose by 81 percent inUganda, 35 percent in Tanzania, and 33 percent inMozambique.10 Armenia pushed ahead with open-ing sectors to foreign investors and promoting pri-vatization, which led to an 80 percent upsurge inFDI as ratio to GDP over the past decade. Priva-tization transactions accounted for a significantshare of FDI inflows in some of these countries (15percent in Uganda from 1992–97, and 25 percentin Bolivia from 1995–99).
Policy measures that attract FDI—In addition to overall improvements in the invest-ment climate, policy measures that are specificallydesigned to ensure equal treatment of foreign anddomestic investors have been important in attract-ing FDI to the poor countries. New laws on for-eign investment have been formed to permit profitrepatriation since the early 1990s, while accessionsto international agreements and institutions aswell as conclusions of bilateral investment treatiesand double taxation treaties have accelerated(UNCTAD 2001a). According to a survey con-ducted by UNCTAD in 1997, 26 of the 32 leastdeveloped countries in Africa in the survey had aliberal or relatively liberal regime toward the repa-triation of capital.
—and factors that discourage itSome of the poor countries have not achieved theimprovements in the investment climate necessaryto encourage higher FDI flows. Civil strife, whichaffected 13 poor countries during the 1990s, can
Table 3.3 Annual change in policy performanceand FDI as ratio to GDP, 1991–99 (percent)
Highest Lowest group group
Improvement in policyperformance index 6.6 –3.2
Increase in FDI as ratio to GDP 25.5 5.7
Note: Highest and lowest groups of countries are based on the orderof improvement in the policy performance index during the periodof 1991–99. Policy performance is measured by the Bank’s CountryPolicy Performance Rating.Source: World Bank, Global Development Finance: Country Tablesand sources cited therein, various years; World Bank, World Devel-opment Indicators, various years; World Bank staff estimates.
Table 3.4 FDI as ratio to GDP and policy performanceindex in poor countries
FDI-to-GDP ratio Policy performance index
High 8.9 3.4Middle 4.6 3.0Low 0.5 2.5
Note: This excludes oil and mineral exporters. The policy perfor-mance index is measured in 1995. FDI as ratio to GDP is an averageduring the 1996–99 period. The sample for this figure consists of 30 countries.Source: World Bank, Global Development Finance: Country Tablesand sources cited therein, various years; World Bank, World Devel-opment Indicators, various years; and World Bank staff estimates.

G L O B A L D E V E L O P M E N T F I N A N C E
depress foreign investment (although some of thecountries affected by conflict have continued toreceive foreign investment in protected natural re-source projects). Some countries continue to im-pose restrictions on foreign entry and ownershipand foreign exchange transactions, as well as dis-criminatory tax provisions. In Kenya, where for-eign investors face multiple licensing requirementsand high withholding taxes on royalties, FDI re-mained less than 0.2 percent of GDP during1991–99 (Pigato 2001). Similarly, in Yemen, wheresizable outflows of FDI have been recorded sincethe mid-1990s, licensing requirements discouragednew investments, despite incentives such as tax hol-idays and customs exemptions. Pakistan has seen asteady decline in FDI inflows since 1996 due to in-vestor concerns over political developments.
FDI can boost investment and productivity—Recent empirical work indicates a strong link be-tween the volume of FDI and domestic investment.Bosworth and Collins (1999) and Mody and Mur-shid (2001) find that a dollar of FDI results in analmost one-dollar increase in investment. By con-trast, international portfolio flows and bank loanshave a much smaller impact on investment. In ad-dition to the impact of FDI on the volume ofinvestment, the presence of foreign firms can gen-erate important benefits for domestic firms by in-creasing their knowledge of—and access to—ad-vanced technology, by improving the overall skillsof the work force, and by increasing demand fordomestic firms’ products and the supply of in-puts.11 These “spillover” benefits of FDI are great-est in countries with sound investment climatesmarked by well-developed human capital, efficientinfrastructure services, sound governance, andstrong institutions.12
The presence of foreign firms also can be im-portant in the poor countries by improving localfirms’ access to international markets. The role offoreign firms as export catalysts has been examinedfor some 2000 Mexican manufacturing plants forthe period 1986–90. Controlling for factor costs,output prices, and other variables, Aitken, Hanson,and Harrison (1994) found that the presence offoreign affiliates significantly increases the proba-bility that domestic firms export. To the extent thatgrowth in Sub-Saharan Africa is reduced by foreigninvestors’ lack of information (Collier and Gun-ning 1999), exposure to foreign firms may help
eliminate an important constraint on the marketaccess of African firms.
—but only if the investment climate is soundNevertheless, estimates of the average impact ofFDI on growth in poor countries are mixed, incontrast to comparable estimates for developingcountries as a group, which often show a positiveimpact of FDI on growth.13 Kumar and Pradhan(2001) find that a 1 percent rise in the ratio of FDIto GDP in the poor countries is associated with anincrease in GDP growth of about 0.18 percent,compared with a rise of 0.12 percent in the case of domestic investment.14 By contrast, Blomström,Lipsey, and Zejan (1994) found the impact of FDIon growth of the lower-income countries to bepositive but not statistically significant.
These mixed results reflect weak investmentclimates in some countries. Even if FDI is stronglylinked to higher investment, increased investmentmay generate limited benefits for growth if the in-vestment climate is poor. Devarajan, Rajkumar,and Swaroop (1999) present some cross-countryevidence for Africa in which neither public norprivate investment is correlated with growth dueto low capacity utilization and a distorted policyenvironment.15 Bhagwati (1978) and Balasubra-manyam, Salisu, and Sapsford (1996) find that theeffect of FDI on growth is stronger in countriesthat pursue export-oriented trade policies than inthose adopting inward-oriented policies. Even inpoor countries with sound macroeconomic poli-cies and limited public sector interventions in com-petitive markets, low levels of education and skillsmay limit the benefits of FDI. Borensztein, De Gre-gorio, and Lee (1995) and UNCTAD (1999b) findthat the interaction between FDI and an indica-tor of human capital in cross-country regressionshas a significant impact on growth in developingcountries, but that FDI alone does not.16
The size of the technological gap between do-mestic and foreign firms may limit the benefits ofFDI to poor countries. FDI can be highly growth-enhancing when FDI and domestic investment arecloser substitutes, which is more likely in techno-logically advanced countries than in developingcountries (de Mello 1999). If local firms have in-sufficient capacity to absorb technology and skillsfrom foreign affiliates, then the poor-country firmsmight lose out in the face of competition fromforeign firms (Kokko 1994; Kokko, Tansini, and
62

T H E P O O R C O U N T R I E S ’ I N T E R N A T I O N A L F I N A N C I A L T R A N S A C T I O N S
Zejan 1996; Kathuria 1998; Fry 1992; Agosin and Mayer 2000). In addition, resource- or labor-seeking FDI—which is the most common form ofFDI in the poor countries—is likely to generatefewer backward or forward linkages for domesticenterprises compared to FDI in intermediate orcapital goods industries—the type more commonin middle-income countries (Ozawa 1992; Porter1990).
Even when the short-term impact of FDI islimited by a poor investment climate, the medium-term impact on growth may be positive. Initiallydomestic firms may see an erosion of their marketshare due to the entry of foreign firms with supe-rior technology. Subsequently, however, domesticfirms may regain market share as they absorbspillovers of technology and skills through verti-cal—backward and forward—linkages of foreignfirms with domestic enterprises (Marksun andVenables 1997). In a study of 55 poor countries forthe 1980–99 period, a 1 percent increase in FDI as ratio to GDP in the current period reduces do-mestic investment as ratio to GDP by 0.8 percent.However, a 1 percent increase in the FDI-to-GDPratio in the previous period results in 0.7 per centincrease in the domestic investment ratio of thecurrent period (Kumar and Pradhan 2001).
Effective competition policies are critical
In the absence of effective competition policies,FDI also can have a negative impact on the do-
mestic economy by establishing a local monopolyand reducing production to maintain high prices,thus generating rents for foreign investors. Thereare two types of situations where firms might beable to keep prices higher than competitive levelsover a considerable length of time. The first is incompetitive markets in small economies where thegovernment maintains barriers to entry, for exam-ple through high trade barriers or by limiting for-eign entry to particular firms. Here the obviousremedy is to reduce trade barriers and establish anopen regime for FDI. As many of the poor coun-tries have small markets that could be dominatedby a few firms, ensuring low barriers to entry is ahigh priority. Opening the economy to import com-petition tends to lower domestic market concentra-tion and reduce price differentials between the local
and international markets (Harrison 1994; Levin-sohn 1993; Tybout 2000; and Hoekman, Kee, andOlarreaga 2001). Economies with more active poli-cies toward fighting monopoly power tend to growfaster, even after controlling for the height of tradebarriers (Hayri and Dutz 1999).
Research on the impact of foreign entry onmarket concentration in competitive markets is lim-ited. Several studies have found little evidence ofanticompetitive practices, including studies in theRepublic of Korea after the opening to FDI in 1998(Yun 2000), in Mexico on the competitive effects offoreign acquisitions of domestic firms (Mexico Fed-eral Commission on Competition 1997), and in theCzech Republic on the impact of sales of domesticfirms to foreigners on market concentration inmanufacturing (Zemplinerova and Jarolim 2000).
The second area where foreign entry may actto stifle competition is in natural monopolies thatare subject to economies of scale and have limitedpotential for cross-border provision of services(such as telecommunications and power). For ex-ample, the privatization of state-owned monopo-lies, without either removing barriers to entry orestablishing an effective regulatory framework tomaintain competitive prices, can lead to a privatemonopoly. Here efforts to maintain efficient mar-kets are more difficult than in competitive marketssuch as manufacturing, as poor countries often lackthe institutional capacity required to effectively reg-ulate natural monopolies. Thus building adequaterules and institutions to regulate natural monopo-lies may be necessary before privatization. How-ever, once the decision is made to privatize, fear ofnatural monopolies is not a reason to bar foreignparticipation in bidding for privatized firms.
FDI in the mining sector has risen with policy reformThe investment climate is not the only determinantof the allocation of FDI among the poor countries.Some countries receive significant levels of FDI sim-ply because they have natural resources that are notwidely available. The rents associated with the ex-ploitation of these resources may be so high as tocompensate for weaknesses in the overall investmentclimate. In some cases, investment in natural re-source sectors can be isolated by imposing specialregulations, building dedicated infrastructure, oreven providing special security in regions affected byconflict. Nevertheless, with improvements in the in-
63

G L O B A L D E V E L O P M E N T F I N A N C E
vestment climate in non–natural-resource-exportingcountries and the increase in privatization programs,the share of oil- and mineral-exporting countries inthe poor countries’ FDI flows fell from almost 50percent in 1991 to 20 percent in 1997.
Even in mineral-exporting countries, the qual-ity of the investment climate is an important deter-minant of access to FDI. Global surveys indicatethat efficient and stable policies, liberal and trans-parent mining legislation, and accountable andnondiscriminatory tax regimes play a key role inthe international mining companies’ investmentdecision making, second only to geological condi-tions (Naito and others 1998; Clark and Naito1997; Otto 1992; Johnson 1990). According to a1997 survey of 35 countries, long-term success inattracting FDI in mining exploration depends onthe quality of the legal, fiscal, and institutionalframework, in addition to the existence of miningresources and a favorable geographic location.Eight of the 10 countries that received the high-est FDI in exploration in 1997 had better-than-average policies, as measured by an index of re-forms in the mining sector (Naito and Remy2001).17 One major obstacle facing the poor coun-tries in increasing minerals production is the poorquality of policies in many countries. Of the 13poor countries in the survey, 10 scored less than0.4 on the reform index (indicating worse-than-average policies) and only three scored more than0.7. In middle-income countries, by contrast, 8scored below 0.5 and 13 above (figure 3.3).
Nevertheless, some poor countries have under-taken significant reforms of their mining sectorsduring the 1990s in order to attract foreign invest-ment in mineral resource development (World Bank1992 and 1996; Otto 1995; Smith and Naito 1998;Naito, Remy, and Williams 2001). According to re-cent forecasts by World Bank staff, some countriesthat have launched substantial reform programs areexpected to achieve significant increases in explo-ration investment and—subsequently—increases inthe value of the minerals produced and exported(table 3.5).18 For example, Mali had historically at-tracted very little foreign investment in mining. Inthe 1990s the country undertook a reform of therules governing mining and strengthened govern-ment oversight and service institutions. As a result,new investment started to flow in, leading to twonew operating mines, and gold has become thelargest contributor to Mali’s export earnings, ac-
counting for over 40 percent of total exports in1999. Mining sector reform has typically addressedthe establishment of an appropriate legal frame-work for private sector activities, including the fiscalregime; modernization of government institutionalarrangements in the mining sector; public enterprisereform and privatization; and establishment of asound environmental management system.
The participation of foreign banks inpoor countries’ financial systems
Foreign bank presence in the poor countriesincreased in the 1990s—In addition to capital flows, poor countries aretied to the international financial system throughforeign banks. During the 1990s, the liberalizationof financial markets in combination with rapidtrade growth (which increased banks’ ties withexporters from developing countries) spurred theglobal expansion of banks. Cross-border mergersand takeovers of banks rose from 320 over thecourse of the 1980s to about 2,000 in the 1990s.The middle-income countries of Latin America andEast Asia and the transition economies experienced
64
Millions of dollars
Figure 3.3 Foreign direct investment inmining exploration and governmentpolicies
Note: Triangles represent poor countries, while circlesrepresent other developing countries.Source: Naito, Remy, and van der Veen 2001.
–50
0
50
100
150
200
250
0 0.2 0.4
Government reform index (0–1)
0.6 0.8 1

T H E P O O R C O U N T R I E S ’ I N T E R N A T I O N A L F I N A N C I A L T R A N S A C T I O N S
65
a rapid increase in the number of foreign banks.19
These recipients accounted for the biggest share ofbanks going to the developing world. However,the poor countries have also seen a substantial risein foreign bank entry, as the failure of state-directed financial systems led to the privatizationof many financial institutions and the removal ofobstacles to the establishment of new banks in manycountries. For example, in Africa cross-border mer-gers between financial institutions in the 1990ssurged to 96, up from only seven in the 1980s(Buch and Delong 2001).20 In 2000 only 15 of the58 low-income countries had no reported foreign
bank activity, down from almost half in 1995.Foreign banks represent 38 percent of the totalnumber of banks in the poor countries, up from13 percent in 1995 (figure 3.4). Foreign banks’ as-sets account for more than 40 percent of totalbank assets in the poor countries, twice as high asin 1995. It is possible, however, that the sizeablelosses incurred by foreign banks in the Argentinecrisis may discourage a continued expansion offoreign banks in developing countries, at least inthe near term.21
Some poor countries have had significant for-eign bank presence for a long time (beginning withcolonial domination of local banking systems),and colonial ties remain an important determinantof the home country of foreign banks. U.K. banksaccount for about one-third of all foreign bankcapital in English-speaking Africa, and Frenchbanks enjoy a similar presence in French-speakingAfrica. In low-income transition economies, thehome countries of the foreign banks are more di-verse, reflecting weaker cultural or colonial ties,although geographic proximity is an importantdeterminant of foreign bank presence. For exam-ple, Turkish banks are important in a number ofCentral Asian countries, Arab banks are present in the Republic of Yemen and Pakistan, and banks
Table 3.5 Mining sector performance in threecountries, before and after reforms (millions of dollars)
Exploration Production Exports
Before After Before After Before After
Ghana <1 n.a. 125 700 125 650Mali <1 30 <1 242 <1 230Tanzania <1 35 53 350 53 350
n.a. Not applicable.Sources: Naito, Remy, and van der Veen 2001 and sources citedtherein. Staff projections based on ongoing projects and priceforecasts.
Average across countries (percent)
Figure 3.4a Foreign bank presence in poorcountries
Figure 3.4b Foreign bank presence in Africa
Foreign bank assets as a percentage of total bank assets
Note: Data include only low-income countries that allow foreign bank presence and have not witnessed open conflict from 1995through 2000.Source: World Bank staff calculations based on Bankscope.
0
Franco-phoneAfrica
Luso-phoneAfrica
Anglo-phoneAfrica
Asia andPacific
Transitioneconomies
10
20
30
40
50
60
70
01995 2000
5
10
15
20
25
30
35
40
45
Foreign banks as a percentage of total
Foreign bank assetsin percentage of totalbank assets
1995 2000

G L O B A L D E V E L O P M E N T F I N A N C E
from middle-income East Asian countries have es-tablished subsidiaries in low-income East Asia.
—but regulatory barriers limit opportunitiesDespite the rise in the presence of foreign banks inmany poor countries, regulatory barriers and thelimited opportunities in poor countries’ financialsystems continue to constrain foreign bank partici-pation. Regulatory barriers are higher in poorcountries than in other developing countries. On anindex that ranges from 0 (closed) to 1 (fully open),middle- and high-income countries scored, on aver-age, 0.77—well above the average (0.54) for allcountries.22 The main determinants of differencesin commitments made to the World Trade Organi-zation concerning the liberalization of financial ser-vices were found to be income level, openness totrade, and the depth and competitiveness of the fi-nancial sector (Qian 2000; Sorsa 1997). On theseindicators, poor countries generally score worsethan middle-income countries. Many poor coun-tries also have limited scope for the provision of fi-nancial services, owing to the small scale of trading,the low level of savings, and competition from tra-ditional and informal methods of savings collection(such as rotating savings and credit associations).The high cost of doing business—despite lowwages—is an additional obstacle, reflecting poorbusiness infrastructure, and greater difficulties inevaluating loans in low-income countries. Finally,
the weak regulatory framework and the frequentpolicy reversals in the financial sector—includingnationalizations of foreign banks—increase the reg-ulatory risk perceived by investors, while the effec-tive subsidy to loss-making state banks distortscompetition and creates an additional entry barrier.
Foreign bank presence is associated withhigher efficiency of banking systems in thepoor countriesThe presence of foreign banks is associated withimprovements in the efficiency of banking systemsin the poor countries. Increased competition fromforeign banks may reduce intermediation costs byeroding excess profits that domestic banks canenjoy due to the small size of the financial systemsof many poor countries (see World Bank 2001b).In poor countries where foreign bank presence isgreater than average, financial intermediationcosts tend to be lower, as reflected in domesticbanks’ lower net margins and noninterest income.At the same time, domestic banks’ overhead costsare lower in countries with substantial foreignbank presence, perhaps indicating improved prac-tices learned from the foreign banks. On balance,domestic banks’ pretax profitability in high-foreign-entry markets is much lower than in markets withlow foreign bank presence (figure 3.5).
Differences in domestic bank performanceacross markets with varying levels of foreign bankentry are also likely to reflect other factors, apartfrom the presence of foreign banks—for example,differences in macroeconomic conditions that af-fect bank profitability. Taking into account differ-ences in country circumstances and the financialcharacteristics of individual banks, econometricresults confirm that stronger foreign bank pres-ence is associated with significantly lower domes-tic bank net interest margins, noninterest income,and overhead costs (see annex 3.1). The net im-pact of higher foreign bank presence is a decreasein domestic bank profitability, after controlling forthe influence of other factors.23 This decline is apartial influence, which may be offset in the longterm to the extent that foreign bank entry is asso-ciated with lower financial intermediation costs,which could improve credit provision to the pri-vate sector and thus foster higher growth andbank profitability (Levine 1996).
Foreign bank entry can help improve the qual-ity of domestic bank staff by training staff that
66
Percentage of domestic bank assets (average, 1995–2000)
Figure 3.5 Effect of greater foreign bank presence onintermediation costs and domestic bank profitability
Source: World Bank.
0Net
marginNoninterest
incomeOverhead Loan loss
provisionPretaxprofit
1
2
3
4
5
6
7
Low foreignbank entry
High foreignbank entry

T H E P O O R C O U N T R I E S ’ I N T E R N A T I O N A L F I N A N C I A L T R A N S A C T I O N S
then move to domestic banks. For example,Citibank is said to have trained an estimated 5,000bankers in developing countries. In Pakistan, thegovernment hired personnel from Citibank, Bankof America, Société Générale, and ABN-AMRO tohelp rehabilitate its national commercial banks,starting in 1997. French and British banks thathave long been active in Africa have also con-tributed to training of banking personnel there.Foreign banks also can facilitate the provision ofcertain financial services, such as internationalsyndications, letters of credit confirmations for ex-ports to third countries, treasury products forcommodity hedgers, depositary receipts, and inter-national mergers and acquisitions possibilities forlocal corporate customers.
Foreign banks have also contributed to thesoundness of domestic banking systems by partici-pating in the privatization of failed state banks.For example, the sale of Tanzania’s National Bankof Commerce (NBC) to ABSA, a South Africanbank, led to a sharp acceleration in the pace of re-structuring and in loan recovery efforts. WhenABSA took over NBC in March 2001 it launchedan aggressive loan recovery effort that generatedimmediate results. Whereas previously NBC hadbeen continually thwarted in its collection effortsby court injunctions and other avoidance tactics,ABSA successfully overcame many of these obsta-cles, thereby establishing its credibility and elicit-ing more constructive behavior from borrowers.24
Despite the improvements in efficiency broughtabout by greater foreign bank penetration, policy-makers in developing countries are often concernedthat access to credit may be impaired for somesectors of the economy—in particular small andmedium enterprises (SMEs)—because foreignbanks tend to serve primarily large customers com-pared with domestic banks. However, evidencefrom a survey of over 4,000 enterprises in 38 devel-oping and transition economies—including 8 poorcountries—suggests that, though large enterprisesseem to take better advantage of foreign bank pres-ence, benefits appear to also accrue to SMEs(Clarke, Cull, and Soledad Martinez Peria 2001).In countries with high foreign bank penetration,SMEs tended to rate interest rate costs and accessto long-term loans as lesser constraints than incountries with low foreign bank entry. Medium-size enterprises also appear to finance a larger shareof investment through commercial bank loans in
countries with higher foreign bank presence. Thebenefits perceived by SMEs may reflect, first, thelower interest margins spurred by foreign bankentry, which may help expand the amount of lend-ing to SMEs even if the share of lending to them de-clines. Second, foreign bank competition for largecustomers may displace some domestic banks, forc-ing them to more actively seek new market niches.This could potentially improve credit access forsmall borrowers in the medium term. On thewhole, based on a sample of 59 countries, Barth,Caprio, and Levine (2001b) concluded that limita-tions on foreign bank entry (captured by a cross-country comparable survey of national regulatoryagencies) tend to be associated with a smaller shareof bank credit to the private sector in GDP.
Greater foreign bank presence may also helpattract foreign bank lending to poor countries, al-though the evidence is limited. Increased foreignbank presence can facilitate project selection andscreening of borrowers, thus improving foreignbanks’ access to information, a critical input tolending decisions. Poor countries with high foreignbank presence attracted nearly 50 percent more in-ternational bank lending as a share of their GDPthan countries with no foreign banks (figure 3.6).
67
Percentage of debtor countries’ GDP (average acrosscountries, 1995–2000)
Figure 3.6 Effect of greater foreign bankpresence on international bank lending to poor countries
Note: Total claims of BIS reporting banks on poorcountries.a. Foreign bank assets as a percentage of total bankassets in poor countries, 1995–2000 (average). Source: World Bank, based on Bank for InternationalSettlements data.
0No foreign
bank presencea
Below 25%a
Above 25%a
2
4
6
8
10

G L O B A L D E V E L O P M E N T F I N A N C E
Of course, this relationship may be due to otherfactors. For example, countries with high foreignbank presence may also have better investment cli-mates, which would explain the higher level of for-eign loans. Countries with low foreign bank pres-ence may also restrict private borrowing fromabroad, thus limiting the amount of outstandinginternational bank claims.
Foreign bank entry does not appear to beassociated with greater risk taking bydomestic banks—While the fall in domestic bank profitability that isassociated with foreign bank entry may signal re-duced financial intermediation costs for bankclients, it may also engender instability: banks thatsee a decline in their franchise value may have an incentive to take on greater risks (Hellmann,Murdock, and Stiglitz 2000). Pressure on domesticbanks may also increase if foreign banks capturethe most lucrative segments of the market (such as loans to export-oriented manufacturing), thusleaving domestic banks more exposed to the low-end, less profitable segments. This problem couldbe particularly severe in many poor countries,where domestic banks may lack the expertise tocompete effectively with foreign banks and domes-tic banks may already be weakened by poor super-
vision, a history of high nonperforming loans, andgovernment pressure for unprofitable lending toloss-making state enterprises. On the other hand,foreign bank presence may have a positive impacton financial stability, because it helps introducebetter risk management practices, while foreignbanks are likely to be better supervised by homecountry regulators.
One approach to investigating the impact offoreign banks on stability is to examine whetherthe domestic banks’ portfolio and performancecharacteristics that have been shown to affect thechances of a financial crisis differ significantly in“low” and “high” foreign bank entry environments(Demirgüç-Kunt and Detragiache 2000; Goldstein,Kaminsky, and Reinhart 2000).25 Analysis suggeststhat poor-country banking systems with high for-eign bank presence had, on average, a smaller shareof nonperforming loans in the late 1990s (figure3.7). Provisions for nonperforming loans are alsohigher in countries with large foreign bank pres-ence. While domestic banks in low-entry countriesprovision less than 100 percent for each nonper-forming loan, banks in high-entry markets provi-sion, on average, 150 percent. To be sure, lowernonperforming loans and better provisioning maypartly reflect better prudential requirements andsupervision in countries that are more attractive toforeign banks. On balance, domestic banks in poorcountries with high foreign bank presence do notappear to have taken on particularly high risk.
—but a banking system that is morecompetitive and open to foreign entry can increase risksWhile on average foreign bank presence is not as-sociated with collateral damage to domestic banks,on occasion foreign banks have increased domesticfinancial instability by pulling out of host countriesor by contagion from problems in the home coun-try. A foreign bank affiliate may be forced to cutback on its local asset portfolio, in response to adeterioration of the parent bank’s balance sheet.The impact of a decline in lending by a foreignbank may be particularly great in poor countries,where the number of banks is limited and foreignbanks are often major players. For example, Kent-bank of Turkey, which had purchased the NationalCommercial Bank of Albania in 1999 (with 60percent market share in deposits and loans), had to be taken over by the Turkish Deposit Insurance
68
Nonperforming loans as a percentageof domestic bank assets (average, 1995–2000)
Loan loss provisions as apercentage of nonperforming loans
(average, 1995–2000)
Figure 3.7 Effect of greater foreign bank presence on nonperforming loans
Source: World Bank; Claessens and Lee 2001.
0Low foreign bank entry High foreign bank entry
1
2
3
4
5
6
7
0
20
40
60
80
100
120
140
160
180
Nonperforming loans Loan loss provisions to nonperforming loans

T H E P O O R C O U N T R I E S ’ I N T E R N A T I O N A L F I N A N C I A L T R A N S A C T I O N S
Fund. Fears over instability were calmed, however,when the Turkish Fund lent $10 million to the Al-banian bank. In Romania, rumors that the Turkishshareholder in Banco Turco (24 percent marketshare) was directing the funds of Banco Turco Ro-mano back to Turkey led to a run on the bank in2000. The run was stopped when the Turkish gov-ernment persuaded Vakifbank of Turkey, a bankpartially owned by the government, to support thebank. The sale of Uganda Commercial bank, themain state bank, to a Malaysian industrial and realestate company had to be cancelled when the par-ent bank got into difficulties.
These events point to the potential transmis-sion of instability from foreign banks, particularlythose from countries subject to substantial insta-bility and without strong regulation and supervi-sion. Diversification of the home countries of for-eign banks is particularly important to reduceexposure to financial contagion. However, to min-imize risks of contagion, the host country regula-tors also should be careful in screening entrants onthe basis of two criteria: the quality of the foreignbank’s domestic supervisory framework and theforeign bank’s reputational risk exposure (to pro-tect its reputation, a large international bankinggroup is more likely to recapitalize a subsidiarythan to let it fail).
With increased presence of foreign banks,maintaining effective cross-border supervision hasbecome important to reduce the risk of conta-gion.26 However, enforcing effective cross-bordersupervision raises difficult policy challenges forpoor countries, as it requires a regular exchange ofhigh-quality financial information between thehome and host country regulators. The host super-visors should also be ready to permit on-site in-spections by the home country supervisors. Manypoor countries lack the resources and capabilitiesto effectively align their prudential regulation withbest practice and comply with cross-border super-vision guidelines. Moreover, almost all poor coun-tries have relatively small financial systems, so thatthe fixed cost of establishing effective supervisioncan be high. Regional cooperation among poorcountries could help, by upgrading and harmoniz-ing standards of prudential regulation in financialservices, pooling resources and expertise, and inten-sifying information exchange. For example, despitethe need to further reinforce the regulatory frame-work, the West African Banking Commission estab-
lished in 1990 has been an important step towardensuring uniform and more efficient supervision offinancial institutions in the eight member countriesof the West African Economic and Monetary Union(IMF 2001a).
Capital outflows
Most poor countries have de facto open finan-cial systems, in the sense that residents are
able to place assets abroad—although these trans-actions, referred to as capital outflows, are not al-ways legal. Since most capital outflows are notrecorded, they are measured by inference, as thedifference between recorded capital inflows andthe sum of the current account deficit and in-creases in international reserves. This measurementis inevitably imprecise.27 Despite these difficulties,there is no doubt that outflows are large relative toeconomic activity in many, if not most, of the poorcountries, which has important implications forthe volume of domestic investment and the con-duct of macroeconomic policy. This section dis-cusses the determinants of capital outflows andtheir implications for the domestic economies ofthe poor countries.
Capital outflows are high relative to domesticsavings for the poor countriesThe poor countries have experienced substantialcapital outflows over the past two decades. Never-theless, capital outflows remain smaller than in-flows, and in most poor countries net external fi-nance makes a positive contribution to domesticinvestment. Cumulated outflows totaled $62 bil-lion, equivalent to 17 percent of GDP, almost 12percent of cumulated savings for 1980–99, nearlya fifth of cumulated official flows during 1980–99,and nearly two-and-a-half times international re-serves in 1999 (table 3.6).28 Capital outflows fromthe poor countries were larger relative to domesticsavings and reserves, and only slightly smaller rel-ative to GDP, than outflows from other developingcountries (which generally are viewed as more fi-nancially integrated with the rest of the world).
Capital outflows are extremely volatile, how-ever, and these aggregate data conceal considerablevariation over time and across countries. Since1985, capital outflows from the poor countrieshave varied from less than 3 percent of GDP to just
69

G L O B A L D E V E L O P M E N T F I N A N C E
70
over zero (meaning capital repatriation) (figure3.8). Moreover, the cross-sectional standard devia-tion of the ratio of capital outflows to GDP isgreater than the average over the period. Anotherway of gauging cross-sectional variability is thatcapital outflows averaged $8 billion a year during1995–99, but 20 countries have outflows that totalover $10 billion, while 6 countries account formore than $2 billion of reverse outflows (repatria-tion of residents’ capital).
Indeed, capital outflows from the poor coun-tries are more volatile than outflows from themiddle-income countries, while inflows are lessvolatile (presumably because the poor countries re-ceive little of the more volatile capital market flows)(table 3.7). This highlights an important point:many poor countries face the same issues surround-ing capital flows volatility and the implications for
macroeconomic stabilization as the middle-incomecountries. Moreover, at lower levels of income,volatility is likely to be more costly in terms of wel-fare (a decline in income can push more people tosubsistence levels or below). Poor countries typi-cally lack the range of instruments (for example, anefficient government bond market) available tomiddle-income countries to deal with macroeco-nomic volatility, and they are also more subject tovolatility from the external sector due to their de-pendence on primary commodities. The averagevolatility of the poor countries’ terms of trade (asmeasured by the coefficient of variation) in 1990–99 was about 40 percent higher than in other de-veloping countries. Thus the poor countries facehigher levels of volatility, volatility is more costlyfor them, and they are less equipped to deal with it,compared with middle-income countries.
A poor investment climate encourages capital outflows The quality of the investment climate in the poorcountries is the main determinant of the level ofcapital outflows. War and civil conflict, corrup-tion, macroeconomic instability, uncertainty overproperty rights, high tax rates, weak governmental
Cumulatedoutflows
(billions of dollars)
As share of1999 GDP(percent)
As share of cumulated domestic
savings (percent)
As share of cumulated
domestic capitalformation(percent)
As share of cumulated
official inflows(percent)
As share of netinternational
reserves in 1999(percent)
Table 3.6 Cumulated outflows during 1980–99
Poor countries 62 17 11.5 8.1 19 242Other developing countries 1,182 20 6.5 6.6 278a 175
a. This ratio is high because aid flows to middle-income countries are very small.Sources: IMF Balance of Payments; World Bank staff estimates.
Percentage of GDP
Figure 3.8 Capital outflows fromdeveloping countries, 1985–99
Source: IMF Balance of Payments (BOP); World Bankstaff estimates.
–4
–3
–2
–1
0
1
1985 1987 1989 1991 1993 1995 1997
Poor countries
Middle-income countries
1999
Table 3.7 Volatility of capital flows, 1990–99
Inflows as share of GDP Outflows as share of GDP (coefficient of variation) (coefficient of variation)
Poor countries 0.12 3.6Other developing
countries 0.30 2.1
Note: For each country group, the mean is estimated by dividing thesum of flows by the sum of GDP for each year, and then taking themean over the decade. Standard deviation is computed using the an-nual averages for the decade. Coefficient of variation is the ratio ofstandard deviation to the mean. Resource flows include short-termdebt flows and are taken from GDF. Outflows are estimated usingIMF BOP.Source: World Bank staff estimates.

T H E P O O R C O U N T R I E S ’ I N T E R N A T I O N A L F I N A N C I A L T R A N S A C T I O N S
institutions, financial sector repression, and un-necessary constraints on private sector economicactivity encourage outflows by limiting the oppor-tunities for profitable domestic investment (box3.2) and increasing the risk of confiscation or cap-ital losses on funds held domestically (Tornell andVelasco 1992).29 Several authors have mentionedthat capital flight is driven by the desire to safe-guard incomes derived from corruption and crime(see Varman-Schneider 1995 in the case of India,and Loungani and Mauro 2000 in the case of theRussian Federation). In poor countries with betterthan average economic policies (as measured bythe Bank’s Country Policy Performance Rating),the stock of capital outflows totaled only 6 percentof GDP, compared with 30 percent of GDP incountries with worse than average policies (table3.8). Sheets (1996) found that inflation, budgetdeficits, and low interest rates were associatedwith increased capital flight. Schineller (1997,1999) also found that the fiscal deficit was an im-portant determinant of capital outflows, and re-
versals of outflows were associated with macro-economic stabilization and structural adjustmentprograms. A high debt-to-GDP ratio raises the riskof future taxation, and also the risk of default onsovereign liabilities to residents. Cumulative capi-tal outflows averaged 39 percent of GDP in poorcountries with higher than average debt-to-GDPratios, but only 5 percent of GDP in countries withlower than average debt ratios.
In some countries, preferential treatment offoreign capital versus domestic capital also boostedoutflows in the form of round tripping (see exam-ple of round-tripping in China in chapter 2). Pref-erential treatment for foreigners may include taxbreaks, preferential access to prime land and otherinputs, and exemption from exchange controlsfaced by residents (Dooley 1986; Khan and Ul-Haque 1985; Eaton 1987; Ize and Ortiz 1987).30
Such discriminatory treatment of resident capitalrelative to nonresident capital may encourage in-vestors to deposit their wealth in a foreign bank,and then raise debt financing from the same bankfor their domestic investments (Lessard and Wil-liamson 1987).
Just as a poor investment climate encouragesoutflows, improvements in the investment climatecan encourage capital repatriation. Ajayi (1997)describes how improvements in macroeconomicstability and better governance encouraged the re-versal of capital flight in Côte d’Ivoire, CentralAfrican Republic, Uganda, Ghana, and Kenya dur-ing the 1980s and 1990s. Olopoenia (2000) esti-mated that capital flight from Uganda rose duringperiods of political instability (1971–74, 1976–79,and 1981–87), but there was a “reflow” of flightcapital following a return to peace and economicliberalization (including exchange rate unificationand lifting of exchange controls) during the 1990s.In Kenya, Tanzania, and Uganda, high Treasurybill rates offered by governments have attractedfunds from returning emigrants (Bhinda, Griffith-Jones, and Martin 1999). Tax amnesty programshave been used as another means of attracting in-flows (see Ng’eno 2000 for the example of Kenya).However, such programs can only provide one-off,short-term effects (Das-Gupta and Mookherjee1995), and are effective only if accompanied bymeasures to reduce the distortions that encouragedoutflows in the first place. If repeated, tax amnestyprograms increase incentives for evasion, as tax-payers wait for the next amnesty.
71
Table 3.8 Cumulated outflows as a share of GDP,1999(percent)
Poor Other developingcountries countries
Investment climatePolicy environmenta High –5.9 –19.8
Low –30.3 –20.1GDP growth High –16.4 –17.3
Low –19.7 –28.7Debt/GDP High –39.2 –23.9
Low –5.1 –19M2/GDP High –6.3 –20.5
Low –37.7 –20.2Trade/GDP High –40.7 –28.2
Low –7.6 –16.8
Income effectsPer capita income High –6.1 –20.8
Low –21.2 –19.4Gini High –49.7 –22.1
Low –6.7 –14.2
Discrimination ofresident capital
Exchange premium Positive –21.6 –23.4Zero –7.6 –17.5
Note: Outflows cumulated over the 1980–99 period. High and lowusually refer to above and below median of the concerned variable.The numbers reported are sum of cumulated outflows for countriesabove median (say) divided by sum of GDP of the same countries.a. Policy environment is measured by World Bank’s country policyperformance rating.Source: World Bank staff estimates.

G L O B A L D E V E L O P M E N T F I N A N C E
72
Outflows are also associated with increasedwealth and globalizationCapital outflows do not always signal a poor in-vestment climate. In many middle-income coun-tries, the rise in capital outflows before the EastAsian crisis appeared to be tied to increases in
wealth that increased the demand for internationalportfolio diversification (box 3.3). By contrast, thepoor countries with higher than average per capitaincomes (for the poor-country group) experiencedsmaller outflows (table 3.8), perhaps becausewealth levels, while higher than those of the aver-
Capital outflows from the middle-income countrieshave a different composition than outflows from the
poor countries, and the predominant motivations are dif-ferent as well. Many middle-income countries becamemore integrated into the global economy over the courseof the 1990s. In the first half of the decade, the officialdata showed a sharp rise in private capital inflows, butthis was substantially offset by an increase in capital out-flows, as increased wealth and trade transactions boostedthe desire for portfolio diversification (Gordon andLevine 1988). About one-quarter of capital outflows frommiddle-income countries took the form of foreign director portfolio investment (see figures). Thus, in the early1990s, growing capital outflows from many middle-income countries were consistent with economic progress,while in the poor countries capital outflows often re-flected a poor climate for investment and slow growth. Inthe second half of the 1990s, capital outflows by residentsincreased from countries affected by crises, for exampleMexico in 1995, Indonesia, Korea, and Thailand in
1997–98,31 and the Russian Federation in 1998. A signifi-cant portion of capital outflows may also represent round-tripping. For example, the experience of the crises mayalso have encouraged domestic investors to try to benefitfrom explicit and implicit guarantees on foreign debt.
The different motivations of capital outflows fromthe middle-income countries have meant that some ofthe relationships outlined in the main text concerningpoor countries do not hold. For example, middle-income countries with better policies and with higherper capita income have experienced almost the samelevel of cumulative capital outflows as middle-incomecountries with poor policies and low income. Thus,good policy environments in some of the more success-ful middle-income countries have facilitated growthwhile still allowing residents to diversify their portfoliosinternationally. On the other hand, middle-incomecountries with high debt-to-GDP levels, greater open-ness to trade, and greater inequality have had relativelyhigh levels of capital outflows, as in the poor countries.
Box 3.3 Capital outflows from the middle-incomecountries
Composition of cumulated outflows frommiddle-income countries during 1980–99
Note: Other includes trade credit, bank deposits, and currency holdings.a. Errors and omissions.
E&Oa
24%
FDI12%
Portfolio13%
Other51%
Composition of cumulated outflows frompoor countries during 1980–99
E&Oa
9%
FDI1%
Portfolio2%
Other88%

T H E P O O R C O U N T R I E S ’ I N T E R N A T I O N A L F I N A N C I A L T R A N S A C T I O N S
age poor country, had not reached levels wheresubstantial international diversification was neces-sary. Higher trade openness may also encourageoutflows as residents have more contact with in-ternational markets, there is a rising incentive tohold foreign exchange as a hedge against changesin the exchange rate, and the scope for misinvoic-ing of exports and imports increases. Capital out-flows from poor countries with higher than aver-age ratios of trade to GDP equaled 41 percent ofGDP, compared with 8 percent in countries withlower than average trade-to-GDP ratios.32
Income inequality also can have an importantimpact on outflows. Cumulated outflows frompoor countries with high inequality, as measured bythe Gini coefficient, averaged 50 percent of GDP,compared with 7 percent for poor countries withlow inequality. A high concentration of wealth maymean that some residents have large individualportfolios that make them more likely to diversifytheir assets and more able to pay the implicit andexplicit transaction costs associated with capitaloutflows. High income inequality may also be as-sociated with greater sociopolitical risks, whichwould in turn encourage outflows. The size of out-flows is positively related to large mineral resources(such as oil, gold, and diamonds [figure 3.9]), andcountries with large natural resource endowmentsalso tend to have higher income inequality (Goreux2001). For example, the largest source of capitaloutflows from Sub-Saharan Africa is Nigeria,where outflows seem to be highly correlated withoil exports (Ajayi 2000).
It is difficult to determine whether simplecomparisons of the investment climate and capitaloutflows, as shown in table 3.8, reflect causality(and in which direction) or the influence of somethird factor that determines both indicators. Forexample, large capital outflows may be associatedwith high debt ratios because residents place fundsabroad in order to escape the potential for highertaxes to service the debt. Alternatively, high capitaloutflows may reduce growth, thus increasing debt-to-GDP ratios. Or, high levels of corruption maymean that large inflows of official finance end upin private hands and are then transferred abroad—thus increasing both external public debt and pri-vate outflows. An analysis of the relationship be-tween capital outflows and other macroeconomicvariables that takes into account the mutual inter-actions among endogenous variables (such as
growth, capital outflows, capital inflows, the realexchange rate, and fiscal deficits) and controls forthe role of other influences (such as degree of in-equality and structure of trade) can improve ourunderstanding of the forces at work. This analysisuses panel vector autoregression (explained inmore detail in annex 3.1), in which each of the en-dogenous variables is related to lagged values ofthe other endogenous variables.
The results for all developing countries indi-cate a two-way relationship between capital out-flows and the government’s track record in foster-ing growth and maintaining economic stability.Higher growth rates are associated with reducedcapital outflows in the next period, while highercapital outflows appear to contribute to reducedgrowth rates in the next period. Similarly, a higherfiscal surplus is associated with smaller capital out-flows in the next period. Capital outflows are alsosignificantly related to capital inflows, which mayeither reflect round-tripping or the tendency for fi-nancially integrated economies to engage in bothexternal borrowing and lending. Thus there isstrong support for the existence of virtuous (and vi-cious) cycles, in which, for example, a fall in capitaloutflows increases the domestic resources availablefor growth, which in turn lowers outflows. Thequalitative results for poor countries follow a simi-lar pattern, although the statistical significance ofthe coefficients is found to be weaker than the re-sults for all developing countries.33
73
Outflows (1980–99) as a percentage of GDP
Figure 3.9 Cumulated outflows and minerals exports
a. Percentage of ores and metals exports in merchandise exports.Source: World Bank, World Development Indicators, various years; World Bankstaff estimates.
0Less than 20%
aBetween 20% and 40%
aGreater than 40%
a
10
20
30
40
50
60
70
Poor
Other countries

G L O B A L D E V E L O P M E N T F I N A N C E
74
Most poor countries have controls on capitalaccount transactions—While many poor countries have achieved a signifi-cant reduction in restrictions on current accounttransactions since the 1980s, most continue to im-pose restrictions on capital account transactions.Four indicators that have often been used to mea-sure trends in foreign exchange restrictions overtime are: (a) existence of multiple exchange rates,(b) export earnings surrender requirements, (c) con-trols on current account transactions, and (d) con-trols on capital account transactions.34 The firsttwo of these indicators are available over a longtime series through the most recent year, while thelatter two are available on a comparable basis onlythrough 1995.35
The poor countries have made progress in re-ducing current account restrictions. The share ofreporting poor countries that imposed current ac-count restrictions fell from 75 percent in 1985 to44 percent in 1995. It appears that the trend to-ward liberalization of current account restrictionscontinued in the second half of the 1990s: the shareof reporting poor countries that require exportersto surrender foreign exchange earnings to the gov-ernment dropped from 64 percent in 1995 to 52percent in 2000. Moreover, the share of reportingpoor countries with multiple exchange rates fellfrom 29 percent in 1995 to only 10 percent in2000.36
By contrast, the share of poor countries re-porting capital account restrictions has remainedat about 90 percent since the mid-1970s, with aslight rise during the mid-1980s and a slight de-cline in the mid-1990s when a few countries liber-alized capital account transactions (figure 3.10). Inaddition, there has been almost no change in theshare of poor countries reporting various capitalaccount restrictions in the more detailed formatused since 1995. While it is impossible to make a precise comparison of the late 1990s with ear-lier years, the broad conclusion is that most poorcountries have maintained capital account restric-tions over the course of the last 30 years. Theshare of other developing countries reporting capi-tal account restrictions also has changed littlesince the early 1970s, but it remains well belowthe share of poor countries imposing capital ac-count restrictions.
—but capital controls are porousControls often have only a limited impact on capi-tal outflows in the context of a weak investmentclimate, where domestic investment opportunitiesare limited and fears of confiscation or reductionin the value of assets give residents considerableincentive to put their money abroad. Controlshave had some success in the middle-income coun-tries when they are limited in time or in purpose(see box 3.4). But they have had particularly lim-
Percent
Figure 3.10 Capital account restrictions
Source: IMF Exchange Arrangements and Exchange Restrictions.
100
90
80
70
60
50
1966 1968 1970 1972 1974 1976 1978 1980 1982 1984 1986 1988 1990 1992 1994 1996
Poor (including transition) Nonpoor (including transition)

T H E P O O R C O U N T R I E S ’ I N T E R N A T I O N A L F I N A N C I A L T R A N S A C T I O N S
75
ited success in the poor countries, where controlsare typically imposed over an extended period, sothat individuals and firms have ample opportunityto find means of getting around them.
Means of circumventing capital controls in-clude:
• Trade misinvoicing. A portion of the exportearnings may not be reported to the authorities
in an effort to bypass foreign exchange surren-der requirements. Similarly, imports may beoverinvoiced to gain access to larger amountsof foreign exchange. Residents also may falsifyimport letters of credit and customs declara-tions to bypass exchange controls.
• Smuggling. Goods may be smuggled and theproceeds deposited in banks. Sometimes,barter may be arranged for trading contra-
Thailand’s and Malaysia’s experiences with capital con-trols on outflows, and Chile’s experience with capital
controls on inflows, provide some evidence that controlscan be effective if narrowly focused and adjusted in re-sponse to attempts at circumvention.
In 1991 the Chilean government imposed controls oninflows to lengthen the maturity of inflows and increasethe capacity of the central bank to conduct an independentmonetary policy. The controls consisted of unremuneratedreserve requirements (URRs) that (initially) mandated that20 percent of the deposit remain in a non–interest-payingaccount for the duration of the credit. “Minimum stay”requirements of three years were placed on FDI and port-folio flows. While subsequent changes were made in thespecifics of the controls (changes in the URR percentage,reductions in the minimum stay, extensions or exemptionsfrom coverage), the underlying restrictions remained inplace until 1998. The controls elicited a tug-of-war be-tween the authorities and the private sector, in which peri-odic success by the private sector in diluting the effective-ness of the controls led to efforts by government to closethe loopholes. Evidence suggests that there was somelengthening of the maturity of inflows with little impacton the aggregate value of inflows. In addition, domesticinterest rates were marginally “delinked” from interna-tional markets, providing the authorities with an increasedspace for policy maneuver (De Gregorio, Edwards, andValdes 2000). The benefits must be balanced off againstthe costs, though, which included raising the cost of bor-rowing for domestic firms (especially those without accessto international markets).
Both Thailand and Malaysia resorted to controls oncapital outflows as part of their response to the Asian cri-sis. In Thailand, the controls were first adopted early inthe crisis, in an effort to limit offshore speculation againstthe baht. The controls were intended to be narrow, anddid not apply to legitimate commercial and financial trans-
actions (including trade flows, FDI, and portfolio flows).The initial controls were modified on several occasions, in-cluding both loosening in response to changing economicconditions as well as tightening to close loopholes that theprivate sector had begun to exploit. Measured against theobjective of “punishing” speculation by limiting offshoreliquidity, the controls were at least partially successful, asthey contributed to a wide and persistent gap between on-shore and offshore swap rates (IMF 2000a).
Capital controls were adopted in Malaysia in Septem-ber 1998, when the exchange rate had already depreciatedsharply, making sizable further outflows unlikely. More-over, as in Thailand, the Malaysian controls were selectivein nature, designed to curtail (if not eliminate) the possibil-ity of speculation against the ringgit while leaving ordinarytrade and FDI flows unaffected. The controls were immedi-ately effective. The prohibition on interaccount transactionsvirtually halted offshore ringgit trading, while the manda-tory 12-month holding period on portfolio repatriationshut down outflows. But in retrospect it is also clear thatthe Malaysian controls were imposed after the worst of thecrisis had passed, so that their major contribution was oneof safeguarding against further turbulence rather than limit-ing the direct impact of the crisis itself (see also Dornbusch2001; and Kaplan and Rodrik 2001). The control systemrelied heavily on comprehensive regulation and bureau-cratic intervention, and active adjustment and fine-tuning ofthe controls by the authorities occurred in response to pri-vate sector efforts to evade the impact (Hood 2001).
What lessons can be drawn from these experiences ofcapital controls? First, the success of controls depends inpart on defining a sufficiently narrow objective. BothMalaysia and Thailand had some success in limiting specu-lation through offshore markets. Second, the control sys-tem must remain dynamic: the private sector will inevitablystrive to minimize or avoid the impact of controls, necessi-tating administrative responses to fine-tune the regulations.
Box 3.4 Narrowly focused capital controls inemerging markets
G L O B A L D E V E L O P M E N T F I N A N C E
band (for example, diamonds for arms inSierra Leone [see Goreux 2001]).
• Changes in transfer prices and leading andlagging of intracompany transfers are usedfor shifting funds abroad (Mathieson andRojas-Suarez 1993).
A common method of effecting fund transfersin the presence of exchange controls is hawala(meaning “trust” in Hindi), also known as hundiin Pakistan, or fei ch’ien (literally “flying money”)in China. In a hawala transaction, a developing-country resident who wants to transfer funds to atransferee abroad deposits local currency with anagent and obtains a “chit.” The agent instructs hiscolleague in a foreign country to pay an equivalentamount of foreign currency to the transferee uponpresentation of the chit (or simply a code). It is be-lieved that the net amount outstanding at the endof a long period of time is settled through smug-gling. Thus hawala is not a distinct means of evad-ing capital controls, but rather a means of effect-ing international payments transactions whendesired, with ultimate settlement done by themeans of capital outflows outlined above. Thismethod (believed to have originated in China dur-ing the T’ang dynasty) is fairly common in SouthAsia, the Middle East, Sub-Saharan Africa, andSoutheast Asia.37
Controls on capital outflows not only havelimited success over the medium term, they mayalso discourage capital inflows. Foreigners will beunwilling to invest where there is significant uncer-tainty regarding their legal ability to repatriateprofits and ultimately liquidate the investment.The presence of capital controls, even if they arewidely evaded, will create such uncertainty, be-cause foreigners are typically less knowledgeableabout the feasibility and risks involved in commit-ting technical violations of the law. Also, multina-tionals are usually unwilling to undertake illegaltransactions because of the harm to their reputa-tions and the likelihood of being made an exampleif enforcement of controls is tightened in the fu-ture. Conversely, removing capital controls can en-courage inflows (Laban and Larrain 1997). Severalcountries have eased controls on outflows whenfaced with large inflows (to limit currency appre-ciation and loss of export competitiveness, seeCalvo, Leiderman, and Reinhart 1993), but the lib-eralization actually resulted in increased inflows.
Examples include Chile, Colombia, and Egypt inthe early 1990s (Schadler and others 1993).
As one motivation for capital outflows is toguard against a real devaluation of the domesticcurrency, several middle-income countries have al-lowed local deposits denominated in foreign cur-rencies to reduce capital flight and induce nonresi-dent inflows (for example, India, Mexico, Uruguay,and Turkey [see Rojas-Suarez 1990]). Moves to-ward capital account liberalization such as allow-ing foreign currency deposits may reduce distor-tions and corruption that studies find to beassociated with capital controls (Edwards 1999;Loungani and Mauro 2000), and can increase thesupply of capital to help governments manage diffi-cult times. In Turkey, for example, worker remit-tances doubled between 1988 and 1989 in re-sponse to such a policy. Remittances also doubledbetween 1992 and 1994 in India when nonresidentworkers were allowed to hold foreign currency de-posits onshore.
Some of the poor countries have also movedtoward liberalizing controls on inflows. In the1990s liberalization of exchange regulations led to rapid growth of foreign currency accounts in afew countries in Sub-Saharan Africa (for example,Ghana, Tanzania, and Uganda), and a significantpart of these funds reflected the return of flightcapital (Bhinda, Griffith-Jones, and Martin 1999).According to Stryker (1997), foreign currency de-posits held by residents onshore in Ghana increasedsignificantly over the early 1990s, to make up athird of total deposits by the end of 1996. Privatetransfers to Uganda increased from $80 million in1991 to $415 million in 1996, following capital ac-count liberalization that permitted residents toopen foreign exchange denominated accounts; de-posits in such accounts accounted for one-quarterof broad money in Uganda in April 2000 (Kasek-ende 2000). In Kenya, the legalization of foreigncurrency deposits in the early 1990s in the contextof high real interest rates attracted large short-termflows: the level of international reserves rose from$81 million at the beginning of the second quarterof 1993 to $685 million a year later.
Liberalization of the capital account, however,can prove costly, especially when combined withinterest rate liberalization in the context of a weakmacroeconomic policy environment and underde-veloped financial markets. Capital account liberal-ization (including allowing local foreign currency
76

T H E P O O R C O U N T R I E S ’ I N T E R N A T I O N A L F I N A N C I A L T R A N S A C T I O N S
accounts) has to be complemented by soundmacroeconomic policy and prudential banking reg-ulations, but poor-country governments often lackthe resources to obtain the information requiredfor effective supervision, and corporate governanceand accountability can be weak. If liberalization in-duces a large repatriation of flight capital by resi-dents, or attracts significant nonresident inflows,the currency may appreciate and, at the same time,domestic liquidity may expand, generating infla-tionary pressures. Liquidity management in such asituation may not be easy, especially since manypoor countries do not have sufficient instrumentsof monetary policy to conduct sterilization. (Steril-ization may also prove to be very expensive, as inthe case of Indonesia before the crisis in 1997.) In-creased dollarization of domestic liabilities throughallowing foreign currency accounts may also com-plicate monetary and exchange rate management.38
Moreover, allowing unrestricted capital flowscan increase the risks assumed by domestic banksand corporations, as happened in East Asia beforethe 1997 crisis (Corsetti, Pesenti, and Roubini 1998;Krugman 1998). In the presence of a pegged ex-change rate and relatively high domestic interestrates, capital account liberalization can encourageresidents to take unhedged foreign currency expo-sure (if the pegged exchange rate is expected to bemaintained, borrowers can take low interest rateforeign loans and place the funds in high-yieldingdomestic accounts). This can result in significantcurrency mismatches on banks’ balance sheets,which in turn can lead to huge losses if a fall in con-fidence triggers capital outflows (or if devaluationof the currency is required for any reason) (Eichen-green and others 1999; World Bank 1999a). Evenwith a floating exchange rate (so that the incentivefor unhedged exposures is reduced), sharp changesin the exchange rate can introduce considerablevolatility in the balance sheets of banks with largeforeign currency exposure. Middle-income coun-tries have suffered very severe consequences fromcapital account liberalization combined with weakfinancial institutions and insufficient supervision.Poor countries with even greater financial sectorweaknesses could confront serious difficulties withopen capital accounts.
There is some evidence that the liberalization ofcapital inflows in Sub-Saharan African countrieswas associated with both macroeconomic and fi-nancial sector difficulties. Bhinda, Griffith-Jones,
and Martin (1999) found that increased private cap-ital inflows contributed to real effective exchangerate (REER) appreciation in Tanzania, Uganda,Zambia, and Zimbabwe during 1990–97.39 The do-mestic liquidity expansion that resulted from capitalinflows may also have been a factor behind the im-prudent lending and borrowing behavior by banksin these countries. In Uganda, despite prudent fiscalpolicy and attempts to supervise banks and regulatecorporate borrowings (the Financial InstitutionsStatute of 1993), two banks had to be taken overfor restructuring in 1995. The accumulation ofshort-term foreign liabilities was a source of distressin these problem banks (Kasekende 2000). InKenya, nonperforming loans as a share of totalloans rose from 20 percent in 1994 to over 30 per-cent in 1997 (Ngugi 2000; Brownbridge 1998)—theresulting banking crisis may have been related to thesurge in repatriated outflows (from $177 million in1994 to $682 million in 1997).
Moreover, most of the poor countries aresmall economies with heavy dependence on pri-mary commodities (and are thus subject to severeterms-of-trade shocks, as noted above), and theyhave relatively shallow capital markets. A com-pletely open capital account could magnify the im-pact of external shocks. For example, a sharp fallin the price of a major export commodity couldlead to large capital outflows in anticipation of adevaluation, potentially leading to overshooting ofthe exchange rate. The same process would occurwith capital controls, but to a lesser degree. In ad-dition, short-term controls that exempt FDI trans-actions may be an attractive option for poor coun-tries that lack market access and hence do nothave to take into account the impact of controls indiscouraging portfolio inflows.
Thus the poor countries need to move cau-tiously toward liberalizing capital account transac-tions. Countries that have already opened the capi-tal account, established sustainable macroeconomicpolicies, and made the difficult adjustments re-quired to maintain stability in the face of capital in-flows (particularly establishment of strong corpo-rate and financial sector institutions and effectivesupervision) should not backtrack by imposing con-trols. Many poor countries continue to confrontweak financial sector institutions and difficult chal-lenges in achieving strong governance and sustain-able macroeconomic policies. Liberalizing capitalinflows under such conditions can lead to excessive
77

G L O B A L D E V E L O P M E N T F I N A N C E
78
risk taking and exacerbate macroeconomic instabil-ity. Poor countries need to take into account the de-gree of volatility of their economies, and be confi-dent in the quality of their policies and institutions,before undertaking the risks involved in capital ac-count liberalization.
Annex 3.1: Econometric analysis offoreign bank participation
The effects of foreign bank presence on the op-eration of domestic banks can be more com-
pletely examined by formal econometric evidence.The regressions in table 3A.1 investigate how for-eign bank presence affects five performance indica-tors of domestic banks: (a) net margin, (b) nonin-terest income, (c) before-tax profits, (d) overheadexpenses, and (e) loan loss provisions. All of these
variables are measured as a share of total domesticbank assets.
Apart from foreign bank presence, the regres-sions relate the domestic banks’ performance indi-cators to the financial characteristics of individualbanks (such as equity capital and other earning as-sets) and their apparent cost-efficiency (as measuredby the overhead expense ratio). The regressions alsocontrol for the impact of the macroeconomic envi-ronment on bank performance. Macroeconomicfactors that may affect interest margins, profitabil-ity, and provisioning for bad loans include the rateof GDP growth, inflation, and the real interest rate.In addition to the observed share of foreign banks,an attempt is made to capture the contestability ofthe domestic market, as measured by the countrycommitments on commercial presence in bankingunder the General Agreement on Trade in Services(GATS) financial services agreement of 1997. Re-
Table 3A.1 Foreign bank presence and domestic bank performance
(3) (5)(1) (2) Before tax (4) Loan loss
Net margin/ta Nonint. income/ta profits/ta Overhead/ta prov./ta
Foreign bank share –0.076a –0.128a –0.320a –0.124a 0.166b
(0.026) (0.021) (0.063) (0.020) (0.065)
Index on degree of entry 0.150 –0.046a 0.008 –0.097a –0.037c
(0.010) (0.010) (0.023) (0.010) (0.020)
Equity/ta 0.129a 0.037a 0.365a –0.025c –0.210a
(0.031) (0.011) (0.100) (0.014) (0.079)
Other earning. assets/ta 0.010 0.013b 0.096a –0.012b –0.081a
(0.010) (0.007) (0.022) (0.006) (0.021)
Cust. & short-term funding/ta 0.040b 0.001 0.020 0.004 0.010(0.020) (0.012) (0.058) (0.009) (0.048)
Overhead/ta 0.508a 0.444a –0.168 0.222(0.084) (0.059) (0.247) (0.273)
Growth rate of GDP/cap 0.063 –0.049 0.670a –0.150a –0.690a
(0.059) (0.035) (0.155) (0.029) (0.142)
Inflation rate 0.027a 0.007 0.060a 0.008 –0.031a
(0.009) (0.007) (0.011) (0.008) (0.009)
Real interest rate 0.069a 0.010 0.131a 0.029b –0.073a
(0.017) (0.012) (0.032) (0.012) (0.025)
Constant –0.030 0.045a –0.075 0.137a 0.084c
(0.023) (0.011) (0.060) (0.009) (0.050)
Adjusted R2 0.368 0.429 0.503 0.233 0.423No. of obs. 1349 1349 1342 1362 1213
Note: Regressions are estimated using weighted least squares pooling bank level data across 36 countries for the 1994–2000 period. Onlydomestic bank observations were used. The number of domestic banks in each period is used to weight the observations. Heteroskedasticity-corrected standard errors are given in parentheses.a. Significance level of 1 percent.b. Significance level of 5 percent.c. Significance level of 10 percent.Source: Claessens and Lee 2001.

79
T H E P O O R C O U N T R I E S ’ I N T E R N A T I O N A L F I N A N C I A L T R A N S A C T I O N S
gressions thus also include a “liberalization index”—first created by Sorsa (1997) for the 1995 financialservices negotiations, and adapted by Qian (2000)for the 1997 GATS negotiations. The index runsfrom 0 to 1.
The estimated regression is as follows:
Iijt = �o + � FSjt + �i Bijt+ �j Xjt + �4 Sjt + �ijt
Iijt is the dependent variable (for example, be-fore tax profits/total assets) for domestic bank i incountry j at time t. FSjt is the number of foreignbanks in country j at time t as a share of the totalnumber of banks. Bijt are financial variables fordomestic bank i in country j at time t. Xjt are coun-try variables for country j at time t, and Sjt is the“liberalization index.” Further, �o is a constant,and �, �i, �j and �4, are coefficients, while �ijt is anerror term.
Estimating a regression in levels—as opposedto differences—can be a correct approach providedit is the presence, rather than entry, that causes thelocal banking systems to behave differently. More-over, the foreign bank presence at time t should bedetermined by entry incentives as of period t–1. Ifthe foreign bank share is only endogenous tolagged bank variables, the regression can be esti-mated separately using cross-country time-seriesdata (see further Claessens and others 1998).40
Variable definitions and sourcesNet margin/ta = Interest income minus interest
expense over total assets.Noninterest income/ta = Other operating income
such as trading costs, advisory fees, and so onover total assets.
Before-tax profits/ta = Before-tax profits over totalassets.
Overhead/ta = Personnel expenses and other non-interest expenses over total assets.
Other expenses/ta = Nonoverhead, noninterest,other expenses over total assets.
Equity/ta = Book value of equity (assets minus lia-bilities) over total assets.
Other earning assets/ta = Assets other than loansand non-interest-earning assets such as cashand non-interest-earning deposits at otherbanks, over total assets.
Customer and short-term funding/ta = All short-term and long-term deposits plus other nonde-posit short-term funding over total assets.
Foreign bank share = Number of foreign banks tototal number of banks. A bank is defined as aforeign bank if it has at least 50 percent for-eign ownership.
GDP/cap = Real GDP per capita in thousands ofU.S. dollars.
Inflation = Annual increase of the GDP deflator.Liberalization Index = Degree of commercial pres-
ence in banking as allowed in the financialservices negotiations of 1997 and as reportedin Qian 2000.
All individual bank-level variables are ob-tained from the Bankscope database of IBCA; ad-ditional data are obtained from various sources.All macro data are from the World Bank.
Econometric analysis of capital outflows Capital outflows can be both the cause and the ef-fect of macroeconomic variables. While a macro-economic variable (such as growth or fiscal deficit)may cause outflows, it may also be affected by out-flows. This relationship would, of course, dependon the extent to which capital outflows are offsetby capital inflows. In turn, inflows may cause out-flows and vice versa.41
The presence of such interactions among vari-ables would violate the standard ordinary leastsquares assumption that the explanatory variablesare exogenous (that is, not correlated with the errorterm). This endogeneity problem can be partiallyaddressed by using instrumental variable regressors,but single-equation models cannot fully capture thedynamic interactions among several endogenousvariables. A popular method that can capture suchinteractions is the vector-autoregression (VAR) tech-nique. For our purpose, we applied the dynamicpanel-VAR technique that combines the advantagesof the VAR model with the advantages of paneldata analysis that can admit observable and un-observable country fixed effects. Such fixed effectswould include variables that vary a great dealacross countries but remain relatively “fixed” overtime for each country—for example, financial de-velopment, or demographic patterns.
We estimate a panel-VAR model with five vari-ables in the following order: capital inflows; capitaloutflows (negative = capital repatriation); theREER (an increase implies erosion of export com-petitiveness); growth; and the fiscal balance (posi-tive = surplus, negative = deficit). This ordering im-
�
� � � �
� � �

80
plies that the capital flow variables can affect themacroeconomic variables without restriction (con-temporaneously or lagged as the data dictate) butthat the macroeconomic variables are restricted toaffecting the capital flows variables only through a lag.
ResultsWe ran a panel-VAR regression for all (137) devel-oping countries for 1980–99 (546 observations),and a separate regression for the poor countries(142 observations) for the same period. The re-gression coefficients of the five equations are sum-marized in table 3A.2 for all developing countriesand in table 3A.4 for the poor countries. The im-pulse response functions are summarized in table3A.3 for all developing countries and in table 3A.5for the poor countries. (The impulse responses il-lustrate the effect of a one standard deviationshock to each variable on all the other variables,taking into account the knock-on effects throughthe system over time.) This summary details anysignificant effect over several years at the 5 percentlevel and the sign of that effect.
The results for all developing countries pro-vide support for the existence of virtuous (and vi-cious) cycles among the five variables under con-sideration (for example, outflows lead to lowergrowth which in turn causes further outflows).The qualitative results for poor countries follow asimilar pattern, although the statistical signifi-cance of the regression coefficients and impulse re-sponses is found to be weaker than in the case ofall developing countries.42
However, these results from the panel-VARexercise tend to be sensitive to the choice of timeperiod or the presence of outliers. The data on ma-croeconomic variables and, in particular, on capi-tal flows, display considerable volatility over timeand also suffer from substantial cross-sectionalvariation. The volatility is even worse in the case ofpoor countries.
Measuring capital outflows from developing countriesMeasuring capital outflows is inherently difficultand imprecise. Typically, outflows are measured in-directly, as the residual of “sources of funds” over
G L O B A L D E V E L O P M E N T F I N A N C E
Table 3A.5 Summary of impulse response functions,poor countries
Dependent variables
Fiscal Inflows Outflows REER Growth balance
Inflows + + – +Outflows +REER – + –Growth + + +Fiscal balance + – + +
Source: World Bank staff estimates.
Table 3A.4 Results of panel-VAR regression for poorcountries
Dependent variables
Fiscal Inflows Outflows REER Growth balance
Inflows 0.503 –0.042 –0.362* 0.056 –0.146Outflows –0.046 0.137 0.195* –0.013 –0.001REER –0.016 –0.040 0.487* 0.001 –0.026Growth –0.070 –0.319 1.094* 0.371* 0.176Fiscal balance 0.141 –0.112* –0.414 0.028* 0.056
Note: An asterisk indicates significance at 5 percent level or higher.Source: World Bank staff estimates.
Table 3A.2 Panel-VAR results for all developingcountries
Dependent variables
Fiscal Inflows Outflows REER Growth balance
Inflows 0.509 –0.049 –0.079 0.073* –0.092Outflows –0.029 0.202* 0.086 –0.043* –0.028REER –0.027* –0.051* 0.555* –0.003 –0.033*Growth 0.010 –0.259* 0.600* 0.320* 0.024Fiscal balance 0.127 –0.119* –0.388 0.036* 0.115
Note: An asterisk indicates significance at 5 percent level or higher.Source: World Bank staff estimates.
Table 3A.3 Summary of impulse response functions,all developing countries
Dependent variables
Fiscal Inflows Outflows REER Growth balance
Inflows + + +Outflows + – – +REER – – + –Growth – + + +Fiscal balance + – + +
Source: World Bank staff estimates.

T H E P O O R C O U N T R I E S ’ I N T E R N A T I O N A L F I N A N C I A L T R A N S A C T I O N S
the “uses of funds” from the balance of payments(World Bank 1985; Morgan Guaranty 1986; Cline1985). This is the procedure adopted here. Thesources of funds include all identified inflows andcredit items in the capital account of the balance ofpayments, while uses of funds are the current ac-count deficit and increase in international reserves.By the balance of payments identity, this residual es-timate yields identical estimates to capital outflowscalculated directly as the sum of FDI outflows, debtoutflows, portfolio equity outflows, other outflows,and debit items on the capital account. All data aretaken from the International Monetary Fund Bal-ance of Payments Statistics database.
One of the shortcomings of the residual mea-sure is that it treats all errors and omissions in thebalance of payments as capital outflows. In reality,errors and omissions may reflect unrecorded cur-rent account transactions as well (Chang, Claes-sens, and Cumby 1997), and also measurement andrecording errors and lagged registration (Egger-stedt, Hall, and van Wijnbergen 1995). Anothershortcoming is that this measure ignores outflowstaking place through export underinvoicing or im-port overinvoicing (Chang, Claessens, and Cumby1997). It is hard to estimate capital flight throughtrade misinvoicing. Even if estimates of over- andunderinvoicing were accurate, not all misinvoicingrepresents funds used for capital flight. For exam-ple, exports may be overinvoiced to take advantageof export subsidies, and imports may be underin-voiced to reduce import tariffs (Eggerstedt, Hall,and van Wijnbergen 1995; Ajayi 1997).
The residual approach is less restrictive thanother measures that are defined according to themotives behind capital flight. For example, the“hot money measure” suggested by Cuddington(1986) attempts to separate the “speculative” orshort-term components of capital outflows from“normal” outflows. Dooley’s method measuresonly that part of capital outflows that does notgenerate a corresponding investment income re-ported to the domestic authorities (Dooley 1986).Interestingly, Claessens and Naudé (1993) showthat the World Bank residual and Dooley methodsactually produce similar estimates of capital flight.We have not attempted to measure the magnitudeof capital outflows according to motives (for ex-ample, speculative reasons, tax evasion, or simplyportfolio diversification) given that motives arehighly subjective and difficult to distinguish on the
basis of available data (Lessard and Williamson1987; Collier and others 2001; Varman-Schneider1991).
Finally, estimates of the stock of outflows usedin this chapter are calculated simply by cumulatingannual flows over time. This is the lower boundfor an estimate of the stock of outflows, as the cal-culation ignores interest earnings. Some authorsassume that all interest earnings on flight capitalare reinvested abroad, and use the U.S. Treasurybill rates for estimating interest earnings (Collier,Hoeffler, and Pattillo 2001). This may providesome further information on the stock of outstand-ing assets. However, for the purposes of this chap-ter we prefer to emphasize the size of flows leavingthe economy over time (rather than residents’ cur-rent holdings), and therefore do not adjust the cu-mulative stock for any estimate of earnings.
Notes1. See the overview for a definition of poor countries.2. Even so, private capital flows remain well below the
average of 5 percent of GDP achieved during the late 1970s.3. Calculated as correlation between savings/GDP and
investment/GDP across countries, in each year.4. In reality even in the highly integrated industrial
economies the correlation between investment and saving isfar from zero (see Feldstein and Horioka 1980).
5. Data weaknesses (particularly on savings in devel-oping countries) mean that these figures can provide only ageneral indication of trends in integration. Also, note thatthe correlation between savings and investment in the mid-dle-income countries does not decline over the 1990s, de-spite the massive rise in capital inflows. In part this is due tothe fact that a large portion of these inflows were used to in-crease reserves or capital outflows, and thus had only a lim-ited role in supporting domestic investment.
6. Fleisig (1996) outlines how lack of appropriate lawsand institutions constrains bank lending in developing coun-tries. Weak institutions likely make these problems most se-vere in the poor countries.
7. The overcollateralization ratio of 5:1 is taken fromKetkar and Ratha 2000.
8. Knack and Keefer (1995) use a large cross-countrytime-series dataset; and Mauro’s (1995) cross-countrydataset covers 58 countries.
9. Slow growth in the poor countries results in partfrom declines in output in countries affected by conflict.However, even excluding the conflict countries, the poorcountries’ per capita output rose by only 0.6 percent peryear in the 1990s.
10. UNCTAD (1999a) confirms that the three Africancountries that were most successful in attracting FDI flows(Ghana, Mozambique, and Uganda) achieved significant re-ductions in inflation rates and the government deficit (as aratio to GDP).
81

G L O B A L D E V E L O P M E N T F I N A N C E
11. See World Bank 1999b, chapter 3; and UNCTAD2001b, chapter 4 for detailed discussions of spillover effectsin developing countries.
12. See World Bank 2001a.13. The positive impact on growth in developing coun-
tries in general is discussed in World Bank 2001a.14. This result is based on a study of 55 poor countries
during 1980–99 based on a Solow-type production thatmakes output a function of stocks of capital, labor, humancapital, and productivity (see Mankiw, Romer, and Weil1992; Benhabib and Spiegel 1994).
15. Private investment is only correlated with growth ifBotswana is included in the sample.
16. Borensztein, De Gregorio, and Lee (1995) include69 developing countries for 1970–89. UNCTAD (1999b)analyzes the lagged impact of FDI inflows on the averagegrowth rates of about 100 developing countries for five 5-year periods over 1970–95.
17. Underachievers in attracting FDI among the coun-tries with a high reform index can be explained by limitedavailability of geological and technical information, inade-quate supporting services and infrastructure, and inconve-nient geographical location of major mines.
18. Mineral resources are finite, so an accurate mea-surement of the benefit of minerals exploitation would sub-tract from these production data the change in asset valuesassociated with the depletion of the stock of minerals in theground (see estimates of “genuine savings” in World Bank2001d, p. 183). Thus the data on production overstate thetrue benefits to the economy of minerals exploitation.
19. The share of bank assets controlled by foreignbanks in the Czech Republic, Poland, and Hungary rosefrom 12 percent in 1994 to 57 percent in 1999. Similarly, inLatin America, by the end of the decade, foreign banks con-trolled more than half of the banking systems of severalcountries (Argentina, Chile, Mexico, and the RepúblicaBolivariana de Venezuela), up from between 10 and 20 per-cent in 1994 (Mathieson and Roldos 2001).
20. These numbers refer to mergers where at least onepartner is a commercial bank, and thus include cases wherea foreign bank acquires a nonbank financial institution. Thedata cover only those banks reporting to Bankscope, whichincludes only locally incorporated foreign-owned banks, notthe branches of foreign banks.
21. To cushion domestic debtors from the currency de-valuation, the government originally sought to convert dol-lar debts under $100,000 into pesos, while pledging to re-fund dollar-denominated deposits in dollars. According toestimates, the cost of the currency mismatch for banks couldwell exceed their total equity—coming on top of losses dueto borrowers defaulting. Most of these losses are being in-curred by Spanish banks, which had gained a prominent po-sition in Argentina since the liberalization of the country’sbanking system in the early 1990s.
22. The index is calculated by: (a) assigning a numberto a qualitative judgment of the nature of World Trade Or-ganization commitments in three areas (cross-border supply,consumption abroad, and commercial presence); and (b)taking the average of these numbers (Qian 2000).
23. Among other control variables, overhead coststend to be passed on to customers, in the form of highermargins and fees. In terms of country characteristics, GDP
growth improves bank profitability, but also makes banksless conservative in their provisioning policies. Inflation isassociated with higher net interest margins, profitability,and overheads, consistent with the notion that high infla-tion requires higher bank margins and profitability to main-tain real bank capital, and that the cost of operating in thoseenvironments is also higher.
24. World Bank staff.25. Levine (1999)—building on earlier work by
Demirgüç-Kunt and Detragiache (1998) that controls forthe effects of other factors that are likely to produce bank-ing crises—has found that the probability that a crisis wouldoccur is lower in countries with a higher share of foreignbank participation. Moreover, Barth, Caprio, and Levine(2001a) have estimated that the likelihood of a major bank-ing crisis is higher in countries with greater limitations onforeign bank presence.
26. The Basel Committee on Banking Supervision(1996) has elaborated guidelines for supervision of cross-bor-der banking that make the solvency of foreign subsidiariesthe joint responsibility of home and host supervisory authori-ties (see also IMF 2000b). Under these guidelines, the homecountry supervisor is responsible for the consolidated super-vision of the bank on a global basis, while the host countriesare responsible for maintaining the liquidity of foreignbranches and subsidiaries, based on their better knowledge oflocal market conditions.
27. The problems involved with this and other ap-proaches to measuring capital outflows are discussed inannex 3.1.
28. This calculation underestimates the stock of resi-dents’ assets held abroad. The stock is calculated by cumu-lating over the 1980–99 period, which ignores the stock ofcapital outflows as of 1980 because of lack of data. The cal-culation also excludes interest earned on outflows heldabroad as well as any outflows through underinvoicing ofexports and overinvoicing of imports (see annex 3.1).
29. See Collier, Hoeffler, and Pattillo 2000; Cudding-ton 1986; Dornbusch 1985; Dooley 1988; Rojas-Suarez1990; Meyer and Bastos-Marquez 1990; Sheets 1996;Lessard and Williamson 1987.
30. If foreigners are exempt from exchange controls,then residents may have an incentive, for example, to placereceipts from trade flows abroad by under- or overinvoic-ing, and to then use a foreign front to invest these funds do-mestically. In this way the resident investor gains greatercontrol over the use of profits without forgoing domestic in-vestment opportunities.
31. Indonesia does not record a net outflow in 1998,but net inflows were strongly negative.
32. This is despite the fact that trade misinvoicing isnot included in these estimates of outflows (see annex 3.1).
33. The results from the panel-VAR exercise should betreated with some caution, as the data display considerablevolatility over time and also suffer from substantial cross-sectional variation. As a result, the results tend to be sensi-tive to the choice of time period or the presence of outliers.
34. See IMF 2001b. Examples of controls on currentaccount transactions include restrictions on the repatriationof capital and limits to the amount of foreign exchange thatcan be obtained for travel.
82

T H E P O O R C O U N T R I E S ’ I N T E R N A T I O N A L F I N A N C I A L T R A N S A C T I O N S
35. Beginning in 1996, the classification system used tocharacterize current and capital account restrictions waschanged, with the single “yes/no” variable replaced by amore disaggregated assessment that is not comparable tothe earlier measures.
36. Multiple exchange rates are typically used either toimpose different prices for current versus capital accounttransactions, or to discriminate among different types ofcurrent transactions.
37. For more information on this and other “alterna-tive remittance systems,” see Financial Action Task Force2000; and United Nations 1998.
38. Indeed, the presence of extensive dollarization of li-abilities has been advanced as a principal reason why somecountries that on paper have exchange rate flexibility appearnot to use that flexibility in practice (the “fear of floating” inthe language of Calvo and Reinhart 2000). Baliño, Bennett,and Borensztein (1999) review the additional complicationsof monetary management in dollarized economies.
39. In Tanzania, after controlling for the effects ofterms of trade, a 1 percent increase in net capital inflows isestimated to lead to an appreciation of 4 percent in theREER (Kimei and others 1997).
40. Should these assumptions be false, two equationsshould be estimated simultaneously—one explaining theentry decision, and the other explaining the impact of entryon contemporaneous local banking profits (Claessens andLee 2001).
41. For example, the proceeds from the sale of a com-pany to nonresidents may be deposited offshore by the resi-dent seller; or residents may indulge in round-tripping offlows, so that outflows are brought back as inflows.
42. The coefficient of the real exchange rate in the out-flows equation has a negative sign, implying that an appreci-ation of the currency reduces outflows with a lag. This resultis counter-intuitive, and may reflect the use of the official ex-change rate, rather than a market rate, to calculate the realexchange rate. Many of the countries in the sample had ex-change controls and substantial differences between marketand official rates, especially during the 1980s.
ReferencesThe word processed describes informally reproduced worksthat may not be commonly available through libraries.
Agosin, M. R., and Ricardo Mayer. 2000. “Foreign Invest-ment in Developing Countries: Does It Crowd in Do-mestic Investment?” Discussion Paper 146. United Na-tions Conference on Trade and Development, Geneva.
Aitken, Brian, Gordon H. Hanson, and Ann E. Harrison.1994. “Spillovers, Foreign Investment, and Export Be-havior.” Working Paper 4967. National Bureau ofEconomic Research, Cambridge, Mass.
Aizenman, Joshua, and Nancy Marion. 1995. “Volatility,Investment and Disappointment Aversion.” WorkingPaper 5386. National Bureau of Economic Research,Cambridge, Mass.
Ajayi, Ibi. 1997. “An Analysis of External Debt and CapitalFlight in the Severely Indebted Low Income Countries
of Sub-Saharan Africa.” Working Paper 97/68. Inter-national Monetary Fund, Washington, D.C.
———. 2000. “Capital Flight and External Debt in Nige-ria.” In S. Ibi Ajayi and Mohsin S. Khan, eds., ExternalDebt and Capital Flight in Sub-Saharan Africa. Wash-ington, D.C.: International Monetary Fund.
Albuquerque, Rui. 2001. “The Composition of Interna-tional Capital Flows: Risk-Sharing through Foreign Di-rect Investment.” University of Rochester. Processed.
Alesina, Alberto, and Roberto Perotti. 1996. “Income Dis-tribution, Political Instability, and Investment.” Euro-pean Economic Review 40(6): 1203–28.
Alesina, Alberto, and Guido Tabellini. 1989. “ExternalDebt, Capital Flight and Political Risk.” Journal of In-ternational Economics 27(3/4): 199–220.
Balasubramanyam, V. N., M. Salisu, and D. Sapsford. 1996.“Foreign Direct Investment and Growth in EP and ISCountries.” The Economic Journal, 106(434): 92–105.
Baliño, Tomás, Adam Bennett, and Eduardo Borensztein.1999. “Monetary Policy in Dollarized Economies.”Occasional Paper 171. International Monetary Fund,Washington, D.C.
Barro, Robert. 1991. “World Interest Rates and Invest-ment.” Working Paper Series (U.S.). No. 3849. Na-tional Bureau of Economic Research, Cambridge,Mass.
Barth, James, Gerard Caprio Jr., and Ross Levine. 2001a.“Banking System around the Globe: Do Regulationsand Ownership Affect Performance and Stability?” InFrederic S. Mishkin, ed. Prudential Supervision: WhatWorks and What Doesn’t. Chicago. University ofChicago.
———. 2001b. “Bank Regulation and Supervision: WhatWorks Best?” Policy Research Working Paper 2725,The World Bank, Washington, D.C. November.
Basel Committee on Banking Supervision. 1996. “Report onInternational Developments in Banking Supervision.”Report number 10. Basel.
Benhabib, Jess, and Mark M. Spiegel. 1994. “The Role ofHuman Capital in Economic Development: Evidencefrom Aggregate Cross-country Data.” Journal of Mon-etary Economics 34 (October): 143–73.
Bhagwati, J. N. 1978. Anatomy and Consequences of Ex-change Control Regimes. Vol. 1. Studies in Interna-tional Economic Relations, No. 11. Cambridge, Mass.:National Bureau of Economic Research.
Bhinda Nils, Stephany Griffith-Jones, and Matthew Martin.1999. “Perception and the Causes of Flows.” In NilsBhinda Leape, Matthew Martin, and Stephany Grif-fith-Jones, eds. Private Capital Flows to Africa: Per-ception and Reality. The Hague: Forum on Debt andDevelopment.
Blomström, Magnus, Robert E. Lipsey, and Mario Zejan.1994. “What Explains the Growth of DevelopingCountries?” In William J. Baumol, Richard R. Nelson,and Edward N. Wolff, eds. Convergence of Productiv-ity. New York: Oxford University Press.
Borensztein, Eduardo, José De Gregorio, and Jong-WhaLee. 1995. “How Does Foreign Direct Investment Af-fect Economic Growth?” Working Paper 5057. Na-tional Bureau of Economic Research, Cambridge,Mass.
83

G L O B A L D E V E L O P M E N T F I N A N C E
Bosworth Barry, and Susan Collins. 1999. “Capital Flows toDeveloping Economies: Implications for Saving and In-vestment.” Brookings Papers on Economic Activity.The Brookings Institute, Washington, D.C.
Brownbridge, M. 1998. “The Causes of Financial Distressin Local Banks in Africa and Implications for Pruden-tial Policy.” United Nations Conference on Trade andDevelopment. Development Discussion Papers (Inter-national). No. 132:1–24.
Brunetti, A., and B. Weder. 1998. “Investment and Institu-tional Uncertainty: A Comparative Study of DifferentUncertainty Measures.” Weltwirtschaftliches Archiv134(3): 513–33.
Bubnova, N. B. 2000. “Governance Impact on Private In-vestment: Evidence from the International Patterns ofInfrastructure Bond Risk Pricing.” Technical Paper488. World Bank, Washington, D.C.
Buch, Claudia, and Gayle Delong. 2001. “Cross-BorderBank Mergers: What Lures the Rare Animal?” BaruchCollege, New York. Processed.
Calvo, Guillermo, and Carmen Reinhart. 2000. “Fear ofFloating.” Working Paper Series (U.S.) 7993. NationalBureau of Economic Research, Cambridge, Mass.
Calvo G., L. Leiderman, and C. Reinhart. 1993. “CapitalInflows and Real Exchange Rate Appreciation in LatinAmerica: The Role of External Factors.” IMF Staff Pa-pers 40:108–51. Washington, D.C.
Chang, K. S. Claessens, and R. Cumby. 1997. “Conceptualand methodological issues in the measurement of capi-tal flight.” International Journal of Finance and Eco-nomics (U.K.) 2: 101–19.
Claessens, Stijn, and Jong Kun Lee. 2001. “Foreign Banks in Low-Income Countries: Recent Developments andImpacts.” University of Amsterdam, and World Bank,Washington, D.C.
Claessens, S., and D. Naudé. 1993. “Recent Estimates ofCapital Flight.” World Bank Policy Research WorkingPaper 1186. Washington, D.C.
Claessens, Stijn, Asli Demirgüç-Kunt and Harry Huizinga.1998. “How Does Foreign Entry Affect the DomesticBanking Market?” Policy Research Paper 1918. WorldBank, Washington, D.C.
Clark, A. and K. Naito. 1997. “Structural Reform of theMining Industry in Asia and the Pacific Region.” AsianJournal of Mining July/August: 28–42.
Clarke, George R., Robert Cull, and Maria Soledad Mar-tinez Peria. 2001. “Does Foreign Bank Penetration Re-duce Access to Credit in Developing Countries? Evi-dence from Asking Borrowers.” Policy ResearchWorking Paper 2716. World Bank, Washington, D.C.November.
Clements, B., and J. V. Levy. 1994. “Public Education andOther Determinants of Private Investment in theCaribbean.” Working Paper 94/122. InternationalMonetary Fund, Washington, D.C.
Cline, William R., ed. 1995. International Debt Reexam-ined. Washington, D.C.: Institute for InternationalEconomics.
Collier, Paul and Jan Willem Gunning. 1999. “Why HasAfrica Grown Slowly?” Journal of Economic Perspec-tives 13(3): 3–22.
Collier, Paul, Anke Hoeffler, and Catherine Pattillo. 2000.“Flight Capital as a Portfolio Choice.” World BankEconomic Review 15 (1): 55–80.
Coolidge, Jacqueline, Gregory Kisunko, and Aminur Rah-man. 2001. “Administrative Barriers to Investment inthe Russian Federation: Inter-Regional Comparisons.”Prepared for Economists’ Forum 2001. World Bank,Washington, D.C.
Corsetti, Giancarlo, Paolo Pesenti, and Nouriel Roubini.1998. “Fundamental Determinants of the Asian Crisis:A Preliminary Empirical Assessment.” Paper preparedfor the conference on Perspectives on the Financial Cri-sis in Asia, sponsored by Journal of InternationalMoney and Finance and Fordham University, NewYork.
Cuddington, John T. 1986. Capital Flight: Estimates, Issuesand Explanations.” Princeton Studies in InternationalFinance 58. Princeton University, Princeton, N.J.
Das-Gupta, Arindam, and Dilip Mookherjee. 1995. “TaxAmnesties in India: An Empirical Evaluation.” Discus-sion Paper 53. Boston University, Institute for Eco-nomic Development, Boston, Mass.
De Gregorio, José, Sebastian Edwards, and Rodrigo O.Valdes. 2000. “Controls on Capital Inflows: Do theyWork?” Working Paper 7645. National Bureau of Eco-nomic Research, Cambridge, Mass
de Mello, Luiz R. Jr. 1999. “Foreign Direct Investment–LedGrowth: Evidence From Time Series and Panel Data.”Oxford Economic Papers 51(1): 133–54.
Demirgüç-Kunt, A., and E. Detragiache. 1998. “The Deter-minants of Banking Crises in Developing and Devel-oped Countries.” IMF Staff Papers, 45 March: 81–109.Washington, D.C.
———. 2000. “Monitoring Banking Sector Fragility: AMultivariate Logit Approach.” World Bank EconomicReview14(2): 287–307.
Devarajan, S., W. R. Easterly, and H. Pack. 2001. “ Is In-vestment in Africa Too Low or Too High? Macro andMicro Evidence.” Policy Research Working Paper2519. World Bank, Washington, D.C.
Devarajan, S., Andrew Sunil Rajkumar, and Vinaya Swa-roop. 1999. “What Does Aid to Africa Finance?”World Bank Policy Research Working Paper 2092.Washington, D.C.
Dollar, David, Giuseppe Iarossi, and Taye Mengistae. 2001.“Investment Climate and Economic Performance: SomeFirm Level Evidence from India.” Prepared for Econo-mists’ Forum 2001. World Bank, Washington, D.C.
Dooley, M. 1986. “Country Specific Risk Premiums, Capi-tal Flight and Net Investment Income Payments in Se-lected Developing Countries.” International MonetaryFund, Research Department, Washington, D.C.
———. 1988. “Capital Flight: A Response to Differences inFinancial Risks.” IMF Staff Papers 35 (September):422–36. Washington, D.C.
Dornbusch, Rudiger. 1985. “External Debt, Budget deficitsand Disequilibrium Exchange Rates.” In Gordon W.Smith and John T. Cuddington, eds., InternationalDebt and the Developing Countries. Washington,D.C.: World Bank.
———. 2001. “Malaysia’s Crisis: Was it Different?” Pre-pared for conference on Preventing Currency Crises in
84
T H E P O O R C O U N T R I E S ’ I N T E R N A T I O N A L F I N A N C I A L T R A N S A C T I O N S
Emerging Markets, National Bureau of Economic Re-search, January 11–13. Forthcoming in Sebastian Ed-wards and Jeffrey Frankel, eds. Preventing CurrencyCrises in Emerging Markets. Chicago: University ofChicago Press.
Eaton. 1987. “Public Debt Guarantees and Private CapitalFlight.” Working Paper Series. (U.S.) 2172 (March):1–33. National Bureau of Economic Research, Cam-bridge, Mass.
Edwards, Sebastian. 1999. “How Effective Are CapitalControls?” Journal of Economic Perspectives 13(4):65–84.
Eggerstedt, H., R. Brideau Hall, and S. van Wijnbergen.1995. “Measuring Capital Flight: A Case Study ofMexico.” Policy Research Working Paper 1121. WorldBank, Washington, D.C.
Eichengreen, Barry, Michael Mussa, Giovanni Dell’Ariccia,Enrica Detragiache, Gian Maria Milesi-Ferrettir, andAndrew Tweeedie. 1999. “Liberalizing Capital Move-ments: Some Analytical Issues.” Economic Issues 17.International Monetary Fund, Washington, D.C.
Feldstein, Martin, and Charles Horioka. 1980. “DomesticSavings and International Capital Flows.” WorkingPaper 0310 (NBER Reprints 0085). National Bureauof Economic Research, Cambridge, Mass.
Financial Action Task Force on Money Laundering. 2000.“Report on Money Laundering Typologies, 1999–2000.” (Available at www.oecd.org/fatf).
Fleisig, Heywood. 1996. “Secured Transactions: the Powerof Collateral.” Finance and Development 33 (June).International Monetary Fund, Washington, D.C.
Fry, Maxwell J. 1992. “Foreign Direct Investment in aMacroeconomic Framework: Finance, Efficiency, In-centives and Distortions.” PRE Working Paper. WorldBank, Washington, D.C.
Goldstein, M., G. Kaminsky, C. Reinhart. 2000. AssessingFinancial Vulnerability: An Early Warning System forEmerging Market. Washington, D.C.: Institute for In-ternational Economics.
Gordon, David, and Ross Levine. 1988. “The Capital FlightProblem.” International Finance Discussion Paper320. U.S. Federal Reserve Board, Washington, D.C.
Goreux, Louis. 2001. “Conflict Diamonds.” Africa RegionWorking Paper 13. World Bank, Washington, D.C.
Gyimah-Brempong, K., and S. Muñoz de Camacho. 1998.“Political Instability, Human Capital and EconomicGrowth in Latin America.” Journal of DevelopingAreas 32(4): 449–65.
Gyimah-Brempong, K., and T. L. Traynor. 1999. “PoliticalInstability, Investment and Economic Growth in Sub-Saharan Africa.” Journal of African Economies 8 (1):52–86.
Harrison, Ann. 1993. “Are there Positive Spillovers fromForeign Direct Investment? Evidence from Panel Datafor Morocco.” Journal of Development Economics.(Netherlands) 42 (October): 51–74.
———. 1994. “Productivity, Imperfect Competition, andTrade Reform: Theory and Evidence.” Journal of In-ternational Economics 36: 53–73.
Hausmann, R., and M. Gavin. 1996. “Securing Stabilityand Growth in a Shock-Prone Region: The PolicyChallenge for Latin America.” In R. Hausmann and
H. Reisen, eds., Securing Stability and Growth in LatinAmerica: Policy Issues and Prospects. Paris: Organisa-tion for Economic Co-operation and Development.
Hayri, Aydin, and Mark Dutz. 1999. “Does More IntenseCompetition Lead to Higher Growth?” Discussionpaper 2249. Centre for Economic Policy Research,London.
Hellmann, Thomas F., Kevin C. Murdock, and Joseph E.Stiglitz. 2000. “Liberalization, Moral Hazard in Bank-ing, and Prudential Regulation: Are Capital Require-ments Enough?” American Economic Review 90(1):147–65.
Hoekman, Bernard, Hiau Looi Kee, and Marcelo Olar-reaga. 2001. ”Markups, Entry Regulation and Trade:Does Country Size Matter?” World Bank. Washington,D.C. Processed.
Hood, Ron. 2001. “Malaysian Capital Controls.” PolicyResearch Working Paper 2536. World Bank, Washing-ton, D.C.
IMF (International Monetary Fund). 2000a. “Country Ex-periences with the Use and Liberalization of CapitalControls.” Washington, D.C.
———. 2000b. The Role of Foreign Banks in Emerging Mar-kets.” In International Capital Markets: Development,Prospects, and Key Policy Issues. Washington, D.C.
———. 2001a. “West African Economic and MonetaryUnion: Recent Economic Developments and RegionalPolicy Issues in 2000.” IMF Country Report. Washing-ton, D.C.
———. 2001b. “Annual Report on Exchange Arrange-ments and Exchange Restrictions.” Washington, D.C.
Ize, Alain, and Guillermo Ortiz. 1987. “Fiscal Rigidities,Public Debt and Capital Flight.” IMF Staff Papers 34(June): 311–32.
Jenkins, Carolyn. 1998. “Determinants of private invest-ment in Zimbabwe.” Journal of African Economies 7(March):34–61.
Johnson, C. 1990. “Ranking countries for mineral explo-ration.” Natural Resources Forum 14 (3): 178–86.
Kaplan, Ethan, and Dani Rodrik. 2001. “Did the MalaysianCapital Controls Work?” Prepared for conference onPreventing Currency Crises in Emerging Markets, Na-tional Bureau of Economic Research, January 11–13.Forthcoming in Sebastian Edwards and JeffreyFrankel, eds. Preventing Currency Crises in EmergingMarkets. Chicago: University of Chicago Press.
Kasekende, Louis A. 2000. “Capital Account Liberaliza-tion: The Ugandan Experience.” Paper presented at theOverseas Development Institute, London, June 21.
Kathuria, V. 1998. “Technology Transfer and Spillovers forIndian Manufacturing Firms.” Development PolicyReview 16 (1): 73–91.
Ketkar, Suihas, and Dilip Ratha. 2000. “Development Fi-nancing During a Crisis: Securitization of Future Re-ceivables.” Policy Research Working Paper 2582.World Bank, Washington, D.C.
Khan, Mohsin, and Nadeem Ul-Haque. 1985. “ForeignBorrowing and Capital Flight: A Formal Analysis.” Fi-nance and Development 32(4): 606–28.
Kimei, C., G. D. Mjerna, B. Tarimo, and A. Msutze (withM. Martin and N. Bhinda). 1997. “Tanzania: CapitalFlows Study.” Paper presented to EFA workshop on
85

G L O B A L D E V E L O P M E N T F I N A N C E
Private Capital Flows and Macroeconomic Policy inSub-Saharan Africa, Cape Town, July 1997.
Knack, S., and P. Keefer. 1995. “Institutions and EconomicPerformance: Cross-Country Tests Using AlternativeInstitutional Measures.” Economics and Politics 7(November): 207–27.
Kokko, A. 1994. “Technology, Market Characteristics, andSpillovers.” Journal of Development Economics 43(2): 279–93.
Kokko, A., Ruben Tansini, and Mario C. Zejan. 1996. “LocalTechnological Capability and Productivity Spilloversfrom FDI in the Uruguayan Manufacturing Sector.”Journal of Development Studies 32 (4): 602–11.
Krugman, Paul. 1998. What Happened to Asia? (availableat http://web.mit.edu/krugman/www/disinter.html).
Kumar, Nagesh, and Jaya Prakash Pradhan. 2001. “ForeignDirect Investment, Externalities and Economic Growth:Some Empirical Explorations for the Poor Countries.”A background paper for GDF 2002. World Bank,Washington, D.C.
Laban, Raul, and Felipe Larrain. 1997. “Can a Liberalizationof Capital Outflows Increase Net Capital Inflows?” Jour-nal of International Money and Finance 16(3): 415–31.
Lessard, Donald, and John Williamson. 1987. Capital Flightand Third World Debt. Washington, D.C.: Institute forInternational Economics.
Levine, Ross. 1996. “Foreign Banks, Financial Developmentand Economic Growth.” In Claude E. Barfield, ed. In-ternational Financial Markets: Harmonization versusCompetition. Washington, D.C.: AEI Press.
———. 1999. “Foreign Bank Entry and Capital ControlLiberalization: Effects on Growth and Stability.” Uni-versity of Minnesota. Processed.
Levinsohn, James. 1993. “Testing the Imports-as-Market-Discipline Hypothesis.” Journal of International Eco-nomics 35(1/2): 1–22.
Loungani, Prakash, and Paolo Mauro. 2000. “CapitalFlight from Russia.” IMF Policy Discussion Paper00/6. International Monetary Fund, Washington, D.C.
Mankiw, N. Gregory, David Romer, and David N. Weil. 1992.“A Contribution to the Empirics of Economic Growth.”Quarterly Journal of Economics 107(2): 407–37
Marksun, J. R., and Anthony J. Venables. 1997. “ForeignDirect Investment as a Catalyst For Industrial Devel-opment.” Working Paper 624. National Bureau ofEconomic Research, Cambridge, Mass.
Mathieson, Donald J., and Liliana Rojas-Suarez. 1993.“Liberalization of the Capital Account: Experiencesand Issues.” Occasional Paper 103. InternationalMonetary Fund, Washington D.C.
Mathieson, Donald J., and Jorge Roldos. 2001. “The Roleof Foreign Banks in Emerging Markets.” Paper pre-pared for the IMF–World Bank–Brookings Institutionconference on Financial Markets and Development,Washington, D.C.
Mauro, P. 1995. “Corruption and Growth.” QuarterlyJournal of Economics 110(April): 681–712.
Mexico Federal Commission on Competition. 1997. AnnualEconomic Competition Report. Mexico City.
Meyer and Bastos-Marquez. 1990. “A fuga de capital noBrasil: 1975/88.” Pesquisa e Planejamento Economico(Brazil) 0:49–85.
Mian, S., and C. Smith. 1994. “Getting Help with CreditAdministration.” Corporate Finance 11.
Mody, Ashoka, and Antu Panini Murshid. 2001. “Growingup with Capital Flows.” International Monetary Fund,Washington, D.C. Processed.
Morgan Guaranty Trust Company. 1986. “LDC CapitalFlight.” World Financial Markets. March, 13–15.
Naito, Koh, Felix Remy, and Peter van der Veen. 2001.“Mining Sector Reform and FDI.” World Bank, Wash-ington, D.C. Processed.
Naito, K., Felix Remy, and J. P. Williams. 2001. “A Com-parative Review of Legal and Fiscal Frameworks forExploration and Mining: Best Practices.” Mining Jour-nal Limited, p. 177.
Naito, K., H. Myoi, J. Otto, D. Smith, and M. Kamitani,1998. “Mineral Projects in Asian Countries: Geology,Regulations, Fiscal Regimes and the Environment.”Resources Policy 24 (2): 87–93.
Ndikumana, L. 2000. “Financial Determinants of DomesticInvestment in Sub-Saharan Africa: Evidence from PanelData.” World Development 28 (2): 381–400.
Ng’eno, N.K. 2000. “Capital Flight in Kenya.” In S. IbiAjayi and Mohsin S. Khan, eds., External Debt andCapial Flight in Sub-Saharan Africa. Washington,D.C.: International Monetary Fund.
Ngugi, R. 2000. “Financial Reform Process in Kenya.”African Development Review12(1): 52–77. AfricanDevelopment Bank (International).
OECD (Organisation for Economic Co-operation and De-velopment). 2001. Cited in figure 4.1.
Olopoenia, Razaq A. 2000. “Capital Flight from Uganda.”in Ajoyi and Kahn, eds. External Debt and CapitalFlight in Sub-Saharan Africa. Washington, D.C.: Inter-national Monetary Fund.
Oshikoya, T. 1994. “Macroeconomic Determinants of Do-mestic Private Investment in Africa: An EmpiricalAnalysis.” Economic Development and CulturalChange 42(3): 573–96.
Otto, J. 1992. “A Global Survey of Mineral Company In-vestment Preferences.” In J. Otto and T. Waelde, eds.,Mineral Investment Conditions in Selected Countriesof the Asia-Pacific Region. Publication ST/ESCAP/1197. New York: United Nations.
———. 1995. “Legal Risk Analysis for Mining Projects.”Mineral Industry International No. 1025. Institute forMining and Metallurgy, London.
Oxford Analytica. 2001. “Africa: Regional Stock Markets.”September 4.
Ozawa, Terutomo. 1992. “Foreign Direct Investment andEconomic Development.” Transnational Corporations1(1): 27–54.
Petersen, M. A., and R. G. Rajan. 1994. “The Benefits ofLending Relationships: Evidence from Small BusinessData.” Journal of Monetary Economics (1): 3–38.
———. 1997. “Trade Credit: Theories and Evidence.” Re-view of Financial Studies. U.S. (10): 661–91.
Pfeffermann, G., and G. Kisunko. 1999. “Perceived Obstaclesto Doing Business: Worldwide Survey Results.” Interna-tional Finance Corporation, Washington, D.C. Processed.
———. 2001. “The Foreign Direct Investment Environmentin Africa.” Africa Region Working Paper 15. WorldBank, Washington, D.C.
86

T H E P O O R C O U N T R I E S ’ I N T E R N A T I O N A L F I N A N C I A L T R A N S A C T I O N S
Porter, M. E. 1990. The Competitive Advantage of Nations.New York: Free Press.
Qian, Ying. 2000. “The Process of China’s Market Transi-tion, 1978–1998: The Evolutionary, Historical, andComparative Perspectives.” Journal of Institutional andTheoretical Economics (Germany). 156(1): 151–79.
Razin, Asaf, Efraim Sadka, and Chi-Wa Yuen. 1997.“Channeling Domestic Savings into Productive Invest-ment under Asymmetric Information: the EssentialRole of Foreign Direct Investment.” Working Paper6338. National Bureau of Economic Research, Cam-bridge, Mass.
Reinikka, R., and J. Sevensson. 1999. “How InadequateProvision of Public Infrastructure and Services AffectsPrivate Investment.” Policy Research Working Papers2262, World Bank, Washington, D.C.
Rojas-Suarez, Liliana. 1990. “Risk and Capital Flight in De-veloping Countries.” Working Paper 90/64. Interna-tional Monetary Fund, Washington, D.C.
Sakr, K.1993. “Determinants of Private Investment in Pak-istan.” Working Paper 93/30. International MonetaryFund, Washington, D.C.
Schadler, S., M. Carkovic, A. Bennett, and R. Kahn. 1993.“Recent Experiences with Surges in Capital Inflows.”Occasional Paper 108. International Monetary Fund,Washington, D.C.
Schineller, Lisa M. 1997. An Econometric Model of CapitalFlight from Developing Countries. International Fi-nance Discussion Paper 579. U.S. Federal ReserveBoard, Washington, D.C.
———. 1999. A Nonlinear Econometric Analysis of CapitalFlight.” International Finance Discussion Paper 594.U.S. Federal Reserve Board, Washington, D.C.
Servén, L. 1996. “Does Public Capital Crowd out PrivateCapital?: Evidence from India.” Policy ResearchWorking Papers 1613. World Bank, Washington, D.C.
———. 1998. “Macroeconomic Uncertainty and Private In-vestment in Developing Countries: An Empirical Inves-tigation.” Policy Research Working Papers 2035.World Bank, Washington, D.C.
Servén, L., and A. Solimano. 1993. “Debt Crises, Adjust-ment Policies and Capital Formation in DevelopingCountries: Where Do We Stand?” World Development21: 127–40.
Sheets, Nathan. 1996. “Capital Flight from the Countries inTransition: Some Theory and Empirical Evidence.” In-ternational Finance Discussion Paper 514. U.S. FederalReserve Board, Washington, D.C.
Sievers, Sarah E. 2001. “Competitiveness and Foreign Di-rect Investment in Africa.” In Augustin Kwasi Fosu,Saleh M. Nsouli, and Aristomene Varoudakis, eds.,Policies to Promote Competitiveness in Manufacturingin Sub-Saharan Africa. Organisation for Economic Co-operation and Development.
Smith, D., and K. Naito. 1998. “Asian Mining Legislation:Policy Issues and Recent Developments.” ResourcesPolicy 24: 125–32.
Sorsa, Piritta. 1997. “The GATS Agreement on FinancialServices: A Modest Start to Multilateral Liberaliza-tion.” Working Paper 97/55. International MonetaryFund, Washington, D.C.
Stiglitz, Joseph E., and Andrew Weiss. 1981. “Credit Ra-tioning in Markets with Imperfect Information.”American Economic Review 71: 393–410.
Stryker, Dirck. 1997. “Dollarization and its Implications forGhana.” Associates for International Resources andDevelopment, Cambridge, Mass.
Thomas, R. H. 1994. “Trading and Investing in Tanzania: TheLegal Framework.” Development South Africa 11(3).
Tornell, Aaron, and Andres Velasco. 1992. “The Tragedy ofthe Commons and Economic Growth: Why Does Cap-ital Flow from Poor to Rich Countries?” Journal ofPolitical Economy 100(6): 1208–31.
Trester, Jeffrey. 1998. “Venture Capital Contracting underAsymmetric Information.” Journal of Banking and Fi-nance 22 (August): 675–99.
Tybout, James. 2000. “Manufacturing Firms in DevelopingCountries: How Well Do They Do, and Why?” Journalof Economic Literature 38(1): 11–44.
United Nations. 1998. U.N. General Assembly Special Sessionon the World Drug Problem. 8–10 June. www.un.org
UNCTAD (United Nations Conference on Trade and Devel-opment). 1999a. “Foreign Direct Investment in Africa:Performance and Potential.” Geneva.
———. 1999b. World Investment Report. Geneva.———. 2001a. “Foreign Direct Investment in Least Devel-
oped Countries at a Glance.” Geneva.———. 2001b. World Investment Report 2001. Cited fig-
ure 2.4.Varman-Schneider, Benu. 1991. Capital Flight from Devel-
oping Countries. Boulder: Westview Press.World Bank. 1985. World Development Report: Interna-
tional Capital and Economic Development. New York:Oxford University Press.
———. 1992. “Strategy for African Mining.” TechnicalPaper 181. World Bank, Washington, D.C.
———. 1996. “A Mining Strategy for Latin America andthe Caribbean.” Technical Paper 345. World Bank,Washington, D.C.
———. 1999a. Global Economic Prospects. Washington,D.C.
________. 1999b. Global Development Finance 1999.Washington, D.C.
________. 2001a. Global Development Finance 2001.Washington, D.C.
________. 2001b. “Finance for Growth: Policy Choices in aVolatile World.” Washington, D.C.
________. 2001d. World Development Indicators 2001.Washington, D.C.
World Economic Forum. 1998. “The Africa Competitive-ness Report 1998.” Geneva.
Yun, Mikyung. 2000. “Cross-Border M&As and their Im-pact on the Korean Economy.” Paper presented at theUNCTAD Seminar on Cross-border M&As and Sus-tained Competitiveness in Asia: Trends, Impacts andPolicy Implications, Bangkok, March 9–10. Processed.
Zemplinerova, A., and M. Jarolim. 2000. “FDI throughM&A vs. Greenfield FDI: The Case of the Czech Re-public.” Paper presented at the UNCTAD and OeNBSeminar on FDI and Privatization in Central and East-ern Europe, Vienna, March 2–3. Processed.
87


4Strengthening Official Financial Support for Developing Countries
Mixed results from aid have led to afall in aid
Slow progress in poverty reduction during the1990s outside Asia increased concerns about the
effectiveness of aid.1 Many countries have achievedimpressive growth rates with the support of aidflows, and since 1990 the share of people living in extreme poverty in developing countries hasdropped from 29 percent to 23 percent, led by rapidprogress in China and India. Nevertheless, growthhas been slow in many of the poorest aid recipients(see chapter 3), and in Sub-Saharan Africa the shareof the population living on less than a dollar a daystagnated during the 1990s, contributing to a grow-ing perception that aid flows have failed to supportdevelopment. This perception, in conjunction withfiscal pressures in donor countries and the declin-ing strategic value of aid (from the perspective ofdonors) with the end of the Cold War, led to a sharpfall in aid over the 1990s.
Mixed progress in poverty reduction also ledto a reevaluation of aid policies, and to a growingconsensus on donor policies required to increaseaid effectiveness. Perhaps most importantly, theallocation of aid is increasing to those countrieswith good policies. Despite high levels of aid, mostcountries with good policies can continue to ab-sorb additional aid resources without seriously im-pairing the effectiveness of that aid. High aid levelsto countries with good policies should not raisefears of excessive dependence. Over time, stronggrowth should generate the increase in tax rev-enues required for a decline in aid. Aid does not, ingeneral, increase the volatility of government re-sources, and appropriate policies can ensure thataid does not contribute to inflationary pressures or cause excessive exchange rate appreciation. It is
89
.
true that even in many countries with good poli-cies, lack of administrative capacity lowers themarginal productivity of aid as aid levels rise.However, recent research indicates that aid levels tomost countries with strong economic programs arewell below the threshold where aid becomes in-effective. This analysis supports the view that adoubling of aid could make an effective contribu-tion toward reaching the Millennium DevelopmentGoals, provided that the aid is allocated wisely.
Donors also have made progress in improvingthe design and administration of aid programs, al-though much more remains to be done. Greaterefforts are directed at ensuring that policy condi-tions in adjustment assistance reflect a programthat has the full support of the government andother domestic stakeholders. This new emphasisinvolves greater selectivity in aid disbursements.The administrative burden of aid is less becausethe share of tied aid is reduced, and the govern-ment is assuming more leadership in promotingaid coordination.
The policy framework
Providing a policy environment conducive togrowth and development—The growing consensus on how to improve donorpolicies has its roots in the mixed success of effortsto help developing countries recover from the fail-ure of many economic policies of the 1970s and1980s. Growth in many developing countries wasdepressed by unsustainable macroeconomic poli-cies, financial repression, high trade barriers, perva-sive state interventions in competitive markets, andcomplex administrative constraints on entrepre-

G L O B A L D E V E L O P M E N T F I N A N C E
neurial activity. Donor programs during the late1980s and throughout the 1990s thus increasinglyfocused on supporting efforts at providing an eco-nomic policy environment conducive to growth anddevelopment. Improvements in economic policiesduring the 1990s did help many developing coun-tries to achieve substantial increases in growth ratesover the “lost decade” of the 1980s. However, manyof the poorest countries continued to be left behind,and it became clear that weak institutions and poorgovernance were at least as significant constraintson development as inflation and price controls.
—with a reform of donor policies—At the same time, some instruments that donorsused to support developing countries’ economicprograms proved inadequate. Compliance withconditionality under adjustment lending was mixed.Official lending and guarantees coupled with poorpolicies contributed to debt burdens. Aid programsincreased the administrative burden in many coun-tries where capacity was a principal constraint ongrowth. Recognition of these problems catalyzedefforts to strengthen the framework for adjustmentassistance, provide debt relief, and reduce the ad-ministrative burden of aid by improving donorcoordination. These efforts do not represent anentirely new departure: aid coordination, capacityconstraints, and adjustment assistance have been afocus of analysis for some time. Nevertheless, in thepast few years concerted efforts have been made toadjust donor policies in the context of recent expe-rience. At the Bretton Woods institutions, this shiftin assistance to low-income countries is being im-plemented through the Poverty Reduction StrategyPaper (PRSP) approach (see box 4.1).
—to increase the effectiveness of aidThese two debates over development policy—that adeepening of reform programs must address criticalinstitutional and governance issues that constraingrowth, and that donor policies must support coun-try ownership, reduce the administrative demandsof aid programs, and focus on development re-sults—are intricately related. A greater focus on de-velopment outcomes may be useful in determiningthe overall allocation of funds by donors and as abasis for monitoring and evaluation of reform pro-grams. The recognition that institutional capacity isa major constraint on growth underlines the impor-tance of easing the administrative burden of aid.
Recognition of the failure of aid to boost growth in many heavily indebted poor countries (HIPCs)—increases the legitimacy of focusing resources ondebt relief. Ultimately, improved policies in develop-ing countries and a more effective approach to aidshould strengthen donor support for increasing aidresources. These messages underscore the importantthemes emerging from the United Nations (U.N.)’sFinancing for Development (FfD) process (see box4.2). Unfortunately, recent aid trends have been dis-appointing, and there appears to be little likelihoodthat a rise in aid will be significant and sustained.
Trends in aid
A widening gap between the availability ofaid and the needs of recipients—Aid flows dropped sharply over the last decade inreal terms, and by 2000 stood more than 10 per-cent below the 1990 level. Expressed as a share of donors’ gross national product (GNP), aid fellfrom 0.33 percent in 1990 to 0.22 percent in 2000.Only five donor countries reached (or surpassed)the U.N.’s target of 0.7 percent of GNP which wasendorsed by Group of Seven (G-7) countries at the Earth Summit in Rio in 1992. At the same time,the need for aid continues to grow. Developingcountries’ population rose by 17 percent during the1990s, and the number of people (outside China)living on less than $1 a day has remained roughlythe same. Some 60 million people in developingcountries are infected with the human immunode-ficiency virus. The Millennium Development Goalscannot be met without increased aid. For example,preliminary calculations indicate that a doubling ofaid, appropriately allocated, will be necessary tohalve poverty by 2015. Estimates of the aid (abovecurrent levels) required to meet the goals for edu-cation, health, and the environment (see box 4.2)range from $35 billion to $76 billion.2 Vigoroussteps to increase the availability of aid resources, inconjunction with improved donor policies to sup-port increased aid effectiveness, should be the toppriorities for the international community.
—particularly over the last two years—After a modest recovery in aid flows beginning in1998, the past two years have seen a further de-cline. Concessional aid flows are measured in two
90

S T R E N G T H E N I N G O F F I C I A L F I N A N C I A L S U P P O R T F O R D E V E L O P I N G C O U N T R I E S
ways: aid recorded as received by developing coun-tries and aid recorded as provided by donor coun-tries. The two measures are different because in anygiven year the concessional funding provided bydonors to multilateral institutions is not the same as those institutions’ disbursements to developing
countries (see the data annex at the end of thischapter). Aid flows received by developing coun-tries (excluding technical cooperation grants) fell by3.8 percent in 2000 to $40.7 billion and they are es-timated to have declined by a further 3.4 percent in2001 (see table 4.1). Much of this decline was due
91
In December 1999 the Boards of the InternationalMonetary Fund (IMF) and the World Bank approved a
new approach to the challenge of reducing poverty in low-income countries based on country-owned poverty reduc-tion strategies that would serve as a framework for devel-opment assistance. Much has been accomplished duringthe past two years—nine countries have completed theirfirst full PRSP and three countries have completed theirfirst annual PRSP implementation progress reports. Some41 countries have also completed their interim poverty re-duction strategies (I-PRSPs) and eight countries have sub-sequently submitted their PRSP preparation status reportsfor consideration by the Boards.3
The central message of the forthcoming Review of the PRSP Approach4 is a substantial affirmation by low-income countries as well as development partners and civilsociety organizations of the value of the PRSP approach,and the importance of country ownership as a guidingprinciple, and a corresponding recognition of the need forflexibility to allow for different country starting points.
It is widely recognized that aligning donor programswith the PRSP is crucial to sustaining this approach. Inpart the PRSP approach has been designed to overcomelong-standing problems of poor donor coordination, weakcountry ownership of donor-financed programs, and thefragmentation of governmental programs and institutionscaused by multiple, and often inconsistent, donor interven-tions. Donor alignment is needed at various levels, bothsubstantive (in ensuring that donors respect country prior-ities) and in terms of processes (to reduce the transactioncosts associated with aid).
Key challenges of the PRSP for development partnersinclude:
• Pursuing new approaches to support governmentownership. Governments prepare their own povertyreduction strategies through a participatory processdesigned to build broad ownership at the nationallevel. Medium-term reform programs supported byPoverty Reduction Support Credits (PRSCs) will beprincipally drawn from, or will elaborate on, policymeasures contained in the PRSPs.5
• More coherent partnerships and aid coordination.PRSPs are intended to be instruments by which gov-ernments can achieve better aid coordination. It isgood practice for the PRSP process to be inclusive ofdonors, and most countries are in fact doing this, in-cluding, for example, through the representation ofdonors on PRSP working groups.
• Harmonizing and simplifying donor procedures, along-side a greater focus on development results as opposedto monitoring and efforts to control inputs. Each PRSPis expected to include intermediate and longer-termindicators on poverty outcomes, to enable regular mon-itoring of progress, upon which governments wouldannually report. It is hoped that this will encouragegovernments and their external partners to focus on the same set of targets and indicators over a sufficientlylong period, so as to reduce the costs associated withmultiple reporting requirements, during which time itwould be possible to measure results and to adjust do-mestic strategies and external assistance accordingly.
In the longer term it is expected that the PRSP willfacilitate greater aid allocations to countries with goodpolicy environments. To the extent that PRSPs reveal whata country is truly prepared to do (in terms of policy andinstitutional reforms and expenditure allocations), theyshould provide a reliable indicator for donors to allocatefunds on the basis of policies. Over time a country’s perfor-mance with respect to its PRSP objectives (both policymeasures and development results) could help improvedonors’ judgments concerning the allocation of aid.
As reported in the upcoming Review, early evidenceabout the PRSP process is positive, and substantial invest-ments are being made by low-income countries and devel-opment partners in making this approach work. While thequality of the early full PRSPs has varied (for example, interms of participation, data collection, the realism of long-term goals, and institutional capacity to monitor expendi-tures and the link to poverty reduction), the process hashelped promote ownership, encouraged a better dialoguewithin countries, broadened the understanding of develop-ment issues, and helped improve donor coordination.
Box 4.1 The PRSPs
G L O B A L D E V E L O P M E N T F I N A N C E
92
The analysis presented in this document supports theagenda of the FfD conference that will take place in
March 2002, in Monterrey, Mexico. The FfD process em-phasizes the importance of a comprehensive approach tothe mobilization of resources for development and of theflexibility and partnerships required to ensure that theneeds and opportunities of different countries are takeninto account in the support provided by the internationalcommunity. The purpose of FfD is to assure the means toreduce poverty and reach the Millennium DevelopmentGoals as well as other internationally agreed-on develop-ment targets.
The FfD agenda recognizes that the means of reachingthese goals must be defined broadly. Policy reforms in de-veloping countries are required to boost growth and re-duce poverty. At the same time, industrial countries needto open their markets to provide sufficient opportunitiesfor developing countries to benefit from the world tradingsystem, to help shape improvements in the internationalfinancial architecture, and to boost the aid resources re-quired to help countries meet the development goals. Themain messages of Global Development Finance 2002 canbe viewed under this paradigm:
• Policies. The discussion of country policies at the FfDconference will focus on improving the investment cli-mate in developing countries. In particular, policiesfocused on maintaining macroeconomic stability, in-creasing openness to trade and foreign direct invest-ment (FDI), improving governance, and strengtheningfinancial sector institutions will help developing coun-tries benefit from greater financial integration whilereducing the potential costs. This document showshow a strong investment climate in the poor countriescan boost the effectiveness of aid, increase domesticinvestment by limiting capital outflows and attractingmore FDI inflows, and improve the productivity ofinvestment. At the same time, this document outlinesongoing improvements in donor policies to strengthenadministration of aid programs, increase the effective-ness of policy conditionality as a means of enhancinggovernment credibility and commitment, ensure thatdebt relief is directed at countries with good policies,and ensure that guaranteed lending does not con-tribute to unsustainable debt burdens.
• Opportunity. All countries need to cooperate inintegrating the developing countries into the worldtrading system. Industrial countries must cooperatethrough opening their markets (particularly in agri-culture and textiles) and providing resources for
capacity building; developing countries must cooper-ate through strengthening their infrastructure to sup-port trade and lowering their own trade barriers. Thelaunch of a “development round” following the Dohameeting of the World Trade Organization will involvenegotiations of market access issues covering agricul-ture, services, and manufactures, as well as rules gov-erning dispute settlement, disciplines on regional inte-gration, environment, and trade-related intellectualproperty rights. In addition, negotiations may alsotake place regarding investment, competition, tradefacilitation, and transparency in government procure-ment. This approach should enable progress to bemade in improving market access for developingcountries (assuming they are willing to negotiate onthe basis of reducing their own barriers to trade),which is the main priority for the trade agenda.
• Resources. Poor countries with good policies will needincreased assistance to meet the development goalsarticulated in the U.N.-sponsored Millennium Decla-ration. These goals include halving extreme poverty,achieving universal primary education, eliminatinggender disparity in education, reducing infant andchild mortality and maternal mortality, ensuring ac-cess to reproductive health services, and implementinga national strategy for sustainable development inevery country. Progress since 1990 has been too slowto achieve most of the goals, and a stepped-up effortby developing countries, industrial countries, and mul-tilateral institutions is required to have any chance ofmeeting them.6 This effort should include a doublingof aid to achieve the poverty goal, provided that theseresources are allocated to countries with good policies(where aid will be most effective) and with many poorpeople. Some of the funding needs required to meetthe health and education goals are the same as thoserequired to halve poverty, but some will require dedi-cated funding, such as the need to address communi-cable diseases or to promote “Education for All.” Aportion of these resources should be used to financeglobal public goods, such as the creation of new vac-cines, and thus would not be channeled through indi-vidual developing-country governments.
In countries with poor policies, even very largeamounts of aid are likely to achieve only a limited andshort-lived impact on poverty. There is, therefore, an in-evitable tension between allocating aid to achieve the max-imum global progress toward the goals and allocating aidso that each country or region has a chance of meeting
Box 4.2 The Financing for Development (FfD) process

S T R E N G T H E N I N G O F F I C I A L F I N A N C I A L S U P P O R T F O R D E V E L O P I N G C O U N T R I E S
to a drop in Japanese aid to East Asia, because dis-bursements against the large commitments made atthe time of the Asian crisis fell. Preliminary esti-mates suggest a continued increase in aid to EasternEurope and Central Asia, both due to stepped-upassistance to the Balkans and support for the effortsof the advanced Eastern European countries to jointhe European Union (EU). Aid flows have declinedto Sub-Saharan Africa due to delays in implementa-tion of reform in some countries; aid flows have de-clined to a lesser extent to South Asia despite a risein humanitarian assistance to India following thedevastating earthquake in 2001.
The amount of official development assistance(ODA) provided by donors fell by 1.6 percent inreal terms in 2000 to $53.1 billion, or 0.22 per-cent of Development Assistance Committee (DAC)members’ GNP (data on aid flows from donors for2001 are not yet available). This decline, which re-versed the upward trend that commenced in 1998,was due to two special factors: the above-noted
fall in aid from Japan, and the removal of coun-tries from the list of those eligible to receive ODAbecause their per capita incomes now exceed thecutoff for flows to be counted as aid.8 Adjustingfor the change in the DAC list, ODA fell by 0.2percent in real terms in 2000. The decline was dueto the fact that in the G-7 countries aid fell by 4.8percent in real terms; aid from non–G-7 countriesincreased by 8.3 percent in real terms.
—and little sign of a reversal of this trend inthe medium term—The prospects for a rise in aid over the mediumterm are mixed. Several donors, in particular theUnited Kingdom and several of the non–G-7 coun-tries, have been able to set and meet medium-termtargets for substantial increases in aid flows. How-ever, there is little sign of substantial increases inaid from the four largest donors—France, Ger-many, Japan, and the United States—which to-gether account for almost two-thirds of all aid. In
93
those goals. To resolve this issue, priority attention shouldbe focused on improving policies in countries where theyare weak.
Finally, the international community faces a dilemmain supporting progress toward the goals in middle-incomecountries with poor regions. It may not be advisable toprovide large amounts of aid to countries that have sub-stantial financial resources but have not made progress inalleviating poverty in some regions. Since money is fungi-
ble, aid would in fact be financing the marginal expendi-ture by middle-income governments, which may be lessproductive in terms of reducing poverty than expendituresin very poor countries with good policies. Nevertheless, it is important for donors to consider how to address thesevere poverty issues in some middle-income countries; one recommendation would be to fund relatively smallprojects aimed at demonstrating effective approaches tospecific problems.7
Box 4.2 (continued)
Table 4.1 Net official aid to developing countries, by type and source, 1990–2001(billions of dollars)
Aid 1990 1991 1992 1993 1994 1995 1996 1997 1998 1999 2000 2001
ODA and official aid 45.1 49.5 46.4 41.7 48.1 46.3 39.7 36.1 39.0 42.3 40.7 39.3Grants (ex tech coop) 30.1 35.1 30.5 28.3 32.7 32.8 28.1 26.6 27.9 30.2 29.9 29.6
Bilateral 26.5 29.5 23.9 22.5 24.6 26.2 21.8 19.8 20.5 22.0 22.6 22.5Multilateral 3.6 5.6 6.6 5.8 8.1 6.6 6.3 6.8 7.4 8.2 7.3 7.1
Concessional loans 15.0 14.4 15.9 13.4 15.4 13.5 11.6 9.5 11.1 12.1 10.8 9.7Bilateral 8.3 6.3 8.5 6.7 6.5 4.9 3.0 1.5 2.9 4.6 3.6 3.0Multilateral 6.7 8.1 7.4 6.7 8.9 8.6 8.6 8.0 8.2 7.5 7.2 6.7
Memo itemTech coop grants 14.6 15.6 17.7 18.2 16.9 20.1 18.7 15.7 16.3 16.6 15.5 15.4
Note: Data are based on the OECD DAC definition of aid as measured by donors. These data differ from concessional flows reported involume 2, which are primarily based on information collected through the World Bank Debtor Reporting System.Source: OECD DAC; World Bank Debtor Reporting System; staff estimates.

G L O B A L D E V E L O P M E N T F I N A N C E
part, slow growth or declines in aid flows as re-corded by the DAC reflect the removal of a fewcountries from the list of countries eligible for aid.For example, recorded aid flows from France wereaffected by the removal of French Polynesia andNew Caledonia, the largest beneficiaries of Frenchassistance, from the list of ODA recipients. In theUnited States the country’s largest aid recipient, Is-rael, was removed from the list of aid recipients in1997, while the general skepticism about the valueof aid has limited the ability to rebuild the U.S. aidprogram. Germany’s aid budget fell by 7.5 percentin 2000, and the integration of the former EastGermany continues to put pressure on the Germanfederal budget. Japan, which is running a large fis-cal deficit aimed at boosting domestic demand, hasannounced a 10 percent cut in the aid budget forfiscal 2002.
—although the terrorist attacks on September11 may translate into a short-term increaseThe conflict stemming from the tragic events ofSeptember 11 is likely to spur a rise in aid in thenear term. Donors typically respond rapidly andgenerously to disaster—for example in Kosovo
and East Timor following the end of each conflict,in Central America following Cyclone Mitch, andin Turkey and India following earthquakes (in1999 and 2001, respectively). Aid flows also risesharply in times of global conflict—for instance,by 20 percent during the Gulf War of 1991. Whilethese flows are an important element in maintain-ing uninterrupted trade flows and mitigatinghuman suffering, they are temporary in nature andspecific in their objectives. As worthy as these ob-jectives are, they are unlikely to have a significantimpact on long-term development goals.
The global war on terrorism is also likely to re-sult in a temporary increase in aid as donors moveto offset the economic and humanitarian needs incountries at the center of conflict. A total of $5 bil-lion was pledged for Afghanistan in January 2002,although the bulk of this is expected to come fromexisting aid budgets. Commitments to Afghanistanin 2002 are expected to be almost $2 billion. How-ever, absorptive capacity is limited and the actualinflow to Afghanistan, including the $350 millionin emergency assistance already delivered sinceSeptember 11, is expected to be on the order of $1billion by the end of 2002.
94
Billions of dollars Percent of GNP
Figure 4.1 ODA from donor countries in relation to their GNP, 1990–2000
a. Provisional data.Source: OECD April 2001.
0
1990 1991 1992 1993
Net ODA flows (left axis)
Percentage of GNP of DAC countries (right axis)
1994 1995 1996 1997 1998 1999 2000a
10
20
30
40
50
60
70
0.0
0.1
0.2
0.3
0.4
Others
Netherlands
United States
United Kingdom
Japan
Germany
France

S T R E N G T H E N I N G O F F I C I A L F I N A N C I A L S U P P O R T F O R D E V E L O P I N G C O U N T R I E S
Aid is not always focused on poverty reduction—Aid has the greatest impact on poverty reductionwhen it is provided to countries with good policiesand many poor people (World Bank 1998). Alldonors made a formal commitment to poverty re-duction by endorsing the international develop-mental targets set out in the Organisation for Eco-nomic Co-operation and Development (OECD)DAC’s Shaping the 21st Century. Most donorshave policy statements that cite poverty reductionas the, or one of the, overarching goals of their aidprograms. Trumbull and Wall (1994) estimate thatODA allocations are responsive to the needs of recipient countries, as represented by high levelsof infant mortality (as well as issues surroundingpolitical-civil rights). Nevertheless, donors haveseveral motivations for aid that are not alwaysconsistent with allocating aid for the greatestpoverty impact. Aid may be used to support coun-tries with which the donor has strong historicalconnections. For example, Alesina and Dollar(2000) find that aid allocation is greatly influencedby whether a recipient was a former colony. Aidmay be directed at solidifying regional ties; Japan’slargest aid program is to countries in Asia. Aid alsois used to pursue strategic interests: Alesina andDollar (2000) find that recipients who vote withdonors in the U.N. tend to get more aid, Maizelsand Nissanke (1984) relate aid to arms transfersfrom the major donors, and Boschini and Olofs-gard (2001) explain the decline in aid during the1990s as being a byproduct of the end of the ColdWar. Thus some of the disaffection with the impactof aid on poverty reduction does not reflect the in-trinsic ineffectiveness of aid, but rather the largeshare of aid that is allocated on the basis of“strategic” criteria, instead of on the basis of thequality of policies and the number of poor. In this
context the end of the Cold War may have im-proved the opportunities for allocating aid accord-ing to poverty alleviation, rather than to strategiccriteria.
—and the share of aid going to low-incomecountries is falling— The multiplicity of motivations for aid is neithersurprising nor necessarily unfortunate. The use ofaid to further other interests increases popularsupport for aid in donor countries, and may be en-tirely consistent with making progress in develop-ment. For example, the United States providedsubstantial aid to the Republic of Korea and Tai-wan (China) during the 1950s and 1960s, mostlikely for strategic reasons. But these countrieswere spectacularly successful in reducing poverty,as well. However, the many motivations that un-derlie aid allocations may also have some role inimpairing aid allocation from the standpoint ofpoverty reduction. The share of aid going to low-income countries has fallen from 61 percent in theearly 1980s to 56 percent in the late 1990s. Con-siderable aid still goes to countries that have readyaccess to private capital flows, and countries thatgraduate from aid recipients to Part II of the DAClist of recipient countries do not always experiencea reduction of aid flows (an estimated $9 billionwas given to high-income countries or those on thePart II list in 2000). Moreover, aid to low-incomecountries with good policies equaled only 1.2 per-cent of their GDP (see table 4.2), slightly belowthe average for other low-income countries. Thisratio has declined sharply since the early 1990s,which reflects the fall in overall aid and rapid eco-nomic growth in countries with good policies (astheir share of aid has been stable). Thus substan-tial progress still is required to ensure that aid isdirected to countries with good policies.
95
Table 4.2 Trends in aid allocation(percent)
Aid allocation 1981–85 1986–90 1991–95 1996–99
Share of aid to low-income countries(percent of total aid) 61.2 62.1 55.1 55.7
Aid to low income with better than average policies(percent of GDP) 1.1 1.8 1.9 1.2
Note: Policy performance is measured by Country Portfolio Performance Review prepared by the World Bank.Source: World Bank; OECD.
G L O B A L D E V E L O P M E N T F I N A N C E
The macroeconomic impact of aid
Strengthening aid effectiveness will require con-tinued progress in allocating aid to countries
with good policies. But will increasing aid levels tocountries with good policies in itself erode the ef-fectiveness of aid? In the poor countries aid levelsare often large enough to have important macro-economic repercussions. Will the marginal produc-tivity of aid (in terms of raising growth rates) de-cline as the share of aid in economic activityincreases? Is aid likely to increase inflation, lead to excessive exchange rate appreciation, or erodethe efficiency of government administration? Andif the answer to any of these questions is yes, thenshould aid be reduced, or could changes in policyincrease a country’s ability to absorb aid produc-tively? This section concludes that most poor coun-tries with good policies should be able to maintainaid effectiveness while absorbing further increasesin aid. There is no rationale for constraining aid tocountries with good policies because they receive“too much” aid.
Aid and the sustainability of fiscal policy in the short term With appropriate economic management, largeamounts of aid do not increase inflation. Under-standing the potential impact of aid on inflationrequires an appreciation of how aid enters the gov-ernment budget. Aid is received by the governmentas foreign exchange. The government then, in ef-fect, sells this foreign exchange to its own centralbank, which in turn credits the government’s ac-count in domestic currency (sometimes referred toas “counterpart funds”). Thus, the central banknow owns the foreign exchange, which it initiallyholds in its reserves; at the same time, the govern-ment now owns the domestic currency, which itinitially holds in its account at the central bank.
Aid is not inflationary with policycoordination—If decisions by the central bank and the govern-ment are not coordinated, it is possible for aid toincrease inflationary pressures. For example, if thegovernment spends the domestic currency (thus in-creasing the demand for goods and services in theeconomy), but the central bank does not spend the foreign exchange, then the domestic price levelrises; in other words, nominal expenditures have
risen, but the real resources being purchased haveremained unchanged. In this case aid would be en-tirely inflationary. At the other extreme, the centralbank may sell the foreign exchange, but the gov-ernment does not spend its domestic currencyholding. The extra supply of foreign exchange is aninfusion of additional real resources to the econ-omy (as purchasers of foreign exchange use it tobuy imports); more goods are available, but nomi-nal demand is unchanged. In this scenario the pricelevel will fall—and aid would be deflationary. Fi-nally, if the two decisions are perfectly coordinated(the central bank sells all the foreign exchange, andthe government spends all the domestic currency),the net effect is to slightly reduce the price level.This is because the sale of dollars precisely offsetsthe initial increase in the nominal money supply, so that the nominal money supply is unaltered. Yetreal economic activity is now greater and so thedemand for real money balances will have risen.This will be satisfied by a decline in the price level.Usually the only circumstance in which aid be-comes inflationary is if there is a coordination fail-ure.9 However, coordination of the two decisions issimple: expenditures of counterpart funds need tobe matched with sales of reserves.
—which is facilitated by an appropriatedefinition of the government deficitIt is important to the credibility of government pol-icy that the definition of the deficit used in discus-sions of macroeconomic policy reflect the noninfla-tionary impact of aid. Because grants are essentiallyequivalent to revenue for the purposes of evaluat-ing the inflationary impact of fiscal policy,10 the ap-propriate definition for the fiscal deficit consistentwith macroeconomic stability is the deficit after ac-counting for aid flows. In the case of concessionalloans, ideally it is the grant component that shouldbe treated as revenue.11 In countries with large aidinflows, different treatments of aid in the fiscal ac-counts can have a significant impact on the re-ported size of the budget deficit. For example, inthe late 1990s, Ethiopia had a deficit of 8 percentof GDP—if aid were treated as a financing item.Recalculated to treat grants and the grant compo-nent of concessional loans as part of revenue, thedeficit was only 0.8 percent of GDP. By contrast,Zimbabwe in the late 1990s received very little aidand had a deficit of 5 percent of GDP. Using the
96

S T R E N G T H E N I N G O F F I C I A L F I N A N C I A L S U P P O R T F O R D E V E L O P I N G C O U N T R I E S
definition of the deficit that treats aid as a financ-ing item would indicate that Ethiopia’s fiscal policywas more inflationary than Zimbabwe’s, yet clearlythe exact opposite was the case. Much of theframework for public discussion of fiscal policycomes from ideas articulated by economists andpolicymakers in industrial countries, where theproblem of interpreting the impact of aid on thefiscal accounts does not arise. Therefore, the defi-nition of the budget deficit used in aid-recipientcountries should be such that a level of deficitdeemed to be problematic in OECD countries shouldbe similar to that which signals a policy problem in aid-recipient countries. Regional groupings ofAfrican countries are indeed starting to adopt theirown norms analogous to the EU’s stability pact,and it is essential that these norms be based on adefinition of a deficit that corresponds to economicrationality and that produces figures that are wellunderstood by the public.
Volatile aid flows need not translate intovolatile government resourcesLarge amounts of aid to the poor countries withgood policies are unlikely to increase the volatilityof government resources or lead to excessive re-liance on aid flows. Lensink and Morrissey (2000)find that instability of aid resources can have a neg-ative effect on growth. Pallage and Robe (1998)find that aid has been more volatile than recipientcountries’ output, and aid has been pro-cyclical.However, other empirical work indicates that aiddoes not generally increase the volatility of govern-ment resources. Since the alternative to receiving aidis to finance expenditures through taxation, the ap-propriate benchmark for the volatility of aid is thevolatility of revenues. In a sample of 36 African aidrecipients, Collier (1999) found that the coefficientof variation on aid was slightly lower than for rev-enue. Bulir and Hamann (2001), in a global sampleof aid recipients, find that aid is more volatile thantax revenues (with both expressed in U.S. dollars),but the difference was not statistically significant.12
If aid and tax revenue are almost equally volatile(for example, in U.S. dollars) then unless aid andtax are perfectly correlated, aid must reduce overallvolatility. Collier (1999) found a slight negative cor-relation between aid flows and revenues. In thatcase the addition of aid to revenues actually reducesthe volatility of overall resources.
Aid may compensate for other sources ofvolatility. Guillaumont and Chauvet (2001) findthat the effectiveness of aid rises as it is provided tocountries that are prone to external shocks. Thereis some evidence that multilateral flows to poorcountries help cushion against external shocks bycompensating for withdrawals of private flows (seebox 4.3). Collier and Dehn (2001) analyze the ef-fect of aid on growth during periods of negativeshocks in the context of the aid-growth model de-veloped by Burnside and Dollar (2000). They findthat an additional dollar of aid during an extremenegative shock period raises the growth rate bysubstantially more than in normal periods. By off-setting the initial income loss, the aid avoids themultiplier contraction in output. The magnitude ofthese multiplier effects suggests that the rate of re-turn on aid during extreme negative shocks is re-markably high. Aid would be used most effectivelyin compensating for shocks if care is taken to dis-tinguish between temporary shocks (that should befinanced) and permanent declines in income (thatshould be adjusted to).13 The international com-munity increasingly recognizes the importance ofaid in cushioning external shocks. For example, tooffset the impact of external shocks expected in theaftermath of September 11, the estimates of low-income countries’ possible resource requirementsduring the 13th Replenishment of the InternationalDevelopment Association (IDA-13) have been re-vised upward by about $2 billion.
Though aid does not usually increase thevolatility of resources, it is possible that heavy re-liance on aid could impose adjustment costs if aidwere suddenly to decline. There are three circum-stances that may cause aid flows to decrease.14
First, per capita income in a recipient country canrise sufficiently so that the country is no longer eli-gible for aid. There is no need to be cautious of de-pendence on aid while the economy is poor, just be-cause one day it will be sufficiently rich that it willno longer need any aid. Moreover, higher income isassociated with a greater ability to finance expendi-tures from taxes; in 1998 current revenue equaled14 percent of GDP in low-income countries, 19 per-cent in middle-income countries, and 29 percent inhigh-income countries. Second, aid may be cut offbecause economic policy deteriorates substantially;however, this is not a reason for a country withgood policies to refuse aid. Finally, donors may
97

G L O B A L D E V E L O P M E N T F I N A N C E
sharply reduce levels of aid for reasons unrelated tothe recipients, for example because donors con-front widespread fiscal difficulties. Changes in aidflows tend to be implemented slowly, and it is un-likely that any such reduction in aid would presentvery sharp adjustment costs to individual develop-ing countries. Nevertheless, this concern does un-derscore the importance of donors providing forstable aid flows over time.
Aid has a positive impact on growth incountries with good policies—So far we have shown that there is little reason toworry about the adverse impact of aid on the sus-tainability of economic policies in countries whoseeconomic policies are sound. We now turn to thequestion of whether increases in aid are likely tocontinue to have a positive impact on growth.There is growing evidence that aid has a positiveimpact on growth in countries with good policies.Earlier empirical studies had consistently found aweak relationship between aid and investment andshowed little impact of aid on growth (see, for ex-ample, Griffin 1971; Snyder 1990; Boone 1994;
and Reichel 1995).15 However, Burnside and Dol-lar (2000), Collier and Dollar (2001a), and Dur-barry, Gemmell, and Greenaway (1998) show thataid makes an effective contribution to growth incountries with good economic policies.16 The ex-tent of the impact on growth can be seen by look-ing at IDA, which is well targeted on low-incomecountries with reasonable policies. At the margin,an additional billion dollars of IDA funds raisesthe growth rate sufficiently to lift around 434,000people out of poverty.17 Collier and Dollar (2001b)find that in good policy environments aid raises in-vestment by almost double the value of the aid;Collier and Dollar (2001c) also find that in goodpolicy environments a $1 billion injection of aidraises FDI by $600 million.
—although appropriate policies may benecessary to limit “Dutch disease” effects—The finding that on average aid has had a positiveimpact on growth in good policy environmentsdoes not imply that aid levels can rise foreverwithout a resulting adverse effect on growth. In-creasing levels of aid may erode growth by causing
98
Multilateral flows to poor countries appear to have aninverse relationship to private flows. There are vari-
ous interpretations in the economic literature of this rela-tionship in the context of all developing countries. Das-gupta and Ratha (2000) argue that multilateral lendingplays a stabilizing role during periods of credit rationing.Lerrick (1999) sees this relationship as evidence thatmultilateral flows crowd out private flows. Easterly (1999) and Svensson (2000) argue that multilateral lend-ing programs create incentives for borrowing governmentsto delay economic reforms, so that private lenders with-draw in reaction to increased multilateral loans.
The inverse relationship between multilateral and pri-vate flows, however, need not imply “crowding-out” ofprivate flows to developing countries. Indeed an inverse re-lationship in the short term may be consistent with a com-plementary relationship over the long term. With respect toshort-term cyclical variables (for example, an increase inGDP growth or an interest rate hike in the industrial coun-tries), private flows tend to behave procyclically (WorldBank 2000a) whereas official flows are expected to react
countercyclically. However, in the long term official flowsmay lead to an improvement in the structural, policy, andinstitutional environment of a country, which would en-courage greater private flows. Several authors have alsofound empirical support for the catalytic effects of multi-lateral flows on private flows. Kharas and Shishido (1991)found that during 1974–85, by alleviating credit rationingand improving creditworthiness (by increasing internationalreserves, for example), official aid was able to generatespillover effects that attracted private flows. (See alsoKrueger 1998; Summers 1999; and Checki and Stern 2000.)
This relationship is borne out by statistical tests. Panel data analyses for low-income countries (for the period1970–98) indicate a negative relationship between multi-lateral and private flows in the same period, but a positiverelationship with a six-year lag. By contrast, bilateral flows(including grants) seem to have a significant and positiveeffect on private flows in the concurrent period, but a neg-ative effect with a lag. This result may reflect the impor-tance of strategic and noneconomic considerations in aidallocation by bilateral donors (Alesina and Dollar 2000).
Box 4.3 The relationship between private andmultilateral flows in poor countries

S T R E N G T H E N I N G O F F I C I A L F I N A N C I A L S U P P O R T F O R D E V E L O P I N G C O U N T R I E S
“Dutch disease.” Since aid is foreign exchange, itonly directly augments the supply of those goodsthat are internationally tradable. It will thus lowertheir equilibrium price relative to those goods thatcan only be traded domestically (nontradables).This relative price change induces a resource shiftin the economy from tradables to nontradables.Among the tradables are exports, so that aid willtend, all things being equal, to reduce exports. Infact, other things are not equal. The aid may en-able governments to lower taxes on exports,which in the poor countries is typically the mostheavily taxed sector. Additionally, aid might fi-nance infrastructure expenditures that facilitateexports, such as roads and ports. However, itseems reasonable to expect that in most circum-stances aid will indeed reduce exports. Van Wijn-bergen (1986) found that increases in aid were as-sociated with an appreciation of the real exchangerate in African countries. Several empirical studiespresent evidence of the adverse impact of theDutch disease on exports (see, for example, La-plagne, Treadgold, and Baldry 2001; Soderling2000; and Sekkat and Varoudakis 2000). Collierand Hoeffler (2000) show that, controlling for thelevel of economic policy as measured by the WorldBank’s Country Portfolio Performance Review, arise in aid is associated with a decline in the shareof primary commodity exports in GDP. Since forAfrica these exports still make up around 70 per-cent of all merchandise exports, it is likely that aidin Africa reduces total exports.18
The question remains, is a decline in exportscaused by aid-induced real exchange rate apprecia-tion undesirable? It should be recognized that theDutch disease is more of a problem if the aid flowis short-lived, so that adjustment costs are in-curred when aid flows in and when it ceases. Butaid to the poor countries is rarely a matter of a fewyears, and thus the value of aid will be greaterthan any distortionary effects due to real exchangerate appreciation. The reallocation of resourcesout of tradables could be undesirable if either ex-ports are initially too low because of taxation, orbecause exports raise growth through learning andcompetition effects that enhance productivity;Kraay (1999) finds some evidence of this forChina, and Bigsten and others (1999) for Africa.However, a more rational response to these prob-lems would be to use aid to reduce taxation or tofinance infrastructure facilities that help exporters.
—and access to large nontax resources mayerode government accountabilityThe productivity of aid may decline due to reasonsother than the Dutch disease. It may be possiblefor governments to have more resources than aregood for their societies. Access to very large non-tax resources can erode the accountability of gov-ernment. Indeed, the history of accountable gov-ernments in the now-developed societies datesfrom the need for governments to raise tax revenue(see, for example, Hoffman and Norberg 1994).Similarly, Sachs and Warner (2000) establish thatgovernance is worse in countries where the govern-ment has access to large rents from natural re-sources. Consistent with this theory, Knack (2000)finds that aid tends to be associated with increasedcorruption. On the other hand, Burnside and Dol-lar (2000) and Dollar and Svensson (2000) foundthat aid neither improved nor worsened policies.This is disappointing because it implies that aidmay not induce reform; on the other hand, it indi-cates that aid does not appear to cause a general-ized deterioration in economic policies.
A more likely reason for diminishing returnsto aid is administrative and managerial conges-tion. If the really scarce resource in the public sec-tor is competent and motivated civil servants, theneach additional aid project, in competing for thesame limited pool of skills, inflicts negative exter-nalities on other projects. Beyond a point, thesecongestion effects can fully offset the direct bene-fits of the project. Similarly, Taslim and Weliwita(2000) argue that both public and private invest-ments in developing countries are limited by thestock of entrepreneurial skills, so that increasedaid is reflected in reduced saving.
The marginal productivity of aid dependsupon the quality of policies—Aid is likely to be subject to diminishing returns.19
The Collier and Dollar (2001a) results indicate,however, that the level of aid where the marginalproductivity is zero depends on the quality of poli-cies, and this level is quite high for countries withgood policies. Countries with the highest score onthe World Bank’s Country Portfolio PerformanceReview (CPPR) continue to enjoy aid’s positive im-pact on growth at levels of aid up to 30 percent ofgross domestic product (GDP). Durbarry, Gem-mell, and Greenaway (1998) find that aid contin-ues to make a significant contribution to growth
99

100
G L O B A L D E V E L O P M E N T F I N A N C E
up to 40 percent of GDP in countries with a stablemacroeconomic policy environment.20 The medianCPPR among poor countries is 3.2, at which level(by the Collier and Dollar estimations) the impactof aid on growth would remain positive up to 19percent of GDP, while aid averages 8 percent ofGDP for poor countries with better than averageratings. By these calculations, 28 out of the 34poor countries with better than average policiescould continue to absorb increasing amounts ofaid before the marginal productivity of aid dropsto zero.21
Recent calculations indicate that a doubling ofaid will be necessary to reach the goal of halvingthe share of the developing-country populationthat lives on less than $1 a day by 2015 (WorldBank 2001b). But improvements in the allocationof aid are also critical to achieving the povertygoal. Collier and Dollar (2001a) develop a modelfor allocating aid that reflects the view that the im-pact of aid on poverty depends on the quality ofpolicies.
A doubling of aid that is distributed accordingto quality of policies and the level of poverty im-plies significant changes in aid allocation. SouthAsia would receive an increase in the share of totalaid from 11 percent in 1999 to 45 percent.22 Thelargely middle-income regions of Europe and Cen-tral Asia, Latin America and the Caribbean, andthe Middle East and North Africa would togetherreceive only 4 percent of total aid, compared withabout a third in 1999. The share of East Asia andPacific would decline slightly, because the middle-income countries receive much less aid, but aidwould expand sharply to Vietnam and the Philip-pines due to their relative poverty and good poli-cies. Finally, the share of aid going to Sub-SaharanAfrica would change very little, because some ofthe better performers would receive significant in-creases but other countries with very poor policieswould experience an actual decline in aid flows.The increases in aid-to-GDP levels are modest formost countries, and for all of the countries withgood policies aid remains well below the levelwhere the marginal productivity of aid falls tozero. In Sub-Saharan Africa, the region with thehighest level of aid relative to GDP, the averageratio of aid to GDP would rise only slightly. Fi-nally, the doubling of aid would lift an estimated15 million people permanently out of poverty eachyear, for a total decline of 225 million people in
poverty by 2015 (20 percent of the population inpoverty in 1999).
These estimates of the impact of aid are con-servative. They assume that donors have no im-pact on the quality of policies or the elasticity ofpoverty reduction with respect to growth. It maybe true that donors have had only a limited impacton policies, and that aid is often fungible (so thatthe kind of projects financed would not affect thepoverty elasticity). However, a recent study of aidand reform in Africa concludes that donors couldhave a more systematic impact on policy if they in-creased aid as policies improved (World Bank2001c), which is the allocation rule used in thissimulation. Further, if the improvement in policiesis reflected in better provision of public servicesthat benefit the poor, then countries with goodpolicies will have higher elasticities of poverty re-duction with respect to growth. Thus the impacton poverty of a doubling of aid, allocated accord-ing to policies and the extent of poverty, is likelyto be larger than assumed in this simulation.
—so aid efficiency can be improvedThus recent econometric evidence indeed suggeststhat countries can receive too much aid. The mostlikely explanation for this is neither the Dutch dis-ease, nor the deterioration of governance, but thehigh congestion costs incurred by attempting to im-plement many aid projects through a bureaucracywith limited capacity. If this analysis is correct, ithas five important implications: First, in countrieswith good policies, actual aid inflows are unlikelyto be near the point where the marginal productiv-ity of aid is zero (the saturation point). Second, inthose poor countries that currently are close to orbeyond their saturation points, the key task is toraise the saturation point by improving policy.Third, aid programs should aim to reduce conges-tion costs. Switching more aid from projects toprograms would almost certainly raise absorptivecapacity. Fourth, to the extent that the capacityconstraint is due to a lack of competent and moti-vated civil servants, incentive systems in the publicsector may need revision. Fifth, if the public sectorfaces real constraints upon its capacity to spendmarginal resources effectively, it should reduce taxreceipts relative to aid. While aid augments the re-sources available to the economy, taxation reducesthem by introducing distortions (for example, in-creased income taxes may reduce the incentive to

101
S T R E N G T H E N I N G O F F I C I A L F I N A N C I A L S U P P O R T F O R D E V E L O P I N G C O U N T R I E S
work). A sensible growth strategy for a very low-income economy with a dysfunctional civil servicewould be for rising aid inflows to be used partly forreducing the share of tax revenue in GDP.
Conditionality and adjustmentlending
Strengthening the use of policy conditionality inadjustment lending is an important element in
efforts to improve the effectiveness of aid (seeWorld Bank 2001d). Policy conditionality refers tothe practice of basing the disbursement of donorfunds on the implementation of specific policies.Policy conditionality can support the effectivenessof adjustment assistance by helping to avoid dis-bursements to governments with inappropriatepolicies. For recipients, agreement on specific con-ditions for disbursement (as opposed to basing dis-bursement on a general evaluation of the govern-ment’s program) can improve the transparency ofdonor decisions and the reliability of aid disburse-ments (Mosley 1999). By increasing the cost ofbacktracking on policies (in terms of worsening re-lations with donors or losing disbursements), com-mitments to donors can enhance the government’scredibility in sticking to policies that face opposi-tion from special interests or that have short-termcosts but long-term benefits. Case studies of thestrong reform programs in Ghana and Ugandasuggest that conditionality was successful at facili-tating clear decisions from political leadership andpublicly signaling the government’s commitment(World Bank 2001c). In turn, enhancing credibilitycan encourage more rapid adjustments to newpolicies by the private sector and hence reduce theshort-term employment and output costs of ad-justment. Greater compliance with conditionalityunder World Bank loans was significantly relatedto improved economic performance (figure 4.2).23
Country ownership is key to success—A country’s commitment and capacity to imple-ment the reforms supported by adjustment lendingare key to effective adjustment and sustained devel-opment. Research on aid effectiveness indicatesthat when a country’s commitment or implementa-tion capacity is weak, conditionality is unlikely tobe effective. In other words, conditionality by itselfcannot lead to the adoption of better policies when
there is no consensus for reform.24 Conditions at-tached to adjustment lending may not contribute to successful outcomes in cases where donors lackadequate information (on local conditions, govern-ment capacity, and the extent of government com-mitment) or the interests of donors and recipientsdiverge. Conditionality is the outcome of a bargain-ing process that can be subject to failures of coordi-nation and unintended outcomes.25 To the extentthat this process leads to a reform program that isnot fully owned by the government, the success ofthe program can be severely undermined. Domesticpolitical support is critical for the adjustment pro-gram (Rodrik 1996; World Bank 1998; Dollar andEasterly 1998; Dollar and Svensson 2000). Bothcross-country reviews and individual case studieshave confirmed the critical importance of strongcountry ownership of the adjustment program tothe successful use of conditionality in adjustmentlending (McClearly 1991; Berg 1991). Johnson andWasty (1993) find that strong ownership was amajor reason for success in 75 percent of adjust-ment programs with good results. The Interna-tional Monetary Fund (IMF 1998) attributed poorimplementation of IMF programs in Zambia(1978–91) and Uganda (late 1980s) to lack of own-ership; these are in contrast to successes in Bolivia,
Countries showing improvement (percent)
Figure 4.2 Compliance with conditionalityand economic performance
Source: World Bank 1997.
0Growth Inflation
Performance indicator
GDI
10
20
30
40
50
60
70
80
Strong compliers Weak compliers
Poor compliers

G L O B A L D E V E L O P M E N T F I N A N C E
Uganda in the 1990s, and Côte d’Ivoire, whereownership was strong.
Conditionality and World Bank adjustmentlending have evolved—Conditionality was originally directed largely atachieving macroeconomic stability and reducingmarket distortions, and adjustment assistance wasconceived as a financing vehicle for short-term bal-ance of payments support. Over the years, thepolicies covered by conditionality and the goals ofadjustment lending have evolved in tandem withcountries’ broader reform agendas, and have be-come increasingly focused on long-run, structural,social, and institutional issues. The 1980s’ narrowfocus on short-term stabilization and addressingdistortions gave way in the 1990s to greater atten-tion to poverty reduction, institutions, and complexsocial and structural reforms. This shift included anexplicit focus on good governance, with strong sup-port for public sector management reforms.
Reflecting in part the growing long-run struc-tural and institutional focus of countries’ reformagendas, Bank-supported adjustment programshave grown more complex, even while the averagenumber of conditions in adjustment loans has fallensignificantly, from 61 conditions in the late 1980sto 33 conditions in fiscal 2000. The number of con-ditions tends to be higher and complexity tends tobe a greater challenge in countries with weak per-formance and capacity, where adjustment lending isless successful (World Bank 2001d). This highlightsthe ineffectiveness of attempts to address perfor-mance deficiencies and capacity limitations througha larger number of more complex and detailed con-ditions, and confirms the importance of continuingto focus adjustment support in countries with goodpolicy and institutional environments.
—and the quality of Bank adjustment lendinghas improvedThe record of policy conditionality in promotingthe objectives of adjustment programs, as reflectedin the degree of compliance with agreed-on condi-tions, has improved in recent years. The problemsaffecting conditionality in the 1980s have beenwell documented.26 Some of these problems mayhave persisted into the early 1990s. Killick, Guna-tilaka, and Marr (1998) find that only 25 percentof World Bank adjustment operations from1989–90 to 1993–94 were completed on sched-
ule.27 World Bank (1997) found that out of 35 ad-justment operations in Sub-Saharan Africa, com-pliance was rated as strong in 10 countries, and asweak or poor in 25 countries. Indeed, the perfor-mance of World Bank adjustment lending im-proved sharply throughout the 1990s. OperationsEvaluation Department outcome scores increasedfrom 60 percent satisfactory in the 1980s to 68percent satisfactory in fiscal 1990–94, and to 86percent satisfactory in fiscal 1999–2000.28 TheWorld Bank’s Quality Assurance Group found thatthe great majority of a sample of adjustment loansin 1999 were satisfactory or better regarding vari-ous dimensions of program design (World Bank2000b). Bilateral aid evaluations also typicallyfind satisfactory outcomes for a high proportionof adjustment programs (see, for example, USAID2001; SIDA 1999).
It is of course difficult to attribute improvedcompliance wholly to improvements in the designof conditionality. There are several reasons whyadjustment programs were more successful duringthe 1990s, including a more favorable interna-tional economic environment (at least in someyears), greater selectivity on the part of the donors,and greater recognition of the importance of gov-ernment ownership in crafting an effective adjust-ment program. It is likely that changes in theprocess of adjustment lending, including greaterselectivity and encouraging ownership through aless intrusive approach to the design of reformprograms, was at least as important as the changein the focus of conditionality to address underly-ing structural, social, and institutional issues. Whatis clear is that changes in the overall approach toadjustment assistance have contributed to moresuccessful reform programs.
Aid coordination and the administrativeburden of aidThe idea that donors could increase the effective-ness of aid by improving the coordination of theiractivities is not new (Pearson 1969). Donors havemade extensive efforts to consult on their aid opera-tions and thus avoid the imposition of conflicting orduplicative administrative requirements, and theyhave improved the quality and consistency of policyadvice, most notably through consultative groupmeetings, round tables sponsored by the United Na-tions Development Programme, aid meetings underthe auspices of the OECD DAC, the U.N.’s Devel-
102

S T R E N G T H E N I N G O F F I C I A L F I N A N C I A L S U P P O R T F O R D E V E L O P I N G C O U N T R I E S
opment Assistance Framework (which harmonizesU.N. agencies’ activities) and the Strategic Partner-ship for Africa. Successive IDA replenishment re-ports during the 1990s urged greater efforts at coor-dination. Considerable work remains to strengthenaid coordination, which is particularly important inthe poorest aid recipients that receive very signifi-cant levels of aid relative to domestic resources.
Reducing administrative burdens—Aid often imposes a substantial administrative bur-den on recipient governments (Van Arkadie 1986;Lister and Stevens 1992). Van de Walle and John-ston (1996) report that Kenya had 600 projectsfrom 60 different donors during the mid-1980s,while Zambia had 614 projects from 69 donors. In Tanzania there were even more—over 2,000projects from 40 donors. Administratively, 600projects could translate over the course of a yearinto as many as 2,400 quarterly reports for variousoversight agencies and perhaps 1,000 missions re-questing meetings with key officials and commentson their reports. Disch (2000, p. 39) describes themultiplicity of import support programs inMozambique in the late 1980s, each with differentprocedures and time delays that typically took sixto nine months for importers to navigate. The re-sult: skyrocketing import costs. Donors have com-peted with each other and with the government torecruit scarce local experts for projects, thus under-mining the government’s capacity (Eisenblatter1999). Lancaster (1999, p. 501) notes the implica-tions for budget management of uncoordinateddonor projects negotiated with individual min-istries, each demanding counterpart funding for re-current costs. In addition to administrative bur-dens, failures in aid coordination can result indonors pressing inconsistent policy advice on gov-ernments. For example, in the mid-1980s theWorld Bank and the United States Agency for In-ternational Development urged the Kenyan govern-ment to reduce the role of the National Cereals andProduce Board at the same time as another donorwas financing a major expansion of its facilities(Mosley 1986).
—and shifting away from tied aid—One of the better-known impediments to aid effec-tiveness is tied aid, which often reflects donors’commercial interests rather than recipients’ devel-opment needs. Various studies have found that
tying requirements limit competition, increase ad-ministrative burdens, and lead to countries pur-chasing goods with an inappropriate technologywith greater than desired capital intensity. The ad-ditional cost imposed by tying aid has been esti-mated in the range of 10–30 percent (OECD 2001;Morrissey and White 1994; and Jepma 1991).There are also significant indirect costs, includingsuspension of standard procurement proceduresand higher cost maintenance due to dependence onimported parts that may not be readily available.
Considerable progress has been made to re-duce tied aid requirements, and the share of bilat-eral aid that is tied has dropped from 65 percent in1990 to 38 percent in 2000, though there is con-siderable variation across donors. The share oftied aid to the least developed countries is about50 percent, higher than the average for all devel-oping countries primarily because these countriesreceive more of the type of aid that is still subjectto tying (for example, food aid and technical assis-tance). The DAC High Level meeting in May 2001agreed on a recommendation to untie ODA to theleast developed countries to the extent that is pos-sible. By January 2002 many important compo-nents of ODA to the least developed countries willbe untied, including balance of payments supportand debt forgiveness. The OECD estimates thatthis will raise the level of untied aid to the least de-veloped countries to 70 percent.
Changes in process can strengthen aidcoordination and reduce administrativeburdensProcedurally, a number of different strategies forimproving coordination have been advanced, in-cluding sectorwide approaches, greater donor spe-cialization, more support for capacity building,and greater flexibility in some donor requirements.Sectorwide approaches can facilitate country own-ership by reducing micromanagement by donorsand by eliciting longer-term commitments fromboth sides to help build genuine partnerships. For donors, sectorwide approaches offer a realisticcompromise between detailed micromanagementand provision of general budget support, since re-sponsible ministries may be held accountable forresults. Sectorwide approaches are most appropri-ate when both macro and sector reform processesare in place and when governments have a clear vi-sion and ownership of objectives. In Uganda, for
103

G L O B A L D E V E L O P M E N T F I N A N C E
example, strong government motivation, activeparticipation by civil society in program monitor-ing, and a credible medium-term budget processmade the Universal Primary Education project asuccess (Brown and others 2001). However, sectorfinance is likely to be ineffective if either sectorpolicies or macroeconomic and budget managementare weak. In addition, sectorwide approaches maylimit government’s ability to reallocate funds acrosssectors, compared with disbursing aid through bud-get support programs.
Greater donor specialization is needed. Thedifficulties of aid coordination increase sharply asmore donors become involved in any one area, sospecialization along geographic or functional linesaccording to comparative advantage is desirable.Yet the trend has been toward increasing diffusionof donor activities, and World Bank (1999) foundfew examples of aid coordination efforts that ledto greater specialization (see also World Bank2001e). Reviewing aid to Ghana in the first half ofthe 1990s, Eriksson (2001) found a steady increasein the number of sectors for each bilateral donorand a decline in bilateral commitments per sector.
Capacity building is one key to progress. Lim-ited capacity and institutional weakness impedethe formulation of country-owned strategies, andundermine the trust donors need to allow coun-tries to take responsibility for detailed financialand project management. Yet capacity buildinghas been one of the least effective areas of donoractivity, and in many of the world’s poorest coun-tries the quality of public administration has sys-tematically deteriorated (Lancaster 1999). Somedonor practices may have even contributed to theproblem through insistence on special projectmanagement units that draw government officialsfrom their regular duties, and recruitment of expa-triate technical assistance personnel whose termsof reference are to substitute for local capacityrather than to build it. Regular civil service staffassigned to projects may be expected to give prior-ity to project work even if there is a conflict withtheir normal responsibilities (Lancaster 1999; vande Walle and Johnston 1996).
More flexibility by some donor agencies isneeded to transfer responsibility and accountabil-ity to recipients. Incompatible procedures for re-porting, accounting for disbursements, and pro-curement raise transaction costs and inhibit closercoordination among donors, while severely bur-
dening recipient governments. Greater delegationof decisionmaking authority to the field would alsofacilitate better coordination (World Bank 2001f).
Above all, government leadership is the keyStrong leadership from the recipient government isessential for successful aid coordination (Eisenblat-ter 1999). For example, Botswana, the fastest-growing country in Africa for some time (and inmany years the fastest-growing country in theworld) has had the vision and capacity to managethe aid process (Brautigam and Botchwey 1995). InBotswana the government maintains effective con-trol of aid with strong institutions backing up a co-herent vision. Donors are encouraged to specializein specific sectors to build up their expertise andminimize administrative burdens (van de Walle andJohnston 1996). Likewise, the governments ofGhana and Uganda, two of the more successful re-formers in Africa, have played an active role in co-ordinating donor activities.
Aid and debt relief
Strengthening the effectiveness of aid throughdebt relief—The increase in concessional debt relief, and ef-forts to tie debt relief to effective reform programs,have been important components of efforts tostrengthen the effectiveness of aid. Debt reductionin the form of concessional rescheduling of guaran-teed commercial claims began in 1988 with the in-troduction of Toronto terms by the Paris Club,which allowed for a reduction of one-third foreligible claims. The level of debt forgiveness hassubsequently been raised progressively, to 50 per-cent reduction (in net present value [NPV] terms)in 1991 (London or enhanced Toronto terms), and 67 percent NPV reduction in 1994 (Naplesterms).29 Donors forgave bilateral ODA claims, fi-nanced debt swaps, contributed to the buyback ofcommercial debt through the IDA debt reductionfacility program, and supported programs to helpdebtor countries meet multilateral debt serviceobligations. Efforts to deepen debt relief for poorcountries suffering from unsustainable debt bur-dens culminated in the HIPC Initiative. All in all,DAC donors have forgiven about $29 billion indebt over the past 30 years. Of this total, forgive-
104

S T R E N G T H E N I N G O F F I C I A L F I N A N C I A L S U P P O R T F O R D E V E L O P I N G C O U N T R I E S
105
ness of ODA loans by DAC donors has amountedto almost $20 billion (see table 4.3), and donorshave claimed credit in their aid budgets for the for-giveness of $8.5 billion in non-ODA claims, andhave provided almost $400 million in grants insupport of the IDA debt reduction facility. How-ever, the figures recorded by the DAC probablyunderestimate the full extent of the debt relief, be-cause they do not include irrevocable commitmentsto forgive future ODA claims, while for non-ODAclaims the reporting norms are complex and havetaken time to be fully integrated into the statisticalsystems of the export credit agencies.
—as 24 countries have reached the decisionpoint under the HIPC Initiative—The HIPC Initiative, launched in 1996, aims to in-crease the effectiveness of aid by helping poorcountries achieve sustainable levels of debt whilestrengthening the link between debt relief andstrong policy performance. Forty-two countries,primarily from the Sub-Saharan Africa region, areidentified as eligible to receive debt relief under thisinitiative. In 1999 the scope of the initiative waswidened to accelerate and deepen the provision ofdebt relief. As of December 2001, 24 countrieshave reached the decision point30 (the point wheredebt relief is approved by the Executive Boards ofthe IMF and the World Bank, and interim relief be-gins). These countries are now receiving debt ser-vice relief which will amount to about $36 billionover time, a $21 billion reduction in the NPV oftheir outstanding debt stock (see figure 4.3).
—resulting in a halving of the NPV of theirexternal debt—The 24 countries that have reached their decisionpoints have experienced a halving of their externalstock of debt in NPV terms. When combined withother debt reduction mechanisms, this implies atwo-thirds reduction in their external indebted-
ness. The pace of delivery of debt relief increasedin 2001. All countries that reached their decisionpoints by the end of 2000 are now receiving in-terim relief, and their aggregate level of debt isforecast to fall from 60 percent of GDP in 1999 to28 percent after debt relief. Current plans call fora reduction in debt service obligations by one-third ($1.1 billion) during 2001–03,31 for an aver-age savings of close to $50 million per country peryear. Debt service as a percentage of exports forthe 24 countries is expected to decrease from 16.8percent in 1998–99 to 8.2 percent in 2001–03.
—while 4 of these countries have reached thecompletion pointAs of December 2001 four countries (Bolivia, Mo-zambique, Tanzania, and Uganda) had reached thecompletion point, where the remainder of thecommitted debt relief is delivered. For example,Mozambique reached its completion point in Sep-
Table 4.3 Forgiveness of ODA claims, 1970–2000(millions of dollars)
1970–89 1990–95 1996 1997 1998 1999 2000 1970–2000
Total 5,075 11,183 1,026 488 660 600 750 19,783HIPCs 2,236 6,495 722 260 400 450 480 11,043Other developing countries 2,840 4,689 304 228 259 150 270 8,740
Source: OECD DAC, national aid agencies, and staff estimates.
Billions of dollars (decision point terms)
Figure 4.3 NPV of external debt of the 24 countries that reached their HIPC decision point
Source: World Bank.
60
50
40
30
20
10
0
NPV beforetraditional relief
NPV aftertraditional relief
NPV afterHIPC relief
NPV beforeadditional bilateraldebt forgiveness
47
2521
57

G L O B A L D E V E L O P M E N T F I N A N C E
106
tember 2001, and will receive debt relief amount-ing to $4.3 billion, which will cut its debt by 72percent (in NPV terms). As a result, Mozambique’sannual debt service payments will be reduced to anaverage of 6 percent of export earnings and 10percent of government revenue over 2000–10, ascompared with 20 and 23 percent, respectively, in1998. Another dozen countries could reach theircompletion point in 2002.
HIPC has helped provide a more effectiveenvironment for aid—The HIPC Initiative, in addition to increasing re-sources for debt relief, has helped to support pol-icy improvements and thereby contributed to aideffectiveness. Debt relief under the HIPC Initiativeis intended for countries that are pursuing effectivepoverty reduction strategies, and increased socialexpenditures is a critical element. For the countriesthat have reached decision points under the HIPCInitiative, social expenditures are projected to in-crease about 1.1 percent of GDP compared with1998–99 (table 4.4).
—which is reflected in ODA flowsThere is some evidence that ODA flows to theHIPCs are being allocated to the better performers,a prerequisite for aid effectiveness. Countries thathave either reached a decision point (indicatinggeneral agreement with donors on the economicprogram) or have sustainable levels of debt (indi-cating that their policies were adequate to achievesustainable debt levels with traditional debt reliefmechanisms) observed an increase of 3 percent ingross ODA flows since the initiation of the pro-gram in 1996. This is in marked contrast to ODAflows to countries with unsustainable debt levelsthat have not yet reached a decision point; in thosecountries, gross ODA has fallen by more than half
since 1996. It should be noted, however, that ODAto the better performers excluding debt relief hasdeclined by 2 percent since 1996. The HIPC Initia-tive has been essential to place beneficiary coun-tries on a path to long-term debt sustainability32
and has resulted in increased resources, as shownby the decline in actual debt service payments rela-tive to earlier years. Even countries with significantpayments arrears received an important, if moremodest, increase in new financial resources, whilethe HIPC Initiative also will help normalize theirrelations with creditors. Nevertheless, it is of criti-cal importance that donors maintain their ODA ef-fort in the form of new money as well as debt relief,particularly as the expected supply response tolowering debt levels may take some time to occur.
However, creditors need to continue to deliveron HIPCFull participation by all creditors is essential to en-sure that the 24 countries already at decision pointsreach sustainable external debt levels and, morebroadly, to ensure that the HIPC Initiative achievesits objectives in full. While most bilateral credi-tors—including all Paris Club creditors—and themajority of multilateral and commercial creditorshave already been delivering on their commitmentsto provide relief to HIPCs, a number of creditorshave not. In particular, some of the non–Paris Clubofficial bilateral and commercial creditors (repre-senting about 10 percent of the debt relief to bedelivered) along with a few multilateral creditorshave not yet agreed to provide relief to the coun-tries that have reached their decision points underthe Initiative. Indeed, a small number of creditorshave resorted to litigation as a means of recoveringassets; of those, there are a few cases where claimsof official bilateral or commercial creditors havebeen bought on the secondary market at a discount
Table 4.4 Impact of HIPC Initiative in 24 decision-point cases
Before HIPC debt relief (1998–99) After HIPC debt relief (2001–03)
NPV of total external debt $57 billion $25 billionDebt as a percent of GDP 60% 28Average debt service as a percent of exports 16.8 8.2Average debt service as percent of GDP 3.7 2.1Average debt service as a percent of revenue 27.4 11.9Average social spending as percent of GDP 5.8 6.9Average social spending as percent of revenue 35.5 39.9
Source: World Bank.

S T R E N G T H E N I N G O F F I C I A L F I N A N C I A L S U P P O R T F O R D E V E L O P I N G C O U N T R I E S
in order to maximize recovery through litigation.33
Given the relatively small number of creditors in-volved, these problems will not likely undo theachievements of the HIPC Initiative. However, thelitigation alone could prove to be very costly for in-dividual HIPCs in terms of legal representation andthe implications of adverse judgments.
Postconflict countries present a specialchallengeThe most important challenge for the HIPC Initia-tive in the year ahead is to bring the remaining eli-gible countries to their decision points as quicklyas possible, so that these countries can begin to re-ceive debt relief. This challenge presents special dif-ficulties since most of these countries have recentlyemerged from, or are still engaged in, armed con-flict, and many of them are struggling with gover-nance issues. At the same time, these countrieshave a particularly acute need for debt relief be-cause of their major reconstruction requirementsand the urgent need for speedy and effective actionto help break the cycle of violence, low growth,and severe poverty.
The framework of the HIPC Initiative has theflexibility to front-load assistance to countries af-fected by conflict, and a relatively large share ofdebt relief can be made available at an early stage,taking into account the profile of debt service pay-ments due and the absorptive capacity of the coun-try. To ensure progress toward sustainable growth,the structural and social triggers for the comple-tion point will be customized to reflect the particu-lar set of priorities and needs of the postconflictcountries. For example, improvement in fiscalmanagement and demobilization of excombatantswere part of the completion point conditions forGuinea-Bissau.
Strengthening the effectiveness ofofficial guarantees
In addition to aid flows, official agencies channelresources to developing countries through guar-
antees of private sector loans and investments. Ex-port credit agencies’ total exposure to developingcountries reached an estimated $500 billion at theend of 2000—one-quarter of developing countries’total long-term external debt. Export credit agen-
cies’ new commitments to developing countriesrose to an average $75 billion a year in the first halfof the 1990s (mirroring the steep rise in privateflows), and then declined in the wake of the Asiancrisis.34 Nevertheless, new commitments remainedat $50 billion in 2000, or 40 percent of all commit-ments from private creditors, excluding bonds.
Export credit agencies have become increas-ingly more involved in investment insurance.35 TheBerne Union member agencies extended $13 bil-lion of insurance against FDI projects in develop-ing countries in 2000 (five times more than in1990), and the total investment under cover bymember agencies (the outstanding exposure orstock) rose to $58 billion at end-2000, comparedwith $9 billion in 1990. This strong growth in in-vestment insurance mirrors the surge in direct in-vestment flows (investment insurance by BerneUnion members has covered on average around 12percent of the FDI flows to developing countries)and has been important in privatization and pri-vate sector involvement in the provision of infra-structure services.
Multilateral institutions are expanding theirguarantee activitiesMultilateral institutions also expanded their guar-antee activities during the 1990s. The guaranteeprograms of the World Bank Group, which are in-tended to serve as a catalyst for private sector activ-ities in developing countries, supported $18 billionin flows in the second half of the 1990s, double the level of guarantees extended in the period1990–95. Moreover, the financing leveraged bythese guarantees is substantial: International Bankfor Reconstruction and Development partial creditand partial risk guarantees of $2 billion helpedgalvanize almost $20 billion in total project costs.In poor counties, partial risk guarantees from IDAhelp insure private lenders against country risksthat are beyond the control of investors. To date,three countries—Bangladesh, Côte d’Ivoire, andUganda—have benefited from an IDA partial riskguarantee for a power project. The three guaran-tees total $206 million, and the aggregate projectcosts are $1 billion. The Multilateral InvestmentGuarantee Agency (MIGA) is in the forefront of ef-forts to facilitate investment in poor countries andto ensure that projects have a significant develop-mental impact. Since 1988, MIGA has issued 550
107

G L O B A L D E V E L O P M E N T F I N A N C E
guarantees for projects in 79 developing countries.Total coverage issued exceeds $9 billion, bringingthe estimated amount of foreign direct investmentfacilitated since inception to more than $42 billion.Poor countries accounted for over 20 percent ofMIGA’s gross portfolio on June 20, 2001, spreadacross 26 countries. The regional developmentbanks, including the Inter-American DevelopmentBank, the Asian Development Bank, the EuropeanBank for Reconstruction and Development, andsome of the smaller regional banks, have also de-veloped wide-ranging guarantee programs.
Poor countries rely on guarantees for largeexternal financial commitments—Official guarantees have supported a limited vol-ume of finance to the poor countries, comparedwith other developing countries. The export creditagencies’ total exposure to the poor countriesequals $40 billion at end-2000, or only 8 percentof the agencies’ total exposure to developing coun-tries. Most poor countries are not able to supportlarge inflows of guaranteed finance, which is typi-cally provided at nonconcessional terms. Neverthe-less, export credit agencies are important for thepoor countries: the agencies account for some 16percent of the poor countries’ long-term debt.36
New commitments to the poor countries from ex-port credit agencies were $2.4 billion in 2000, or80 percent of gross capital market financing fromprivate sources. Officially supported export creditscan provide financing that would not otherwise beavailable from private sources, or that would beavailable only at prohibitive terms. In poor coun-tries, official guarantees are nearly always requiredto access external finance for large projects; everymajor bank commitment over $20 million over thepast five years has had some official guarantee. Of-ficial investment insurance also has helped facili-tate investment flows to more than one-third of thepoor countries, and it provided for about 30 per-cent of all FDI in poor countries.
Guarantee arrangements have played a particu-larly important role in facilitating greater privatesector participation in infrastructure and in miningprojects that require large investors (see box 4.4 onthe Mozambique Mozal project). Access to offi-cially supported export credits also may help builda reputation that facilitates access to nonguaranteedfinance in the future. For example, in China two-thirds of all private source finance was guaranteed
by export credit agencies in 1990, while today only25 percent is guaranteed. Similar trends are evidentfor Latin American borrowers such as Chile andBrazil, and for Malaysia and Thailand prior to the1997 crisis.37
—but these facilities have also increased poorcountries’ debtWhile export credit agencies have made an impor-tant contribution to boosting the real resourcesavailable to poor countries, access to guaranteed fi-nance also has contributed to unsustainable debtburdens. During the past decade, the HIPC coun-tries have received almost $20 billion in loancommitments guaranteed by export credit agencies, and export credit commitments to HIPCs averaged $1.8 billion per year from 1990–96, when the HIPCInitiative began. Since then, steps have been takento ensure that the debt reduction under the HIPCInitiative is associated with efforts to avoid incur-ring additional debt on nonconcessional terms. TheHIPC Initiative framework provides that new exter-nal finance for these countries should be predomi-nantly in the form of grants or loans on highly con-cessional terms. The injunction on nonconcessionalborrowing was reinforced by the communiqué ofthe Development Committee in April 1999 andmore recently by U.S. legislation that governs U.S.contributions to the HIPC Trust Fund.38 The IMFalso agrees with HIPC governments regarding limitson nonconcessional borrowing within the contextof the Fund’s concessional facility. These limits areestablished on a case-by-case basis, after an evalua-tion of the impact of new borrowing on the sustain-ability of the debt burden.
Some HIPCs are reducing their reliance onguaranteed loansHIPCs that have reached a decision point, andhence have a policy framework in place that isagreed-on with the international community, haveseen a reduction in export credit commitmentsfrom $0.9 billion per year in 1990–96 to $0.5 bil-lion from 1997–2000. Moreover, in these coun-tries very little by way of new export credits aregoing to public sector borrowers, with the bulk ofthe finance absorbed by the private sector. Coun-tries within the HIPC group that have continuedto attract significant export credit financing in-clude those with sustainable debt burdens and im-portant oil producers (for example Angola) or off-
108

S T R E N G T H E N I N G O F F I C I A L F I N A N C I A L S U P P O R T F O R D E V E L O P I N G C O U N T R I E S
109
shore marine financing centers (Liberia) that canpledge assets as collateral.
Rethinking the costs and benefits of guarantees—Export credit agencies are also taking steps to en-sure that the activities they support (including guar-antees and insurance) produce real economic andsocial benefits that are worth the buildup of debt.Several export credit agencies employ processes thatscreen projects for their effectiveness and are look-ing beyond standard issues such as environmentand gender screening to include debt sustainabilityand development impact. In the United Kingdom,
for example, the Export Credit Guarantee Depart-ment, in collaboration with the Department forInternational Development, has instituted a produc-tive expenditure screening process that applies to allIDA-only countries. Public sector projects in poorcountries are reviewed to ensure that the projectsupports the borrowing country’s public expendi-ture priorities. For private sector projects the em-phasis is on meeting environmental and social stan-dards and examining the risks of the debt beingassumed by the public sector or compromising theborrowing country’s overall debt management stra-tegy. Export credit agencies are also taking steps toimplement common anticorruption measures, to re-
Official guarantees have helped attract external financefor the Mozal aluminum smelter, the single largest
private sector investment ever undertaken in Mozambiqueand one of the largest projects to be developed on a lim-ited recourse basis in Sub-Saharan Africa. The first phaseof the project ($2.3 billion for the aluminum smelter) is al-ready completed, and the second phase, which will doublecapacity, is under construction. Partially as a result ofMozal’s success, private sector projects worth another$6.5 billion are in the pipeline.39 Forty percent of the fi-nancing requirements were met by equity provided by thesponsors, the Billiton Group,40 Mitsubishi Corporation ofJapan, the Industrial Development Corporation of SouthAfrica, and by the government of Mozambique. Loan fi-nancing was met by officially supported export credits,and loans and guarantees from the European InvestmentBank and the International Finance Corporation (IFC) and several development finance agencies, including onesfrom Germany, South Africa, and France. The perceivedpolitical and commercial risks involved in the project were high, and the participation of IFC and official guarantorswere an essential catalyst to draw in funding from privatecreditors.
The success of securing financing was largely due to a well-structured project with leading international spon-sors, supported by Mozambique’s impressive reform pro-gram and rapid recovery from the war. The country’sproximity to South Africa and the return to operation ofthe Cahora Bassa hydroelectric power dam have also en-abled Mozambique to become one of the few HIPC coun-tries to have attracted substantial private sector invest-ment from external sources. In addition, the project hasbeen supported by a package of incentives, including ex-emptions from taxes on imported materials, corporate
profits, and the income of foreign workers; allowance ofrepatriation of all dividends; and a first call on earningsfor debt service payments. Such incentives are available toall exporting industries in Mozambique. The cost of en-ergy was an important factor, and favorable rates werenegotiated with the South African power utility. The gov-ernment will receive 1 percent of the gross income fromsales.
The Mozal plant, which is already in production, willdouble the country’s total exports and add an estimated 7percent to GDP, although the contribution to employmentis limited (the project added 5,000 temporary workers dur-ing the construction phase but only 800 full-time, perma-nent jobs). As other planned projects develop exportsshould rise, by nearly 30 percent of GDP in 2010, al-though this will be partially offset by higher imports ofraw materials, debt service on loans, and remittance ofprofits and wages of foreign workers. The net impact onthe balance of payments in 2010 is estimated at less than 3 percent of GDP. Other benefits include infrastructuredevelopment, industrialization, and the promotion ofregional integration.
These benefits must be balanced against the risk fromthe project’s contribution to higher private sector debt.Borrowing by the private sector has already risen from anaverage of $36 million between 1990–98 to $340 millionin 1999–2000, and it is expected to average well over $400 million over the next four to five years. Private sectordebt service is projected to rise to 20 percent of exportsover the next five years, assuming all the proposed projectsare realized. While the projects promise to generate suffi-cient returns to cover debt service payments, the expectedjump in the private sector’s debt and debt service point tothe need for vigilant monitoring by the authorities.
Box 4.4 Official guarantees and the Mozal project

G L O B A L D E V E L O P M E N T F I N A N C E
voke insurance cover if corrupt practices are identi-fied, and to blacklist corrupt companies.
—and limiting tied aidExport credit agencies also are making progress toreduce the practice of attaching tied aid to exportcredit programs. In the past, export credit agencieshave combined their own financing with officialaid to create financing packages referred to as“mixed credits” or “parallel financing,” where atleast some part of the package is tied to the pro-curement of goods and services from specific coun-tries. The practice of tied aid can impair the effec-tiveness of donor support for developing countriesby increasing project costs, making procurementprocedures more complex, and skewing decisionson technology and capital intensity. Under theterms of the OECD Arrangement on Guidelines forOfficially Supported Export Credits, projects thatare deemed to be financially viable with commer-cial loans will not receive any tied aid.
Annex 4.1
Aid definition and measurementDefining aid. The international forum for definingaid is the OECD DAC.41 There are two categoriesof aid provided by DAC donors: ODA and officialaid (OA). The DAC list of aid recipients is dividedinto Part I and Part II recipients. Only countries onPart I receive ODA; those on Part II (which includesseveral countries in Eastern and Central Europe,and Israel) receive OA. Only ODA may be countedby DAC countries as part of their “aid effort.”
ODA and OA are defined the same way: bothconsist of loans or grants to developing countries
and territories by donor governments and theiragencies that are developmental in intent and de-signed to promote economic welfare. ODA andOA loans are provided on concessional financialterms, with at least a 25 percent grant element (cal-culated as the NPV of the future payment streamdiscounted at 10 percent).
Measuring aid. Aid flows to developing coun-tries can be measured in two ways: when aid per-formance by DAC donors is measured, ODA in-cludes bilateral disbursements of concessionalfinancing to developing countries plus the pro-vision by bilateral donors of concessional financ-ing to multilateral institutions (for example, IDA).When resource receipts by developing countriesare measured, ODA (and, where relevant, OA) in-clude disbursements of concessional financingfrom bilateral agencies and multilateral sources.The two measures will not be the same because theconcessional funding received from donor sourcesby multilateral institutions does not match thoseinstitutions’ disbursements to developing countriesin any given year.
Aid and debt forgiveness. The directives forreporting aid statistics are agreed-on within theOECD DAC, and these include specific guidelineson the measurement of debt forgiveness. The im-pact on aid volumes varies depending on whetherthe claim being forgiven is an official developmentloan that was originally disbursed from the aidbudget or a commercial loan extended or guaran-teed by an official export credit agency. The for-giveness of an ODA loan does not give rise to anynew net disbursement of aid. Statistically the bene-fit is reflected in the fact that because the cancelledor “forgiven” repayments will not take place, netODA disbursements will not be reduced. The for-giveness of a non-ODA claim has an impact on netODA. Such forgiveness can be counted by donorsas part of their overall aid effort at the time theclaim is forgiven. Statistically forgiveness of a non-ODA claim does give rise to a new disbursementof aid and net ODA disbursements will increase.
Official development finance. The concept ofofficial development finance is broader than that ofaid. It measures all receipts from official creditors.It includes (a) ODA and OA from bilateral sources,(b) grants and concessional and nonconcessionaldevelopment lending by multilateral agencies, and(c) other official bilateral flows that are considered
110
Table 4.5 Export credit commitments to HIPCs,1990–2000(annual averages in billions of dollars)
1990–96 1997–2000
HIPCs at decision point 0.9 0.6HIPCs with sustainable debt 0.4 0.6Others 0.5 0.6Total 1.8 1.7
Source: OECD.
S T R E N G T H E N I N G O F F I C I A L F I N A N C I A L S U P P O R T F O R D E V E L O P I N G C O U N T R I E S
to be developmental in intent but for which thegrant element is too low to qualify as ODA or OA.
Export credits: data sources and coverageData on export credits need to be interpreted withcare. Export credit agencies typically provide insur-ance cover for repayment of both principal and in-terest; data provided to the Berne Union and to theOECD are based on agencies’ exposure, includingfuture interest payments. Also, agencies typicallyreport the full value of contracts, including undis-bursed amounts. It is therefore difficult to relatecommitment data to actual disbursements. Specificcomplications arise when nonpayment by thedebtor gives rise to arrears and rescheduling. Mostagencies include arrears and rescheduled claims, in-cluding capitalized interest, in their reports to theBerne Union and the OECD, but interest accruedon arrears is not recorded as an increase in claimsby the export credit agency. Similarly when unre-covered claims are regularized through a ParisClub rescheduling agreement, agencies do not re-cord an increase in exposure in their reports to theBerne Union or the OECD despite the fact that thelonger repayment periods on rescheduled claims in-creases the future interest at risk. The recording ofrescheduling arrangements on concessional terms(that is with an element of debt reduction) alsovaries across agencies making the data for debtorcountries experiencing debt servicing problemsparticularly hard to interpret.
The data provided by the export credit agen-cies are collected by both the Berne Union and theOECD. The Berne Union quarterly survey of mem-ber agencies includes data for about 60 developingcountries and economies in transition on outstand-ing commitments, unrecovered claims, outstandingoffers, and new commitments. The most attractiveelement of the Berne Union survey is that data arecollected in the way most agencies actually keeptheir books; the concept commitment encompassesinsured principal and, in most cases, interest onundisbursed as well as disbursed credits. This facili-tates consistency in reporting and avoids errors thatcan arise when agencies are asked to make esti-mates of statistical concepts for which they have nohard numbers. The Berne Union data are availablewith a substantially shorter time lag than data fromother sources. The data also provide a breakdownof total exposure into commitments on outstanding
credits (representing a risk of future claims) and ar-rears and unrecovered claims (resulting from non-payment and claims payments by agencies).
A limitation of the Berne Union data is thatthey are not readily comparable with other types ofdebt statistics, and they do not accurately reflecttrends in new disbursements. Some agencies do notreport export credit activity by the government(which may undertake export credit finance sepa-rately from the export credit agency). Most agen-cies include the insurance of certain transactionsthat are not exports; for example, insuranceagainst exchange rate movements or insurance ofpreshipment risks, which do not involve exportcredits. Data presented in the annual reports ofsome export credit agencies refer to the full valueof the exports supported, a measure that includesdown payments by the buyer as well as self partici-pation by the exporter in the credit.
The OECD compiles two types of data on ex-port credits. The Statistics on External Indebted-ness reports the stock of export credits on a basisbroadly consistent with other external debt data:this is covering outstanding disbursed principalonly. However, since this does not reflect the waymost export credit agencies keep their accounts,estimation by either the reporting country or thestaff of the OECD is required. The second set ofdata from the OECD is compiled by the Secre-tariat of the Export Credit Group, which recordsthe flow of new commitments of export creditswith initial maturities of over one year, and initialmaturities of over five years, as well as the stock ofofficially supported short-term credits.
Notes1. Aid is defined as grants plus concessional loans.2. Of course, aid devoted to reducing poverty will also
have an impact on education, health, and the environment.Thus these calculations are not entirely additional to the fore-cast of aid required to halve poverty. See World Bank 2001i.
3. These include Bolivia, Burkina Faso, Honduras, Mau-ritania, Mozambique, Nicaragua, Tanzania, and Uganda.
4. See http://www.worldbank.org/poverty/strategies/review/index.htm
5. See Interim Guidelines for PRSCs, available atwww.worldbank.org.
6. In some cases, progress is not fast enough, while inothers there has even been a deterioration (for instance, 14countries saw increases in child mortality between 1990 and1999).
111

G L O B A L D E V E L O P M E N T F I N A N C E
7. See World Bank 2001a.8. Ten countries or territories were removed from the
list of ODA recipients on January 1, 2000: Aruba, FrenchPolynesia, Gibraltar, the Republic of Korea, Libya, Macao,the Netherlands Antilles, New Caledonia, Northern Mari-anas, and the Virgin Islands.
9. In a few high-inflation countries where the domesticretail market is substantially dollarized, foreign exchangesold by the central bank could be used to buy nontradablegoods, and thus contribute to inflationary pressures.
10. While aid should be treated as revenue in the fiscalaccounts, it is not equivalent to revenue generated by taxes:(a) aid augments the resources available to the economywhereas taxation merely transfers them from the privatesector to the government; (b) unlike taxation, aid does notdistort relative prices; and (c) aid has radically lower costsof administration than taxes.
11. For example, for the International DevelopmentAssociation (IDA), the grant element is roughly 70 percent.Thus 70 percent of an IDA loan should be viewed as rev-enue, and 30 percent as a commercial loan. This approachdoes face some practical difficulties, in part because the exante calculation of the grant element depends on expecta-tions regarding future exchange rates and interest rates, andin part because it could introduce inconsistencies betweenfiscal and external accounts.
12. Appropriately, both studies measured the volatilityof aid in constant dollars, which provides an indication ofthe real value of aid resources available to the economy.Bulir and Hamann (2001) find that aid is significantly morevolatile than revenues if both variables are expressed as ashare of GDP, or if only the relatively aid-dependent coun-tries are considered.
13. See World Bank 2000c, chapter 4.14. One major aid program, IDA, has explicit alloca-
tion criteria, and the bilateral donors also follow criteriathat are well understood (Alesina and Dollar 2000), so it ispossible to define the conditions under which aid may fall.
15. A few of the earlier studies did find a positive im-pact of aid on growth (Dowling and Hiemenz 1983; Levy1988; and Hadjimichael and others 1995).
16. Hansen and Tarp (2001) criticize the Burnside andDollar result that policies enhance aid effectiveness as non-robust to choice of sample. However, Collier and Dehn(2001) show that even on the Hansen-Tarp sample theBurnside-Dollar result holds up, once terms-of-trade shocksare included in the specification.
17. A one-off expenditure of $1 billion would result ina temporary phase of higher growth, but this temporarygrowth would take the economy to a permanently higherlevel of income. Thus, the poverty reduction produced evenby a one-off injection of IDA funds is permanent.
18. Africa is probably the only region in which theDutch disease effects of aid need to be considered, since aidas a share of both GDP and exports is much higher than inany other region.
19. With growth as the dependent variable, Collier andDollar (2001a) find that the coefficient on the square of aid issignificant and negative, indicating diminishing returns to aid.
20. However, Lensink and White (1999) found that aidin excess of 40 percent of GDP lowers the growth rate.
21. The Collier and Dollar results are based on GDPvalued at purchasing power parity, which provide a standardmeasure allowing comparison of real price levels betweencountries (see World Bank 2001j), while this calculation usesGDP valued at dollars. Since the GDP of a developing coun-try valued at purchasing power parity is typically larger thanGDP valued in dollars, this calculation understates the num-ber of poor countries where increased levels of aid will con-tinue to have a positive impact on growth.
22. The increase in aid to India, which has about one-third of the world’s extreme poor but only gets about 5 per-cent of total aid, is constrained to $10 billion. Absent thisadjustment, the framework would imply massive and unre-alistic increases in aid to India.
23. Based on case studies of African countries. See also Mercer-Blackman and Unigovskaya 2000, and Jayara-jah and Branson 1995. In some cases, the complexity ofconditions contributed to compliance failure.
24. See World Bank 1998 and 2001b.25. The relationship between donors and recipients
has been modeled both as the outcome of a bargaining game(Mosley, Harrigan, and Toye 1991) and in a frameworkwhere recipients are viewed as agents, implementing condi-tions desired by donors (Killick 1997; White and Morrissey1997; Svensson 2000).
26. See Mosley, Harrigan, and Toye 1991; and Adam1995.
27. However, measuring the extent of implementationof structural adjustment programs is problematic, becauseprograms are intended to be flexible and are routinely mod-ified or renegotiated during the course of implementation.
28. Weighted by disbursements, the scores for out-comes increased from 73 percent satisfactory in fiscal1990–94 to 97 percent in fiscal 1999–2000.
29. The NPV refers to the discounted value of futuredebt service payments, where the discount rate is some mar-ket rate. This concept was introduced to measure the impacton the debt burden of different terms on rescheduling. Italso provides a comparable measure of the debt burdenamong countries when a substantial share of outstandingclaims is at concessional rates.
30. The 24 countries that have reached a decisionpoint are Benin, Bolivia, Burkina Faso, Cameroon, Chad,Ethiopia, Gambia, Guinea, Guinea-Bissau, Guyana, Hon-duras, Madagascar, Malawi, Mali, Mauritania, Mozam-bique, Nicaragua, Niger, Rwanda, Senegal, São Tomé andPrincipe, Tanzania, Uganda, and Zambia.
31. Compared to actual debt service paid prior toHIPC assistance in 1998–99.
32. See Claessens and others (1996) on the importanceof removing the debt overhang facing the HIPCs, and WorldBank (2001g) for key aspects of maintaining external debtsustainability.
33. See World Bank (2001h) for a more detailed dis-cussion of the status of creditor participation and for exam-ples of litigation by commercial creditors against HIPCs.
34. New commitments include the value of new busi-ness insured, new lending facilities, and guarantees for newFDI (but excluding trade finance with maturities of less thanone year).
112

S T R E N G T H E N I N G O F F I C I A L F I N A N C I A L S U P P O R T F O R D E V E L O P I N G C O U N T R I E S
35. Investment insurance by export credit agencies ex-cludes commercial risks: it is normally limited to coverageof nationalization or expropriation without compensation,losses on investment due to war or civil unrest, and inabilityto convert and transfer or remit profits and dividends.
36. Differences in the definitions used in data from theexport credit agencies and the private markets may distortthis comparison.
37. Berne Union statistics.38. This legislation stipulates that a HIPC country
must commit to not borrow on nonconcessional terms for atleast two years from any multilateral development bankbenefiting from the U.S. contributions.
39. These include a factory to produce iron slabs, a gaspipeline, mining and processing of titaniferous mineralsands, and the expansion of the Mozal smelter.
40. Billiton, formerly a South African company butnow listed on the London Stock Exchange, is the majorshareholder in Mozal with a 47 percent stake. Billiton hassubstantial positions in the markets for aluminum, coal,nickel, ferroalloys, and industrial minerals.
41. Aid is also provided by a few countries that are notmembers of the OECD DAC, including the Republic ofKorea, Turkey, and several oil-exporting countries in theMiddle East.
ReferencesThe word processed describes informally reproduced worksthat may not be commonly available through libraries.
Adam, Christopher. 1995. “Adjustment in Africa: Reforms,Results, and the Road Ahead.” World Economy (U.K.)18 (September): 729–35.
Alesina, Alberto, and David Dollar. 2000. “Who Gives For-eign Aid to Whom and Why?” Journal of EconomicGrowth 51(1): 33–63.
Berg, Elliot. 1991. “African Adjustment Programs: False At-tacks and True Dilemmas.” Paper presented at theConference on Structural Adjustment: Retrospect andProspect. The American University, Department ofEconomics, Washington, D.C.
Bigsten, A., P. Collier, S. Dercon, M. Fafchamps, B. Gau-thier, J.W. Gunning, J. Habarurema, A. Oduro, R.Oostendorp, C. Pattillo, M. Söderdom, F. Teal, and A. Zeufack. 1999. “Exports and Firm-level Efficiencyin African Manufacturing.” Development ResearchGroup, World Bank, Washington, D.C. Processed.
Boone, P. 1994. “The Impact of Foreign Aid on Savings andGrowth.” London School of Economics. Processed.
Boschini, Anne, and Anders Olofsgard. 2001. “Foreign Aid:an Instrument for Fighting Poverty or Communism?”Processed.
Brautigam, Deborah, and Kwesi Botchwey. 1995. “The In-stitutional Impact of Aid Dependence on Recipients in Africa.” Chr. Michelsen Institute Working Paper,Norway.
Brown, Adrienne, Mick Foster, Andy Norton, and FelixNaschold. 2001. “The Status of Sectorwide Ap-
proaches.” Working Paper 142. Overseas Develop-ment Institute, London.
Bulir, A., and J. Hamann. 2001. “How Volatile and Pre-dictable are Aid Flows: and What Are the Policy Impli-cations.” International Monetary Fund, Washington,D.C. Processed.
Burnside, C., and D. Dollar. 2000. “Aid, Policies andGrowth.” American Economic Review 90(4): 846–68.
Checki, Terence J., and Ernest Stern. 2000. “Financial Crisesin the Emerging Markets: The Roles of the Public andPrivate Sectors.” Economics and Finance 6 (13).
Claessens, Stijn, Enrica Detragiache, Ravi Kanbur, and PeterWickham. 1996. “Analytical Aspects of the Debt Prob-lems of Heavily Indebted Poor Countries.” WorldBank Policy Research Working Paper 1618. WorldBank, Washington, D.C.
Collier, P. 1999. “Aid ‘Dependency’: A Critique.” Journal ofAfrican Economies 9 (4): 528–45.
Collier, P., and J. Dehn. 2001. “Aid, Shocks and Growth.”Policy Research Working Paper 2688, World Bank,Washington, D.C.
Collier, P., and D. Dollar. 2001a. “Aid Allocation andPoverty Reduction.” Policy Research Working Paper2041. The World Bank, Washington, D.C.
———. 2001b. “Development Effectiveness: What HaveWe Learnt?” Development Research Group, WorldBank, Washington, D.C. Processed.
———. 2001c. “Aid, Risk, and the Special Concerns ofSmall States.” In Small States in the Global Econ-omy, D. Peretz. Economic Paper 44, CommonwealthSecretariat.
Collier, P., and A. Hoeffler. 2000. “Aid, Policy and Peace:Reducing the Risks of Civil Conflict.” World Bank,Washington, D.C. Processed.
Dasgupta, Dipak, and Dilip Ratha. 2000. “What FactorsAppear to Drive Private Capital Flows to DevelopingCountries? And How Does Official Lending Re-spond?” Policy Research Working Paper 2392. WorldBank, Washington, D.C. July.
Disch, Arne. 2000. “Aid Coordination and Aid Effective-ness.” Report to the Norwegian Ministry of ForeignAffairs. Processed. http://odin.dep.no/archive/ud-bilder/01/01/Rappo015.pdf.
Dollar, David, and William Easterly. 1998. “The Search forthe Key: Aid, Investment, and Policies in Africa.”World Bank, Development Research Group, Washing-ton D.C.
Dollar, David, and J. Svensson. 2000. “What Explains theSuccess or Failure of Structural Adjustment Pro-grams.” Economic Journal 110(466): 894–917.
Dowling, J. M., and U. Hiemenz. 1983. “Aid, Savings andGrowth in the Asian Region.” The DevelopingEconomies 21 (1): 1–13.
Durbarry, Ramesh, Normal Gemmell, and David Greenaway.1998. New Evidence on the Impact of Foreign Aid onEconomic Growth. Centre for Research in EconomicDevelopment and International Trade Research Paper1998/8. University of Nottingham, United Kingdom.
Easterly, William. 1999. “How Did Highly Indebted PoorCountries Become Highly Indebted? Reviewing Two
113

G L O B A L D E V E L O P M E N T F I N A N C E
Decades of Debt Relief.” Working Paper No. 2225,World Bank, Washington, D.C.
Eisenblatter, Bernd. 1999. “Globalization and aid policies.New Forms of Donor Cooperation and Coordina-tion—Effects and Experiences.” Quarterly Journal ofInternational Agriculture 38 (4): 375–394.
Eriksson, John. 2001. “The Drive to Partnership: Aid Coor-dination and the World Bank.” World Bank, Washing-ton, D.C.
Griffin, K. 1971. “Foreign Capital: A Reply to Some Crit-ics.” Bulletin of the Oxford University Institute ofEconomics and Statistics 32 (2): 156–61.
Guillaumont, P., and L. Chauvet. 2001. “Aid and Perfor-mance: A Reassessment.” Journal of DevelopmentStudies 37 (6).
Hadjimichael, M. T., D. Ghura, M. Muhleisen, R. Nord, andE. M. Ucer. 1995. “Sub-Saharan Africa Growth, Sav-ings, and Investment, 1986–93.” International Mone-tary Fund Occasional Paper no. 118. Washington, D.C.
Hansen, H., and F. Tarp. 2001. “Aid and Growth Regres-sions.” Journal of Developing Economies 64 (2):547–70.
Hoffman, P. T., and K. Norberg, eds. 1994. Fiscal Crises,Liberty, and Representative Government, 1450–1789.Stanford, Calif.: Stanford University Press.
IMF (International Monetary Fund). 1998. “External Eval-uation of the ESAF: Report by a Group of IndependentExperts.” Washington, D.C.
Jayarajah, C., and W. Branson. 1995. “Structural and Sec-toral Adjustment: World Bank Experience, 1980–92.”Operations Evaluation Department, World Bank,Washington, D.C.
Jepma, Catrinus. 1991. The Tying of Aid. Paris: Develop-ment Center of the OECD.
Johnson, J., and S. Wasty. 1993. “Borrower Ownership ofAdjustment Programs and the Political Economy ofReform.” Discussion Paper 199. World Bank, Wash-ington, D.C.
Kharas, Homi, and Hisanobu Shishido. 1991. “The Transi-tion from Aid to Private Capital Flows.” In Uma Leleand Ijaz Nabi, eds., Transitions in Development: TheRole of Aid and Commercial Flows. San Francisco:ICS Press.
Killick, Tony. 1997, “Principals, Agents, and the Failings ofConditionality.” Journal of International Development9: 483–95.
Killick, Tony, with Ramani Gunatilaka, and Ana Marr.1998. Aid and the Political Economy of PolicyChange. London: Routledge.
Knack, Stephen. 2000. “Aid Dependence and the Quality ofGovernance: Cross-Country Empirical Tests.” PolicyResearch Working Paper 2396. World Bank, Washing-ton, D.C.
Kraay, Art. 1999. “Exportations et performances economi-ques : etude d’un panel de enterprises chinoises.” Revued’Economie du Developpement (France) 7 (1–2):183–207.
Krueger, Anne O. 1998. “Whither the World Bank and theIMF?” Journal of Economic Literature 36: 1983–2020.
Lancaster, Carol. 1999. Aid to Africa. University of ChicagoPress.
Laplagne, Patrick, Malcolm Treadgold, and Jonathan Baldry.2001. “A Model of Aid Impact in some South PacificMicrostates.” World Development 29 (2): 365–383.
Lensink, Robert, and Oliver Morrissey. 2000. “Aid instabil-ity as a measure of uncertainty and the positive impactof aid on growth.” Journal of Development StudiesFebruary. London.
Lensink, Robert, and Howard White. 1999. “Is There anAid Laffer Curve?” University of Nottingham (U.K.),Centre for Research in Economic Development and In-ternational Trade. Credit Research Paper 99/6.
Lerrick, Adam. 1999. “Has the World Bank Lost Its Way?”Euromoney December.
Levy, V. 1988. “Aid and Growth in Sub-Saharan Africa: TheRecent Experience.” European Economic Review 32:1777–1795.
Lister, Stephen, and Mike Stevens. 1992. Aid Coordinationand Management. Washington, D.C.: World Bank.Processed.
Maizels, A., and M. K. Nissanke. 1984. “Motivations forAid to Developing Countries.” World Development 12(9).
McCleary, William. 1991. “The Design and Implementationof Conditionality.” In Thomas, Vinod, Ajay Chhibber,Mansoor Dailami, and Jaime de Melo, eds. Restruc-turing Economies in Distress: Policy Reform and the World Bank. New York: Oxford University Press,pp. 197–215.
Mercer-Blackman, Valerie, and Anna Unigovskaya. 2000.“Compliance with IMF program indicators andgrowth in transition economies.” IMF Working PaperWP/00/47, Washington, D.C.
Morrissey, Oliver, and Howard White. 1994. “Evaluatingthe Concessionality of Tied Aid.” Institute of SocialStudies Working Paper: Subseries on Money, Finance,and Development (Netherlands) No. 53/January: 1–18.
Mosley, Paul. 1986. “Politics of Economic Liberalization:USAID and the World Bank in Kenya 1980–84.”African Affairs (U.K.) 85 (January): 107–19.
———. 1999. “Recent changes in aid technology: is theWhite Paper an adequate response?” Public Adminis-tration and Development 19 (29).
Mosley, Paul, J. Harrigan, and J. Toye. 1991. Aid andPower: The World Bank and Policy Lending, Vol. 1.London: Routledge.
OECD (Organisation for Economic Co-operation and De-velopment). 2001. “Untying Aid to the Least Devel-oped Countries.” OECD Observer Policy Brief, Paris.
Pallage, Stephane, and Michel Robe. 1998. Foreign Aid andthe Business Cycle. Center for Research on EconomicFluctuations and Employment Working Paper no. 63.University of Quebec at Montreal.
Pearson, Lester B. 1969. “Partners in Development: Reportof the Commission on International Development.”New York: Praeger.
Reichel, Richard. 1995. “Development Aid, Savings andGrowth in the 1980s—A Cross-Section Analysis.” Sav-ings and Development 19 (3): 279–96.
Rodrik, Dani. 1996. “Understanding economic policy re-form.” Journal of Economic Literature 34 (March):9–41.
114

S T R E N G T H E N I N G O F F I C I A L F I N A N C I A L S U P P O R T F O R D E V E L O P I N G C O U N T R I E S
Sachs, J., and M. Warner. 2000. “Natural Resource Abun-dance and Economic Growth’. In Leading Issues inEconomic Development, 7th ed. G.M. Meier and J.E.Rauch, Oxford University Press.
Sekkat, Khalid, and Aristomene Varoudakis. 2000. “Ex-change Rate Management and Manufactured Exportsin Sub-Saharan Africa.” Journal of Development Eco-nomics 61: 237–253.
SIDA (Swedish International Development Agency). 1999.“Dollars, Dialogue and Development” An Evaluationof Swedish Programme Aid http://www.sida.se/Sida/jsp/Crosslink.jsp?d=410
Snyder, Donald. 1990. “Foreign Aid and Domestic Savings:A Spurious Correlation?” Economic Development andCultural Change 39 (October): 175–81.
Soderling, Ludvig. 2000. “Dynamics of Export Perfor-mance, Productivity and Real Effective Exchange Ratein Manufacturing: the Case of Cameroon.” Journal ofAfrican Economies 9 (4): 411–29.
Summers, Lawrence. 1999. “A New Framework for Multi-lateral Development Policy.” Remarks to the Councilon Foreign Relations, New York, March 20, www.treas.gov/press/releases/ps477.htm. See also his testi-mony before the House Banking Committee on March20, 1999, www.treas.gov/press/releases/ps480.htm.
Svensson, Jakob. 2000. “When Is Foreign Aid Policy Credi-ble? Aid Dependence and Conditionality.” Journal ofDevelopment Economics 61: 61–84.
Taslim, M. A., and A. Weliwita. 2000. “The Inverse Relation-ship between Saving and Aid: An Alternative Explana-tion.” Journal of Economic Development 25 (1/June).
Trumbull, William, and Howard Wall. 1994. “EstimatingAid-Allocation Criteria with Panel Data.” The Eco-nomic Journal 104 (July).
USAID (United States Agency for International Develop-ment). 2001. “FY 2000 performance overview.” Wash-ington, D.C. http://www.dec.org/partners/2000_po/pdf_docs/fy2000po.pdf
van Arkadie, Brian. 1986. “Some Realities of Adjustment:An Introduction,” Development and Change 0012–155X 17(3): 371–86. London.
van de Walle, Nicolas, and Timothy Johnston. 1996. “Im-proving aid to Africa.” Policy Essay No. 21. OverseasDevelopment Council, Washington, D.C.
van Wijnbergen, Sweder. 1986. “Macroeconomic Aspects ofEffectiveness of Foreign Aid: On the Two-Gap Model,Home-Goods, Disequilibrium, and Real Exchange
Rate Misalignment.” Journal of International Eco-nomics 21: 82–116.
White, Howard, and Oliver Morrissey. 1997 “Conditional-ity When Donor and Recipient Preferences Vary.”Journal of International Development 9: 497–505.
World Bank. 1997. “Adjustment lending in Sub-SaharanAfrica: an update.” Operations Evaluation Division,Washington, D.C.
———. 1998. “Assessing Aid: What Works, What Doesn’t,and Why?” World Bank Policy Research Report,Washington, D.C. www.worldbank.org/research/aid/
———. 1999. “The Drive to Partnership: Aid Coordinationand the World Bank.” Operations Evaluation Depart-ment, Washington, D.C.
———. 2000a. Global Development Finance. Washington,D.C.
———. 2000b. “Quality at Entry in CY99: A QAG assess-ment.” Quality Assurance Group, Washington, D.C.
———. 2000c. Global Economic Prospects. Washington,D.C.
———. 2001a. “Report of the Task Force on the WorldBank Group and the Middle-Income Countries.”(SecM2001-0204). March 27.
———. 2001b. “Financing for Development.” (SecM2001).August 28.
———. 2001c. Aid and Reform in Africa. Washington,D.C.
———. 2001d. Adjustment Lending Retrospective. Opera-tions Policy and Country Services Department. Wash-ington, D.C.
———. 2001e. Global Development Finance. Washington,D.C.
———. 2001f. “Review of Aid Coordination in an Era ofPoverty Reduction Strategies. IDA 10–12.” OperationsEvaluation Department, Washington, D.C.
———. 2001g. The Challenge of Maintaining Long-TermExternal Debt Sustainability. (http://www.world-bank.org/hipc/hipc-review/hipc-review.html)
———. 2001h. Heavily Indebted Poor Countries (HIPC)Initiative: Status of Implementation. (IDA/SecM2001-0543/1)
———. 2001i. “Goals for Development: History, Prospects,and Costs.” A background paper for the September2001 Development Committee Meeting. Washington,D.C.
———. 2001j. World Development Indicators. Washing-ton, D.C.
115