Embed Size (px)
Citation preview
Global debt flows October 2019
1
Global debt flows Sweet spot comfort for risk assets
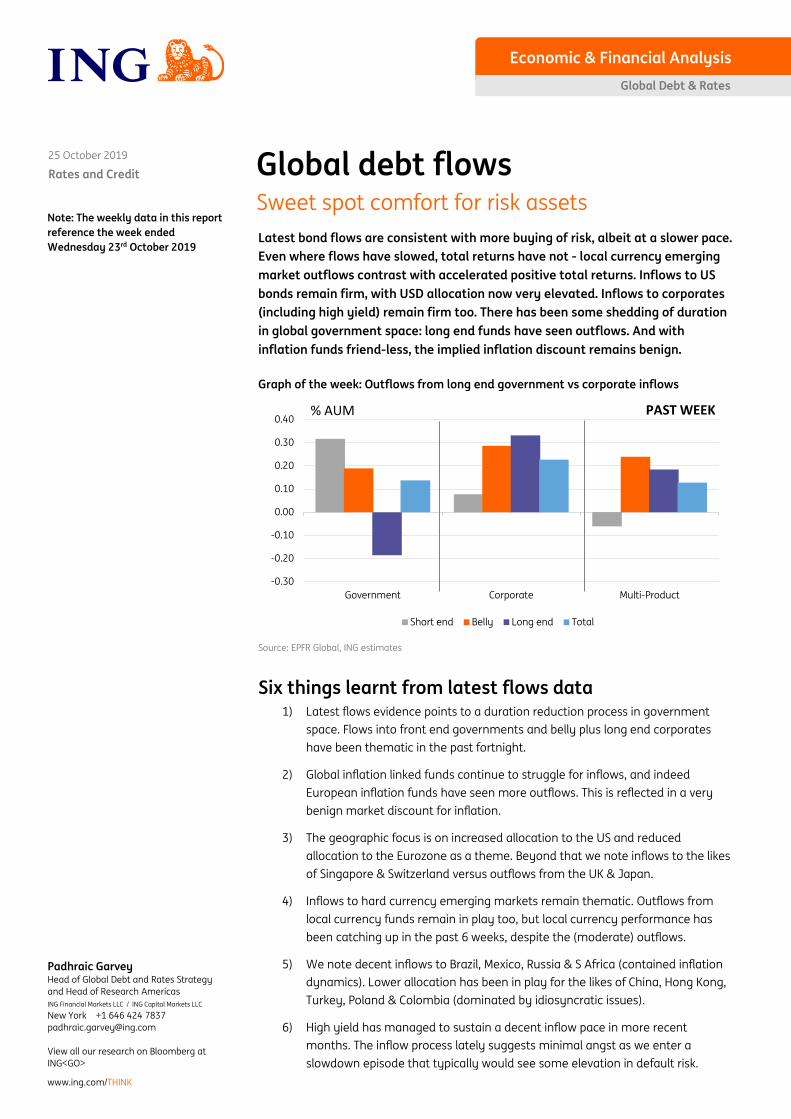
Latest bond flows are consistent with more buying of risk, albeit at a slower pace. Even where flows have slowed, total returns have not - local currency emerging market outflows contrast with accelerated positive total returns. Inflows to US bonds remain firm, with USD allocation now very elevated. Inflows to corporates (including high yield) remain firm too. There has been some shedding of duration in global government space: long end funds have seen outflows. And with inflation funds friend-less, the implied inflation discount remains benign.
Graph of the week: Outflows from long end government vs corporate inflows
Source: EPFR Global, ING estimates
Six things learnt from latest flows data 1) Latest flows evidence points to a duration reduction process in government
space. Flows into front end governments and belly plus long end corporates have been thematic in the past fortnight.
2) Global inflation linked funds continue to struggle for inflows, and indeed European inflation funds have seen more outflows. This is reflected in a very benign market discount for inflation.
3) The geographic focus is on increased allocation to the US and reduced allocation to the Eurozone as a theme. Beyond that we note inflows to the likes of Singapore & Switzerland versus outflows from the UK & Japan.
4) Inflows to hard currency emerging markets remain thematic. Outflows from local currency funds remain in play too, but local currency performance has been catching up in the past 6 weeks, despite the (moderate) outflows.
5) We note decent inflows to Brazil, Mexico, Russia & S Africa (contained inflation dynamics). Lower allocation has been in play for the likes of China, Hong Kong, Turkey, Poland & Colombia (dominated by idiosyncratic issues).
6) High yield has managed to sustain a decent inflow pace in more recent months. The inflow process lately suggests minimal angst as we enter a slowdown episode that typically would see some elevation in default risk.
-0.30
-0.20
-0.10
0.00
0.10
0.20
0.30
0.40
Government Corporate Multi-Product
Short end Belly Long end Total
% AUM PAST WEEK
Note: The weekly data in this report reference the week ended Wednesday 23rd October 2019
Rates and Credit
Economic & Financial Analysis
25 October 2019
Global Debt & Rates
www.ing.com/THINK
Padhraic Garvey Head of Global Debt and Rates Strategy and Head of Research Americas ING Financial Markets LLC / ING Capital Markets LLC
New York +1 646 424 7837 [email protected] View all our research on Bloomberg at ING<GO>

Global debt flows October 2019
2
Contents
Global Manager (average) Allocations by Region 3
Emerging Markets 4 Emerging Markets – Summary themes ........................................................................................... 5 Emerging Markets Net Fund Flows ................................................................................................... 6 Global EM Manager Asset Allocations .............................................................................................. 7 Regional EM Manager Asset Allocation ........................................................................................... 8 Selected EMEA and Latam Country Flows ...................................................................................... 9 Selected Asia and ME/Africa Country Flows ................................................................................ 10
High Yield 11 High Yield – Summary themes ....................................................................................................... 12
Developed Markets 14 Developed Markets – Summary themes ...................................................................................... 15 Global DM Manager Asset Allocations .......................................................................................... 17 Developed Markets Country Flows ................................................................................................ 18
Global debt flows October 2019
3
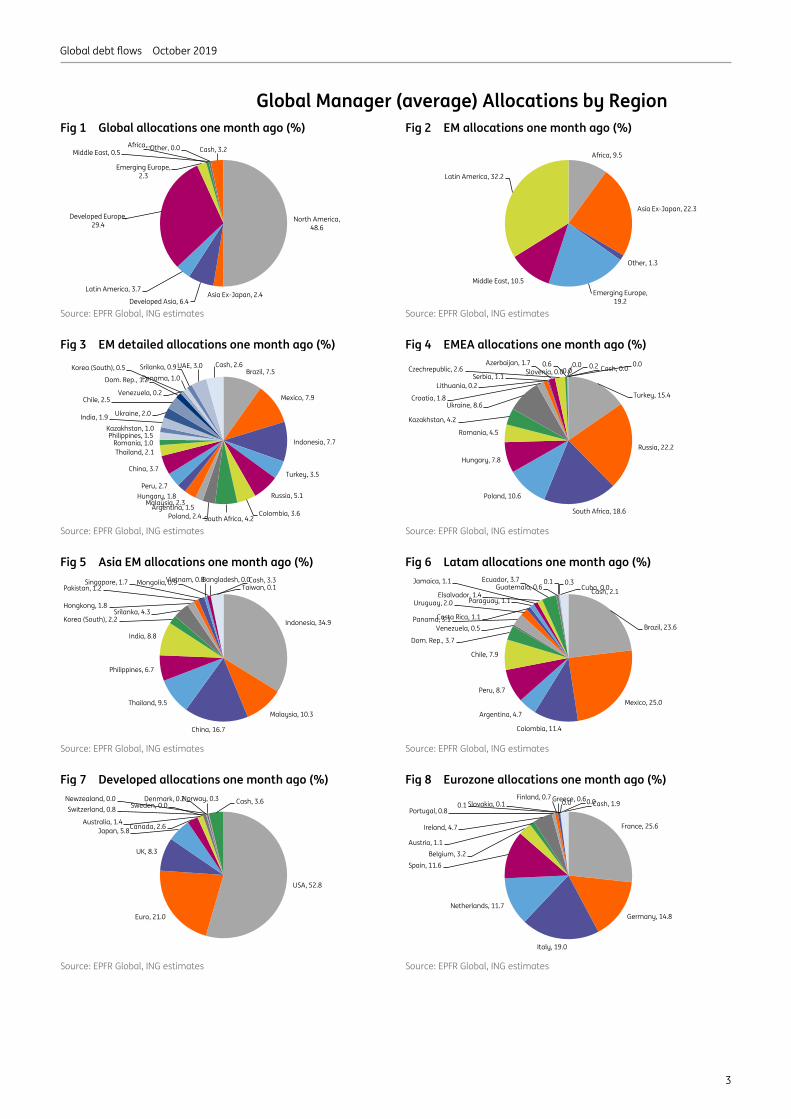
Global Manager (average) Allocations by Region Fig 1 Global allocations one month ago (%) Fig 2 EM allocations one month ago (%)
Source: EPFR Global, ING estimates Source: EPFR Global, ING estimates
Fig 3 EM detailed allocations one month ago (%) Fig 4 EMEA allocations one month ago (%)
Source: EPFR Global, ING estimates Source: EPFR Global, ING estimates
Fig 5 Asia EM allocations one month ago (%) Fig 6 Latam allocations one month ago (%)
Source: EPFR Global, ING estimates Source: EPFR Global, ING estimates
Fig 7 Developed allocations one month ago (%) Fig 8 Eurozone allocations one month ago (%)
Source: EPFR Global, ING estimates Source: EPFR Global, ING estimates
North America, 48.6
Asia Ex-Japan, 2.4Developed Asia, 6.4
Latin America, 3.7
Developed Europe, 29.4
Emerging Europe, 2.3
Africa, …Middle East, 0.5
Other, 0.0 Cash, 3.2Africa, 9.5
Asia Ex-Japan, 22.3
Other, 1.3
Emerging Europe, 19.2
Middle East, 10.5
Latin America, 32.2
Brazil, 7.5
Mexico, 7.9
Indonesia, 7.7
Turkey, 3.5
Russia, 5.1
Colombia, 3.6South Africa, 4.2Poland, 2.4
Argentina, 1.5Malaysia, 2.3
Hungary, 1.8Peru, 2.7
China, 3.7
Thailand, 2.1Romania, 1.0
Philippines, 1.5Kazakhstan, 1.0
India, 1.9 Ukraine, 2.0
Chile, 2.5
Dom. Rep., 1.2
Korea (South), 0.5
Venezuela, 0.2
Panama, 1.0Srilanka, 0.9 UAE, 3.0 Cash, 2.6
Turkey, 15.4
Russia, 22.2
South Africa, 18.6
Poland, 10.6
Hungary, 7.8
Romania, 4.5
Kazakhstan, 4.2
Ukraine, 8.6Croatia, 1.8
Serbia, 1.1Lithuania, 0.2
Slovenia, 0.0Azerbaijan, 1.7
Czechrepublic, 2.60.6
0.00.0 0.2 0.0Cash, 0.0
Indonesia, 34.9
Malaysia, 10.3
China, 16.7
Thailand, 9.5
Philippines, 6.7
India, 8.8
Korea (South), 2.2Srilanka, 4.3
Hongkong, 1.8
Pakistan, 1.2Singapore, 1.7 Vietnam, 0.8Mongolia, 0.9 Bangladesh, 0.0
Taiwan, 0.1Cash, 3.3
Brazil, 23.6
Mexico, 25.0
Colombia, 11.4
Argentina, 4.7
Peru, 8.7
Chile, 7.9
Dom. Rep., 3.7
Venezuela, 0.5Panama, 3.1
Uruguay, 2.0
Costa Rica, 1.1
Paraguay, 1.1
Jamaica, 1.1
Elsalvador, 1.4
Ecuador, 3.7Guatemala, 0.6
0.1 0.3Cuba, 0.0Cash, 2.1
USA, 52.8
Euro, 21.0
UK, 8.3
Japan, 5.8Canada, 2.6Australia, 1.4
Sweden, 0.0Switzerland, 0.8Denmark, 0.2Newzealand, 0.0 Norway, 0.3 Cash, 3.6
France, 25.6
Germany, 14.8
Italy, 19.0
Netherlands, 11.7
Spain, 11.6Belgium, 3.2
Austria, 1.1
Ireland, 4.7
Portugal, 0.8
Finland, 0.7 Greece, 0.60.1 0.0 0.0Slovakia, 0.1 Cash, 1.9

Global debt flows October 2019
4
Emerging Markets

Global debt flows October 2019
5
Emerging Markets – Summary themes • A theme of moderate outflows from local currency funds and inflows to hard
currency funds continues. It’s been the theme for most of 2019. But at the same time there has been a net inflow to emerging market overall (for 2019).
• In the past 12 months, AUM in EM is up 4.8%, within which AUM in hard currency is up 12%. But in more recent months inflows to EM have been more subdued. In fact in the past quarter overall EM flows have been balanced between out and inflows.
• The bulk of the outflows from local currency funds in recent months have been from retail players. Professional players have in fact been net buyers of local currency. Had it not been for the outflows from local currency funds, overall EM flows would have been more comfortably positive in recent months.
• Aggregate outflows from local currency through 2019 have not been detrimental in terms of total returns, which are running at 7.2% YTD. Hard currency on returns of 10.2%, continues to outperform, but the gap has been closing in the past couple of months as local currency has started to outperform (all translated into USD).
Fig 9 Feature Chart: The light blue line shows changes in AUM plus performance; indicative of a combination of inflows and positive total returns
Source: EPFR Global, ING estimates
• Global allocations have not changed dramatically in the past couple of months, apart from a moderate reduction in allocation to Latam and EMEA, versus a moderate increase in allocation to the Middle East & N Africa. This in fact has been a trend in 2019, alongside increased allocation to EM Asia.
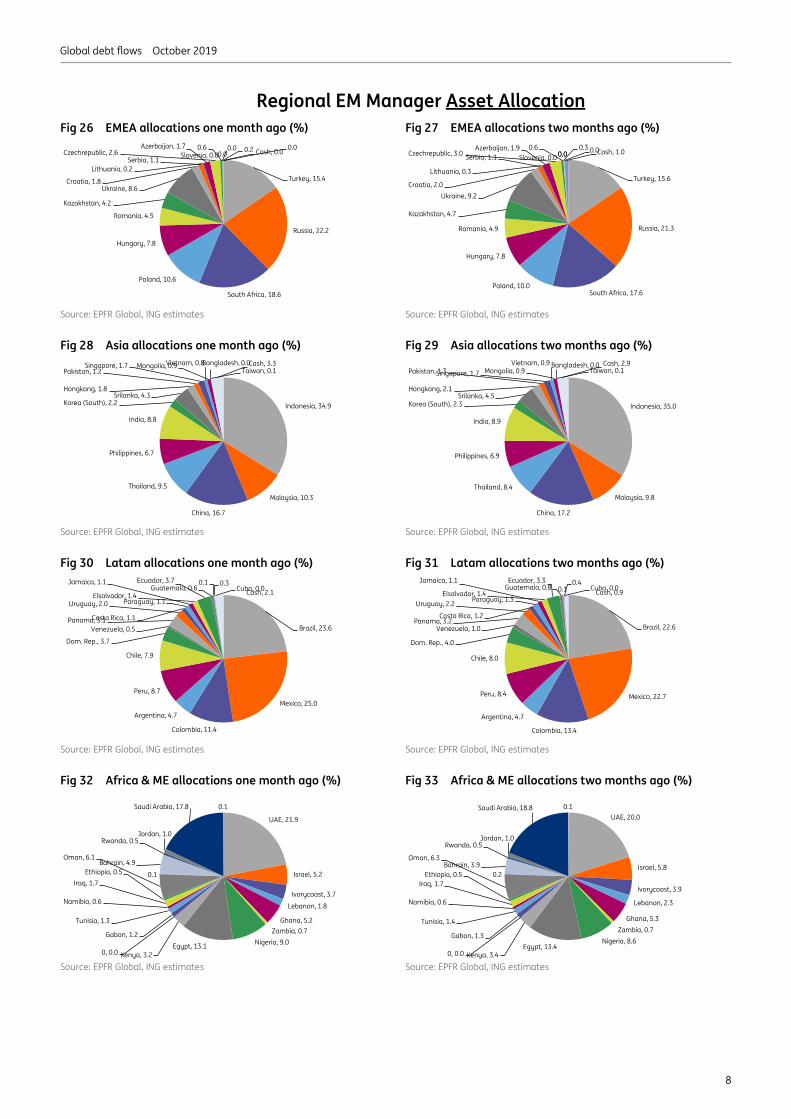
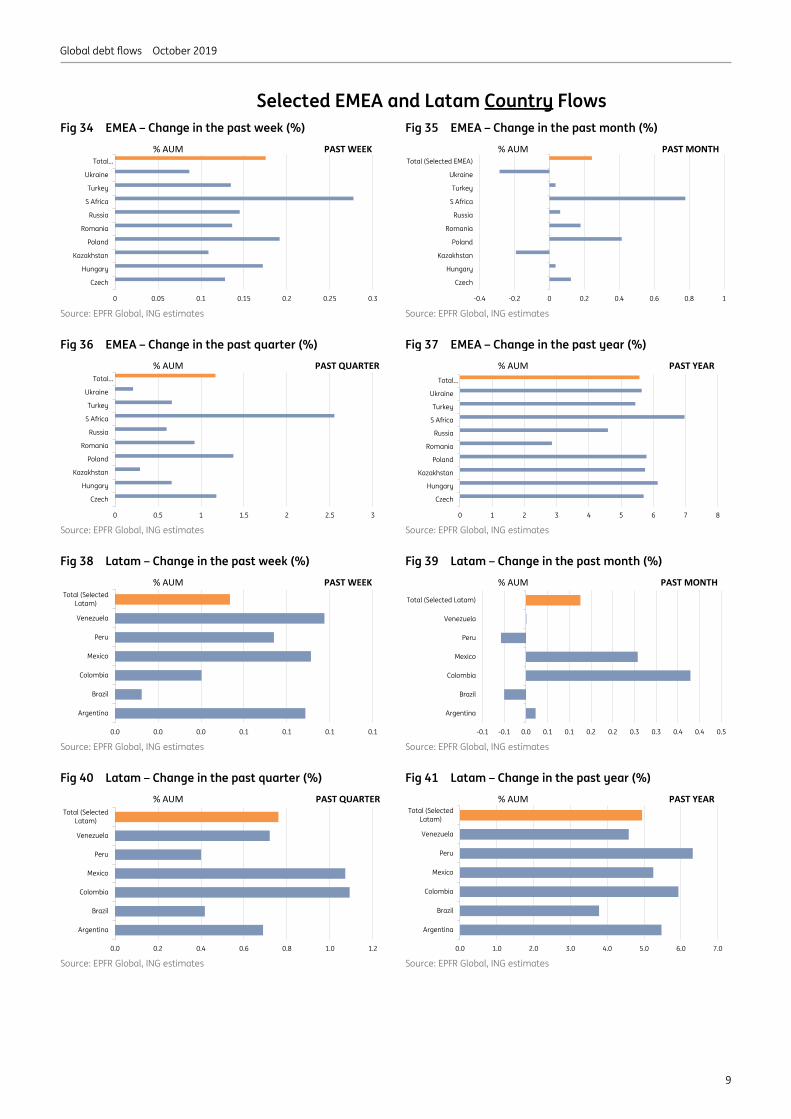
• In EMEA, allocation to Russia, S Africa and Ukraine has increased in the past month, while allocation to Poland, Romania and Turkey is down (Figs 26 & 27). In Asia, allocation to China and Hong Kong is down while allocation is up for Thailand (Figs 28 & 29). In Latam, allocation to Brazil and Mexico is up while allocation to Colombia and Chile is down (Figs 30 & 31).
BOTTOM LINE: Inflows to hard currency emerging markets remain thematic. Local currency performance has been catching up in the past 6 weeks despite outflows (moderate). Hard currency is still outperforming versus local currency YTD, but local currently has been doing better of late. Professional players have not been big sellers of local currency; most of the local currency outflows have come from retail accounts. In terms of allocation, we note some decent inflows into high yielders like Brazil, Mexico, Russia and S Africa. In contract, reductions in allocation have been in play for the likes of China, Hong Kong, Turkey, Poland and Colombia. Inflow processes have been helped by stable inflation dynamics, while outflows have been dominated by idiosyncratic issues.
0
100
200
300
400
500
600
-8,000
-6,000
-4,000
-2,000
0
2,000
4,000
6,000
EM Hard (all investors) EM Local (all investors) EM Blend (all investors) EM Total (all investors)
$ million $bn (cumulative AUM)
Global debt flows October 2019
6
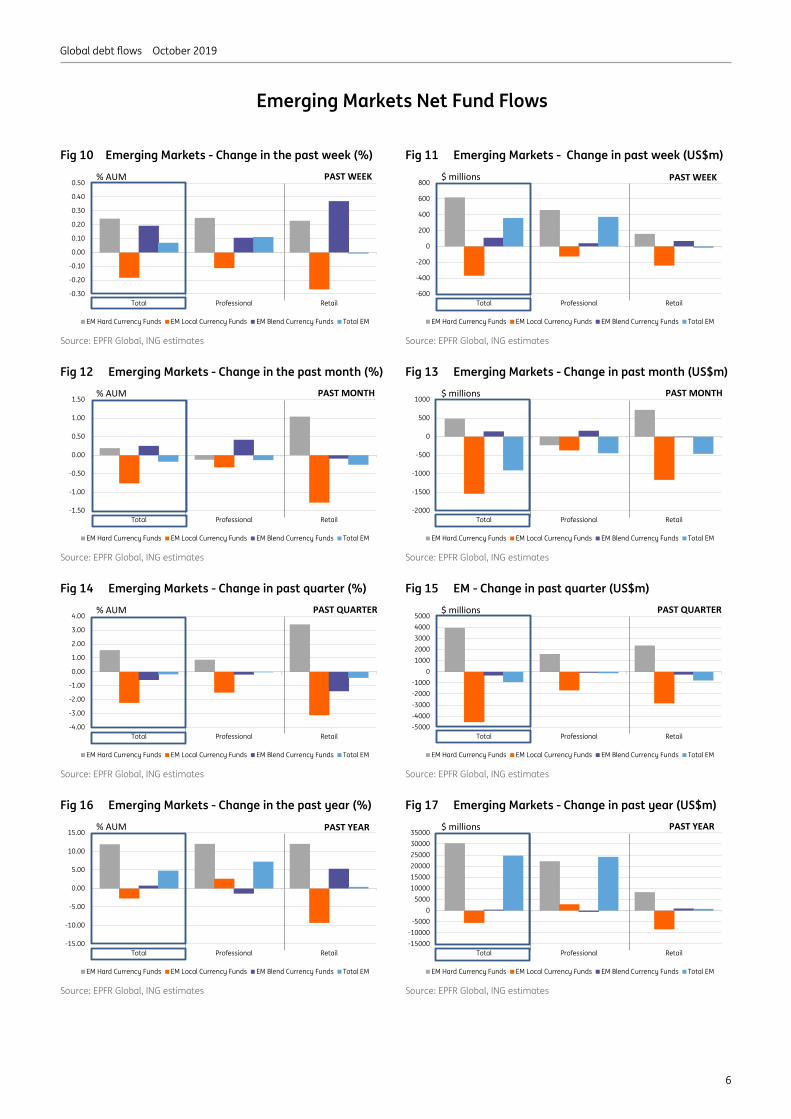
Emerging Markets Net Fund Flows
Fig 10 Emerging Markets - Change in the past week (%) Fig 11 Emerging Markets - Change in past week (US$m)
Source: EPFR Global, ING estimates Source: EPFR Global, ING estimates
Fig 12 Emerging Markets - Change in the past month (%) Fig 13 Emerging Markets - Change in past month (US$m)
Source: EPFR Global, ING estimates Source: EPFR Global, ING estimates
Fig 14 Emerging Markets - Change in past quarter (%) Fig 15 EM - Change in past quarter (US$m)
Source: EPFR Global, ING estimates Source: EPFR Global, ING estimates
Fig 16 Emerging Markets - Change in the past year (%) Fig 17 Emerging Markets - Change in past year (US$m)
Source: EPFR Global, ING estimates Source: EPFR Global, ING estimates
-0.30
-0.20
-0.10
0.00
0.10
0.20
0.30
0.40
0.50
Total Professional Retail
EM Hard Currency Funds EM Local Currency Funds EM Blend Currency Funds Total EM
% AUM PAST WEEK
-600
-400
-200
0
200
400
600
800
Total Professional Retail
EM Hard Currency Funds EM Local Currency Funds EM Blend Currency Funds Total EM
$ millions PAST WEEK
-1.50
-1.00
-0.50
0.00
0.50
1.00
1.50
Total Professional Retail
EM Hard Currency Funds EM Local Currency Funds EM Blend Currency Funds Total EM
% AUM PAST MONTH
-2000
-1500
-1000
-500
0
500
1000
Total Professional Retail
EM Hard Currency Funds EM Local Currency Funds EM Blend Currency Funds Total EM
$ millions PAST MONTH
-4.00
-3.00
-2.00
-1.00
0.00
1.00
2.00
3.00
4.00
Total Professional Retail
EM Hard Currency Funds EM Local Currency Funds EM Blend Currency Funds Total EM
% AUM PAST QUARTER
-5000-4000-3000-2000-1000
010002000300040005000
Total Professional Retail
EM Hard Currency Funds EM Local Currency Funds EM Blend Currency Funds Total EM
$ millions PAST QUARTER
-15.00
-10.00
-5.00
0.00
5.00
10.00
15.00
Total Professional Retail
EM Hard Currency Funds EM Local Currency Funds EM Blend Currency Funds Total EM
% AUM PAST YEAR
-15000-10000
-50000
5000100001500020000250003000035000
Total Professional Retail
EM Hard Currency Funds EM Local Currency Funds EM Blend Currency Funds Total EM
$ millions PAST YEAR

Global debt flows October 2019
7
Global EM Manager Asset Allocations Fig 18 GEM allocations one month ago (%) Fig 19 GEM detailed allocations one month ago (%)
Source: EPFR Global, ING estimates Source: EPFR Global, ING estimates
Fig 20 GEM allocations two months ago (%) Fig 21 GEM detailed allocations two months ago (%)
Source: EPFR Global, ING estimates Source: EPFR Global, ING estimates
Fig 22 GEM allocations one quarter ago (%) Fig 23 GEM detailed allocations one quarter ago (%)
Source: EPFR Global, ING estimates Source: EPFR Global, ING estimates
Fig 24 GEM allocations one year ago (%) Fig 25 GEM detailed allocations one year ago (%)
Source: EPFR Global, ING estimates Source: EPFR Global, ING estimates
Africa, 9.5
Asia Ex-Japan, 22.3
Other, 1.3
Emerging Europe, 19.2
Middle East, 10.5
Latin America, 32.2
Brazil, 7.5
Mexico, 7.9
Indonesia, 7.7
Turkey, 3.5
Russia, 5.1
Colombia, 3.6South Africa, 4.2Poland, 2.4
Argentina, 1.5Malaysia, 2.3
Hungary, 1.8Peru, 2.7
China, 3.7
Thailand, 2.1Romania, 1.0
Philippines, 1.5Kazakhstan, 1.0
India, 1.9 Ukraine, 2.0
Chile, 2.5
Dom. Rep., 1.2
Korea (South), 0.5
Venezuela, 0.2
Panama, 1.0Srilanka, 0.9 UAE, 3.0 Cash, 2.6
Africa, 9.4
Asia Ex-Japan, 22.3
Other, 2.3
Emerging Europe, 19.4
Middle East, 11.0
Latin America, 32.4
Brazil, 7.2
Mexico, 7.2
Indonesia, 7.7
Turkey, 3.5
Russia, 4.8
Colombia, 4.3South Africa, 4.0Poland, 2.3
Argentina, 1.5Malaysia, 2.1Hungary, 1.8
Peru, 2.7
China, 3.8
Thailand, 1.9Romania, 1.1
Philippines, 1.5Kazakhstan, 1.1
India, 2.0 Ukraine, 2.1
Chile, 2.5
Dom. Rep., 1.3
Korea (South), 0.5
Venezuela, 0.3
Panama, 1.0Srilanka, 1.0UAE, 2.8 Cash, 2.6
Africa, 9.5
Asia Ex-Japan, 21.8
Other, 4.3
Emerging Europe, 19.5
Middle East, 10.1
Latin America, 33.7
Brazil, 7.2
Mexico, 7.3
Indonesia, 7.7
Turkey, 3.9
Russia, 5.0
Colombia, 4.4South Africa, 4.2Poland, 2.5
Argentina, 2.8Malaysia, 2.2
Hungary, 1.8
Peru, 2.9
China, 3.3
Thailand, 2.0Romania, 0.9
Philippines, 1.5Kazakhstan, 1.0
India, 2.0 Ukraine, 1.6
Chile, 2.6
Dom. Rep., 1.2
Korea (South), 0.5
Venezuela, 0.4
Panama, 0.8Srilanka, 0.9UAE, 2.5 Cash, 2.6
Africa, 8.9
Asia Ex-Japan, 20.8
Other, 13.3
Emerging Europe, 21.0
Middle East, 7.9
Latin America, 34.8
Brazil, 7.5
Mexico, 8.1
Indonesia, 6.3
Turkey, 3.9
Russia, 4.6
Colombia, 3.7South Africa, 4.4Poland, 2.5
Argentina, 3.5Malaysia, 2.3
Hungary, 2.3
Peru, 2.7
China, 3.3
Thailand, 1.9Romania, 1.0
Philippines, 1.8Kazakhstan, 1.4
India, 1.8 Ukraine, 1.6Chile, 2.1
Dom. Rep., 1.3
Korea (South), 0.6
Venezuela, 0.5
Panama, 0.8Srilanka, 0.8UAE, 1.8 Cash, 2.6
Global debt flows October 2019
8
Regional EM Manager Asset Allocation Fig 26 EMEA allocations one month ago (%) Fig 27 EMEA allocations two months ago (%)
Source: EPFR Global, ING estimates Source: EPFR Global, ING estimates
Fig 28 Asia allocations one month ago (%) Fig 29 Asia allocations two months ago (%)
Source: EPFR Global, ING estimates Source: EPFR Global, ING estimates
Fig 30 Latam allocations one month ago (%) Fig 31 Latam allocations two months ago (%)
Source: EPFR Global, ING estimates Source: EPFR Global, ING estimates
Fig 32 Africa & ME allocations one month ago (%) Fig 33 Africa & ME allocations two months ago (%)
Source: EPFR Global, ING estimates Source: EPFR Global, ING estimates
Turkey, 15.4
Russia, 22.2
South Africa, 18.6
Poland, 10.6
Hungary, 7.8
Romania, 4.5
Kazakhstan, 4.2
Ukraine, 8.6Croatia, 1.8
Serbia, 1.1Lithuania, 0.2
Slovenia, 0.0Azerbaijan, 1.7
Czechrepublic, 2.60.6
0.00.0 0.2 0.0Cash, 0.0
Turkey, 15.6
Russia, 21.3
South Africa, 17.6Poland, 10.0
Hungary, 7.8
Romania, 4.9
Kazakhstan, 4.7
Ukraine, 9.2Croatia, 2.0
Serbia, 1.1
Lithuania, 0.3
Slovenia, 0.0Azerbaijan, 1.9
Czechrepublic, 3.00.6
0.00.00.3 0.0Cash, 1.0
Indonesia, 34.9
Malaysia, 10.3
China, 16.7
Thailand, 9.5
Philippines, 6.7
India, 8.8
Korea (South), 2.2Srilanka, 4.3
Hongkong, 1.8
Pakistan, 1.2Singapore, 1.7 Vietnam, 0.8Mongolia, 0.9 Bangladesh, 0.0
Taiwan, 0.1Cash, 3.3
Indonesia, 35.0
Malaysia, 9.8
China, 17.2
Thailand, 8.4
Philippines, 6.9
India, 8.9
Korea (South), 2.3Srilanka, 4.5
Hongkong, 2.1
Pakistan, 1.3Singapore, 1.7Vietnam, 0.9
Mongolia, 0.9Bangladesh, 0.0
Taiwan, 0.1Cash, 2.9
Brazil, 23.6
Mexico, 25.0
Colombia, 11.4
Argentina, 4.7
Peru, 8.7
Chile, 7.9
Dom. Rep., 3.7
Venezuela, 0.5Panama, 3.1
Uruguay, 2.0
Costa Rica, 1.1
Paraguay, 1.1
Jamaica, 1.1
Elsalvador, 1.4
Ecuador, 3.7Guatemala, 0.6
0.1 0.3Cuba, 0.0Cash, 2.1
Brazil, 22.6
Mexico, 22.7
Colombia, 13.4
Argentina, 4.7
Peru, 8.4
Chile, 8.0
Dom. Rep., 4.0
Venezuela, 1.0Panama, 3.2
Uruguay, 2.2
Costa Rica, 1.2
Paraguay, 1.3
Jamaica, 1.1
Elsalvador, 1.4
Ecuador, 3.3Guatemala, 0.8 0.1
0.4Cuba, 0.0Cash, 0.9
UAE, 21.9
Israel, 5.2
Ivorycoast, 3.7
Lebanon, 1.8
Ghana, 5.2Zambia, 0.7
Nigeria, 9.0Egypt, 13.1Kenya, 3.20, 0.0
Gabon, 1.2
Tunisia, 1.3
Namibia, 0.6
Iraq, 1.7Ethiopia, 0.5
Oman, 6.1
0.1
Bahrain, 4.9
Rwanda, 0.5Jordan, 1.0
Saudi Arabia, 17.8 0.1UAE, 20.0
Israel, 5.8
Ivorycoast, 3.9
Lebanon, 2.3
Ghana, 5.3Zambia, 0.7
Nigeria, 8.6Egypt, 13.4
Kenya, 3.40, 0.0
Gabon, 1.3
Tunisia, 1.4
Namibia, 0.6
Iraq, 1.7Ethiopia, 0.5
Oman, 6.3
0.2Bahrain, 3.9
Rwanda, 0.5Jordan, 1.0
Saudi Arabia, 18.8 0.1
Global debt flows October 2019
9
Selected EMEA and Latam Country Flows Fig 34 EMEA – Change in the past week (%) Fig 35 EMEA – Change in the past month (%)
Source: EPFR Global, ING estimates Source: EPFR Global, ING estimates
Fig 36 EMEA – Change in the past quarter (%) Fig 37 EMEA – Change in the past year (%)
Source: EPFR Global, ING estimates Source: EPFR Global, ING estimates
Fig 38 Latam – Change in the past week (%) Fig 39 Latam – Change in the past month (%)
Source: EPFR Global, ING estimates Source: EPFR Global, ING estimates
Fig 40 Latam – Change in the past quarter (%) Fig 41 Latam – Change in the past year (%)
Source: EPFR Global, ING estimates Source: EPFR Global, ING estimates
0 0.05 0.1 0.15 0.2 0.25 0.3
Czech
Hungary
Kazakhstan
Poland
Romania
Russia
S Africa
Turkey
Ukraine
Total…% AUM PAST WEEK
-0.4 -0.2 0 0.2 0.4 0.6 0.8 1
Czech
Hungary
Kazakhstan
Poland
Romania
Russia
S Africa
Turkey
Ukraine
Total (Selected EMEA)% AUM PAST MONTH
0 0.5 1 1.5 2 2.5 3
Czech
Hungary
Kazakhstan
Poland
Romania
Russia
S Africa
Turkey
Ukraine
Total…
% AUM PAST QUARTER
0 1 2 3 4 5 6 7 8
Czech
Hungary
Kazakhstan
Poland
Romania
Russia
S Africa
Turkey
Ukraine
Total…
% AUM PAST YEAR
0.0 0.0 0.0 0.1 0.1 0.1 0.1
Argentina
Brazil
Colombia
Mexico
Peru
Venezuela
Total (SelectedLatam)
% AUM PAST WEEK
-0.1 -0.1 0.0 0.1 0.1 0.2 0.2 0.3 0.3 0.4 0.4 0.5
Argentina
Brazil
Colombia
Mexico
Peru
Venezuela
Total (Selected Latam)
% AUM PAST MONTH
0.0 0.2 0.4 0.6 0.8 1.0 1.2
Argentina
Brazil
Colombia
Mexico
Peru
Venezuela
Total (SelectedLatam)
% AUM PAST QUARTER
0.0 1.0 2.0 3.0 4.0 5.0 6.0 7.0
Argentina
Brazil
Colombia
Mexico
Peru
Venezuela
Total (SelectedLatam)
% AUM PAST YEAR

Global debt flows October 2019
10
Selected Asia and ME/Africa Country Flows Fig 42 Asia – Change in the past week (%) Fig 43 Asia – Change in the past month (%)
Source: EPFR Global, ING estimates Source: EPFR Global, ING estimates
Fig 44 Asia – Change in the past quarter (%) Fig 45 Asia – Change in the past year (%)
Source: EPFR Global, ING estimates Source: EPFR Global, ING estimates
Fig 46 Middle East & Africa – In the past week (%) Fig 47 Middle East & Africa – In the past month (%)
Source: EPFR Global, ING estimates Source: EPFR Global, ING estimates
Fig 48 Middle East & Africa – In the past quarter (%) Fig 49 Middle East & Africa – In the past year (%)
Source: EPFR Global, ING estimates Source: EPFR Global, ING estimates
-0.2 -0.1 0 0.1 0.2 0.3 0.4 0.5
China
India
Indonesia
Malaysia
Mongolia
Pakistan
Philippines
S Korea
Thailand
Vietnam
Total (Selected Asia EM)
% AUM PAST WEEK
-1 -0.5 0 0.5 1 1.5
China
India
Indonesia
Malaysia
Mongolia
Pakistan
Philippines
S Korea
Thailand
Vietnam
Total (Selected Asia EM)% AUM PAST MONTH
-1.5 -1 -0.5 0 0.5 1 1.5 2 2.5 3 3.5
China
India
Indonesia
Malaysia
Mongolia
Pakistan
Philippines
S Korea
Thailand
Vietnam
Total (Selected Asia EM)% AUM PAST QUARTER
-6 -4 -2 0 2 4 6 8 10 12
China
India
Indonesia
Malaysia
Mongolia
Pakistan
Philippines
S Korea
Thailand
Vietnam
Total (Selected Asia EM)
% AUM PAST YEAR
0.0 0.1 0.1 0.2 0.2
BahrainEqyptIsrael
JordanKuwait
LebanonQatar
TunisiaUEA
Total (Selected ME & NA)Ivory Coast
NigeriaTotal (Selected Sub-Sahara)
% AUM PAST WEEK
-0.6 -0.4 -0.2 0.0 0.2 0.4 0.6 0.8
BahrainEqyptIsrael
JordanKuwait
LebanonQatar
TunisiaUEA
Total (Selected ME & NA)Ivory Coast
NigeriaTotal (Selected Sub-Sahara)
% AUM PAST MONTH
0.0 0.5 1.0 1.5 2.0
BahrainEqyptIsrael
JordanKuwait
LebanonQatar
TunisiaUEA
Total…Ivory Coast
NigeriaTotal…
% AUM PAST QUARTER
0.0 2.0 4.0 6.0 8.0
BahrainEqyptIsrael
JordanKuwait
LebanonQatar
TunisiaUEA
Total (Selected ME & NA)Ivory Coast
NigeriaTotal (Selected Sub-Sahara)
% AUM PAST YEAR

Global debt flows October 2019
11
High Yield

Global debt flows October 2019
12
High Yield – Summary themes
• Corporate high yield lagged the inflow process seen by both emerging markets and investment grade corporates earlier in the year, but has managed to share in the general risk-asset-inflow-process in the past quarter.
• Compared with investment grade corporates, high yield corporates have maintained a similar but slightly slower pace of inflows in the past quarter. But high yield inflows have been in excess of EM inflows over the same period.
• Professional accounts have been bigger buyers of HY in the past quarter, adding some 1.9% to AUM. Retail have generated inflows to HY too, but at a slower pace with retail AUM up 1.1% over the same period.
Fig 50 Feature Chart: The orange line shows the culmination of changes in AUM and performance; upward trajectory as a theme for 2019
Source: EPFR Global, ING estimates
• A breakout between USD and EUR high yield shows that the bulk of the steady inflows have been into USD high yield. EUR high yield has seen net outflows in recent months. In the past week both EUR and USD HY has seen inflows.
• Performance statistics remain positively impressive, with USD high yield in solid double-digit territory YTD and outperforming EM. EUR high yield has lagged, but mostly on account of translation back into a stronger USD.
BOTTOM LINE: High yield has managed to sustain a decent inflow pace in more recent months, and indeed has seen greater inflows compared with aggregate emerging markets. That said, USD hard currency EM has managed a similar pace of inflows to high yield, and investment grade corporate inflows have been a tad faster. The inflow process in the past week suggests minimal evidence of angst as we enter a slowdown episode that typically would see some elevation in defaults, or at least the risk for them.
0
100
200
300
400
500
600
-10.0
-8.0
-6.0
-4.0
-2.0
0.0
2.0
4.0
6.0
8.0
US High Yield Weekly Flow $bn (LHS) US High Yield Cumulative AUM $bn (RHS)
$bn (weekly flow) $bn (cumulative AUM)USD High Yield

Global debt flows October 2019
13
Fig 51 Western Europe High Yield Weekly Flows
Source: EPFR Global, ING estimates
Fig 52 US High Yield Weekly Flows
Source: EPFR Global, ING estimates
Fig 53 Emerging Markets Weekly Flows – all currencies
Source: EPFR Global, ING estimates
0
20
40
60
80
100
120
-2.0
-1.5
-1.0
-0.5
0.0
0.5
1.0
1.5
EU High Yield Weekly Flow $bn (LHS) EU High Yield Cumulative AUM $bn (RHS)
$bn (weekly flow) $bn (cumulative AUM)W Europe High Yield (in $)
0
100
200
300
400
500
600
-10.0
-8.0
-6.0
-4.0
-2.0
0.0
2.0
4.0
6.0
8.0
US High Yield Weekly Flow $bn (LHS) US High Yield Cumulative AUM $bn (RHS)
$bn (weekly flow) $bn (cumulative AUM)USD High Yield
0
100
200
300
400
500
600
-8,000
-6,000
-4,000
-2,000
0
2,000
4,000
6,000
EM Hard (all investors) EM Local (all investors) EM Blend (all investors) EM Total (all investors)
$ million $bn (cumulative AUM)

Global debt flows October 2019
14
Developed Markets
Global debt flows October 2019
15
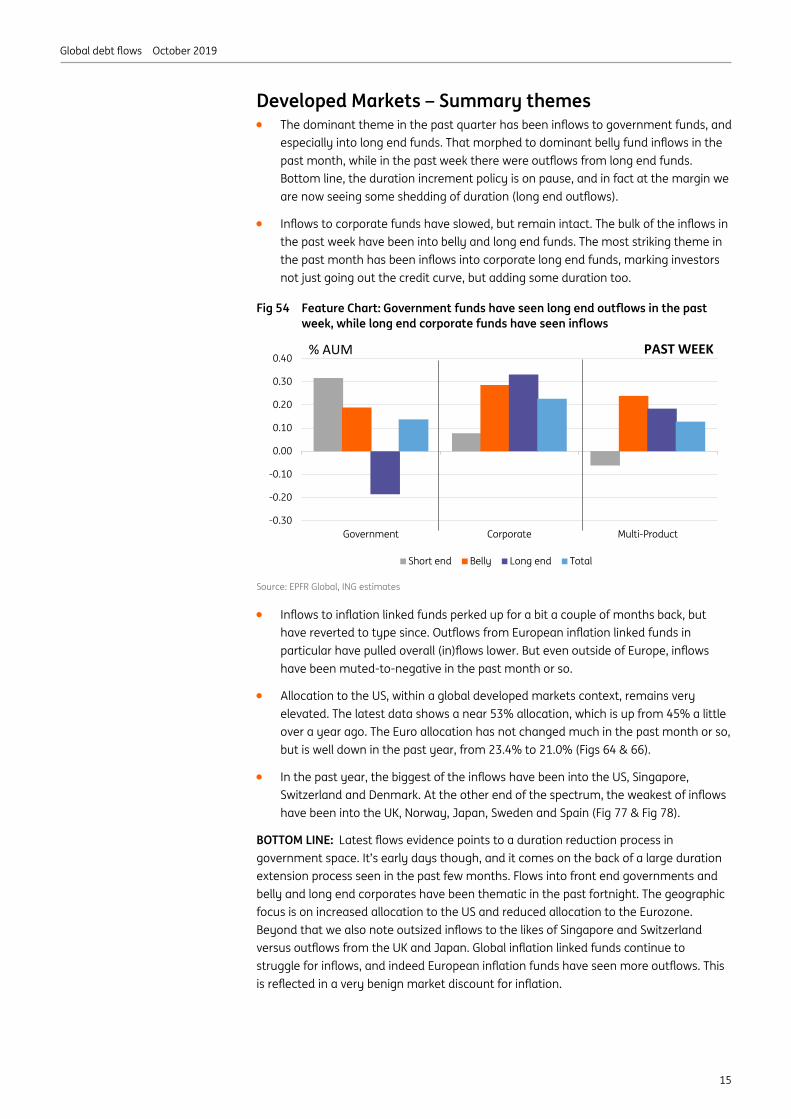
Developed Markets – Summary themes • The dominant theme in the past quarter has been inflows to government funds, and
especially into long end funds. That morphed to dominant belly fund inflows in the past month, while in the past week there were outflows from long end funds. Bottom line, the duration increment policy is on pause, and in fact at the margin we are now seeing some shedding of duration (long end outflows).
• Inflows to corporate funds have slowed, but remain intact. The bulk of the inflows in the past week have been into belly and long end funds. The most striking theme in the past month has been inflows into corporate long end funds, marking investors not just going out the credit curve, but adding some duration too.
Fig 54 Feature Chart: Government funds have seen long end outflows in the past week, while long end corporate funds have seen inflows
Source: EPFR Global, ING estimates
• Inflows to inflation linked funds perked up for a bit a couple of months back, but have reverted to type since. Outflows from European inflation linked funds in particular have pulled overall (in)flows lower. But even outside of Europe, inflows have been muted-to-negative in the past month or so.
• Allocation to the US, within a global developed markets context, remains very elevated. The latest data shows a near 53% allocation, which is up from 45% a little over a year ago. The Euro allocation has not changed much in the past month or so, but is well down in the past year, from 23.4% to 21.0% (Figs 64 & 66).
• In the past year, the biggest of the inflows have been into the US, Singapore, Switzerland and Denmark. At the other end of the spectrum, the weakest of inflows have been into the UK, Norway, Japan, Sweden and Spain (Fig 77 & Fig 78).
BOTTOM LINE: Latest flows evidence points to a duration reduction process in government space. It’s early days though, and it comes on the back of a large duration extension process seen in the past few months. Flows into front end governments and belly and long end corporates have been thematic in the past fortnight. The geographic focus is on increased allocation to the US and reduced allocation to the Eurozone. Beyond that we also note outsized inflows to the likes of Singapore and Switzerland versus outflows from the UK and Japan. Global inflation linked funds continue to struggle for inflows, and indeed European inflation funds have seen more outflows. This is reflected in a very benign market discount for inflation.
-0.30
-0.20
-0.10
0.00
0.10
0.20
0.30
0.40
Government Corporate Multi-Product
Short end Belly Long end Total
% AUM PAST WEEK

Global debt flows October 2019
16
Fig 55 Change in the past week (%) Fig 56 Change in the past week (%)
Source: EPFR Global, ING estimates Source: EPFR Global, ING estimates
Fig 57 Change in the past month (%) Fig 58 Change in the past month (%)
Source: EPFR Global, ING estimates Source: EPFR Global, ING estimates
Fig 59 Change in the past quarter (%) Fig 60 Change in the past quarter (%)
Source: EPFR Global, ING estimates Source: EPFR Global, ING estimates
Fig 61 Change in the past year (%) Fig 62 Change in the past year (%)
Source: EPFR Global, ING estimates Source: EPFR Global, ING estimates
-0.30
-0.20
-0.10
0.00
0.10
0.20
0.30
0.40
Government Corporate Multi-Product
Short end Belly Long end Total
% AUM PAST WEEK
-3.50
-3.00
-2.50
-2.00
-1.50
-1.00
-0.50
0.00
0.50
1.00
High Yield Inflation Money Markets
North America W Europe Total
% AUM PAST WEEK
-1.00
0.00
1.00
2.00
3.00
4.00
5.00
Government Corporate Multi-Product
Short end Belly Long end Total
% AUM PAST MONTH
-2.00
-1.50
-1.00
-0.50
0.00
0.50
1.00
1.50
2.00
High Yield Inflation Money Markets
North America W Europe Total
% AUM PAST MONTH
-1.00
0.00
1.00
2.00
3.00
4.00
5.00
6.00
7.00
Government Corporate Multi-Product
Short end Belly Long end Total
% AUM PAST QUARTER
-2.00
-1.00
0.00
1.00
2.00
3.00
4.00
5.00
6.00
High Yield Inflation Money Markets
North America W Europe Total
% AUM PAST QUARTER
-5.00
0.00
5.00
10.00
15.00
20.00
25.00
Government Corporate Multi-Product
Short end Belly Long end Total
% AUM PAST YEAR
-15.00
-10.00
-5.00
0.00
5.00
10.00
15.00
20.00
High Yield Inflation Money Markets
North America W Europe Total
% AUM PAST YEAR

Global debt flows October 2019
17
Global DM Manager Asset Allocations Fig 63 Eurozone allocations one month ago (%) Fig 64 Global DM allocations one month ago (%)
Source: EPFR Global, ING estimates Source: EPFR Global, ING estimates
Fig 65 Eurozone allocations two months ago (%) Fig 66 Global DM allocations two months ago (%)
Source: EPFR Global, ING estimates Source: EPFR Global, ING estimates
Fig 67 Eurozone allocations one quarter ago (%) Fig 68 Global DM allocations one quarter ago (%)
Source: EPFR Global, ING estimates Source: EPFR Global, ING estimates
Fig 69 Eurozone allocations one year ago (%) Fig 70 Global DM allocations one year ago (%)
Source: EPFR Global, ING estimates Source: EPFR Global, ING estimates
France, 25.6
Germany, 14.8
Italy, 19.0
Netherlands, 11.7
Spain, 11.6Belgium, 3.2
Austria, 1.1
Ireland, 4.7
Portugal, 0.8
Finland, 0.7 Greece, 0.60.1 0.0 0.0Slovakia, 0.1 Cash, 1.9
USA, 52.8
Euro, 21.0
UK, 8.3
Japan, 5.8Canada, 2.6Australia, 1.4
Sweden, 0.0Switzerland, 0.8Denmark, 0.2Newzealand, 0.0 Norway, 0.3 Cash, 3.6
France, 25.6
Germany, 14.8
Italy, 19.7
Netherlands, 11.7
Spain, 11.8Belgium, 3.2
Austria, 1.1
Ireland, 4.1
Portugal, 0.8
Finland, 0.9Greece, 0.50.1 0.0
0.0Slovakia, 0.1 Cash, 1.7
USA, 52.6
Euro, 21.1
UK, 8.0
Japan, 5.8Canada, 2.7
Australia, 1.4
Sweden, 0.0Switzerland, 0.8Denmark, 0.2Newzealand, 0.0 Norway, 0.3 Cash, 3.8
France, 27.0
Germany, 14.7
Italy, 19.9
Netherlands, 10.0
Spain, 12.9
Belgium, 3.0Austria, 1.3
Ireland, 3.3
Portugal, 0.9
Finland, 0.6 Greece, 0.90.1
0.0 0.0Slovakia, 0.0 Cash, 2.7
USA, 51.3
Euro, 22.7
UK, 7.7
Japan, 5.4Canada, 2.5Australia, 1.6
Sweden, 0.0Switzerland, 0.8Denmark, 0.3Newzealand, 0.0 Norway, 0.2 Cash, 3.8
France, 25.2
Germany, 16.3
Italy, 19.4
Netherlands, 7.6
Spain, 14.0
Belgium, 4.0
Austria, 1.1
Ireland, 3.5
Portugal, 1.1
Finland, 0.8Greece, 0.40.8 0.0 0.0Slovakia, 0.1 Cash, 2.9
USA, 47.6
Euro, 23.4
UK, 8.0
Japan, 6.7Canada, 2.9
Australia, 2.2
Sweden, 0.0Switzerland, 0.8Denmark, 0.3Newzealand, 0.0 Norway, 0.3 Cash, 4.4

Global debt flows October 2019
18
Developed Markets Country Flows Fig 71 Eurozone – Change in the past week (%) Fig 72 Non Eurozone – Change in the past week (%)
Source: EPFR Global, ING estimates Source: EPFR Global, ING estimates
Fig 73 Eurozone – Change in the past month (%) Fig 74 Non Eurozone – Change in the past month (%)
Source: EPFR Global, ING estimates Source: EPFR Global, ING estimates
Fig 75 Eurozone – Change in the past quarter (%) Fig 76 Non Eurozone – Change in the past quarter (%)
Source: EPFR Global, ING estimates Source: EPFR Global, ING estimates
Fig 77 Eurozone – Change in the past year (%) Fig 78 Non Eurozone – Change in the past year (%)
Source: EPFR Global, ING estimates Source: EPFR Global, ING estimates
-0.05 0 0.05 0.1 0.15
AustriaBelgium
CyprusFinlandFrance
GermanyGreeceIreland
ItalyNetherlands
PortugalSpain
Total (Selected Eurozone)
% AUM PAST WEEK
-0.4 -0.3 -0.2 -0.1 0 0.1 0.2 0.3 0.4
AustraliaHong Kong
JapanNew Zealand
SingaporeIceland
DenmarkNorwaySweden
SwitzerlandUK
CanadaUS
Total (Selected Non Eurozone)% AUM PAST WEEK
0 0.2 0.4 0.6 0.8 1
AustriaBelgium
CyprusFinlandFrance
GermanyGreeceIreland
ItalyNetherlands
PortugalSpainTotal…
% AUM PAST MONTH
0 0.2 0.4 0.6 0.8 1 1.2 1.4
AustraliaHong Kong
JapanNew Zealand
SingaporeIceland
DenmarkNorwaySweden
SwitzerlandUK
CanadaUS
Total…% AUM PAST MONTH
0 0.5 1 1.5 2 2.5 3
Austria
Belgium
Cyprus
Finland
France
Germany
Greece
Ireland
Italy
Netherlands
Portugal
Spain
Total (Selected Eurozone)
% AUM PAST QUARTER
0 0.5 1 1.5 2 2.5 3 3.5 4
AustraliaHong Kong
JapanNew Zealand
SingaporeIceland
DenmarkNorwaySweden
SwitzerlandUK
CanadaUS
Total (Selected Non Eurozone)
% AUM PAST QUARTER
0 1 2 3 4 5
AustriaBelgium
CyprusFinlandFrance
GermanyGreeceIreland
ItalyNetherlands
PortugalSpainTotal…
% AUM PAST YEAR
0 2 4 6 8 10
AustraliaHong Kong
JapanNew Zealand
SingaporeIceland
DenmarkNorwaySweden
SwitzerlandUK
CanadaUS
Total…% AUM PAST YEAR

Global debt flows October 2019
19
Disclaimer This publication has been prepared by the Economic and Financial Analysis Division of ING Bank NV (“ING”) solely for information purposes without regard to any particular user's investment objectives, financial situation, or means. ING forms part of ING Group (being for this purpose ING Group NV and its subsidiary and affiliated companies). The information in the publication is not an investment recommendation and it is not investment, legal or tax advice or an offer or solicitation to purchase or sell any financial instrument. Reasonable care has been taken to ensure that this publication is not untrue or misleading when published, but ING does not represent that it is accurate or complete. ING does not accept any liability for any direct, indirect or consequential loss arising from any use of this publication. Unless otherwise stated, any views, forecasts, or estimates are solely those of the author(s), as of the date of the publication and are subject to change without notice.
The distribution of this publication may be restricted by law or regulation in different jurisdictions and persons into whose possession this publication comes should inform themselves about, and observe, such restrictions.
Copyright and database rights protection exists in this report and it may not be reproduced, distributed or published by any person for any purpose without the prior express consent of ING. All rights are reserved. The producing legal entity ING Bank NV is authorised by the Dutch Central Bank and supervised by the European Central Bank (ECB), the Dutch Central Bank (DNB) and the Dutch Authority for the Financial Markets (AFM). ING Bank NV is incorporated in the Netherlands (Trade Register no. 33031431 Amsterdam). In the United Kingdom this information is approved and/or communicated by ING Bank NV, London Branch. ING Bank NV, London Branch is subject to limited regulation by the Financial Conduct Authority (FCA). ING Bank NV, London branch is registered in England (Registration number BR000341) at 8-10 Moorgate, London EC2 6DA.
For US Investors: Any person wishing to discuss this report or effect transactions in any security discussed herein should contact ING Financial Markets LLC, which is a member of the NYSE, FINRA and SIPC and part of ING, and which has accepted responsibility for the distribution of this report in the United States under applicable requirements.