Embed Size (px)
Citation preview
Global Criteria Indicator Development Report Version 1.0 Prepared for: The Dairy Sustainability Framework
Prepared by:
Marty D. Matlock, PhD, PE, BCEE
Professor Dep’t of Biological and Agricultural Engineering
Executive Director Office for Sustainability University of Arkansas [email protected]
October 9, 2017

i
TABLE OF CONTENTS
1. PURPOSE ..................................................................................................................................... 1
2. CANDIDATE SUSTAINABILITY INDICATOR SELECTION ............................................................. 3
2.1. Multi-Stakeholder Analysis and Deliberation Process ............................................................ 3
2.2. Soil Nutrients Candidate Indicator Selection .......................................................................... 6
Comments and Questions ......................................................................................................... 7
Response to Comments ............................................................................................................. 7
Recommended Indicator ........................................................................................................... 7
2.3. Soil Quality and Retention Candidate Indicator Selection ...................................................... 7
Comments and Questions ......................................................................................................... 8
Response to Comments ............................................................................................................. 9
Recommended Indicator ........................................................................................................... 9
2.4. Biodiversity Candidate Indicator Selection ............................................................................. 9
Comments and Questions ....................................................................................................... 11
Response to Comments ........................................................................................................... 11
Recommended Indicator ......................................................................................................... 11
2.5. Water Availability and Quality Candidate Indicator Selection ............................................. 11
Comments and Questions ....................................................................................................... 13
Response Comments ............................................................................................................... 14
Recommended Indicator ......................................................................................................... 14
2.6. Working Conditions Candidate Indicator Selection .............................................................. 14
DSF Member comments and questions .................................................................................. 16
Response to DSF Member Comments .................................................................................... 17
Recommended Indicator ......................................................................................................... 17
3. NEXT STEPS IN INDICATOR DEVELOPMENT ............................................................................ 17

ii
LIST OF FIGURES
Figure 1: DSF Sustainability Assurance Framework...................................................................... 2
Figure 2: DSF Criteria with Strategic Intents are Aspirational Goals for the Global Dairy Community ..................................................................................................................................... 3
Figure 3: Efficacy Scoring Criteria for Top Candidate Indicators. ................................................ 4
Figure 4: DSF Candidate Indicator Selection Approach ................................................................ 5
LIST OF TABLES
Table 1: Soil Nutrients Indicator scores based on DSF survey results. .......................................... 6
Table 2: Efficacy Analysis scoring for Top Candidate Indicators for the Soil Nutrients High Level Indicator ................................................................................................................................ 6
Table 3: Soil Quality and Retention indicator scores based on DSF survey results ....................... 8
Table 4: Efficacy Analysis scoring for Top Candidate Indicators for the Soil Quality and Retention High Level Indicator ...................................................................................................... 8
Table 5: Biodiversity Indicator scores based on DSF survey results............................................ 10
Table 6: Efficacy Analysis scoring for Top Candidate Indicators for the Biodiversity Global Criteria .......................................................................................................................................... 10
Table 7: Water Availability & Quality Candidate Indicator scores based on DSF survey results 12
Table 8: Efficacy Analysis scoring for Top Candidate Indicators for the Water Availability & Quality High Level Indicator ........................................................................................................ 13
Table 9: Working Conditions Candidate Indicator scores based on DSF survey results ............. 15
Table 10: Efficacy Analysis scoring for Top Candidate Indicators for the Working Conditions High Level Indicator ..................................................................................................................... 16
1
1. PURPOSE 1
The Dairy Sustainability Framework (DSF) is in the process of developing high level 2 indicators for the eleven global Sustainability criteria. These indicators will enable the sector to 3 quantify the aggregate global progress across the 11 criteria. Two of the eleven Global Criteria 4 indicators were developed in 2016, and four will be developed in 2018. The five high level 5 indicators included in the 2017 indicator development were: 6
• Soil – Quality and Retention 7 • Soil Nutrients 8 • Biodiversity 9 • Water Availability and Quality 10 • Working Conditions 11
These 11 criteria enable the DSF to align the sector and publicly report global progress of 12 the dairy industry across a range of sustainability landscapes. This process follows a common 13 continuous improvement framework (Figure 1). The DSF will capture existing data from diverse 14 dairy production systems from a range of geographies to benchmark progress against a baseline 15 generated for each of the criteria. The scale of this project demands that the chosen indicators be 16 both meaningful and measurable. 17
The previous report (Status Assessment of High Level Indicator Reporting Metrics, June 18 2017) explained the creation and distribution of surveys to the DSF membership and the analysis 19 of survey results for identifying candidate indicators. Surveys were utilized to help inventory and 20 identify the indicators that members felt were most critical to the operation of producers, most 21 important to their customers, and that DSF members currently measure. The survey addressed a 22 total of 49 Indicators across the five Criteria. 23
This report will focus on selection of final indicators from the list of candidate indicators 24 that were identified through the survey score analysis and efficacy analysis (Figures 2 and 3). Top 25 candidate indicators were scored on the following criteria: 26
• Implementability: Can the indicator be implemented across geographies and production 27 scales? 28
• Effectiveness: Can improving the indicator improve the Global Criteria directly? 29 • Precedent: Are producers collecting data on the Indicator, or is the Indicator used in other 30
dairy or beef reporting efforts? 31 32 Top candidate indicators were identified to the DSF membership through webinars and on 33
the website dsfglobalcriteria.org. Members were given the opportunity to comment on the top 34 candidate indicators, and those comments will be addressed in this report, along with further details 35 of how the indicators would be developed to meet the requirements of being both meaningful and 36

2
measurable across diverse dairy production systems from a range of geographies, whilst 1 appreciating their high level nature. 2
3 The framework developed by DSF builds upon existing initiatives across member 4
organizations and regions. This process acknowledges the power of performance milestones 5 developed by national, regional, and/or enterprise level organizations. The process of continuous 6 improvement, Plan-Do-Check-Adjust, is the purview of those member organizations. DSF 7 provides the framework for overarching sustainability vision for the global dairy sector (Figure 1). 8
Figure 1: DSF Sustainability Assurance Framework 9
10
The role of DSF is to provide overarching goals and alignment of global dairy sector’s 11 actions on the path to sustainability. The eleven global criteria and associated strategic intents 12 provide common sustainability priorities for the community of dairy producers around the world. 13 These represent the aspirational goals of the global dairy community (Figure 2). These aspirational 14 goals are large in scope, and very general. Aspirational goals are directionally correct in that they 15 suggest improvement, reduction, increasing, and other very general terms to describe the desired 16 outcomes for the dairy community. Strategic goals are time bound with associated quantitative 17 changes; these are the responsibilities of national, regional, and enterprise organizations, and are 18 beyond the scope and mission of DSF to define and implement (Figure 2). 19
20
21
22
23

3
Figure 2: DSF Criteria with Strategic Intents are Aspirational Goals for 1 the Global Dairy Community 2
3
2. CANDIDATE SUSTAINABILITY INDICATOR SELECTION 4
2.1. Multi-Stakeholder Analysis and Deliberation Process 5
The survey distributed to DSF members included questions about candidate indicators for 6 each of the five Global Criteria. Each criteria can be measured by a variety of indicators, so the 7 number of questions varied by criteria. A total of 49 indicators were addressed in the survey, and 8 a scoring rubric was utilized to score each indicator based on the survey results. Total scores and 9 Matrix Priority scores were calculated from the scoring rubric, and indicators were ranked by these 10 scores for each criteria. Survey analysis was explained in detail in the previous report (Status 11 Assessment of High Level Indicator Reporting Metrics, June 2017). 12
After survey analysis, the top scoring candidate indicators were ranked on 13 implementability, effectiveness, and precedent to calculate the Efficacy Analysis score (Figure 3). 14 The indicators with the highest efficacy analysis scores were identified as top candidate indicators. 15 These candidate indicators were shared with DSF members and other stakeholders through 16 webinars and a web-based comment period, where respondents provided feedback on each 17 candidate indicator. The comments are summarized in this chapter for each candidate indicator. 18 Detailed comments are provided as an Annex in this report. 19

4
Figure 3: Efficacy Scoring Criteria for Top Candidate Indicators. 1
2

5
Figure 4: DSF Candidate Indicator Selection Approach 1
2
6
2.2. Soil Nutrients Candidate Indicator Selection 1
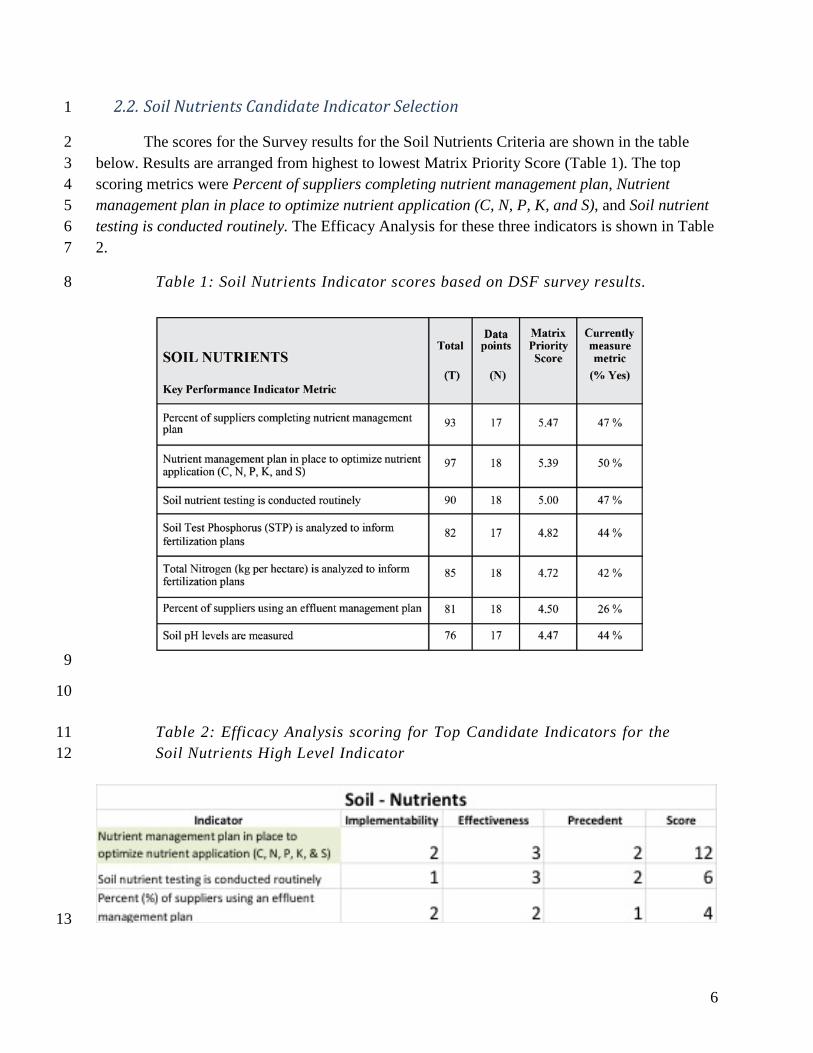
The scores for the Survey results for the Soil Nutrients Criteria are shown in the table 2 below. Results are arranged from highest to lowest Matrix Priority Score (Table 1). The top 3 scoring metrics were Percent of suppliers completing nutrient management plan, Nutrient 4 management plan in place to optimize nutrient application (C, N, P, K, and S), and Soil nutrient 5 testing is conducted routinely. The Efficacy Analysis for these three indicators is shown in Table 6 2. 7
Table 1: Soil Nutrients Indicator scores based on DSF survey results. 8
9
10
Table 2: Efficacy Analysis scoring for Top Candidate Indicators for the 11 Soil Nutrients High Level Indicator 12
13
7
The Efficacy score for the Nutrient management plan in place to optimize nutrient 1 application (C, N, P, K, and S) indicator was much higher than the scores for the next closest 2 indicator candidates. These results indicate that the Nutrient management plan in place to optimize 3 nutrient application (C, N, P, K, and S) indicator would be reflective of the strategic intents of the 4 Soil Nutrients Global Criteria. 5
Comments and Questions 6
Nine respondents submitted comments to the website (dsfglobalcriteria.org) regarding the 7 applicability of the Nutrient management plan in place to optimize nutrient application (C, N, P, 8 K, and S) indicator for the Soil Nutrients Global Criteria. All commenters indicated that the 9 requirements of a Nutrient Management Plan would need to be clearly defined and articulated for 10 the indicator to be meaningful. Two commenters asked if the Nutrient Management Plan would 11 include nutrient budgets to optimize crop production while minimizing environmental losses. Two 12 commenters expressed concern about how the indicator would be verified or evaluated, and one 13 commenter suggested that the processor/distributor sector could utilize “percent of suppliers 14 completing and implementing a nutrient management plan.” 15
Response to Comments 16
The next phase of the continuous improvement process is Indicator Implementation, which 17 involves developing supporting guidance for regional and local membership to benchmark, assess, 18 and improve each indicator. The details that commenters requested should be developed and 19 communicated through a Sustainability Assessment Guide (SAG) created for each indicator by the 20 organization that is implementing the indicator. The continuous improvement process adopted by 21 DSF focuses on benchmarking with implementation addressed in the Indicator through national, 22 regional, and/or enterprise level organizations. These may vary across regions, based upon existing 23 infrastructure and support for assessment and reporting. 24
Recommended Indicator 25
The recommended indicator for Soil Nutrients Global Criteria is Implementation of a Nutrient 26 Management Plan. 27
2.3. Soil Quality and Retention Candidate Indicator Selection 28
The scores for the Survey results for the Soil Quality and Retention global criteria are 29 shown in the table below. Results are arranged from highest to lowest Matrix Priority Score. Soil 30 quality is maintained or improved by good management practices had the highest score. The 31 Efficacy Analysis for the top four soil quality indicators is shown in Table 4. The Efficacy score 32 for the Soil quality is maintained or improved by good management practices indicator was much 33 higher than the scores for the next closest candidates. These results indicate that the Soil quality is 34

8
maintained or improved by good management practices indicator would be the most appropriate 1 for the Soil Quality and Retention Global Criteria. 2
Table 3: Soil Quality and Retention indicator scores based on DSF survey 3 results 4
5
Table 4: Efficacy Analysis scoring for Top Candidate Indicators for the 6 Soil Quality and Retention High Level Indicator 7
8
Comments and Questions 9
Nine respondents submitted comments to the website (dsfglobalcriteria.org) regarding the 10 applicability of the Soil quality is maintained or improved by good management practices indicator 11 for the Soil Quality and Retention criteria. All commenters indicated that the indicator was very 12 vague and would need to be clearly defined and articulated for the indicator to be meaningful. 13 Commenters recommended definitions of “good soil quality” and “good management practices.” 14 Several commenters expressed concern about the global applicability of the indicator unless 15

9
regional practices and standards were addressed. One commenter suggested that the soil quality 1 and retention be combined with the soil nutrients global criteria and further indicated it could be 2 helpful to reflect the impact of climate change on soil carbon. One commenter suggested that 3 “Evidence of soil health tests are available and records of management practices performed to 4 enhance soil quality are kept” as an alternative indicator. 5
Response to Comments 6
The adoption of good management practices for soil quality is a vague indicator, as the 7 comments suggested. That is because selection and implementation of good soil management 8 practices is very context specific, and must be developed by local stakeholders with knowledge of 9 specific conditions that occur within the affected region. Supporting guidance for regional and 10 local membership to define good management practices for soil quality should be developed by 11 the implementing party. One respondent suggested combining the two global criteria for soil – soil 12 nutrients and soil quality. These criterial do represent similar characteristics in soil systems, and 13 could be combined without loss of impact. 14
Recommended Indicator 15
The recommended indicator for the Soil Quality and Retention Global Criteria is Soil quality is 16 maintained or improved by good management practices. 17
2.4. Biodiversity Candidate Indicator Selection 18
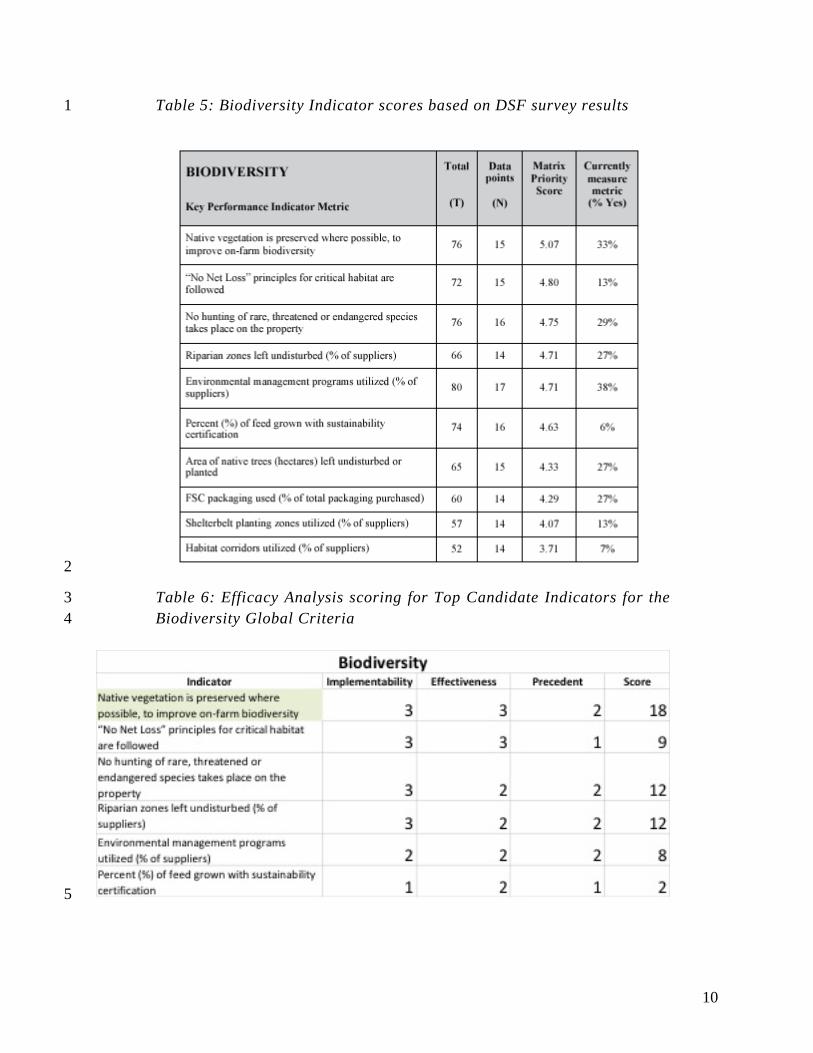
The scores for the Survey results for the Biodiversity Global Criteria are shown in Table 5. Results 19 are arranged from highest to lowest Matrix Priority Score. The Native vegetation is preserved 20 where possible, to improve on-farm biodiversity indicator had the highest score. The Efficacy 21 Analysis for the top six indicators is shown in Table 6. The Efficacy score for the Native vegetation 22 is preserved where possible, to improve on-farm biodiversity indicator was much higher than the 23 scores for the next closest indicator candidates. These results suggest that the Native vegetation is 24 preserved where possible, to improve on-farm biodiversity indicator would be the most appropriate 25 to represent the Biodiversity Global Criteria. 26
27
10
Table 5: Biodiversity Indicator scores based on DSF survey results 1
2
Table 6: Efficacy Analysis scoring for Top Candidate Indicators for the 3 Biodiversity Global Criteria 4
5

11
Comments and Questions 1
Ten respondents submitted comments to the website (dsfglobalcriteria.org) regarding the 2 applicability of the Native vegetation is preserved where possible, to improve on-farm biodiversity 3 indicator for the Biodiversity Global Criteria. All commenters indicated that the indicator was very 4 vague and would need to be clearly defined and articulated for the indicator to be meaningful. 5 Commenters indicated the need for clarification of “native vegetation,” “where possible” and 6 “good management practices.” Several commenters expressed concern about the global 7 applicability of the indicator unless regional practices and standards were addressed, and about 8 how this indicator would be reported and verified. Several commenters requested that the IDF 9 Guide on biodiversity be utilized for this indicator. One commenter suggested an alternative metric 10 of “Percent of permanent grassland and land not in production (woodland, hedges, waterways),” 11 and another suggested “Percent of land related to the total land that is maintained in cooperation 12 with a nature conservation association.” 13
Response to Comments 14
Biodiversity is one of the most complicated and integrated criteria in sustainability systems. 15 The indicator is not intended to be a prescriptive method but rather a common strategy for driving 16 the criteria’s strategic intent. The details that commenters called for are reasonable, and should be 17 developed as a local SAG. The IDF Guide on Biodiversity recommended by several commenters 18 is one possible framework that could meet thiscriteria. The IDF protocol might have limited 19 application in some regions where farm-scale data are difficult to aggregate and analyze. 20
Recommended Indicator 21
The recommended indicator for the Biodiversity Global Criteria is Native vegetation is preserved 22 where possible, to improve on-farm biodiversity. 23
24
2.5. Water Availability and Quality Candidate Indicator Selection 25
The scores for the Survey results for the Water Availability and Quality Global Criteria are 26 shown in the table below. Results are arranged from highest to lowest Matrix Priority Score. The 27 indicator Water Quality testing is routinely conducted had the highest matrix priority score. The 28 Efficacy Analysis for the top six candidate indicators is shown in Table 8. 29
30

12
Table 7: Water Availability & Quality Candidate Indicator scores based 1 on DSF survey results 2
3

13
Table 8: Efficacy Analysis scoring for Top Candidate Indicators for the 1 Water Availability & Quality High Level Indicator 2
3
The Efficacy scores for Water quality testing is routinely conducted and Effluent 4 management plan in place to minimize impacts to water quality were both 27. These values were 5 much higher than the next ranking efficacy scores. Effluent management plans include water 6 quality testing regimes, and thus the recommended indicator for water quality is adoption of 7 effluent management plans. The Water Availability and Quality Global Criteria represent two 8 types of measurement: volume and quality. The highest scoring indicator for water volume was 9 Water Consumption is monitored and a plan is in place to minimize consumption. 10
Comments and Questions 11
Eight respondents submitted comments to the website (dsfglobalcriteria.org) regarding the 12 applicability of the Water quality testing is routinely conducted indicator for the Water Availability 13 and Quality Global Criteria. All commenters suggested that the indicator was vague and would 14 need to be clearly defined and articulated for the indicator to be meaningful. Commenters indicated 15 that clarification was needed regarding whether water testing was for incoming or outgoing water. 16 Several commenters further expressed the need for identification of testing parameters, frequency 17 of testing, and location of testing. Some commenters also wondered if this indicator was more 18 appropriate for processors than for producers. 19
Three DSF members submitted comments regarding the applicability of the Effluent 20 management plan in place to minimize impacts to water quality indicator. All commenters 21 indicated that the indicator needed further clarification. Commenters wondered if the indicator 22 would align with local and regional effluent regulations or if there would be extra requirements 23 beyond meeting those regulations. 24
25

14
Response Comments 1
Reviewers suggested differences in water quality and quantity require two indicators. For 2 Water Availability and Quality, the candidate indicators for water quality that had the highest 3 efficacy scores were Effluent management plan in place to minimize impacts to water quality, and 4 Water quality testing is routinely conducted to indicate the condition of water quality. These two 5 indicators apply to discharged water quality from the dairy production process. Effluent 6 management plans include water quality testing, so encompass the more limited indicator. The 7 details that member commenters requested should be developed and communicated through a SAG 8 created for effluent management plans. The issues associated with water consumption can be 9 difficult, since inefficient water use and expanding water scarcity are the issues of concern. Water 10 consumption is not a desirable indicator as there should always be adequate quantities of clean 11 water available to the cow for consumption to support animal health and welfare. The larger issue 12 is water waste associated with the entire operation. Therefore, a more targeted indicator would be 13 Water Use Efficiency for Production, which includes wash-down, cleanout, and other water 14 resource demands, with the eye to efficiency without compromising animal health or process 15 sanitation. The strategies for increasing water use efficiency may vary across regions, based upon 16 existing infrastructure and support for assessment and reporting. 17
Recommended Indicator 18
The recommended indicators for the Water Availability and Quality Global Criteria are Effluent 19 management plan in place to minimize impacts to water quality, and Water Use Efficiency for 20 Production. 21
22
2.6. Working Conditions Candidate Indicator Selection 23
The scores for the Survey results for the Working Conditions Global Criteria are shown in 24 the table below. Results are arranged from highest to lowest Matrix Priority Score. The metric 25 Employees are paid a living wage had the highest matrix priority score. The Efficacy Analysis for 26 the top six candidate indicators is shown in Table 10. 27

15
Table 9: Working Conditions Candidate Indicator scores based on DSF 1 survey results 2
3

16
Table 10: Efficacy Analysis scoring for Top Candidate Indicators for the 1 Working Conditions High Level Indicator 2
3
The Efficacy scores for Employees are paid a living wage, Number of accidents per year 4 monitored, and Plans are in place to reduce the risk of employee exposure to pesticides and 5 chemicals were all 27. These values were much higher than the next ranking efficacy scores. These 6 results indicate that one of these indicators could be the most appropriate for the Working 7 Conditions Global Criteria. 8
DSF Member comments and questions 9
Seven DSF members submitted comments to the website (dsfglobalcriteria.org) regarding 10 the applicability of the top indicators for the Working Conditions Global Criteria. All commenters 11 indicated that Employees are paid a living wage needed further definition and clarification. 12 Commenters mentioned the regional aspect of wages, which could make this indicator complicated 13 for global companies. Several commenters mentioned that wage is less accurate of a measure for 14 those suppliers who provide benefits like housing, transportation, or health care in addition to 15 wages. Some commenters indicated that wages are often regulated by governments so they felt the 16 indicator was already addressed at that level. Several commenters preferred the indicators that 17 addressed worker safety over wages. 18
Four DSF members submitted comments regarding the Number of accidents per year 19 monitored indicator. Commenters indicated that the indicator would need further development and 20 clarification regarding the threshold definition of “accident.” Commenters indicated that the 21 indicator would need further context of the total number of employees and number of working 22 hours per day to be meaningful. One commenter suggested that “lost work days per total work 23 days due to accidents” could be a more meaningful indicator. 24
Two commenters addressed the Plans are in place to reduce the risk of employee exposure 25 to pesticides and chemicals indicator. Commenters indicated that the indicator was vague and 26
17
would need further development regarding plan requirements. Commenters suggested that this 1 indicator could be combined with the Number of accidents per year monitored as a requirement 2 for a Safety Plan that covers accidents and exposure. 3
Response to DSF Member Comments 4
The concerns over the three candidate indicators expressed by commenters were evaluated 5 and resulted in a new candidate indicator. Commenters recommended that living wages would not 6 be an effective indicator because wages paid did not include other methods of compensation such 7 as housing, and because regional living wages are not well defined across global member nations. 8 The other two indicators were suggested to be incomplete but captured a common value – worker 9 safety. These comments resulted in development of a consolidated indicator: Farm Safety Plan is 10 in place to ensure worker safety. The definition of the Farm Safety Plan should include 11 requirements regarding both accident monitoring and reducing employee exposure risks. 12
Recommended Indicator 13
The recommended indicator for the Working Conditions Global Criteria is Farm Safety Plan is 14 in place to ensure worker safety or Employee Safety Plan is in place to ensure worker safety. 15
3. NEXT STEPS IN INDICATOR DEVELOPMENT 16
The role of DSF in the continuous improvement process is to provide common indicators 17 across the 11 global criteria, and to align benchmarking for those indicators. Improvement 18 processes within each indicator are the responsibility and authority of national, regional, and/or 19 enterprise organizations (Figure 4). The purpose of the indicators is to provide the DSF 20 membership with a common strategy for benchmarking each of the five priority global criteria. It 21 is not the intention of DSF to set strategic goals for each indicator, or to create or implement a 22 process of improvement for each indicator. That role belongs to the national, regional, or 23 enterprise-level organizations that support DSF. 24
One mechanism DSF members could use for this implementation is to develop a portfolio 25 of Sustainability Application Guides (SAGS) for each indicator. These SAGS could be used to 26 standardize measurements, educate participants, and drive change across the global dairy industry. 27 While these activities are outside the scope of DSF, the Global Criteria and Indicators developed 28 through this document provide a common framework for DSF members to apply to creating a more 29 sustainable global dairy supply chain. 30
31


![Necenová kritéria – zkušenosti - sovz.czsovz.cz/.../2018/...kriteria_zkusenosti-zadavatele.pdf · Zpráva EK - hodnotící kritéria Indicator [5]: Award Criteria This indicator](https://img.dokumen.tips/doc/110x75/5d2ac97f88c9936e158dee58/necenova-kriteria-zkusenosti-sovz-zprava-ek-hodnotici-kriteria.jpg)