Embed Size (px)
DESCRIPTION
Global crises in a resource-constrained, multipolar world. John Humphrey Globalisation Team. Outline. Looming, long-term crises New powers and multipolarity Equity Timeframes Governance. Increased demand 50% by 2030 (IEA) Energy. Increasing population - PowerPoint PPT Presentation
Citation preview

Global crises in a resource-constrained, multipolar world
John HumphreyGlobalisation Team

Outline
1. Looming, long-term crises
2. New powers and multipolarity
3. Equity
4. Timeframes
5. Governance

But food security is only part of a ‘Perfect Storm’ of global events
Increased demand 50% by 2030 (IEA)
Energy
Water Increased demand
30% by 2030
(IFPRI)
FoodIncreased demand
50% by 2030
(FAO)
Climate Change
1. Increasing population
2. Increasing levels of urbanisation
3. The rightful goal to alleviate poverty
4. Climate Change
John BeddingtonChief Scientific AdvisorUK Government

0
5
10
15
20
25
30
35
40
45
50
China India United States Japan Germany
US
$ (
Tri
llio
ns
at 2
00
3 P
ric
es
)GDP Projections, 2050
Source: Goldman Sachs, Dreaming With BRICs: The Path to 2050

Distribution of Increase in Glohbal GDP, 1990-2005, by Region/Country
(PPP, %)
USA
China
India
Rest of Developing Asia
Japan
Other OECD
MENA
LAC
ECA
Source: David Dollar, presentation to GDN, Beijing,Jan 2007
USA
China
India
Rest ofDev Asia
Other OECD

1985198619871988198919901991199219931994199519961997199819992000200120022003200420052006200720080
10
20
30
40
50
60
70
80
90
15.1
35.3
84.9
64.7
Shares of World Trade in Goods and Services1985-2008
Non OECD
OECD - To-tal
Per
Cen
t

Financial crisis
Accelerates convergence continuing growth in rising powers possible stagnation in Europe
Heightens the need for global governance to be more inclusive – G20 not G8
Undermines West’s claim for economic superiority
Increases confidence and assertiveness of rising powers


Total GHG Emissions, 2000, MtCO2 equivalent
United States
China EU-25 Russia India Japan0
1000
2000
3000
4000
5000
6000
7000
8000

Incremental GHG emissions 2004-30 (% of global total)
NAFTA China OECD-Europe Russia India OECD-Asia0
10
20
30
40
50
Pe
r C
en
t

GHG Emissions, 2000, per capita
United States
China EU-25 Russia India Japan0
5
10
15
20
25
30
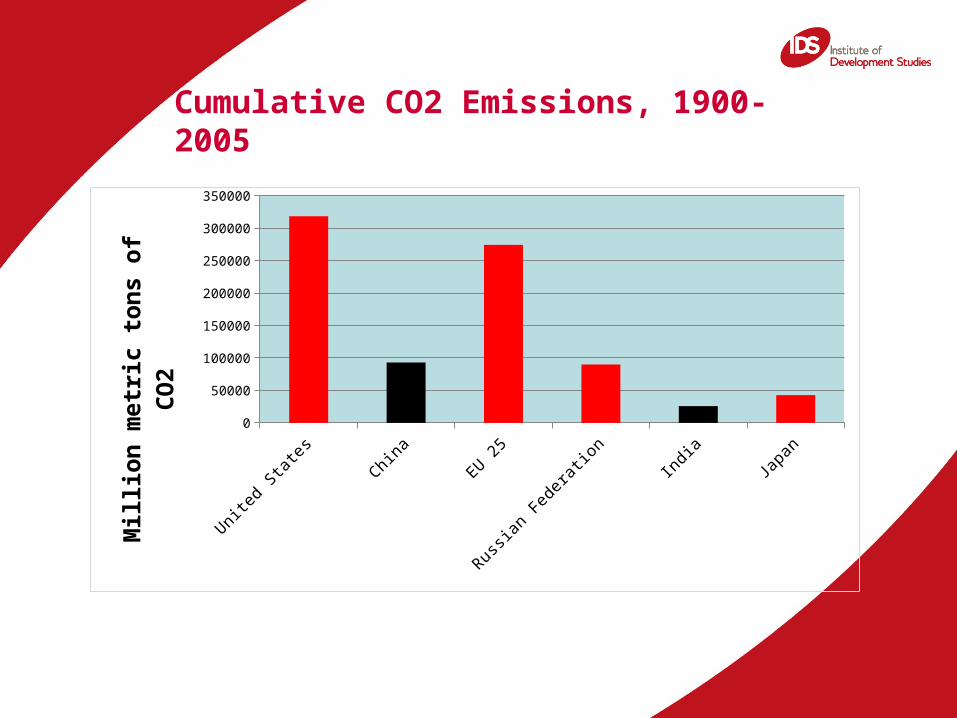
Cumulative CO2 Emissions, 1900-2005
United States China EU 25 Russian Federation
India Japan0
50000
100000
150000
200000
250000
300000
350000
Mil
lio
n m
etri
c to
ns
of
CO
2

•The Observer, Sunday 7 March 2010
How food and water are driving a 21st-century African land grabAn Observer investigation reveals how rich countries faced by a global food shortage now farm an area double the size of the UK to guarantee supplies for their citizens
A woman tends vegetables at a giant Saudi-financed farm in Ethiopia.….Nestling below an escarpment of the Rift Valley, the development is far from finished, but the plastic and steel structure already stretches over 20 hectares – the size of 20 football pitches.

Time
Climate or weather?
Long term stresses in relation to acute shocks
How much are current volatilities in food and energy prices indicators of long-term trends?
2030 versus today
Bringing the future into the present


Governance (1)
The Beddington strategy defragment – in multiple crises focus on risk and uncertainty place value on the future – foresight
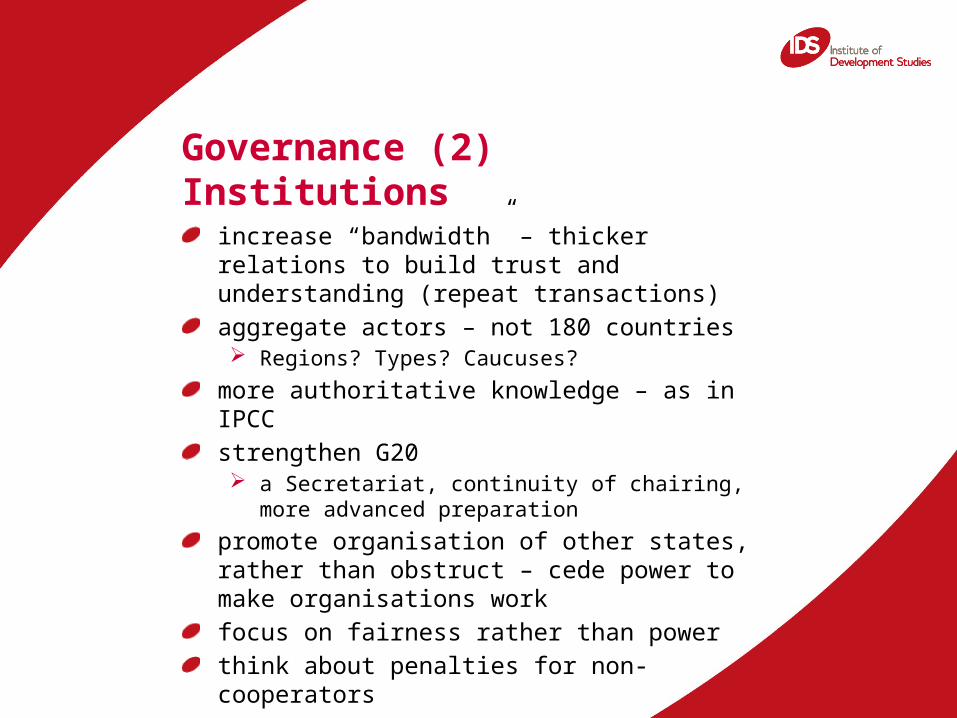
Governance (2) Institutions
increase “bandwidth” – thicker relations to build trust and understanding (repeat transactions)
aggregate actors – not 180 countries Regions? Types? Caucuses?
more authoritative knowledge – as in IPCC
strengthen G20 a Secretariat, continuity of chairing, more advanced
preparation
promote organisation of other states, rather than obstruct – cede power to make organisations work
focus on fairness rather than power
think about penalties for non-cooperators

1990 1991 1992 1993 1994 1995 1996 1997 1998 1999 2000 2001 2002 2003 2004 2005 2006 2007 20080%
2%
4%
6%
8%
10%
12%
14%
1.80%
8.89%
0.52%1.10%
11.41%
8.01%
Total Merchandise Trade (% of World Exports)
China
India
US