Embed Size (px)
Citation preview

Technical Document – Version 15 September 2021
1
Global COVID-19 Vaccination – Strategic Vision for 2022
Technical Document
1.7_Global_regional
SAGE meeting October 2021 1

Technical Document – Version 15 September 2021
2
Contents
Overview of exhibits and tables .................................................................................................................... 3
Abbreviations ................................................................................................................................................ 5
1 Executive summary ............................................................................................................................... 7
2 Background ......................................................................................................................................... 11
2.1 Initial response to the COVID-19 pandemic in 2020 ................................................................... 11
2.2 Current context ........................................................................................................................... 12
2.3 Rationale and objectives for this work ....................................................................................... 12
2.4 Governance and technical document development process ..................................................... 14
2.5 Methodological approach ........................................................................................................... 15
3 Conceptual Goal Framework .............................................................................................................. 17
3.1 Structure and rationale ............................................................................................................... 17
3.2 Establishing vaccination targets within the Framework ............................................................. 20
3.3 Uncertainties associated with the goals of the Framework ....................................................... 22
4 Goal synthesis under different scenarios ........................................................................................... 25
5 Building the consensus for an updated global COVID-19 vaccination strategic vision ...................... 29
6 Acknowledgements ............................................................................................................................ 33
7 Annexes ............................................................................................................................................... 34
7.1 Annex I: Task Team and Ad-hoc Strategy Group Members and terms of reference .................. 34
7.1.1 Governance ......................................................................................................................... 34
7.1.2 Task team ............................................................................................................................ 34
7.2 Annex II: Vaccination targets and uncertainties associated with the conceptual Goal
Framework .............................................................................................................................................. 37
7.2.1 Age-descending prioritization versus other common approaches ..................................... 37
7.2.2 Scenario analysis of vaccination targets ............................................................................. 38
7.2.3 Variables affecting vaccination targets and goal achievement: working assumptions for
scenario analysis ................................................................................................................................. 41
7.3 Annex III: Vaccination ambition and progress to date ................................................................ 42
7.3.1 Methodology ....................................................................................................................... 42
7.3.2 Results ................................................................................................................................. 42
7.4 Annex IV: Health and economic returns of achieving vaccination targets ................................. 44
7.4.1 Methodology: Health impact .............................................................................................. 44
7.4.2 Results: Health impact ........................................................................................................ 46
7.4.3 Results: Sensitivity analysis ................................................................................................. 49
7.4.4 Incremental economic benefit analysis for moving to goals of higher ambition ............... 61
1.7_Global_regional
SAGE meeting October 2021 2
Technical Document – Version 15 September 2021
3
7.5 Annex V: Doses required and supply available ........................................................................... 65
7.5.1 Methodology: Dose requirements ...................................................................................... 65
7.5.2 Results: Dose requirements ................................................................................................ 69
7.5.3 Methodology: Global vaccine supply .................................................................................. 71
7.5.4 Methodology: Key distribution assumptions ...................................................................... 73
7.5.5 Results: Global vaccine supply availability .......................................................................... 74
7.5.6 Results: Dose required versus supply balance .................................................................... 75
7.6 Annex VI: Costing and funding .................................................................................................... 77
7.6.1 Methodology: Costing ......................................................................................................... 77
7.6.2 Results: Costing ................................................................................................................... 81
7.6.3 Funding................................................................................................................................ 82
7.7 Annex VII: Programmatic constraints ......................................................................................... 84
7.7.1 Methodology: Programmatic constraints ........................................................................... 84
7.7.2 Results: Programmatic constraints ..................................................................................... 86
Overview of exhibits and tables
Exhibit 1. Methodological approach and document outline ...................................................................... 15
Exhibit 2. Public health and social measures are supported by multiple response pillars ......................... 17
Exhibit 3. The conceptual Goal Framework ................................................................................................ 19
Exhibit 4. Key uncertainties tied to the conceptual Goal Framework ........................................................ 25
Exhibit 5. Stepwise approach along the trajectory of potential global goals ............................................. 30
Exhibit 6. Options for a single global COVID-19 vaccination strategy for 2021–2022 ................................ 33
Exhibit 7. Global COVID-19 Vaccine Strategy – organization and governance ........................................... 34
Exhibit 8. Publicly-stated country vaccination goals ................................................................................... 43
Exhibit 9. Deaths, hospitalizations and infections averted per 100 fully vaccinated people (FVP) by
country income group ................................................................................................................................. 47
Exhibit 10. Age group in which deaths are averted for each vaccination coverage age targeting strategy
.................................................................................................................................................................... 48
Exhibit 11. Share of population recovered from COVID-19 before vaccination campaign begins and levels
of implied PHSM to suppress transmission during the period of vaccination ............................................ 49
Exhibit 12. Timing of window of vaccination relative to epidemic peak .................................................... 49
Exhibit 13. Deaths per million population per day and deaths averted per million population by country
income group .............................................................................................................................................. 50
Exhibit 14. LMIC example: deaths per million population per day and deaths averted per 100 fully
vaccinated people (FVP) for default versus VOC settings ........................................................................... 51
1.7_Global_regional
SAGE meeting October 2021 3

Technical Document – Version 15 September 2021
4
Exhibit 15. Deaths averted per million population for default versus VOC settings by country income
group ........................................................................................................................................................... 51
Exhibit 16. LMIC example: deaths per million population per day and deaths averted per 100 fully
vaccinated people (FVP) for default versus three scenarios ...................................................................... 53
Exhibit 17. LMIC example: deaths, hospitalizations and infections averted per million population for
default versus disease-blocking vaccine only ............................................................................................. 54
Exhibit 18. LMIC example: deaths, hospitalizations and infections averted per million population for
default versus health systems unconstrained in LIC/LMIC ......................................................................... 55
Exhibit 19. LMIC example: deaths, hospitalizations and infections averted per million population for
default versus children <10 years 50% less infectious ................................................................................ 56
Exhibit 20. Age groups in which hospitalizations averted for each vaccination coverage age targeting
strategy by country income group .............................................................................................................. 57
Exhibit 21. Age groups in which infections averted for each vaccination coverage age targeting strategy
by country income group ............................................................................................................................ 58
Exhibit 22. LMIC example: deaths averted per million population for different vaccination rollout timings
relative to peak ........................................................................................................................................... 59
Exhibit 23. Deaths averted per million population for alternative coverage levels within priority groups,
by country income group ............................................................................................................................ 60
Exhibit 24. Deaths per million population by vaccination status and country income group .................... 61
Exhibit 25. Pre-pandemic projections and forecast revisions to global growth ......................................... 62
Exhibit 26. Uptake of country groups ......................................................................................................... 68
Exhibit 27. Grouping of countries and uptake assumptions ....................................................................... 68
Exhibit 28. Dose requirements .................................................................................................................... 70
Exhibit 29. Evolution of dose requirements by scenario ............................................................................ 71
Exhibit 30. Production estimates in billion doses of COVID-19 vaccines per annum ................................. 75
Exhibit 31. Biennial supply–demand balance by group (low supply scenario) ........................................... 77
Exhibit 32. Indicative cost of reaching different vaccination targets in LMICs and LICs over a two-year
period .......................................................................................................................................................... 82
Exhibit 33. Number of countries and population with potential financial and system challenges by
scenario ....................................................................................................................................................... 87
1.7_Global_regional
SAGE meeting October 2021 4

Technical Document – Version 15 September 2021
5
Table 1. Task team terms of reference ....................................................................................................... 35
Table 2. Ad-hoc Strategy Group terms of reference ................................................................................... 36
Table 3. Rationale behind choice of age thresholds ................................................................................... 39
Table 4. Vaccination target age thresholds and within age group coverage, for scenario analysis ........... 45
Table 5. Example lower-middle-income country scenario of deaths versus GDP losses under different
PHSM levels during the vaccination rollout in Q3 2021 (preliminary projections) .................................... 63
Table 6. Example low-income country scenario of deaths versus GDP losses under different vaccination
and PHSM strategy combinations implemented over 2021–2022 ............................................................. 64
Table 7. Dose requirements scenarios ........................................................................................................ 66
Table 8. Assumptions on programmatic coverage ..................................................................................... 67
Table 9. Costs categories included in cost estimates.................................................................................. 78
Table 10. Assumptions for human resource surge cost estimates ............................................................. 81
Table 11. Modelling public revenues generated by vaccinations ............................................................... 85
Abbreviations International organizations
AU African Union
Africa CDC Africa Centres for Disease Control and Prevention
BMGF Bill and Melinda Gates Foundation
CDC Centers for Disease Control and Prevention (United States)
China CDC Chinese Center for Disease Control and Prevention
CEPI Coalition for Epidemic Preparedness Innovations
DCVMN Developing Countries Vaccine Manufacturers Network
FCDO Foreign, Commonwealth & Development Office (United Kingdom)
Gavi Global Alliance for Vaccines and Immunization
IFPMA International Federation of Pharmaceutical Manufacturers & Associations
IMF International Monetary Fund
MDB Multilateral Development Bank
PAHO Pam American Health Organization
WHO World Health Organization
1.7_Global_regional
SAGE meeting October 2021 5

Technical Document – Version 15 September 2021
6
Country classifications
HICs High-income countries
UMICs Upper-middle-income countries
LMICs Lower-middle-income countries
LICs Low-income countries
AMC Advanced market commitment: qualifying countries can receive vaccines through COVAX with costs partially covered
AMC92 92 countries which qualify for AMC
SFP Self-financing participants: countries which obtain vaccines through COVAX but cover all costs themselves
Further departments and groups
ACT-A The Access to COVID-19 Tools (ACT) Accelerator: cross-organizational collaboration to accelerate development, production and equitable access to COVID-19 tests, treatments and vaccines
COVAX Vaccine pillar of ACT-A
SAGE WHO Strategic Advisory Group of Experts on Immunization
SPRP Strategic Preparedness and Response Plan: WHO guidance to countries, regions etc. on action required to overcome the ongoing challenges in the response to COVID-19
Technical language around epidemiology, health systems etc.
HW Health and care workers
IFR Infection fatality ratio
MIS-C Multisystem inflammatory syndrome in children
PHSM Public health and social measures
PTRS Probability of technical and regulatory success
VOC Variant of concern
1.7_Global_regional
SAGE meeting October 2021 6

Technical Document – Version 15 September 2021
7
1 Executive summary
Following the WHO declaration of novel coronavirus as a public health emergency of international concern on 30 January 2020, the main global immunization partners developed a global COVID-19 vaccination strategy, through the Access to COVID-19 Tools Accelerator (ACT-A) Vaccines Pillar (COVAX), led by WHO. The strategy set two linked goals, to protect individual and public health and to minimize societal and economic impact, by focusing vaccination efforts on reduction of mortality, hospitalization and severe disease. Building on the strategy and anticipating initial supply constraints, COVAX set out to provide vaccine supply fairly and equitably by deploying two billion doses to vaccinate at least 20% of each country’s population by the end of 2021.
Since then, powerful tools – including vaccines – have been developed to fight the pandemic. Globally, there are at least 17 vaccines in use, with 5.4 billion doses administered as of 6 September 2021, and another ~300 vaccine candidates in clinical and preclinical development. If used according to WHO recommendations, the 3.8 billion doses deployed as of 26 July 2021 would have been sufficient to cover the initial target of 20% of the population in every country, nearly halving the proposed time to achieve the 2021 global goal. However, the world is not on track to meet this ambition, with the great majority of high-income countries (HICs) exceeding the target and very few low-income countries (LICs) being able to vaccinate even those most at risk of severe disease or death.
Meanwhile countries have been racing to set out vaccination coverage ambitions for 2021–2022. Often, these newly-set targets do not appear to take account of specific health goals, scientific uncertainties, underlying country demographics or resource implications and could, therefore, lead to suboptimal outcomes in the effort to end the acute phase of the pandemic.
Targets are also uncoordinated among countries: the adoption of plans with an exclusive national focus that disregards the global nature of the pandemic undermines the efforts to limit the spread of the virus. Lack of cross-country coordination will send weak signals to investors and manufacturers and will affect future availability of resources for research and development, manufacturing, purchase and delivery of vaccines. Uncoordinated target-setting also risks further increasing inequities with dire health consequences, particularly in lower-income settings, and economic consequences for all countries.
The Global COVID-19 Vaccination Strategic Vision for 2022 – technical document is aimed at technical audiences in order to inform and stimulate debate on the COVID-19 vaccination agenda for 2022. Specifically, the technical document will be leveraged to: 1) support and inform country-specific vaccination targets and global vaccination goals for 2022 accounting for key uncertainties; 2) promote a coordinated and equitable approach to COVID-19 vaccination globally as part of the broader pandemic control strategy; and 3) inform global policy-making, access efforts and investment decisions by financial and donor institutions, research and development groups, and vaccine manufacturers.
The technical document proposes a conceptual “Goal Framework” identifying possible socioeconomic and health goals, set out along a continuum which countries and the international community as a whole can pursue with vaccination efforts. In contrast to setting coverage targets as goals in themselves, the framework emphasizes the importance of defining explicit socioeconomic and health goals and working towards equitable outcomes for all, both within and between countries.
Additionally, the technical document contains various analyses, such as country targets that have been announced to date, progress in their implementation, current scientific knowledge and uncertainties,
1.7_Global_regional
SAGE meeting October 2021 7

Technical Document – Version 15 September 2021
8
health and economic returns to vaccination, doses required and supply available, and drivers of costs and programmatic constraints, as well as important investments to date.
Leveraging the framework and the analysis, the following elements are highlighted towards building a
consensus for a Global COVID-19 Vaccination Strategic Vision for 2022:
• Vaccination targets must be globally coordinated and countries need to move together to achieve a series of goals. A coordinated approach reinforces the sense of equity between countries, which has already suffered given significant coverage disparities during the course of the past year. Nationalistic approaches (such as the rollout of vaccines to younger populations or of booster doses in higher-income country settings in the face of scientific uncertainty) are a moral and strategic failure when lower-income countries have not yet had an opportunity to protect their most vulnerable populations. Nationalistic approaches also represent a lost opportunity for more effective disease control, which could both slow the emergence of variants of concern (VOCs) and reinforce economic growth in an interconnected global economy. Indeed, the emergence of VOCs can lead to new waves of infection and threaten to reinstate control measures even in countries with high vaccination coverage.
• Country-specific vaccination targets should be driven by setting clear goals and analysis of what is required to achieve them while taking account of local circumstances, including demographic, priority population distribution, and broader context (e.g. humanitarian crisis). While many global goals have been described so far in terms of a share of total population to be reached equally across all countries, this may trigger unintended vaccination strategies (such as vaccination of children in countries with younger demographic structures) with uncertain benefits and possibly inefficient use of limited resources. This work argues for a move away from this approach.
• Mitigating future risks is important. While several unknowns are at play and evidence is being gathered (e.g. on longer-term impacts of mild disease, vaccine safety, dosing and effectiveness in younger age cohorts, VOCs), decisions are needed now about investments that will determine the opportunities of the near future. Notably, assuring global supply – in order potentially to expand vaccination programmes – is key while allowing greater clarity about policy and programmatic use over time.
• There are four discrete steps that countries and the global community could choose to pursue on the pathway to full global recovery:
o The first step in this chain focuses on reducing the highest risk of mortality by vaccination of older populations and other high-risk groups. This step is: 1) scientifically sound and proven to be efficient in reducing deaths and hospitalizations; 2) already established as a global goal and an unfinished agenda for which the speed of implementation has important global equity, health and economic implications; and 3) feasible in all countries now from supply, financing and programmatic perspectives.
o The second step of reducing the disease burden and limiting the impact on the health system expands vaccination to the full adult population. This step: 1) provides important health returns on investment and is likely to be required for the resumption of socioeconomic activity; 2) is supported by political will and significant ongoing investments; and 3) could be feasible for the majority of countries (with external support for lower-income countries) in 2022.
o The evidence supporting the rationale for potential third and fourth steps towards reducing virus transmission and preventing future risks by vaccinating larger shares of
1.7_Global_regional
SAGE meeting October 2021 8

Technical Document – Version 15 September 2021
9
younger populations – i.e. adolescents and younger children respectively – is still being developed. There is insufficient scientific evidence relating to the impact of VOCs (e.g. on vaccine performance for various outcomes, pace of resurgence), unknown trade-offs between natural versus vaccine-induced immunity, longer-term impacts of mild disease, and vaccine safety evidence in younger age groups. Furthermore, these steps require substantially greater financial and programmatic investment, raising concerns about trade-offs vis-à-vis other health, non-health, and pandemic recovery investments across country settings, particularly at high dose requirements.
In light of the above, this technical document offers three options for a single Global COVID-19 Vaccination Strategic Vision for 2022, as follows:
A. Retain the still-unfinished agenda of ‘Older adult and high-risk group global vaccination goal’ aiming at reducing highest risk of mortality while keeping public health and social measures (PHSM) in place when needed for crisis response. The world is struggling to meet this goal which was set for 2021; restating it provides an opportunity to attract the level of focus and attention needed before further levels of ambition are laid out. The downside of this option is that no supplies and resources are planned for pursuing more ambitious goals. If vaccine nationalism continues to prevail, this will leave resource-constrained countries far behind.
B. Collectively pursue an “all adults global vaccination goal with risk mitigation” for 2022, aiming at reducing disease burden and limiting health system impact and putting countries on a trajectory toward resuming socioeconomic activity. This vision provides important health returns on investment and is actively pursued and implemented in most higher-income settings. Establishing this as the global goal creates a level playing field for countries to move together, leaving no one behind. This option also proposes to put in place a risk mitigation strategy by securing the systems and supply investments needed to secure the goal (e.g. should boosters be needed) or advance further (e.g. younger age groups) if deemed necessary once scientific uncertainties are cleared.
C. An ambitious, no-regret “all age groups (universal) global vaccination goal” aiming to mitigate future health risks for full global recovery. Although the necessity of all-age vaccination is unclear at this time, the evidence on the scientific rationale and product development evidence are underway. Setting such an ambitious goal for 2022 would imply very important investments, yet there is an opportunity to leverage this goal for the wider common benefit. Living at a time of unprecedented challenge and attention to vaccines as key public health tools, a universal COVID-19 vaccination effort could both mitigate future risks related to this disease as well as strengthen primary health-care systems and other immunization activities.
Making a clear choice on a single global collective ambition, and consolidating current fragmented targets, will enhance equal opportunities for all countries. With this ambition in mind, each country will determine its own steps toward that global goal under national sovereignty and adapted to its local circumstances.
The Global COVID-19 Vaccination Strategic Vision for 2022 was submitted to the WHO Strategic Advisory Group of Experts on Immunization (SAGE) for critical appraisal on 29 June 2021. SAGE deliberated and expressed preference for Option B, namely an “All adult global vaccination strategy with risk mitigation” as its recommended global goal for 2022, inspired by a vision to enhance feasibility, sustainability and equity of outcomes and recognizing the substantial scientific uncertainties inherent in
1.7_Global_regional
SAGE meeting October 2021 9

Technical Document – Version 15 September 2021
10
Option C. SAGE recognized that vaccination of adolescents and children, towards a universal immunization approach may be needed in future and emphasized the importance of market preparedness to ensure equitable health outcomes.
SAGE’s critical appraisal will be reviewed by WHO during the month of August 2021 for deliberation on the way forward in the fight against the pandemic. Additional analysis will be conducted and new evidence collected on an ongoing basis so that the strategic thinking is periodically updated as warranted by the evidence, including individual country aspirations.
While the Global COVID-19 Vaccination Strategic Vision for 2022 – technical document guides the technical community in goal-setting, the description of policy options to achieve the various goals continues through regular policy forums led by WHO.
1.7_Global_regional
SAGE meeting October 2021 10

Technical Document – Version 15 September 2021
11
2 Background
2.1 Initial response to the COVID-19 pandemic in 2020
During the first months of the COVID-19 pandemic, when vaccines were in the early stages of preclinical and clinical development, the main global immunization partners developed a Global COVID-19 Vaccination Strategy, through the Access to COVID-19 Tools Accelerator (ACT-A) Vaccines Pillar (COVAX), led by WHO. The strategy was based on two linked goals:
1. to protect individual and public health by reducing the burden of disease related to COVID-19 and by protecting the capacity of health systems to care for COVID-19 and non-COVID-19 patients (i.e. the “lives” goal); and
2. to minimize societal and economic impact, thereby enabling society and the economy to function with confidence without risking the health of the community and that of its health systems (i.e. the “livelihoods” goal).
In practice, a global COVID-19 vaccination programme would deliver on both goals primarily by focusing vaccination efforts on the reduction of mortality, hospitalization and severe disease. Building on the WHO Global COVID-19 Vaccination Strategy and anticipating one or more effective vaccines in the future which would be subject to significant initial supply constraints, COVAX set out to provide vaccine supply fairly and equitably. COVAX set a target of 2 billion doses, aiming to ensure that at least 20% of each country’s population could be vaccinated by the end of 2021. This level of supply was estimated to be sufficient to vaccinate both health workers and care workers and those at the highest risk of severe disease and death (e.g. older adults and people with co-morbidities that increased their risk of disease).1
The WHO Strategic Advisory Group of Experts on Immunization (SAGE) endorsed a recommendation for
a Values Framework for the allocation and prioritization of COVID-19 vaccination.2 The Framework laid
out six principles and 12 objectives to support the achievement of the dual strategy goals, plus an
accompanying Roadmap for prioritizing the uses of COVID-19 vaccines in the context of limited supply
(Prioritization Roadmap).3 The Prioritization Roadmap guided countries towards a stepwise prioritization
of target populations to achieve maximum public health impact during this initial period of constrained
1 COVAX, the ACT-Accelerator vaccines pillar. Geneva: World Health Organization (https://www.who.int/publications/m/item/covax-the-act-accelerator-vaccines-pillar, accessed 3 August 2021). 2 WHO SAGE values framework for the allocation and prioritization of COVID-19 vaccination. Geneva: World Health Organization 2020 (https://apps.who.int/iris/bitstream/handle/10665/334299/WHO-2019-nCoV-SAGE_Framework-Allocation_and_prioritization-2020.1-eng.pdf?sequence=1&isAllowed=y, accessed 3 August 2021). 3 Roadmap for prioritizing the uses of COVID-19 vaccines in the context of limited supply. Geneva: World Health Organization; 2020 (updated July 2021) (https://www.who.int/publications/i/item/who-sage-roadmap-for-prioritizing-uses-of-covid-19-vaccines-in-the-context-of-limited-supply, accessed 3 August 2021).
1.7_Global_regional
SAGE meeting October 2021 11

Technical Document – Version 15 September 2021
12
vaccine supply.4 A fair allocation mechanism was also established for COVID-19 vaccines purchased
through the COVAX Facility.5
2.2 Current context
Over 18 months have now passed since January 2020 when WHO declared the novel coronavirus a public health emergency of international concern. Since then, and motivated by the tremendous suffering COVID-19 has caused across the world, scientific understanding of SARS-CoV-2 and COVID-19 has progressed rapidly through research activities across the globe and powerful tools – including vaccines –have been developed to fight the pandemic. Globally, 17 vaccines are now in use, with 3.8 billion doses administered as of 26 June 2021. Some 75% of these have been administered by only 10 countries and fewer than 1% in low-income countries (LICs) as a whole. If used in line with WHO recommendations, this number of doses would already have been sufficient to cover the initial target of 20% of the population in every country — indeed supply projections for the full year far exceed it. But the world is not on track to meet that ambition. While the great majority of high-income countries (HICs) have exceeded the 20% target, as of early September, only 12 low- and middle-income countries (LMICs – out of 47) and no LICs have reached it. Together they represent just 108 million of the 2.5 billion people living in these countries6, supporting the fact that vaccine supply currently remains limited and its distribution is highly inequitable.7
Meanwhile diverging vaccine coverage ambitions for 2021–2022 are now apparent. Some countries are pursuing “no regrets” approaches to reducing disease and minimizing transmission by vaccinating anyone for whom vaccine use has been authorized. Others are considering how broadly to scale their programmes and are contemplating what they need to do in order to relax public health and social measures (PHSM) sustainably in pursuit of social and economic recovery.
2.3 Rationale and objectives for this work
Given the dynamics of an ongoing pandemic and the dual goals of protecting both lives and socioeconomic well-being, individual countries are setting ambitious vaccination coverage targets. However, these efforts are uncoordinated and the resource requirements and implications associated with the targets are not made explicit.
Such uncoordinated target-setting is likely to further exacerbate the already unequal distribution of vaccines and thus constrain the overall impact of efforts to combat COVID-19. This will both prolong the
4 Whereas the Global Strategy and the SAGE values framework addressed allocation of vaccine supply between countries, the Prioritization Roadmap addressed only vaccine use within countries. 5 Fair allocation mechanism for COVID-19 vaccines through the COVAX facility. Geneva: World Health Organization; 2020 (https://www.who.int/publications/m/item/fair-allocation-mechanism-for-covid-19-vaccines-through-the-covax-facility, accessed 3 August 2021). 6 Excluding India who also reached 20% lately 7 As defined by 40 doses administered per 100 population (at least 20% theoretical coverage, assuming most vaccine types require two doses) as of 26 July 2021 (WHO COVID-19 Dashboard, using the World Bank list of economies).
1.7_Global_regional
SAGE meeting October 2021 12

Technical Document – Version 15 September 2021
13
pandemic unnecessarily and delay global recovery. Without a globally coordinated approach to pandemic control – one in which vaccination is one of a broader range of tools – the pandemic will trigger further declines in gross domestic product (GDP) around the world. Trillions of dollars are at stake. The burden on every country – even those with some of the highest vaccine coverage and access rates – will continue to increase.8 In the absence of a global, time-specific strategic vision, this race towards ever more ambitious vaccination coverage targets may, rather perversely, sustain the pandemic by allowing more variants of concern (VOCs) to emerge and place unnecessary strain on health systems.9
It is thus crucial for countries to take informed, evidence-based decisions in setting their vaccination targets so that population coverage goals are based on both a clear understanding of benefits, risks, resource requirements, externalities and key uncertainties and respect for national as well as global ethical and equity commitments. Such an approach to vaccine strategic planning will result in more sustainable choices and yield greater benefits for all.
Strategy decisions need to be evidence-based while clearly ascertaining, specifying and accounting for sources of uncertainty, some of which will be resolved during the period covered by the strategic vision. At the time of writing, some aspects of the COVID-19 vaccine strategic vision are already clear, especially regarding the direct impact of the vaccines and the need to prioritize health and care workers (HWs) and those at highest risk. Conversely, active data-gathering, synthesis and deliberation about evidence is still ongoing in order to provide the answers to questions relating to strategic trade-offs. Among other issues, these questions relate to matters such as duration of protection, need for booster or additional primary series doses, virus evolution, the potential threat posed by VOCs, the full clinical impact of disease and infection, the ability of vaccines to reduce transmission and the potential impact of endemic disease circulation among low-risk cohorts in generating natural immunity. Individual countries and the international community as a whole need to weigh these uncertainties carefully when determining the size and best use of resources and assessing their capacity to mitigate risk. Some investments are clearly and unambiguously needed while others will have to be entered into on a contingent basis as the evidence accumulates over the coming months.
8 The economic case for global vaccinations. Paris: International Chamber of Commerce; 2021 (https://iccwbo.org/publication/the-economic-case-for-global-vaccinations/, accessed 19 March 2021). The paper demonstrates the economic costs of suboptimal vaccine distribution to the international trading system on the global scale, showing that even if a particular country has access to the vaccine, it ‘‘experiences a sluggish recovery with a drag on its GDP’’ if its trading partners do not have such access. The economic costs borne by wealthy countries in the absence of multilateral coordination guaranteeing vaccine access and distribution range between US$ 203 billion and US$ 5 trillion, depending on the strength of trade and international production network relations. 9 An uncoordinated, “me-first” approach to vaccination not only condemns the world’s poorest and most vulnerable to unnecessary risk, it is strategically and economically self-defeating (SPRP 2021). Geneva: World Health Organization (WHO coronavirus (COVID-19) dashboard (https://covid19.who.int/, accessed 24 March 2021). The Lancet COVID-19 Commission Task Force on Public Health Measures to Suppress the Pandemic. 2021. SARS-CoV-2 variants: the need for urgent public health action beyond vaccines (https://covid19commission.org/commission-publications, accessed 7 August 2021). (https://static1.squarespace.com/static/5ef3652ab722df11fcb2ba5d/t/60a3d54f8b42b505d0d0de4f/1621349714141/NPIs+TF+Policy+Brief+March+2021.pdf, accessed 26 August 2021).
1.7_Global_regional
SAGE meeting October 2021 13

Technical Document – Version 15 September 2021
14
Global leaders are calling for joint efforts to end the pandemic.10 Fresh thinking about global targets is underway with recent calls for action by the African Union (AU), G7, G20, International Monetary Fund (IMF), World Bank, WHO and others.11,12,13,14,15,16 WHO, in collaboration with its key global, regional and national stakeholders, believes there is a compelling need to consolidate these targets and develop a clear Global COVID-19 Vaccine Strategic Vision for 2022.
The present work aims to stimulate technical debate on a strategic vision for 2022 and inform:
• individual national vaccination targets and global vaccination goals for 2022 in light of key uncertainties;
• an equitable approach to COVID-19 vaccination globally, as part of the broader pandemic control strategy;
• global policymaking and access efforts, investment decisions by financial and donor institutions, R&D groups and vaccine manufacturers and country planning and programmatic work.
Although this work focuses on the role of vaccination, this must always be considered in the broader context of reinforcing primary health care – leaving no one behind. As will be made clear in the analysis, the capacity of health-care systems across countries is a critical factor in combating this pandemic successfully.
2.4 Governance and technical document development process
This technical document was developed by a multi-partner task team comprising representatives from global and regional organizations. The task team met weekly from April to June 2021, building on the work of existing working groups and ongoing analytical efforts across the COVAX partnership and beyond. A broader ad-hoc Strategy Working Group comprising more than 30 individuals from country, regional and global institutions across many constituencies met three times during the course of the work to provide
10 Secretary-General's remarks to event on pandemic preparedness and response financing architecture. New York (NY): United Nations; 2021 (https://www.un.org/sg/en/content/sg/statement/2021-04-26/secretary-generals-remarks-event-pandemic-preparedness-and-response-financing-architecture, accessed 8 August 2021). 11 The goal is to vaccinate 60% of Africans by 2022: Africa CDC. South African Broadcasting Corporation, 15 January 2021 (https://www.sabcnews.com/sabcnews/the-goal-is-to-vaccinate-60-of-africans-by-2022-africa-cdc/, accessed 9 August 2021). 12 G7 Carbis Bay Summit Communique and Health Declaration. G7, 11–13 June 2021 (https://www.g7uk.org/, accessed 9 August 2021). 13 G20 Summit and events, December 2020–December 2021 (https://www.g20.org/, accessed 9 August 2021). 14 Agarwal R, Gopinath G. A proposal to end the COVID-19 pandemic. IMF Staff Discussion Notes. Washington (DC): International Monetary Fund; 2021 (https://www.imf.org/en/Publications/Staff-Discussion-Notes/Issues/2021/05/19/A-Proposal-to-End-the-COVID-19-Pandemic-460263, accessed 9 August 2021). 15 Call to action on COVID vaccine access for developing countries by heads of World Bank Group and International Monetary Fund. Washington (DC): World Bank and International Monetary Fund; 2021 (https://www.imf.org/en/News/Articles/2021/06/03/pr21157-wb-and-imf-heads-call-to-action-covid-vaccine-access-developing-countries, accessed 9 August 2021). 16 Director-General’s opening remarks at the World Health Assembly – 24 May 2021. Geneva: World Health Organization; 2021 (https://www.who.int/director-general/speeches/detail/director-general-s-opening-remarks-at-the-world-health-assembly---24-may-2021 , accessed 9 August 2021).
1.7_Global_regional
SAGE meeting October 2021 14

Technical Document – Version 15 September 2021
15
strategic direction. Terms of reference for both the task team and the ad-hoc Strategy Working Group are available in Annex I.
2.5 Methodological approach
The Global COVID-19 Vaccination Strategic Vision for 2022 – technical document has been developed following several analytical steps, namely:
1. Development of a goal framework, identifying a continuum of potential socioeconomic and health goals that could be pursued, with vaccination efforts and related scientific uncertainties mapped onto it.
2. Scenario analyses of:
• possible vaccination targets for achieving each goal, including modelled health impacts;
• resource requirements for achieving each goal, including programmatic vaccine dose requirements, procurement costs and country operational costs for vaccine delivery;
• resource availability, including available supply and financial and system constraints.
3. A goal synthesis was conducted to:
• identify countries’ current vaccination ambitions relative to the goal framework;
• identify barriers on the path towards goals;
• identify the incremental benefits for moving between goals.
4. In light of the framework, the scenario analysis and the goal synthesis, three options for an updated single global strategic vision have been developed.
A schematic representation of this methodological approach is set out in Exhibit 1.
Exhibit 1. Methodological approach and document outline
1.7_Global_regional
SAGE meeting October 2021 15

Technical Document – Version 15 September 2021
16
It is important to emphasize that the scenarios used for this analysis were chosen to explore possible trajectories and the resilience of proposed strategic options to different types of uncertainty. They do not constitute forecasts by WHO or any of its participating partners as to the likely trajectory of the pandemic nor of any anticipated vaccine performance, regulatory or policy decisions. Neither do these scenarios represent any judgement by WHO or participating partners about their relative desirability.
1.7_Global_regional
SAGE meeting October 2021 16

Technical Document – Version 15 September 2021
17
3 Conceptual Goal Framework
3.1 Structure and rationale
The development of the conceptual Goal Framework (also simply referred to as the “Goal Framework” or “Framework” hereafter) builds on WHO’s broader COVID-19 Strategic Preparedness and Response Plan (SPRP) first published in 2020 and updated in 2021.17 The SPRP outlines a comprehensive approach to suppress transmission, reduce exposure, prevent infection and reduce disease and death. The plan also identifies interconnected and systematic interventions to achieve this (Exhibit 2). As one of the SPRP’s pillars, vaccination must be deployed in combination with other PHSM, diagnostics, therapeutics and broader health-system functions to constitute a comprehensive response to COVID-19 that also builds resilience against future disease threats. The SPRP’s strategic objectives inform and align with the health and socioeconomic dimensions of the Global COVID-19 Vaccine Strategic Vision Goal Framework.
Exhibit 2. Public health and social measures are supported by multiple response pillars
Like the 2020 COVID-19 Global Vaccination Strategy, the Goal Framework is anchored to the dual ambitions of 1) protecting health and 2) protecting social and economic welfare, extending the “lives”
17 COVID-19 Strategic Preparedness and Response Plan (SPRP 2021). Geneva: World Health Organization; 2021 (https://www.who.int/publications/i/item/WHO-WHE-2021.02, accessed 9 August 2021).
1.7_Global_regional
SAGE meeting October 2021 17

Technical Document – Version 15 September 2021
18
and “livelihoods” goals from 2021 to a continuum of goals throughout 2022 (Exhibit 3). The socioeconomic dimension of the Goal Framework is itself a continuum stretching from more to less stringent PHSM, which in turn is assumed to lead to increasing social and economic activity (horizontal axis of Exhibit 3). In the absence of vaccination, any movement along this socioeconomic dimension achieved by relieving PHSM interventions is associated with an increased effective reproductive number (i.e. accelerating transmission) of the SARS-CoV2 virus. This results in increased health impacts in the form of cases, deaths and strain on health-care systems, leading to further loss of life, health and well-being.
The health dimension of the Goal Framework (the vertical axis of Exhibit 3) is also represented by a continuum moving from severe to less severe outcomes at population level. The sequencing of goals along the health dimension provides continuity with the 2020 strategy by prioritizing the reduction of severe disease (and its associated mortality and capacity to overwhelm health systems) as a means of achieving goals for both lives and livelihoods.
The Framework connects these two dimensions, making the key assumption that every country’s underlying ambition over the 2021–2022 period is to use vaccination as a tool to reach a “new normal” – with social and economic activity resumed to the greatest extent possible while minimizing negative health impacts and building back better, including stronger health systems. Because movement to more “normal” settings of social and economic activity implies greater transmission potential, higher vaccination coverage targets are required to achieve and maintain health goals at the same level while countries reduce PHSM. How far and how high vaccine coverage must go and be maintained to return societies to a normal state, without risking surges in cases, remains unknown; as a result, the ultimate vaccine goal is to extend vaccination as far as is needed as swiftly as possible.
By applying this logic, the Framework provides options for different combinations of socioeconomic and health goals that countries may commit to over time.18 In the context of this pandemic, health and socioeconomic goals are inextricably linked and this set of combinations is not exhaustive. The level of vaccination ambition for each target factors in both demographics and the strength of health systems, viral transmission patterns and the vaccine products being used (see Key uncertainties and other considerations below). The Framework is not intended to represent an endorsement of any specific combination of goals and vaccination targets, but rather to lay out the possible options in a way that is clear both for countries and for the international community as a whole. These combinations of health and socioeconomic goals yield four levels of aspiration for vaccination coverage, namely:
• Low: the minimum level of vaccination needed to protect the most vulnerable population groups who have the highest risk of severe outcomes. Existing PHSM should be maintained as vaccines are being rolled out – with different stringency levels depending on transmission intensity, capacity and country context. Achieving this goal will have the greatest impact in reducing mortality.
• Medium: an intermediate level of vaccination, delivered while PHSM are in force in order to reduce disease burden and protect the health system from being overwhelmed as PHSM are relaxed, or to achieve an equivalent reduction in mortality while fully resuming some socioeconomic activity.
18 “It is well understood that there can be no lasting end to the economic crisis without an end to the health crisis. Pandemic policy is thus economic policy.” IMF Blog, 21 May 2021. Washington (DC): International Monetary Fund; 2021 (https://blogs.imf.org/2021/05/21/a-proposal-to-end-the-covid-19-pandemic/, accessed 9 August 2021).
1.7_Global_regional
SAGE meeting October 2021 18

Technical Document – Version 15 September 2021
19
• High: the level of vaccination needed to reduce SARS-CoV-2 transmission and disease burden while protecting the health system from being overwhelmed when PHSM are reduced to travel measures only.
• Very high: the highest level of vaccine coverage, with the intention of reducing viral transmission, including curbing the emergence and transmission of VOCs while lifting all society-wide PHSM.
It is important to stress the dynamic nature of the Goal Framework. The Framework embodies the assumption that a specified combination of health-socioeconomic goals can be achieved at a given level of vaccination. If the aim becomes to attain the same health goal with fewer PHSM in place, vaccination coverage would need to increase (as we move from left to right). Importantly, modelling shows that reducing PHSM too early in the course of vaccine rollout reduces the public health benefit of the programme, because transmission rates increase before the maximum impact of vaccination is reached (Annex IV).
The conceptual Goal Framework (Exhibit 3) is intended to help countries make more explicit the rationale for their vaccination coverage targets at a given point in time. It is also intended to facilitate dialogue between countries and with global partners about where collective action is most needed together with the trade-offs involved in pursuing different goal combinations. In contrast to setting coverage targets as goals in themselves, the Framework emphasizes the importance of defining explicit health and socioeconomic goals which then drive coverage targets that are tailored to country characteristics. This approach reinforces working towards equitable outcomes for all within and between countries, in a specified time period. In this Goal Framework, vaccination is positioned as an instrument to achieve outcomes which are both informed and equitable.
Exhibit 3. The conceptual Goal Framework
1.7_Global_regional
SAGE meeting October 2021 19

Technical Document – Version 15 September 2021
20
Exhibit 3: The socioeconomic dimension (horizontal axis) begins with: 1) stringent PHSM in place (forms of stay-at-home policies, business closures and gathering and movement restrictions), moving to 2) less stringent PHSM (e.g. masks, distancing, travel measures), to 2) only travel measures in place at points of entry with a “new normal” of restored economic and social activity within national borders, and finally to 4) lifting travel measures to return to a “new normal” both domestically and with international trade and travel. At all stages along the socioeconomic goal continuum it is assumed that routine public health measures are in place (e.g. testing, contact tracing and isolation/quarantine, with intensity and scope calibrated to the epidemiological setting). In the absence of vaccination, movement along the socioeconomic dimension by releasing PHSM is associated with increases in the effective reproductive number (i.e. acceleration of transmission).
The health dimension begins from the goal of: 1) reducing COVID-19 mortality and protecting health workers (many of whom face higher SARS-CoV-2 occupational exposure risk), followed by the goal of 2) reducing COVID-19 disease burden (including long COVID) and protecting the health system (including avoiding being overwhelmed by COVID-19 cases and maintaining delivery of other essential services), and finally the goal of 3) reducing transmission, thereby also further reducing severe disease and death and constraining the emergence of variants which may undermine vaccine impact.
Note that frameworks for considering the trade-offs between protecting lives or protecting livelihoods have been developed to help countries calibrate their PHSM and can be used along with the Goal Framework in this COVID-19 vaccination strategic vision to assess qualitatively the impact of combining vaccination targets with different PHSM. Importantly, we note that PHSM vary in their feasibility of implementation across various age groups and settings.19
3.2 Establishing vaccination targets within the Framework
As countries increase their vaccination reach, the guidance presented in the SAGE Prioritization Roadmap highlights the sequence in which groups could be considered for priority use of limited vaccine supply at different levels of vaccination ambition, both as vaccine supplies becomes available and in different epidemiological settings (e.g. community transmission, sporadic outbreaks or clusters of cases, and no cases). In line with this Goal Framework, the roadmap treats groups according to the principles and objectives of the SAGE Values Framework. Groups are therefore prioritized for multiple reasons in the roadmap (e.g. preserving essential societal functions and observing ethical principles) and not only to maximize health benefits. The roadmap recommends that health workers at high risk of exposure and older adults be prioritized for initial vaccine supply in most settings, in line with the initial targets and rationale of the 2020 Global Vaccination Strategy and COVAX Fair Allocation Mechanism to protect health workers (and thus health-care systems) and reduce mortality. It should be noted that for vaccine supplies sufficient for less than 50% of the population as a whole, the roadmap does not recommend prioritizing vaccination of adolescents and children except for those at high risk of severe disease due to specific comorbidities, and only as vaccines are authorized for use in these age groups.
While countries are encouraged to follow the roadmap for context-specific sequencing of groups, the analyses informing the Global COVID-19 Vaccine Strategic Vision Goal Framework use an age-descending prioritization order for vaccination targets. This is not intended to indicate recommended policies on implementing vaccination which is the remit of national technical advisory groups, and in WHO the Strategic Advisory Group of Experts on Immunization (SAGE) but was used as described here. For this goal and strategy technical work, age was chosen as a simplifying approach because it is the most consistent
19 Sustaining lives and livelihoods: a decision framework for calibrating social and movement measures during the COVID-19 pandemic. Geneva: World Health Organization; 2020 (https://www.who.int/publications/i/item/9789240017948, accessed 9 August 2021).
1.7_Global_regional
SAGE meeting October 2021 20

Technical Document – Version 15 September 2021
21
risk factor for severe disease and death from COVID-19 in diverse settings around the world, with an exponentially higher infection fatality rate at older ages.20 In addition, some other COVID-19 risk factors (e.g. comorbidities) are correlated with age.21, 22 Feedback from national immunization programmes in planning for and implementing early COVID-19 vaccine rollout has indicated that age-based strategies are programmatically feasible across diverse settings, whereas identifying priority groups for vaccination based on other risk factors may be more challenging. Because of the age-correlated risks of SARS-CoV-2 transmission and COVID-19 hospitalization and death, modelling across multiple country settings finds that the age-descending prioritization strategy performs best under almost all assumptions if the public health goal is to avert deaths and hospitalizations.23
This approach is consistent with the SAGE prioritization roadmap, which strongly emphasizes the importance of protecting the vulnerable first in order to reduce mortality before expanding vaccination to younger or less at-risk populations. This approach can also account for the range of demographic structures in different countries and hence promotes an epidemiologically-driven and efficient use of resources.
By choosing this age-descending approach, mortality reduction and preventing the overwhelming of the health system are implicitly positioned as primary goals. These two goals were agreed in 2020 during the acute stage of the pandemic but they remain an unfinished agenda that is threatened by continued inequitable global access to vaccines.
Comparison of the age-descending prioritization approach with alternative vaccination prioritization strategies is presented in Annex II: Vaccination targets and uncertainties associated with the conceptual Goal Framework.
By adopting the age-descending prioritization approach, the four qualitative levels of vaccination coverage in the conceptual Goal Framework are mapped as follows:
- Low: older adults and high-risk groups
- Medium: all adults
- High: adults and adolescents
- Very high: include children.
20 O’Driscoll M, Ribeiro Dos Santos, G, Wang L, Cummings DAT, Azman AS, Paireau J et al. Age-specific mortality and immunity patterns of SARS-CoV-2. Nature. 2021;590:140–5 (https://www.nature.com/articles/s41586-020-2918-0, accessed 9 August 2021). 21 Clark A, Jit M, Warren-Gash C, Guthrie B, Wang HHX, Mercer SW et al. Global, regional, and national estimates of the population at increased risk of severe COVID-19 due to underlying health conditions in 2020: a modelling study. Lancet Glob Health. 2020;8(8):e1003–7 (https://www.sciencedirect.com/science/article/pii/S2214109X20302643, accessed 9 August 2021). 22 Moore S, Hill EM, Dyson L, Tildesley MJ, Keeling MJ. Modelling optimal vaccination strategy for SARS-CoV-2 in the UK. PLoS Comput Biol. 2021 (https://journals.plos.org/ploscompbiol/article?id=10.1371/journal.pcbi.1008849, accessed 9 August 2021). 23 Saadi N, Chi Y-L, Ghosh S, Eggo RM, McCarthy C, Quaife M et al, Models of COVID-19 vaccine prioritisation: a systematic literature search and narrative review, MedRχiv. 2021 (https://www.medrxiv.org/content/10.1101/2021.06.21.21259104v1, accessed 9 August 2021).
1.7_Global_regional
SAGE meeting October 2021 21

Technical Document – Version 15 September 2021
22
The Goal Framework and the age-descending prioritization strategy should not be interpreted as a policy recommendation by WHO or its partner agencies for vaccinating adolescents and children. Rather, the Framework sees this potential coverage target as implied by certain combinations of health and socioeconomic goals. Within the Framework, expanding vaccination coverage down to adolescents and children is implied by aiming for the health goal of reduced transmission, or of preserving the health goals of reduced mortality or disease burden while lifting PHSM to permit socioeconomic reopening.
3.3 Uncertainties associated with the goals of the Framework
The various combinations of health and socioeconomic goals in the Framework are supported by different levels of scientific knowledge. More ambitious vaccination coverage targets that extend vaccination to younger age groups are characterized by greater uncertainties. Key uncertainties may be roughly grouped into: 1) those which are epidemiology-related; and 2) those which are product (vaccine)-related.
Exhibit 4 displays the main sources of uncertainties across the Framework. These are:
1. Duration of protection: At this time, there is insufficient evidence to assess whether fully vaccinated individuals will require booster doses to prolong duration of protection, and how this may vary across vaccine platforms and products, and in different epidemiological settings (e.g. with different circulating VOCs). Several studies are underway with results expected in the coming months, but evidence across newer vaccine products will take time to accrue. The duration of protection from vaccines (and from natural infection) is a major uncertainty that will shape future epidemic dynamics and the feasibility of achieving any sustainable “herd immunity threshold”.24,25 More information will have important implications for resource planning and sustainability of different goals highlighted in the Framework.
2. Emergence of VOCs: multiple questions remain about the degree of threat posed by VOCs, both in terms of the frequency of their appearance and their ability to circumvent vaccine protection.26 If VOCs are more transmissible but do not substantially reduce vaccine protection, higher population vaccination coverage (and/or vaccines that are even more effective in reducing transmission) is needed to secure a given health goal, and the speed of vaccination rollout
24 Sandmann FG, Davies NG, Vassall A, Edmunds WJ, Jit M. The potential health and economic value of SARS-CoV-2 vaccination alongside physical distancing in the UK: a transmission model-based future scenario analysis and economic evaluation, Lancet Infect Dis. 2021;21(7):P962–74. doi:10.1016/S1473-3099(21)00079-7. 25 Saad-Roy CH, Wagner CE, Baker RE, Morris SE, Farrar J, Graham AL et al. Immune life history, vaccination, and the dynamics of SARS-CoV-2 over the next 5 years. Science. 2020;370(6518):811–8. doi:10.1126/science.abd7343. 26 Cobey S, Larremore DB, Grad YH, Lipsitch M. Concerns about SARS-CoV-2 evolution should not hold back efforts to expand vaccination. Nat Rev Immunol. 2021;21:330–5. doi:10.1038/s41577-021-00544-9.
1.7_Global_regional
SAGE meeting October 2021 22

Technical Document – Version 15 September 2021
23
becomes critical to the magnitude of health benefits achieved.27 If VOCs erode vaccine protection against infection but protection against severe outcomes is retained, then higher vaccination coverage is needed to achieve the same health goals, as some of the indirect protection benefits (“herd effects”) of vaccination would be lost. In such scenarios, where the “infection-blocking” properties of vaccines are reduced by VOCs but the “disease-blocking” properties of vaccines are retained, vaccination strategies prioritizing older age groups and those at highest risk of severe disease are even more efficient in reducing mortality and health system impact.28,29 If VOCs reduce vaccine protection against severe outcomes, alternative vaccine products and boosters may be needed. This uncertainty poses questions regarding the need to set transmission reduction targets once disease burden and health system impact are brought under control as well as the need for booster doses targeted to VOCs.
3. Vaccine performance in reducing transmission: The performance of different vaccines in use (and many in development) against viral transmission is still being assessed. Our effective ability to reach transmission reduction goals, including some level of herd immunity, through vaccination remains in question, particularly in the context of more transmissible VOCs.
4. Safety/efficacy for children under 12 years of age: COVID-19 vaccines with WHO Emergency Use Listing (EUL) do not currently (September 2021) have regulatory authorization for use in children below the age of 12 years, and clinical trial evidence in younger age groups is still being accrued. Given the mostly mild disease profile in younger age groups and continued uncertainties around the role of children in transmission of SARS-CoV-2,30 careful consideration is needed of the benefit–risk assessment of vaccine use in these ages, both for individual protection and population public health impact. The feasibility of pursuing universal age vaccination as a means towards viral transmission reduction and full social and economic recovery therefore remains unknown.
5. Endemic disease circulation: The scientific community continues to debate the potentially positive public health implications arising from endemic disease circulation at younger ages when infection is typically mild, for the purpose of population disease control.31,32 If SARS-CoV-2 infection in early childhood confers a degree of durable natural immunity with no or only mild symptoms (as with some other circulating human coronaviruses), this would raise important questions about the degree of resources that should be devoted to building immunity through
27 Hogan AB, Winskill P, Watson OJ, Walker PGT, Whittaker C, Baguelin M et al. Within-country age-based prioritisation, global allocation, and public health impact of a vaccine against SARS-CoV-2: a mathematical modelling analysis. Vaccine. 2021;39(22):2995–3006. doi:10.1016/j.vaccine.2021.04.002. 28 Hogan AB, Winskill P, Watson OJ, Walker PGT, Whittaker C, Baguelin M et al. Within-country age-based prioritisation, global allocation, and public health impact of a vaccine against SARS-CoV-2: a mathematical modelling analysis. Vaccine. 2021;39(22):2995–3006. doi:10.1016/j.vaccine.2021.04.002. 29 Moore S, Hill EM, Dyson L, Tildesley MJ, Keeling MJ. Modelling optimal vaccination strategy for SARS-CoV-2 in the UK. PLoS Comput Biol. 2021 (https://journals.plos.org/ploscompbiol/article?id=10.1371/journal.pcbi.1008849, accessed 9 August 2021). 30 Viner R, Waddington C, Mytton O, Booy R, Ladhani S, Panovska-Griffiths J, et al. Transmission of SARS-CoV-2 by children and young people in households and schools: a meta-analysis of population-based and contact-tracing studies. Lancet preprint (https://ssrn.com/abstract=3883209, accessed 9 August 2021). 31 Lavine JS, Bjornstad O, Antia R. Immunological characteristics govern the transition of COVID-19 to endemicity. Science. 2021;371(6530):741–5. doi:10.1126/science.abe6522. 32 Lavine J S, Bjornstad O, Antia R. Vaccinating children against SARS-CoV-2. BMJ. 2021;373:n1197. doi:10.1136/bmj.n1197.
1.7_Global_regional
SAGE meeting October 2021 23

Technical Document – Version 15 September 2021
24
vaccination in this age group. More scientific knowledge on this matter will help define the desirability and cost-effectiveness of universal vaccination programmes.
6. Clinical impact of infection and disease: The clinical impact of infection and disease is still being ascertained, particularly among younger groups where disease is typically mild. Because of various public health and social measures undertaken by countries during the pandemic (e.g. school closures), the incidence of various clinical manifestations linked to SARS-CoV-2 infection in pediatric populations (e.g. multisystem inflammatory syndrome in children [MIS-C]/pediatric multisystem inflammatory syndrome temporally associated with SARS-CoV-2 [PIMS-TS]) in the absence of such measures is not known.33,34,35 Evidence on longer-term sequelae of COVID-19 infection (i.e. “long COVID”) is needed across age groups, including for persons who experience asymptomatic infection or only mild symptoms.36,37,38 More information on the incidence of any longer-term health consequences due to SARS-CoV-2 infection and COVID-19 could help in determining the importance of vaccination of younger age groups for direct reduction of disease burden in these groups, beyond transmission reduction and indirect reduction of disease burden in other age groups.
7. Percentage of population required to reduce viral transmission: While there are well-established theoretical models to calculate “herd immunity thresholds”, there is as yet no consensus on the percentage of population required to be vaccinated to reach substantial virus transmission reduction across settings given the diversity of demographic structures, social mixing patterns, prevalence of naturally-acquired immunity, implementation of public health and social measures, viral variants, and available vaccine products and their characteristics.39 Importantly, the sustainability of any “herd immunity” depends on the duration of protection from vaccine-induced and naturally-acquired immunity. Further scientific consensus is needed on metrics beyond theoretical herd immunity thresholds to define programmatic COVID-19 disease control targets over the medium term. This has implications around the desirability, feasibility and sustainability of reaching larger and larger shares of the population with COVID-19 vaccination.
The mapping of the seven key uncertainties onto the Goal Framework is depicted in Exhibit 4.
33 Payne AB, Gilani Z, Godfred-Cato S, Belay ED, Feklestein LR, Patel MM et al. Incidence of multisystem inflammatory syndrome in children among US persons infected with SARS-CoV-2. JAMA Netw Open. 2021;4(6):e2116420. doi:10.1001/jamanetworkopen.2021.16420. 34 Feldstein LR, Tenforde MW, Friedman KG, Newhams M, Billig Rose E, Dapul H et al. Characteristics and outcomes of US children and adolescents with multisystem inflammatory syndrome in children (MIS-C) compared with severe acute COVID-19. JAMA. 2021;325(11):1074–87. doi:10.1001/jama.2021.2091. 35 Flood J, Shingleton J, Bennett E, Walker B, Amin-Chowdhury Z, Oligbu G et al. Paediatric multisystem inflammatory syndrome temporally associated with SARS-CoV-2 (PIMS-TS): prospective, national surveillance, United Kingdom and Ireland, 2020. Lancet Regional Health. 2021;3 :100075 (https://www.thelancet.com/journals/lanepe/article/PIIS2666-7762(21)00052-1/fulltext, accessed 9 August 2021). 36 Datta SD, Talwar A, Lee JT. A proposed framework and timeline of the spectrum of disease due to SARS-CoV-2 infection: illness beyond acute infection and public health implications. JAMA. 2020;324(22):2251–2. doi:10.1001/jama.2020.22717. 37 Lewis D. Long COVID and kids: scientists race to find answers. Nature, 14 July 2021 (https://www.nature.com/articles/d41586-021-01935-7, accessed 9 August 2021). 38 Sudre CH, Murray B, Varsavsky T, Graham MS, Penfold RS, Bowyer RC et al. Attributes and predictors of long COVID. Nat Med. 2021;27:626–31. doi:10.1038/s41591-021-01292-y. 39 Hodgson D, Flasche S, Jit M, Kucharski AJ, Centre for Mathematical Modelling of Infectious Disease (CMMID) COVID-19 Working Group. The potential for vaccination-induced herd immunity against the SARS-CoV-2 B.1.1.7 variant. Euro Surveill. 2021;26(20):2100428. doi:10.2807/1560-7917.ES.2021.26.20.2100428.
1.7_Global_regional
SAGE meeting October 2021 24

Technical Document – Version 15 September 2021
25
Exhibit 4. Key uncertainties tied to the conceptual Goal Framework
Exhibit 4: The mapping illustrates that more ambitious targets are linked to more uncertainties. The “Duration of protection” uncertainty factor (No. 1) appears in every tile of the Framework and is dealt with through dose requirement scenarios in the analysis. As vaccination levels increase to achieve reduction of disease burden, the issue of “Clinical impact of infection and disease” (No. 6) becomes relevant, while high vaccination targets that implicitly target children are associated with an increasing number of epidemiological uncertainties.
As we move to the upper-right area of the Framework, we reach a point where the degree of uncertainty, combined with lower disease burden for younger age strata, renders debatable any goal involving vaccination of these younger age groups at present. This discussion is developed further in Chapter 5.
4 Goal synthesis under different scenarios
Many countries and the international community as a whole have stepped up the global fight against the pandemic. A good understanding of the context in which countries operate, the barriers they are likely to face when pursuing vaccination goals in this context and the motivation for overcoming those barriers – these are all important factors in developing a meaningful global strategic vision.
1.X_Global_regional
SAGE meeting October 2021 25

Technical Document – Version 15 September 2021
26
Following the outline proposed in Exhibit 1, a range of perspectives was considered in order to examine the goals in the Framework and assess their feasibility against a given context of demographics and socioeconomic characteristics.40
More specifically, the following approaches were considered:
1. Current vaccination ambitions by country: Countries’ currently stated vaccination targets were
mapped onto the Framework, patterns were identified and ambition levels assessed versus
progress to date and relative to other countries (see Annex III: Vaccination ambition and progress
to date).
2. Health and economic returns: The following were conducted: 1) incremental health benefit
analysis of moving to younger-age strata measuring averted deaths, hospitalizations and
infections; and 2) incremental economic benefits in the form of GDP losses averted with rapid
vaccination rollout (see Annex IV: Health and economic returns of achieving vaccination targets).
3. Doses required and supply available: Supply–dose requirements were calculated and assessed in
terms of their balance for three dosage and three supply scenarios, factoring in variables such as
booster need, uptake, probability of technical and regulatory success, and availability of raw
materials (see Annex V: Doses required and supply available).
4. Costing and funding: Costing requirements were estimated for each vaccination target and each
scenario for lower-income settings and were mapped against potential sources of funding to
assess feasibility (see
5. Annex VI: Costing and funding).
6. Programmatic constraints: The capabilities of countries to realize specific vaccination targets
were assessed by applying financial and systems criteria (see Annex VII: Programmatic
constraints).
Based on the considerations of health and economic benefits, dose requirements, vaccine supply
availability, cost and funding sources and systems constraints outlined above, a goal-synthesis exercise
was conducted and is summarized below.41 The synthesis is intended to stimulate debate on goal-setting
through an evidence-based review, to identify barriers to reaching targets and begin establishing what
is needed to overcome them.
Countries are setting ambitious and diverse vaccination targets driven by technical, political, social and economic considerations. An analysis of targets shows a lack of clarity in how to achieve health and socioeconomic goals: country targets, expressed as vaccination shares of total population, are racing upwards to 50–70% coverage, with a range of implications in terms of age of population to be vaccinated and resources required. For countries with more youthful demographic distributions – most of which are lower-income settings – such targets imply the vaccination of younger children plus very important financial and system investments coupled with significant uncertainty as to the availability of vaccines authorized for use in these age groups, and the benefits and risks of targeting younger age strata.
40 By means of organizing countries into archetypes using the World Bank classification of LICs/LMICs, UMICs and HICs. 41 It is important to note that several of the angles considered above lead to measurable outcomes (e.g. supply–demand balance) and are quantified in analyses presented in the Annexes, while others are factored in using a more qualitative approach (e.g. systems constraints).
1.X_Global_regional
SAGE meeting October 2021 26

Technical Document – Version 15 September 2021
27
The analysis indeed shows important marginal returns from a health viewpoint, both in terms of deaths and hospitalizations averted, from vaccinating larger shares of populations: across countries of all income levels, there is greater health impact in absolute terms from expanding vaccination to an ever-increasing share of the population by descending age cohorts. Nevertheless, under the scenario assumptions modelled, the results suggest that prioritizing vaccination of older adults will achieve the greatest reductions in mortality and hospitalization. While increasing the vaccination target to younger ages increases the overall number of events averted, there are diminishing marginal returns on investment. Vaccinating those <20 years is efficient mainly in reducing viral transmission. This is where uncertainty begins: there are questions about the magnitude of transmission reduction, and the need to vaccinate is in turn linked to the unclear threat posed by VOCs and long COVID and the assessment of some potentially positive public health implications arising from endemic disease circulation at younger ages when infection is typically mild.
The feasibility analysis indicates that there is a realistic chance of delivering adequate global supply over 2021 and 2022 for any of the goals highlighted in the framework, but this will require very clear and timely market signaling to suppliers as well as collaborative behaviour across countries and stakeholders. To ensure that every country has access to limited vaccine supplies in order to meet ambitious vaccination targets, a number of steps are needed.42 These are:
• Anticipate excess vaccine supplies, particularly in the coming months, in order to redistribute surplus doses from higher- to lower-income settings as soon as possible, while urgently evaluating dose stretching and dose optimization strategies to expand effective supply.
• Take steps to enable countries to reach their targets by supporting free cross-border flows of both raw materials and finished vaccines, while ensuring full and global recognition of products with WHO EUL.
• Send early, clear and strong signals about demand to secure manufacturing capacity scale-up.
• Engage both governments and vaccine manufacturers in investing in diversified vaccine production in order to provide developing countries with increased access.
• Advocate for greater transparency about vaccine contracts, options and agreements, as well as doses delivered and required. In these challenging circumstances, information also means access.
System and financial constraints could affect achievement of more ambitious country goals in resource-constrained settings and potential booster requirements may make it difficult to sustain the results, unless considerable external support continues to be mobilized. While global supply shortages have constituted the initial barrier, political will could drive considerable progress as supply picks up. Conversely, the analysis shows that a “ramp-up” phase of vaccine implementation will require much higher throughput capabilities and is likely to be challenging in many settings. The incremental financial demands placed on domestic resources may be unrealistic, let alone the surge in requirements for health and care workers, reliable cold chains, access to data and relevant technology. While additional financial resources may be difficult to mobilize, they are certainly not constrained: official development assistance, multilateral development banks, increased tax revenues and reduced vaccine costs, including through dose donations, are all available sources. Similarly, creative solutions could also be put in place to enhance throughput capabilities. Important investments have already been made and should continue.
42 Many of these actions have already been put forward as necessary in recent calls for action by COVAX, IMF and the World Bank.
1.X_Global_regional
SAGE meeting October 2021 27

Technical Document – Version 15 September 2021
28
It is important to note that – because of demographics, transmission patterns and health system constraints – the biggest incremental benefits of moving to younger age strata are in lower-income countries – i.e. those countries in which trade-offs between ever-increasing COVID-19 vaccination ambitions and other health priorities are also more evident. As goals are set and investments made, including through external support, it is important to ensure this does not come at a cost of impaired immunization outcomes across many other diseases of considerable burden such as measles, pneumonia and diarrhoea where existing vaccination programmes have played an instrumental role in saving lives and avoiding morbidity. There is also a clear risk in terms of foregone opportunities for the expansion of immunization services, whether reaching unserved communities or introducing new antigens (e.g. human papilloma virus vaccines).
To ensure every country has a similar opportunity, we need:
• significant amounts of capital and external support for lower-income settings, including technical and human resources for large campaigns not costed by this work (this should aim to benefit not only the fight against COVID-19, but also the wider immunization and primary health care programmes);
• vaccine procurement and distribution plans, and a campaign to convey the life-saving importance of approved COVID-19 vaccinations. 43,44
There are moral, health and economic considerations of lower and/or slower COVID-19 vaccination rollout in resource-constrained settings. With rising cases, many lower-income countries could find themselves not just hit by high health costs but also facing limited consumption and socioeconomic activity because of PHSM. Unequal vaccination rates also represent a lost opportunity for more effective disease control, which could both slow the emergence of VOCs and reinforce economic growth in an interconnected global economy. Indeed, the emergence of VOCs could lead to new waves of infection and threaten to reinstate control measures even in countries with high vaccination coverage. In addition, there could be economic losses due to reduced international trade and capital flows. Countries choosing – or being compelled by lack of resources or supply to choose – to pursue a limited vaccination target will also have an impact on those countries with higher incomes; the International Chamber of commerce (ICC), IMF and other institutions have clearly highlighted the ways in which an interconnected global value chain acts on GDP gains or losses everywhere. The return on public investment for an equitable global vaccination strategic vision would be the highest in modern history – capturing 40% of a cumulative US$ 9 trillion in global GDP gains and roughly US$ 1 trillion in additional tax revenues.45
All countries, of all income strata, are likely to be challenged by the potential requirement to adapt vaccine products as well as having to lead their populations towards widespread vaccine acceptance. In the later phase of the fight against the pandemic, tailoring efforts to persuade the hard-to-reach will be essential.
43 WHO, World Trade Organization, the World Bank Group and IMF have already urged international support for US$ 50 billion of financing aimed at achieving more equitable access to vaccines and thus helping to end the pandemic everywhere. 44 As already called for by COVAX, IMF and the World Bank. 45 G7 announces pledges of 870 million COVID-19 vaccine doses, of which at least half to be delivered by the end of 2021. WHO news release (https://www.who.int/news/item/13-06-2021-g7-announces-pledges-of-870-million-covid-19-vaccine-doses-of-which-at-least-half-to-be-delivered-by-the-end-of-2021, accessed 9 August 2021).
1.X_Global_regional
SAGE meeting October 2021 28

Technical Document – Version 15 September 2021
29
5 Building the consensus for an updated global COVID-19 vaccination strategic vision
This technical document provides a conceptual Goal Framework to help set vaccination goals and targets coherently, driven by the health impacts required to enable the relaxation of PHSM and thus the restoration of social and economic activity. The document also lays out known and unknown uncertainties, resource limitations, incremental benefits and trade-offs. In light of this, the following important considerations are put forward to stimulate dialogue on a Global COVID-19 Vaccination Strategic Vision for 2022:
● The path to full global recovery should advance through several goals in a stepwise approach
(Exhibit 5), as follows:
o Step 1 – Reducing the highest risk of mortality while maintaining PHSM at crisis
response levels. This goal is associated with a “low” vaccination target, focusing on older
adults and populations at high risk.
o Step 2 – Reducing disease burden and limiting health system impact puts countries on
a trajectory towards a resumption of “normal” socioeconomic activity. This goal is
associated with a “mid”-level vaccination target and translates into vaccinating the entire
adult population.
o Step 3 – Reducing SARS-CoV-2 transmission as socioeconomic activity restarts and
normalizes. This goal is associated with a “high” vaccination target, equivalent to all
adults and adolescents.
o Step 4 – Further mitigating future health risks in a full global recovery. This goal is associated with “very high” vaccination targets, reaching all of a population, including the children.
● Completing the immunization of those most at risk must be a precondition for proceeding to more ambitious targets.
1.X_Global_regional
SAGE meeting October 2021 29

Technical Document – Version 15 September 2021
30
Exhibit 5. Stepwise approach along the trajectory of potential global goals
● The key findings of the analysis are that all available evidence for both the desirability and feasibility of each goal and vaccination target needs to be carefully considered at country level, but that this condition is not sufficient to ensure a globally sustainable outcome. Vaccination targets must be coordinated and countries will need to move together along the chain of goals to achieve greatest impact. A coordinated approach will reinforce the sense of equity between countries, which has already suffered due to large disparities in coverage so far this year. Coordination also leads to greater impact in disease control and suppression of VOCs and bears clear advantages for an interconnected global economy. Nationalistic approaches, such as the rollout of booster doses in higher-income settings in the face of scientific uncertainty as to their incremental benefit, constitute a moral failure when those in lower-income settings have not yet had an opportunity to protect their most vulnerable populations.46 Nationalistic approaches represent a lost opportunity to save lives and reduce the spread of the virus globally.
● Vaccination targets should be driven by an analysis of what is required to achieve specific goals and country-specific targets need to account for local circumstances, including demographic profiles and the distribution of priority populations. While multiple goals have been expressed in terms of the share of the global population to be reached equally across all countries, they have not been consistently driven by epidemiologically-relevant disease and infection goals and may result in implied vaccination strategies (such as vaccination of young children) that were not intended, with uncertain benefits and suboptimal use of resources. For instance, setting a global target of
46 The IMF suggests that setting ambitious and global vaccination targets translates into US$ 9 trillion benefits by 2025, with over 40% of this gain going to advanced economies. The International Chamber of Commerce (ICC) says: “Our estimates suggest that up to 53% of the global economic costs of the pandemic in 2021 [US$ 1.5–9 trillion] are borne by the advanced economies even if they achieve universal vaccination in their own countries.”
1.X_Global_regional
SAGE meeting October 2021 30

Technical Document – Version 15 September 2021
31
vaccinating all individuals above the age of 20 years implies vaccinating 50% of the world’s population but translates into vaccination of just 34% of the population in those countries with the youngest demographics compared with 58% of people in countries with the oldest.
● Mitigating future risks: The uncertainties highlighted in this technical document pose significant risks. For instance, if variants emerge against which existing vaccines provide an unacceptably low level of protection, countries may have to reinstate PHSM and be willing to maintain them while re-establishing vaccine-driven immunity. Another risk is lower community acceptance of ongoing (or a return to) PHSM of increased intensity, if it is judged they are needed. While these unknowns are in play and evidence is still being gathered, decisions are nevertheless needed now about investments to establish the opportunities in the near future. For instance, ensuring through at-risk investments that the global supply required to vaccinate younger segments of the population is secured now is in fact a “no regrets” investment that will allow policy and programmatic refinement in its use over time. A growing body of evidence about the roles of young adults and adolescents across diverse social and epidemiological settings in viral transmission, disease burden, vaccine performance and demand, as well as the long-term consequences of infection, will allow an adaptive approach to the prioritization of additional population targets.
In light of the above, three options for a single Global COVID-19 Vaccination Strategic Vision for 2022 are
laid out (
1.X_Global_regional
SAGE meeting October 2021 31

Technical Document – Version 15 September 2021
32
Exhibit 6). These are as follows:
A. A COVID-19 vaccination effort focused on an “older adult and high-risk groups global vaccination goal”. This option would:
a. reduce the highest risk of mortality and protect health systems without the need for crisis-level PHSM;
b. focus only on highest-risk groups where the incremental benefits are greatest and would encourage all countries to wait for further evidence about need/desirability of additional ambitions;
c. reinforce and build upon the current, unfinished agenda;
d. continue to emphasize the moral, health and economic failure of the argument of some countries that pursue more ambitious targets before others can provide minimum protection;
e. ensure efficient and effective use of scarce resources for more feasible targets with greater impact;
f. risk leaving the world unprepared if the need for more ambitious vaccination targets becomes evident as more data and knowledge are collected about matters of scientific uncertainty.
B. An “all-adults global vaccination goal with risk mitigation”. This option would:
a. aim to reduce the disease burden and put countries on a trajectory towards the resumption of “normal” socioeconomic activity;
b. prioritize highest-risk groups where the incremental benefits are highest and encourage and support countries to move swiftly through steps 1 and 2 to reach everyone in their adult populations;
c. harness clear political will and ongoing investments and could, with external support, be feasible for the majority of countries, particularly at a low-dose requirement;
d. create a level playing field for countries to move together, acknowledging several nations are already reaching all adult populations;
e. promote the efficient use of resources in the face of many scientific uncertainties about the feasibility and desirability of steps 3 and 4;
f. represent a call for important at-risk investments in vaccine supplies and systems to ensure readiness to implement future steps once scientific uncertainty is resolved – for instance, to be ready to expand immunization to entire populations (including adolescents and children) should evidence make it clear that this is needed, or to boost vaccination where evidence requires it.
C. An ambitious, no-regrets “all age groups (universal) global vaccination goal”. This strategy would:
a. aim to mitigate future health risks to a full global recovery, reaching the highest point in the conceptual Goal Framework;
1.X_Global_regional
SAGE meeting October 2021 32

Technical Document – Version 15 September 2021
33
b. prioritize the highest-risk groups for whom the incremental benefits are greatest, but encourage and support all countries to move quickly through steps 1–4 and vaccinate their entire populations;
c. build on the most ambitious recent calls for action by international organizations, harness political will around COVID-19 vaccination and establish equitable opportunities;
d. probably require massive investment, including in the provision of external technical resources to support and drive a campaign-type approach for rapid immunization against a backdrop of significant scientific uncertainty;
e. require additional scientific information needed for the assessment of vaccines in adolescent and childhood age groups, including on safety, immunogenicity and efficacy against disease and infection (the authorization of vaccines for use in these age groups would be needed, and for some vaccines may not be possible in 2022);
f. require concomitant investment in other immunization activities (e.g. measles, polio catch-up and general reinforcement of immunization infrastructure) and in primary health care. This strategy protects health systems both from the diversion of resources from existing priorities and the inefficient use of resources (e.g. if vaccine safety in children were not demonstrated).
1.X_Global_regional
SAGE meeting October 2021 33

Technical Document – Version 15 September 2021
34
Exhibit 6. Options for a single global COVID-19 vaccination strategy for 2021–2022
Although much has been learned in a very short time, fresh evidence about vaccines, virus evolution, community transmission, population demand and the trajectory of the pandemic means that any suggested strategic vision on vaccination must be a dynamic one. Adaptive goals – adjusted and further specified as knowledge accumulates, the virus adapts and vaccine performance is clarified – will allow the world the agility it needs to reduce the burden of COVID-19 on health systems, economies and societies. Decisions about how best to deploy vaccines for their greatest and most durable impact in the medium term will ultimately depend on the world’s collective resolve and readiness to adapt.
6 Acknowledgements This work has benefitted from the contributions of a number of panels and working groups including (in
alphabetical order): Country Readiness and Delivery Task Team for Global Delivery Costs, COVAX Global
Market Assessment Working Group, COVAX Governance Groups, Harvard School of Public Health (Value
of Vaccination Research Network Secretariat), Imperial College London (MRC Centre for Global Infectious
Disease Analysis), SAGE Working Group on COVID-19 Vaccines.
1.X_Global_regional
SAGE meeting October 2021 34

Technical Document – Version 15 September 2021
35
7 Annexes
7.1 Annex I: Task Team and Ad-hoc Strategy Group Members and
terms of reference
7.1.1 Governance
Exhibit 7. Global COVID-19 Vaccine Strategy – organization and governance
7.1.2 Task team The work is organized in four workstreams: epidemiology, dose requirements, costing/funding and supply,
roughly corresponding to the chapters by which this document is organized (with the Goal Framework as
part of the epidemiology & modelling workstream; Demand, Supply and resource requirements including
the dose requirements and costing analyses; and resource availability tackling funding and supply issues).
The workstreams operate in parallel to do modelling, run simulations, gather data and sources, and
generate results necessary for the completion of the four steps.
As part of the governance structure, a task team – consisting of some 20 persons and including the six workstream (co-)leads – is convened for a short time. The task team oversees the process, develops areas of associated workstreams (as described above) and advances the content of the work. The Task Team convenes once per week for two hours. Between meetings, team members are asked to review the workstreams’ outputs and conduct/coordinate analytical work.
1.X_Global_regional
SAGE meeting October 2021 35

Technical Document – Version 15 September 2021
36
Table 1. Task team terms of reference
Objectives Oversee overall progress of project deliverables
Develop the areas of work for the workstreams
Advance the content of the work on the strategic vision with input from workstreams
Prepare materials on the Global COVID-19 Vaccination Strategic Vision for review by the SAGE COVID-19 Working Group
Members African Union Nicaise Ndembi
African Union Ahmed Ogwell Ouma - ALTERNATE
Bill & Melinda Gates Foundation Emily Dansereau
The Yellow House Shanelle Hall
WHO Kate O'Brien
WHO Joachim Hombach
FCDO Charlotte Watts
FCDO Chris Lewis - ALTERNATE Yale University, Pakistan and SAGE working group link Saad Omer
China CDC and SAGE working group link Yin Zundong
Gavi Dominique Maugeais - ALTERNATE
WHO Nathalie Van de Maele
WHO Mathieu Boniol
WHO Tania Cernuschi (Workstream lead)
Gavi Hannah Kettler (Workstream lead)
CDC and SAGE working group link Sarah Pallas (Workstream lead)
WHO Peter Cowley (Workstream lead)
WHO Olivier Le Polain (Workstream lead)
UNICEF Ulla Griffiths (Workstream lead)
European Commission Isabel de la Mata
European Commission Canice Nolan - ALTERNATE
Deliverables Definition of key questions to be addressed by the four workstreams: Epidemiology & Modelling, Demand, Supply, Resource requirements
Report and/or model with sets of three epidemiological, supply, demand and resource requirements scenarios
High-level feasibility and benefit–resource analysis, assessing requirements for any given goal under the set of identified scenarios
Understand and inform goals through a stakeholder engagement process
WHO global strategic vision document critically appraised by SAGE
Modus operandi
Meets once per week for 2 hours
Review and preparation of materials between meetings
Leverage work already ongoing by task team members
1.X_Global_regional
SAGE meeting October 2021 36

Technical Document – Version 15 September 2021
37
An Ad-hoc Strategy Group representing respective organizations is convened for a short time to inform/steer the work of the task team. The Ad-hoc Strategy Group provides perspectives from a wide range of stakeholders and shapes, challenges and creates new ideas around the scope and direction of the strategic vision work. The Group convenes three times over the course of the study, each time for a two-hour session.
Table 2. Ad-hoc Strategy Group terms of reference
Role Provide perspective from a wide range of stakeholders across the globe to inform work on the strategic vision
Shape, respond, react to and create new ideas around the scope and direction of work on the strategic vision
Help collect and share perspectives, as well building across a wider set of stakeholders
Provide input to the task team on the four streams of work
Members FCDO Saul Walker
Gavi Aurelia Nguyen
Gavi Seth Berkley
Gavi Sanne Wendes
Bill & Melinda Gates Foundation Orin Levine
The World Bank Muhammad Pate
Civil Society Organizations Jane Barratt
Africa CDC Jonn Nkengasong
African Union Raji Tajudeen
African Union Merawi Aragaw Tegegne
Australian Department of Health Andrew Rintoul
CEPI Richard Hatchett
CEPI Nicole Lurie
Norway Ambassador for GH and ACT-A John Arne Rottingen
PAHO Revolving Fund John Fitzimmons
South Africa & the COVID-19 Lancet commission Prof. Salim Abdool Karim
The World Bank David Wilson
UNICEF Robin Nandy
UNICEF Eva Kadilli
US CDC Rebecca Martin
WHO Soce Fall
WHO Annelies Wilder-Smith
WHO Ann Lindstrand
WHO Regional Office for South-East Asia Sunil Kumar Bahl WHO Regional Office for the Eastern Mediterranean Quamrul Hasan
PAHO Cuauhtemoc Ruiz-Matus
WHO Regional Office for the Western Pacific Yoshihiro Takashima
WHO Regional Office for Africa Richard Mihigo
WHO Regional Office for Europe Siddhartha Sankar Datt
1.X_Global_regional
SAGE meeting October 2021 37

Technical Document – Version 15 September 2021
38
IFPMA James Anderson
IFPMA Laetitia Bigger
DCVMN Sai Prasad
Instituto Mexicano del Seguro Social Mauricio Hernandez
WHO Sylvie Briand
WHO/SCI Soumya Swaminathan
WHO/DGO Bruce Aylward
China CDC Zunyou Wu
Nigeria CDC Chickwe Ihekweazu
Thai Ministry of Public Healh Dr.Viroj Tangcharoensathien
Uganda Virus Research Institute Prof. Pontiano Kaleebu
US Department of Health and Human Services Larry Kerr
WHO Regional Office for South-East Asia Danish Ahmed
Christian Medical College, Vellore India Jacob John
Delivera-bles
Review of global goals and corresponding assumptions, characteristics, requirements and implications
Review of epidemiological, supply, demand and resources requirement scenarios
Review of task team goal-synthesis framework
Modus operandi
Meets every 2–3 weeks for 3 meetings of 2 hours
7.2 Annex II: Vaccination targets and uncertainties associated with the
conceptual Goal Framework
7.2.1 Age-descending prioritization versus other common approaches As numerous modelling studies have shown, the same vaccine supply (as a percentage of the total population) can yield very different impacts on population health, depending on how it is used – and particularly how its use is prioritized over time in combination with different PHSM within a given epidemiological setting. As described in Chapter 4, an age-descending prioritization strategy was used for the vaccination coverage targets in the conceptual Goal Framework, reflecting the conclusion across multiple modelling studies that such a strategy would be optimal for reducing severe disease and death under most realistic scenarios. This conclusion holds even more strongly if vaccines provide robust protection against severe disease and death, but less (or no) protection against infection. The degree of protection against infection is uncertain or unknown for a number of current vaccines, including against VOCs. Given the emergence of some VOCs that may reduce vaccine effectiveness against infection, the age-descending strategy focused mainly on direct protection was considered to be both an assured and an efficient use of limited vaccine supply given anticipated supply constraints in most settings until at least the end of 2021.
Several alternative vaccination strategies were considered through the iterative engagements of stakeholders via the Task Team, Ad-hoc Strategy Working Group, SAGE, and the SAGE Working Group on COVID-19 Vaccines.
1.X_Global_regional
SAGE meeting October 2021 38

Technical Document – Version 15 September 2021
39
Prioritizing high transmission groups: If a vaccine is effective at reducing infection or transmission, the strategies that prioritize persons with more contacts (e.g. younger cohorts, essential workers) perform better than age-descending strategies in terms of reducing infections, but at the cost of more deaths under most realistic scenarios. Available modelling suggests that targeting persons with more contacts is only an optimal strategy for mortality reduction under a combination of conditions that do not currently apply to most countries – i.e. low transmission rates, ample vaccine supply, programmatic ability to identify the “high-transmitter group”, delivery capacity for fast vaccination rollout, and high vaccination acceptance to achieve high coverage. There also remains uncertainty about the role of children in transmission, which may affect the efficiency of vaccination strategies that prioritize reduction of transmission. Therefore in the current context of VOCs that reduce vaccine effectiveness against infection but for which protection against severe disease and hospitalization is preserved, we are in a situation in which targeting “mixers” will be less optimal to reduce mortality and hospitalizations via indirect protection compared to an age-descending strategy via direct protection.
Ring vaccination and outbreak response vaccination: Modelling of other potential vaccination strategies such as ring vaccination, in which contacts of cases are prioritized for vaccination, has suggested this could be efficient if a high proportion (>80%) of contacts are rapidly traced. However, questions remain about the feasibility in practice of such approaches, given the role of asymptomatic and presymptomatic transmission, and that the time until vaccine-induced immunity is longer than the serial interval (time from illness onset of the first case to a secondary case) for COVID-19. In terms of potential outbreak response vaccination, modelling suggests that vaccination averts more cases, hospitalizations and deaths the earlier that vaccination is deployed pre-surge. However, due to limitations and lags in testing and reporting, as well as the elapsed time to vaccine-induced immunity, it may not be feasible to detect an incipient wave and deploy vaccination to a given country or subnational area in sufficient time to blunt a surge. Outbreaks in settings with low historical transmission (and hence high population susceptibility) can rapidly take off and overwhelm health systems, resulting in preventable deaths if the most vulnerable groups are not prioritized for vaccination. Modified strategies that seek to intensify vaccination of geographical areas around a surge/outbreak location (i.e. community rather than individual “ring vaccination”) have been proposed for further modelling and programmatic evaluation.
Prioritizing urban areas: Another consideration relating to the age-descending prioritization strategy is the programmatic challenge of committing time and resources to reach older adults in rural, remote or conflict-affected areas. From an operational standpoint it may seem more efficient to move on to younger adults in densely populated urban areas; however, modelling suggests that the rural-urban prioritization results will vary according to subnational movement patterns. Moreover, achieving high coverage among older adults before expanding vaccination eligibility to younger adults will avert more deaths than if all adults are eligible simultaneously without any age preference. As noted, the WHO Global COVID-19 Vaccine Strategic Vision encourages following the SAGE Roadmap, delegating to countries the programmatic flexibility to organize their vaccination programmes logistically in different ways to achieve their coverage targets under local circumstances of geography, personnel, distribution networks, cold chain, etc.
7.2.2 Scenario analysis of vaccination targets
Acknowledging there are no clear age cut-offs that can be assigned to different vaccination targets along the conceptual Goal Framework and guaranteeing specific health and socioeconomic outputs, we have selected the following thresholds for scenario analysis on the basis of comprehensive epidemiological analyses:
1.X_Global_regional
SAGE meeting October 2021 39

Technical Document – Version 15 September 2021
40
• For the low vaccination target, the analysis proposes that countries vaccinate older adults and high-risk groups, including all health and care workers.47
• For the medium vaccination target, the proposed target is vaccination of all adults.
• For the high and very high vaccination targets, the target populations are assumed to be adults and adolescents (high) and the entire population (very high).
Subsequently, each level of vaccination ambition is translated into an age threshold. The rationale behind the choice of the specific age thresholds is given in Table 3Table 1. Thresholds should be interpreted as indicative along a continuum of expanding vaccination coverage from older to younger populations with some variability across different country contexts. Of note, there are currently no vaccines with WHO EUL or stringent regulatory authority authorization for use below the age of 12 years; consequently, specifying “entire population” in this framework does not prejudice what the evidence will conclude.
Table 3. Rationale behind choice of age thresholds
Goal Vaccination target
Age threshold Rationale
Reduce mortality Low = older adults and high-risk groups
50+ years Based on consistent infection fatality ratio (IFR) and relative risk for mortality across countries showing substantial greater risk above 50 years1
Given a younger demographic structure in LICs/LMICs, and some variability in IFR across countries for 65+ due to care home outbreaks in HICs, lower “older adult” threshold of 50+ is a more appropriate threshold
Lower “older adult” threshold of 50+ will include many adults with comorbidities, many correlated with age, an additional source of mortality risk2
Reduce disease burden and limit health system impact
Medium = all adults
20+ years Based on hospitalization data from several HIC settings showing higher risk and number of hospitalizations for those 30+3,4
Working age adults, including essential workers who may be at higher exposure risk, for whom the disease burden includes acute illness, isolation/quarantine, or disability from long COVID that prevents work Programmatic feasibility of an “all adult” threshold (operationalized in analysis as 20+, could be defined at country level as 18+, etc.)
47 For analytical purposes, the assumption that health and care workers correspond to 3% of the total population has been made throughout the document. When compared to the ILO and WHO health workforce estimates, the underlying assumption overestimates the actual number of health and care workers.
1.X_Global_regional
SAGE meeting October 2021 40

Technical Document – Version 15 September 2021
41
Reduce viral transmission High = adults + adolescents
12+ years Severe disease burden (hospitalizations) lower among those <30 years; but still direct benefit of vaccination to this age group to reduce symptomatic cases, long COVID and multisystem inflammatory syndrome in children (MIS-C);
12–19 years have some of highest pre-pandemic contact rates5
Evidence that adolescents’ susceptibility to and transmission of SARS-CoV-2 is similar to that of adults6,7
12+ cut-off chosen on the basis of vaccines with current/anticipated adolescent indications based on clinical trial ages7
Separates decision to vaccinate adolescents from decision to vaccinate younger children
While lifting some PHSM:
Reduce disease burden and limit health-system impact
Reduce viral transmission
High = adults + adolescents
Very high = include children
12+ years 0+ years
Lifting PHSM increases Rt; with higher Rt, it is necessary to vaccinate a larger share of the total population to achieve viral transmission reduction Implies expansion to children, especially in LICs/LMICs with younger demographic structures
1. O’Driscoll M, Ribeiro Dos Santos, G, Wang L, Cummings DAT, Azman AS, Paireau J et al. Age-specific mortality and immunity patterns of SARS-CoV-2. Nature. 2021;590:140–5 (https://www.nature.com/articles/s41586-020-2918-0, accessed 9 August 2021). 2. Clark A, Jit M, Warren-Gash C, Guthrie B, Wang HHX, Mercer SW et al. Global, regional, and national estimates of the population at increased risk of severe COVID-19 due to underlying health conditions in 2020: a modelling study. Lancet Glob Health. 2020;8(8):e1003–7 (https://www.sciencedirect.com/science/article/pii/S2214109X20302643, accessed 9 August 2021). 3. Salje H, Kiem T, Lefranc N, Courtejoie N, Bosetti P, Paireau J et al. Science. 2020;369(6500):208–11. 4. Risk for COVID-19 Infection, Hospitalization, and Death By Age Group. https://www.cdc.gov/coronavirus/2019-ncov/covid-data/investigations-discovery/hospitalization-death-by-age.html. Accessed 9 August 2021. 5. Prem K, Zandvoort Kv, Klepac P, Eggo RM, Davies NG, et al. Projecting contact matrices in 177 geographical regions: An update and comparison with empirical data for the COVID-19 era. PLOS Computational Biology. 2021; 17(7): e1009098. https://doi.org/10.1371/journal.pcbi.1009098 6. Viner RM, Mytton OT, Bonell C, Melendez-Torres GJ, Ward J, Hudson L et al. JAMA Pediatr. 2021;175(2):143–56. 7. Laxminarayan R, Wahl B, Dudala, SR, Gopal K, Mohan BC, Neelima S et al. Science. 2020;370:691–7. 8. Hogan AB, Winskill P, Watson OJ, Walker PGT, Whittaker C, Baguelin M et al. Within-country age-based prioritisation, global allocation, and public health impact of a vaccine against SARS-CoV-2: a mathematical modelling analysis. Vaccine. 2021;39(22):2995–3006. doi:10.1016/j.vaccine.2021.04.002. 9. Moore S, Hill EM, Dyson L, Tildesley MJ, Keeling MJ. Modelling optimal vaccination strategy for SARS-CoV-2 in the UK. PLoS Comput Biol. 2021. doi.org/10.1371/journal.pcbi.1008849.
1.X_Global_regional
SAGE meeting October 2021 41

Technical Document – Version 15 September 2021
42
7.2.3 Variables affecting vaccination targets and goal achievement: working
assumptions for scenario analysis
Many variables affect the ability to reach established health and socioeconomic goals under different levels of vaccination target within the proposed Goal Framework (Exhibit 3). Given substantial uncertainties and heterogeneity across countries, for analytical tractability the following simplifying assumptions were made for framework development and scenario application:
• Naturally-acquired immunity will provide some protection beyond PHSM and immunization, thus allowing goals to be reached under lower vaccination targets. There may be a considerably greater response to a single vaccine dose than in persons who have not been exposed. This may be significant at the population level in settings with high levels of infection-acquired immunity, noting that WHO does not currently recommend screening persons for prior SARS-CoV-2 infection for purposes of vaccination decision-making, or changing dosing regimens for those with prior infection. For these reasons, the framework currently does not take natural immunity into account at the risk of underestimating impact and overestimating vaccine needs.
• Vaccine product characteristics allow for different degrees of protection against different endpoints (e.g. infection, mild disease, severe disease) and variant strains, so that a country may need to achieve a higher vaccination target if it is using a vaccine with lower effectiveness to achieve a given goal. For simplification, the proposed framework assumes the efficacy/effectiveness profiles of current and near-term vaccines with WHO EUL, including against currently known VOCs.
• Indirect protection from vaccines currently in use is still under study, although initial results from early introducing countries suggest that several available vaccines reduce infection and transmission. However, there is emerging evidence that protection against infection is likely to be reduced by certain VOCs even if protection against severe disease is preserved. For these reasons, the framework takes a primarily direct protection conservative approach. Indirect protection from vaccination is considered as a potential buffer against VOCs, lifting PHSM, supply delays, hesitancy and other factors that may reduce the health benefits of vaccination.
• Country characteristics, such as health-system features, imply that a more ambitious vaccination target may be needed in order not to overwhelm the health system in a country with constrained resources to care for COVID-19 patients (e.g. limited intensive care units, limited access to mechanical ventilation or supplemental oxygen). Other within-country population characteristics, such as mixing patterns and exposure risk (e.g. dense residential settings, multigenerational homes), would imply potentially different types of programmatic delivery efforts to reach goals in different settings. It is assumed that countries would follow the SAGE Prioritization Roadmap to consider additional risk factors (e.g. sociodemographic characteristics, occupational risk, residential risk) for more context-specific prioritization in their vaccination deployment plans.
• Public health and social measures (PHSM) are assumed to be deployed at a relatively stable intensity in the framework to achieve a given combination of health and socioeconomic goals. However, PHSM deployment should be, and are, quite dynamic over time, as countries may apply and lift them according to epidemiological trends, political pressure, social acceptance and risk tolerance, and they may not be feasible in some settings. The framework uses only qualitative PHSM categories for the horizontal axis of the Goal Framework and does not specify a detailed combination of PHSM interventions that will guarantee achievement of specific goals or consider heterogeneity between or within countries.
1.X_Global_regional
SAGE meeting October 2021 42

Technical Document – Version 15 September 2021
43
• Variants: VOCs that are more transmissible and/or exhibit possible immune-escape properties will require higher vaccination coverage and longer duration, or more intense, PHSM to achieve or maintain a given population immunity or protection threshold.
7.3 Annex III: Vaccination ambition and progress to date
7.3.1 Methodology An overview of publicly stated country goals, their current achievement rate and some estimates of the
associated supply deals are demonstrated in this section. The information about stated country goals is
sourced through media coverage and does not aspire to be exhaustive. Country goals are publicly stated
in different forms, though primarily as share of total population. Available information was standardized
into target age of populations to be covered using an age-descending order. A within-group coverage of
100% was assumed before descending to the next youngest age range.
Information about country bilateral deals is sourced from COVAX global market assessments. The
achievement rate per country is sourced as of 16 June 2021.48
7.3.2 Results
A review of publicly communicated vaccination targets as of 20 June 202149 shows that countries are already setting ambitions that go well beyond those established in 2020 for at least 20% population coverage.
Countries tend to express their COVID-19 vaccination ambitions by specifying their target for total population percentage vaccinated. Overall, countries have been setting goals beyond the original 20% target; the majority of goals in the public domain lie between 50% and 75% of total population.
Each share of the population target was translated into a corresponding age target accounting for specific country demographics. This made it possible to plot targets against the conceptual Framework in terms of the lowest age range that would be implied for vaccination if the total population coverage target were to be achieved (Exhibit 8).
According to the conceptual Goal Framework and from inferences drawn by applying the country-specified coverage targets, countries appear to be converging towards ambitious health goals of “reducing COVID-19 disease burden” or “reducing transmission” and/or at durable lifting of PHSM and hence increasing the levels of socioeconomic activity.
An analysis was performed after classifying countries into four archetypes based on income level. Interestingly, applying the total population coverage targets to country-specific demographics, LICs and LMICs appear to be setting some of the highest levels of ambition, clustered around vaccinating their population down to those of 15–25 years of age. Many HICs are setting targets at a somewhat lower level of aspiration, although some have already moved to vaccination of 12 years of age and above. Upper-middle-income countries display the most variance in the levels of their goals. The high variability
48 COVID-19 doses administered. Our world in data. (https://ourworldindata.org/grapher/cumulative-covid-vaccinations, accessed 9 August 2021). 49 Source: the Yellow House (https://www.theyellowhouse.dk, accessed 9 August 2021).
1.X_Global_regional
SAGE meeting October 2021 43

Technical Document – Version 15 September 2021
44
observed among country goals, even of countries in the same archetype, is likely to be the result of multiple influences – including perceptions regarding availability of supply, dynamics of the pandemic, countries influencing each other in terms of the goals they set,50 population preferences and, most importantly, a desire to resume economic activity with lack of clarity on required vaccination targets. The purpose of the Goal Framework and the goal synthesis process described in this section is to offer a means for greater clarity when setting and pursuing those goals.
Exhibit 8. Publicly-stated country vaccination goals
Exhibit 8: The heatmap maps total population targets to age targets, tailored to the income classification the country belongs
to. Since the graph is agnostic of each country’s actual health and socioeconomic ambitions, it depicts feasibility rather than country ambition. By fixing a vaccination target as a percentage of its population, each country can move along the corresponding age-target line, free to choose the exact position which is a trade-off between health ambition and socioeconomic ambition. Implicitly, we assume that all counties want to resume their socioeconomic activity – i.e. they all want to move as far to the right as possible, hence the clustering of the goals on the right-hand side of the chart. The desirable direction for each country is the upper right corner of the chart, a movement that is feasible only if the country increases its vaccination target ambition.
The majority of countries cluster within the 12+ to 20+ year age bands (upper part of the pink stripe in Exhibit 8) raising the question of whether countries are considering the implications of their total population coverage targets for vaccination of adolescents (and younger children for some). The current
50 Interestingly, when defined as share of total population, targets show higher-income countries “leading in the race” towards highest ambition.
1.X_Global_regional
SAGE meeting October 2021 44

Technical Document – Version 15 September 2021
45
approach of setting goals as a percentage of the total population, when coupled with very different age demographics by countries, leads to several countries implicitly committing to vaccinate younger populations, when this may not necessarily be intended. To date there is a single vaccine that is authorized for use below 16 years of age (Pfizer vaccine) and limited safety and immunogenicity experience in that age group. With transmission reduction being one of the main motivations for vaccination of adolescents and younger children, the impact on mortality and serious disease is very limited in this age group and instead confers some indirect benefit for older age groups on the basis of modelled scenarios. On the other hand, the uncertainty of MIS-C prevalence and the long-term health consequence of COVID-19 in young people could be an argument for vaccination of the latter. It is too early for impact evidence to bear out the prediction of the modelled data.
In terms of timelines, most countries have set their goal end-date to be the end of 2021, irrespective of their country income classification. Few countries have set the end-date sometime in quarter one of 2022, with the notable exception of the African Union that aspires to reach its target by end of 2022. The relatively short timeframe pursued by countries is another indication of the highly aspirational targets they have set.
Finally, an analysis of available information on supply deals shows that HICs have commitments to meet their ambition through supply deals which provide more than five times (on average) the supply needed to meet their goals. UMICs and LMICs have also entered into supply deals to meet their goals, based on public information, but with wide variance between countries.
An overview of current progress against projected goals shows high disparities with HICs having an average current achievement rate of 62% by the second half of 2021 and hence on a very good trajectory towards reaching their goals while LICs are much further away (a likely average achievement rate of 20% by the second half of 2021) with a combination of lack of supply as well as resource constraints.51
7.4 Annex IV: Health and economic returns of achieving vaccination
targets
7.4.1 Methodology: Health impact A published model52 of SARS-CoV-2 transmission, that is linked to a framework to simulate global COVID-19 vaccine allocation and prioritization scenarios, was leveraged to estimate the deaths, hospitalizations and infections that would be averted when vaccinating the age groups assumed for each coverage target in the goal framework:
51 Source: the Yellow House (https://www.theyellowhouse.dk, accessed 9 August 2021). 44 Hogan AB, Winskill P, Watson OJ, Walker PGT, Whittaker C, Baguelin M et al. Within-country age-based prioritisation, global allocation, and public health impact of a vaccine against SARS-CoV-2: a mathematical modelling analysis. Vaccine. 2021;39(22):2995–3006. Hogan doi:10.1016/j.vaccine.2021.04.002.
1.X_Global_regional
SAGE meeting October 2021 45

Technical Document – Version 15 September 2021
46
Table 4. Vaccination target age thresholds and within age group coverage, for scenario analysis
Goal framework vaccination coverage target
Assumed age threshold for scenario analysis
Within age group coverage
Low 50+ years 85% for 65+ years; 70% for 50–64 years
Medium 20+ years 70%
High 12+ years (modelled as 10+ years) 70%
Very high 0+ years 70% for LICs; 77% for LMICs; 81% for UMICs; 87% for HICs
Within each age group coverage levels depicted in Table 4 were defined based on historical immunization programme performance and vaccine acceptance considerations. Assumptions were also made about the evolution of epidemiological variables (Rt), the timing of lifting of PHSM and the vaccination pace, as well as vaccine efficacy with respect to infection, severe disease and transmission. The analysis was carried out after classifying countries into four archetypes based on income level, mainly to account for the highly variable demographic structures and the systems’ constraints across groups.
Within each age group, coverage levels were set at the maximum levels assumed to be feasible on the basis of historical immunization programme performance and vaccine hesitancy, in alignment with assumptions made for dose and resource requirements. For each age group target, vaccination was applied in age-descending order in five-year bands beginning with the oldest age group (80+ years). Scenarios were explored for four country archetypes based on World Bank income group (high, upper-middle, lower-middle and low), with representative parameters (age structure, social mixing patterns, demography and health system capacity) for each setting. It was assumed that health system constraints in LICs and LMICs would mean that some individuals requiring health facility care (e.g. oxygen) for COVID-19 would be unable to obtain it, leading to higher infection fatality ratios than if such constraints were absent. Scenarios assumed an initial epidemic wave, after which PHSM remain in place sufficiently to keep Rt at a low level (1.2), resulting in 20% of the population with immunity following natural infection at the start of the vaccination period. During the period of vaccination (assumed to occur over four months), Rt is kept at 1.2. PHSM were then assumed to be reduced gradually following completion of the vaccination campaign, resulting in a linear increase in Rt (to 3.5) over six months. For each vaccination target, the pace of vaccination was set such that the target group (50+ years, 20+ years, 12+ years, or 0+ years) was vaccinated over four months, with PHSM lifted after the same four-month campaign period for comparison of impacts across age-group targets. Deaths, hospitalizations and infections averted per million total population and per 100 fully vaccinated people were estimated for the period of two years following completion of the vaccination campaign (corresponding approximately to 2021–2022 and 2022–2023), compared to the same period and PHSM trends in the absence of vaccination, in total and by age group in which events occurred. Results shown are for a single archetype country setting and do not represent total events across all countries within or across income groups. The default scenarios assumed a vaccine with 63% efficacy against infection, 90% efficacy against severe
disease and 45% against transmission. Immunity following natural infection was assumed to last for an
average of one year. Sensitivity analyses considered variation in the proportion of the population already
1.X_Global_regional
SAGE meeting October 2021 46

Technical Document – Version 15 September 2021
47
infected at the time of the vaccination campaign (10%, 25%), timing of the vaccination campaign relative
to the epidemic peak, waning of immunity from natural infection (lifelong), impacts of VOCs (reduced
vaccine efficacy, higher transmissibility), vaccine characteristics (disease-blocking only), health-system
constraints (no constraints in LICs and LMICs) and differential infectiousness among children (50% reduced
in <10 years of age).
7.4.2 Results: Health impact
Across all income groups there are greater health impacts in absolute terms when expanding vaccination to an ever-increasing share of the population by descending age cohorts from 50+ years to 20+ years to 12+ years to 0+ years. This result is due mainly to the assumption that the vaccine product used will reduce infection and transmission to some degree in addition to protecting against severe disease, but it also applies to a lesser extent even when the vaccine is assumed to protect against severe disease only.
While increasing the vaccination target to younger ages increases the overall number of events
averted, it does so with differential efficiency across outcome measures. For reducing deaths and
hospitalizations, achieving high vaccination coverage for persons of 50+ years is the most efficient
strategy per fully vaccinated person, followed by vaccinating those 20+ years (Exhibit 9). Vaccinating
those aged 12+ years and those aged 0+ years provides almost no incremental benefit when scaled by
the number of people needed to vaccinate to avert one of these outcomes at the population level. For
deaths and hospitalizations, the benefit of vaccinating younger cohorts accrues mainly through
indirect protection to older cohorts at higher risk of these outcomes who were not effectively protected
directly because of incomplete vaccine coverage (Exhibit 10). For averted infections, however, there is
increasing incremental benefit to vaccinating younger and younger age cohorts, reflecting the greater
social mixing by these age groups in all country income groups and their much larger share of the
population in LICs and LMICs such that the benefits of reduced infections accrue primarily to these
younger cohorts.
Under the scenario assumptions modelled, the results suggest that prioritizing vaccination of the oldest adults will achieve the greatest mortality and hospitalization reductions for a given level of vaccine supply and that vaccinating those <20 years is an efficient strategy mainly towards the goal of reducing viral transmission. Vaccinating those aged 20+ years is an intermediate strategy towards further reducing deaths and hospitalizations for a given level of PHSM, or maintaining the reduction of mortality and hospitalizations achieved by vaccinating those 50+ years while lifting some PHSM.
1.X_Global_regional
SAGE meeting October 2021 47

Technical Document – Version 15 September 2021
48
Exhibit 9. Deaths, hospitalizations and infections averted per 100 fully vaccinated people (FVP) by country income group
Note: HIC = high-income countries; UMIC = upper-middle-income countries; LMIC = lower-middle-income countries; LIC = low-income countries.
Infections
averted Deaths averted Hospitalisations
averted
HIC
UMIC
LMIC
LIC
1.X_Global_regional
SAGE meeting October 2021 48

Technical Document – Version 15 September 2021
49
Exhibit 10. Age group in which deaths are averted for each vaccination coverage age targeting strategy
Note: HIC = high-income countries; UMIC = upper-middle-income countries; LMIC = lower-middle-income countries; LIC = low-income countries.
HIC
UMIC
LMIC
LIC
1.X_Global_regional
SAGE meeting October 2021 49

Technical Document – Version 15 September 2021
50
7.4.3 Results: Sensitivity analysis
Exhibit 11. Share of population recovered from COVID-19 before vaccination campaign begins and levels of implied PHSM to suppress transmission during the period of vaccination
Exhibit 12. Timing of window of vaccination relative to epidemic peak
Counterfactual trajectories, without vaccination: The coloured lines show different levels of
transmission during a period of suppression, resulting in different proportions of the population in
the “recovered” class when vaccination commences. In the LMIC setting (shown) this results in
approximately 10%, 20%, and 25% of the population recovered for Rt1 equal to 1.05, 1.2 and 1.4
respectively.
1.X_Global_regional
SAGE meeting October 2021 50

Technical Document – Version 15 September 2021
51
Interpretation: Earlier vaccination and longer duration of protection from natural infection reduce mortality from the subsequent epidemic peak.
Exhibit 13. Deaths per million population per day and deaths averted per million population by country income group
Note: HIC = high-income countries; UMIC = upper-middle-income countries; LMIC = lower-middle-income countries; LIC = low-income countries.
Interpretation: Different vaccination coverage targets by age shift the timing and magnitude of epidemic waves across country income groups based on the size of the age-eligible population. There are incremental health benefits to expanding vaccination to younger age ranges, but with diminishing efficiency in terms of averting hospitalizations and deaths.
1.X_Global_regional
SAGE meeting October 2021 51

Technical Document – Version 15 September 2021
52
Exhibit 14. LMIC example: deaths per million population per day and deaths averted per 100 fully vaccinated people (FVP) for default versus VOC settings
Interpretation: Compared to the default, VOCs that reduce efficacy or increase transmission will make vaccination less efficient (i.e. lower population health impacts per FVP) for every age target.
Exhibit 15. Deaths averted per million population for default versus VOC settings by country income group
1.X_Global_regional
SAGE meeting October 2021 52

Technical Document – Version 15 September 2021
53
Interpretation: Across all income groups, compared to the default, fewer deaths are averted when assuming reduced efficacy or higher transmission in a VOC setting, with the fewest deaths averted when these effects are combined. A more transmissible VOC leads to more deaths in the absence of vaccination (and hence more deaths averted from vaccination) in the first year.
1.X_Global_regional
SAGE meeting October 2021 53

Technical Document – Version 15 September 2021
54
Exhibit 16. LMIC example: deaths per million population per day and deaths averted per 100 fully vaccinated people (FVP) for default versus three scenarios
Scenarios: 1) disease-blocking vaccine only; 2) health systems able to surge in LICs/LMICs (no higher IFR
due to health-system constraints); and 3) children <10 years 50% less infectious.
Interpretation: Compared to the default, epidemic peaks occur at different times under the sensitivity analyses. Compared to the default, when averting death is the health outcome measure, a vaccine that blocks disease only is even more efficiently targeted to the oldest groups, while targeting to younger age groups is even less efficient. Compared to the default, when health-system constraints are not present for LIC/LMIC, then averted deaths are lower (because overall deaths are lower due to better health care and therefore fewer deaths could be averted). Compared to the default, results are not significantly different when children are assumed to be 50% less infectious.
1.X_Global_regional
SAGE meeting October 2021 54

Technical Document – Version 15 September 2021
55
Exhibit 17. LMIC example: deaths, hospitalizations and infections averted per million population for default versus disease-blocking vaccine only
Interpretation: If a vaccine is disease-blocking only, then the incremental health benefits of extending vaccination to younger age targets are substantially reduced.
1.X_Global_regional
SAGE meeting October 2021 55

Technical Document – Version 15 September 2021
56
Exhibit 18. LMIC example: deaths, hospitalizations and infections averted per million population for default versus health systems unconstrained in LIC/LMIC
Interpretation: If LIC/LMIC health systems are able to surge to manage COVID-19 cases, then there will be more hospitalizations but fewer deaths in the counterfactual without vaccination; therefore, compared to the default, there are more hospitalizations but fewer deaths averted when health system constraints are absent for each age group vaccination target.
1.X_Global_regional
SAGE meeting October 2021 56

Technical Document – Version 15 September 2021
57
Exhibit 19. LMIC example: deaths, hospitalizations and infections averted per million population for default versus children <10 years 50% less infectious
Interpretation: Assuming reduced infectiousness among children does not significantly change the estimated impacts of the vaccination targets in this setting for the assumed scenario values.
1.X_Global_regional
SAGE meeting October 2021 57

Technical Document – Version 15 September 2021
58
Exhibit 20. Age groups in which hospitalizations averted for each vaccination coverage age targeting strategy by country income group
Note: HIC = high-income countries; UMIC = upper-middle-income countries; LMIC = lower-middle-income countries; LIC = low-income countries.
Interpretation: Vaccinating younger cohorts benefits older cohorts through indirect protection (“herd effect”) by averting hospitalizations primarily among older cohorts not directly protected effectively. This herd effect is more pronounced in HICs and UMICs; in this scenario, LICs/LMICs are assumed to face health-system constraints such that all patients needing care cannot receive it. Therefore hospitalizations are lower and IFR is higher than in the absence of these constraints.
1.X_Global_regional
SAGE meeting October 2021 58

Technical Document – Version 15 September 2021
59
Exhibit 21. Age groups in which infections averted for each vaccination coverage age targeting strategy by country income group
Interpretation: Vaccinating younger cohorts benefits a more balanced distribution of age cohorts through indirect protection (“herd effect”), including averting infections among younger cohorts. This effect is most pronounced in LICs/LMICs due to their younger demographic structure.
1.X_Global_regional
SAGE meeting October 2021 59

Technical Document – Version 15 September 2021
60
Exhibit 22. LMIC example: deaths averted per million population for different vaccination rollout timings relative to peak
Interpretation: Prioritization of vaccination, along with an integrated strategy of PHSM use during vaccine rollout, is
important for optimizing impact across multiple health dimensions. Rapid vaccination rollout is important in order
to minimize the economic costs of PHSM. Vaccination needs to happen well in advance of surges to maximize
vaccination impact (there is limited impact of surge response vaccination due to lag in detection and response times).
There is still some longer-term benefit to vaccinating “past the peak” for protection against future waves/waning.
• Coloured bars show the total deaths
averted if the first dose of vaccination
begins at that time point, with oldest
age groups vaccinated first and efficacy
only after the second dose, with 8
weeks between doses.
• Each coloured bar represents an
increment of ~2 weeks.
• The black line shows the counterfactual
epidemic.
• Note: only one epidemic wave shown –
there would be additional health
impact (and vaccine benefit) on
subsequent waves.
1.X_Global_regional
SAGE meeting October 2021 60

Technical Document – Version 15 September 2021
61
Exhibit 23. Deaths averted per million population for alternative coverage levels within priority groups, by country income group
Within priority group coverage scenario 65+ years
<65 years
Default 85% 70%
Optimistic elderly 95% 70%
Optimistic elderly + pessimistic younger 95% 50%
Pessimistic elderly + pessimistic younger 70% 50%
Interpretation: More deaths are averted with higher coverage among older adults. Increasing coverage among older adults does not offset lower coverage among younger groups in terms of deaths averted. Lower coverage within any age group reduces the health benefits of vaccination.
1.X_Global_regional
SAGE meeting October 2021 61

Technical Document – Version 15 September 2021
62
Exhibit 24. Deaths per million population by vaccination status and country income group
Interpretation: Following vaccination rollout, most deaths are in unvaccinated populations, rather than from breakthrough infections among vaccinated populations.
7.4.4 Incremental economic benefit analysis for moving to goals of higher
ambition
Previous analyses have estimated substantial macroeconomic returns from rapid, equitable access to COVID-19 vaccination across all country income groups.53,54,55,56 By contrast, delayed and inequitable vaccination rollout will prolong and depress economic recovery, especially in emerging and developing economies and LICs (Exhibit 25).57
53 Hafner M, Yerushalmi E, Fays C, Dufresne E, Van Stolk C. COVID-19 and the cost of vaccine nationalism. RAND Europe; 2020 (https://www.rand.org/pubs/research_reports/RRA769-1.html, accessed 9 August 2021). 54 Cakmakli C, Demiralp S, Kalemli-Özcan S, Yeşiltaş S, Yıldırım MA. The economic case for global vaccinations. Paris: International Chamber of Commerce; 2021 (https://iccwbo.org/publication/the-economic-case-for-global-vaccinations, accessed 9 August 2021). 55 Ending the Covid-19 pandemic: the need for a global approach. New York (NY): Eurasia Group; 2020 (https://www.who.int/publications/m/item/ending-the-covid-19-pandemic-the-need-for-a-global-approach, accessed 9 August 2021). 56 Agarwal R, Gopinath G. A proposal to end the COVID-19 pandemic. IMF Staff Discussion Notes. Washington (DC): International Monetary Fund; 2021 (https://www.imf.org/en/Publications/Staff-Discussion-Notes/Issues/2021/05/19/A-Proposal-to-End-the-COVID-19-Pandemic-460263, accessed 9 August 2021). 57 Global Economic Prospects, June 2021. Washington (DC): World Bank; 2021. doi:10.1596/978-1-4648-1665-9.
1.X_Global_regional
SAGE meeting October 2021 62

Technical Document – Version 15 September 2021
63
Exhibit 25. Pre-pandemic projections and forecast revisions to global growth
Source: World Bank Global Economic Prospects, June 2021, Figure 1.1 Exhibit 25: In Figure A, baseline growth predictions for the next few years do not return to what they were pre-COVID-19 for LICs, in contrast to emerging and developing economies and advanced economies. In Figure B, the impacts of low vaccination coverage and slow rollout are illustrated, leading to negative forecasted growth for emerging and developing economies.
These prior analyses do not, however, consider issues of how to deploy available vaccines to unlock these economic benefits. These strategic concerns include the target level of vaccination ambition, how vaccination should be prioritized within a country’s population, how to scale back PHSM as vaccination coverage increases, what levels of coverage need to be achieved within priority groups and with what vaccine characteristics (e.g. efficacy against different endpoints) to permit different socioeconomic reopening goals). Such strategic considerations are important not only to optimize the impact of COVID-19 vaccines within and across countries, but also to characterize the potential “lives and livelihoods” trade-offs that countries face in responding to the COVID-19 pandemic. For instance, increasing vaccination coverage can reduce the need for economically and socially damaging mitigation measures that curtail economic production. The vaccination prioritization strategy that maximizes economic production may not be focused on working-age individuals but rather on older adults. Vaccination of those most likely to be hospitalized prevents hospital capacity from being breached and reduces the need for economically damaging mitigation measures. The ability of countries to incur and sustain the social and economic impacts of mitigation measures varies across country income groups. Recent integrated epidemiological-economic modelling efforts have sought to quantify some of the potential trade-offs in different COVID-19 vaccination strategies, severity of business closures and other mitigation measures at the country level in low- and middle-income country settings (Table 5, Table 6). In an illustrative LMIC setting, the difference between the least and most stringent PHSM measures is associated with an estimated short-term GDP loss of approximately US$ 142 000 per COVID-19 death averted over three months. Quadrupling the current vaccine administration rate results in an estimated reduction in deaths of 2.3 per 100 000 population over three months, assuming PHSM are kept in place. Table 5 reflects a general age-descending vaccination strategy but does not currently estimate the incremental economic impacts of the specific age thresholds in this global strategy scenario analysis.
1.X_Global_regional
SAGE meeting October 2021 63

Technical Document – Version 15 September 2021
64
In Table 6 the global strategy scenario analysis age thresholds are examined for an illustrative LIC setting. Table 6 suggests that a strategy relying only on PHSM to control COVID-19 will be much more costly than a carefully constructed strategy that involves both vaccination and PHSM. For example, compared to no vaccination and no PHSM, the model results indicate that vaccinating those aged 20+ years before the end of 2021 would avert a similar number of deaths as would a strategy with no vaccination and maintaining PHSM restrictions in place (see Table 6, last Alternative counterfactual row). However, achieving this vaccination target would allow economic reopening that would avert over US$ 2 billion in GDP losses. Deploying a combination of PHSM and vaccination in related approaches in an integrated pandemic control strategy is necessary to balance health and economic impacts and to prepare a bridge to return to normalcy. Together, these estimates suggest the importance of rapid vaccination rollout to save lives and reduce the need for economically costly PHSM to control COVID-19. The speed of rollout is of major importance, resulting in a difference in GDP loss that ranges from approximately US$ 100 million to approximately US$ 800 million in a three-year period when comparing the end-date of the achievement of the vaccination target (2021 versus 2022). These initial estimates capture only the short-term economic impacts from supply-side shocks, such as labour shortages due to COVID-19 illness and death and PHSM that interrupt business activity in different sectors. These are therefore conservative estimates of the economic benefits of vaccination over the short term because they do not capture, among other things, demand shocks (e.g. changes in consumers’ preferences), changes in government revenue, international trade losses and long-term GDP impacts (e.g. due to educational losses and reduced capital investment). These short-term estimates also do not capture longer-term health impacts (e.g. lives saved beyond the analytical horizon, averted long COVID or other sequelae due to COVID-19), which may have economic implications. Further analytical work is needed to characterize the broader epidemiological and economic impacts of specific COVID-19 vaccination strategies in combination with PHSM within and across countries. Table 5. Example lower-middle-income country scenario of deaths versus GDP losses under different PHSM levels during the vaccination rollout in Q3 2021 (preliminary projections)
PHSM stringency Deathsa GDP lossb
(US$ billions)
Incremental GDP loss per life saved with increasing PHSM stringencyc (US$)
Vax A: currently observed vaccine administration rate
Near-open economy and least stringent PHSM
25 783 0.17 -
Mid-to-low closures and stringency 12 181 0.73 41 097
Mid-to-high closures and stringency
4708 2.23 200 990
Strict closures and stringent PHSM 2526 3.47 571 036
Vax B: vaccine administration rate doubled
Mid-to-high closures and stringency 4532 2.23 Not applicable
Vax C: vaccine administration rate quadrupled
Mid-to-high closures and stringency 4209 2.23 Not applicable
a. COVID-19 deaths over three-month projection horizon. b. GDP loss compared to pre-pandemic GDP over three-month projection horizon. c. Incremental GDP loss per life saved compared to next least stringent PHSM scenario.
1.X_Global_regional
SAGE meeting October 2021 64

Technical Document – Version 15 September 2021
65
Table 5 Brief methods58
• Vaccination strategy: The vaccination rollout proceeds from the oldest adults to the youngest, assuming coverage of 70% in each age group. The vaccine administration rate remains constant at the currently observed rate, with 14% of the total population fully vaccinated by the end of three-month projection horizon (21% and 36% in Vax B and C scenarios); vaccine infection-, transmission- and severe disease-blocking efficacy assumed to be that of the AstraZeneca vaccine against the Delta variant.
• Economic impacts estimated through differential closures of 35 sectors of the economy using integrated SEIR (Susceptible, Exposed, Infected, Removed) and input-output model (DAEDALUS).
Table 6. Example low-income country scenario of deaths versus GDP losses under different vaccination and PHSM strategy combinations implemented over 2021–2022
Vaccination target achieved by end-2021
Vaccination target achieved by end-2022
Vaccination strategy
Deaths (over 1000
days)a
GDP loss (over 1000
days) b
(US$ millions)
Incremental GDP loss per life savedc
(US$)
Deaths (over 1000
days)a
GDP loss (over 1000
days)b
(US$ millions)
Incremental GDP loss per life saved c
(US$)
No vaccination, no PHSM 73 745 7 73 745 7
50+ years 43 899 52 1 530 43 742 136 4 335
20+ years 22 192 199 6 751 21 807 573 19 888
12+ years 4 600 261 3 556 283 776 9 448
0+ years 31 402 30 731 151 1 188 3 121 466
Alternative counterfactual: No vaccination, PHSM in place throughout 28 819 2 293 28 819 2 293
a. Boxed rows: compared in text; similar health impacts but different economic benefits of vaccination. b. Number of COVID-19 deaths over 1000-day simulation period associated with each vaccination strategy. c. Present value of total GDP loss over 1000-day simulation period in current US dollars, compared to
counterfactual no-pandemic GDP level. d. Incremental GDP loss per life saved is the ratio of the difference in GDP loss to deaths averted by
extending the vaccination strategy to cover the next youngest age group (i.e. comparing each row to the row immediately above it in the table).
58 Doohan P, Pianella M, Haw D, Hauck K. Presentation to WHO SAGE Working Group on COVID-19 Vaccines Impact Modelling subgroup, 12 July 2021. Based on DAEDALUS model described in: https://www.imperial.ac.uk/mrc-global-infectious-disease-analysis/covid-19/report-35-schools/
1.X_Global_regional
SAGE meeting October 2021 65

Technical Document – Version 15 September 2021
66
Table 6 Brief methods59
• Vaccination strategy is age-descending by global strategy scenario analysis age thresholds of 50+, 20+, 12+ and 0+, with a target of 85% coverage of those aged 65+ years and 70% coverage of those <65 years. Vaccination rollout is at a constant rate based on the rate required to achieve the target coverage within a specified time period (end-2021 or end-2022). The vaccine product is assumed to be 70% effective at reducing the risk of infection.
• PHSM are lifted on the completion of vaccination of each age group. Simulation is run over 1000 days, assuming Rt = 1.2 at the beginning of the vaccination campaign, with PHSM in place until the vaccination target is reached; social contact patterns are then increased to an approximate level of Rt = 1.8 when PHSM are lifted. The “no vaccination” and “no PHSM” scenario assumes contact patterns and susceptibility rates corresponding to Rt = 1.8 at the beginning of the simulation. The alternative counterfactual of no vaccination with PHSM throughout assumes contact patterns and susceptibility rates corresponding to Rt = 1.2 at the beginning of the simulation. Rt may evolve over the course of the simulation.
• Gross Domestic Product (GDP) loss over 1000 days in US dollars is calculated compared to a “no pandemic” counterfactual GDP scenario. The present value of the GDP loss assumes that the discount rate is equal to the economic growth rate.
7.5 Annex V: Doses required and supply available
To quantify the doses needed and the corresponding availability of supply, the same four vaccination targets by age and within age coverage described for health impact modelling (see Table 4 above) were assumed.
7.5.1 Methodology: Dose requirements
Dose requirements were estimated for a two-year period assuming a baseline of no vaccination. In
addition, uptake curves were applied to establish the minimum time to reach programmatic coverage
based on system strength, human resources, financial considerations and past experience with large
campaigns (See Annex VI: Costing and funding, for detailed uptake methodology and assumptions). Three different dose
schedule scenarios were considered for each vaccination target to account for uncertainty around viral
evolution and vaccine cross-protection against new variants, as well as duration of protection (
59 Ferranna M, Cadarette D, Bloom D (2021). Presentation to WHO SAGE Working Group on COVID-19 Vaccines
Impact Modelling subgroup, 12 July 2021
1.X_Global_regional
SAGE meeting October 2021 66

Technical Document – Version 15 September 2021
67
Table 7), giving rise to 12 vaccination target-scenario combinations.
1.X_Global_regional
SAGE meeting October 2021 67
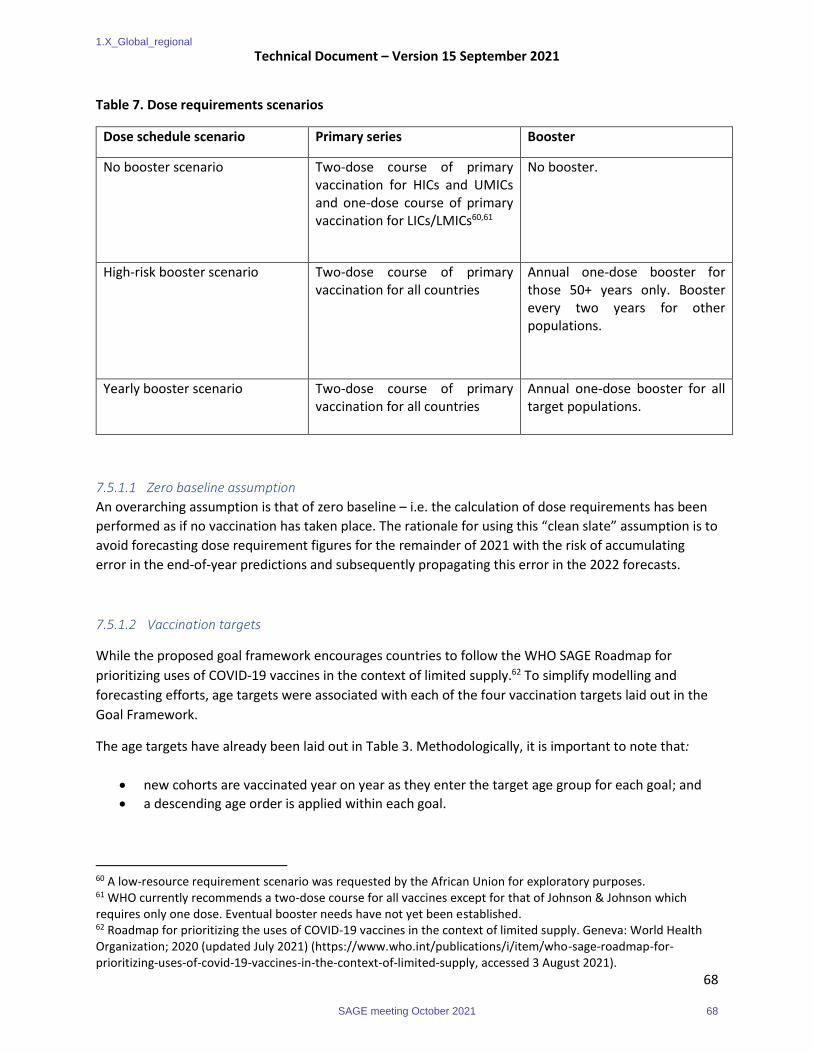
Technical Document – Version 15 September 2021
68
Table 7. Dose requirements scenarios
Dose schedule scenario Primary series Booster
No booster scenario Two-dose course of primary vaccination for HICs and UMICs and one-dose course of primary vaccination for LICs/LMICs60,61
No booster.
High-risk booster scenario Two-dose course of primary vaccination for all countries
Annual one-dose booster for those 50+ years only. Booster every two years for other populations.
Yearly booster scenario Two-dose course of primary vaccination for all countries
Annual one-dose booster for all target populations.
7.5.1.1 Zero baseline assumption
An overarching assumption is that of zero baseline – i.e. the calculation of dose requirements has been
performed as if no vaccination has taken place. The rationale for using this “clean slate” assumption is to
avoid forecasting dose requirement figures for the remainder of 2021 with the risk of accumulating
error in the end-of-year predictions and subsequently propagating this error in the 2022 forecasts.
7.5.1.2 Vaccination targets
While the proposed goal framework encourages countries to follow the WHO SAGE Roadmap for
prioritizing uses of COVID-19 vaccines in the context of limited supply.62 To simplify modelling and
forecasting efforts, age targets were associated with each of the four vaccination targets laid out in the
Goal Framework.
The age targets have already been laid out in Table 3. Methodologically, it is important to note that:
• new cohorts are vaccinated year on year as they enter the target age group for each goal; and
• a descending age order is applied within each goal.
60 A low-resource requirement scenario was requested by the African Union for exploratory purposes. 61 WHO currently recommends a two-dose course for all vaccines except for that of Johnson & Johnson which requires only one dose. Eventual booster needs have not yet been established. 62 Roadmap for prioritizing the uses of COVID-19 vaccines in the context of limited supply. Geneva: World Health Organization; 2020 (updated July 2021) (https://www.who.int/publications/i/item/who-sage-roadmap-for-prioritizing-uses-of-covid-19-vaccines-in-the-context-of-limited-supply, accessed 3 August 2021).
1.X_Global_regional
SAGE meeting October 2021 68

Technical Document – Version 15 September 2021
69
7.5.1.3 Programmatic coverage
To account for programmatic feasibility, we looked at historical immunization programme performance
and hesitancy in order to derive age-group coverage assumptions (Table 8).
Table 8. Assumptions on programmatic coverage
Priority
group
HIC UMIC LMIC LIC Rationale.
All HW 85% 85% 85% 85% Assumed high coverage given known delivery platform
and pandemic setting.
65+ years 85% 85% 85% 85% Assumed high coverage given known delivery platform
and pandemic setting.
5–64 years 70% 70% 70% 70% Multidose coverage for the base case was selected
based on the oral cholera vaccine (OCV) campaign two-
dose coverage reported by Global Task Force on
Cholera Control. Vaccination coverage surveys were
documented following 31 campaigns. The estimated
two-dose coverage ranged from 27.5% to 95%, with an
average of 70%. A study of the OCV campaign in Haiti
showed that dropout was higher in >15-year-olds than
in 1–5-year-olds.
0–4 years 87% 81% 77% 70% DTP3 (WHO/UNICEF estimates of national
immunization coverage)
7.5.1.4 Uptake
Uptake indicates a maximum speed at which assumed programmatic coverage could be reached if there are no supply constraints and major resource/programmatic obstacles. To calculate uptake curves, the following methodology is applied:
1. Every country is assigned a group based on the average of their scores across multiple variables, including health-system strength, campaign experience, health-care workforce, government health expenditure, financing constraints and population size.
2. Uptake duration is assigned per country group.
1.X_Global_regional
SAGE meeting October 2021 69

Technical Document – Version 15 September 2021
70
3. For each country, actual administered rates are incorporated monthly if they show that a higher pace of delivery than previously anticipated is possible.
The assumptions characterizing each country group with respect to its uptake are illustrated in Exhibit 26, while a world map view is illustrated in Exhibit 27.
Note that:
• On the basis of estimated completion dates of infant trials, countries are not expected to begin vaccinating persons below 12 years until 2022.
• The reference uptake estimates for speed of delivery to the population aged 18+ years are applied proportionally to populations targeted in each scenario (50+ years, 20+ years, 12+ years, 0+ years) according to the relative size of the population age groups in each country
Exhibit 26. Uptake of country groups
Exhibit 27. Grouping of countries and uptake assumptions
1.X_Global_regional
SAGE meeting October 2021 70

Technical Document – Version 15 September 2021
71
It is important to note that the uptake assumptions imply that not all the doses necessary to complete the 12 scenarios are needed over the two-year period. For the most ambitious scenarios, booster doses (primarily) are required over a longer timeframe.
A 10% wastage rate was added across all scenarios.
Finally, the doses required over the two-year period of analysis were associated to the 2021 and 2022 calendar years for ease of analysis and comparison with supply. This is an aggressive assumption for many of the lower-income settings when most doses are likely to be purchased in the latter part of the biennium, while possibly underestimating early vaccine consumption in higher-income settings through the early use of booster doses.
7.5.2 Results: Dose requirements There is large variance in programmatic dose requirements across goals and scenarios: as expected, dose requirements increase with increasing levels of goal ambition and when boosters are assumed to be required to maintain the desired health impacts. Requirements range from 2.8 billion doses if only 50+ year populations are targeted and no boosters are required to 16.2 billion doses for universal vaccination along with an annual booster requirement for 2021 and 2022 (
Exhibit 28). It is important to note that, at the time of writing in mid-2021 approximately 5.5 billion
doses had already been administered – although primarily in high-income settings with China, India,
United States, Brazil, Japan, Germany, Indonesia, Turkey, United Kingdom and France as the biggest
consumers.
At the lowest level of ambition – i.e. targeting the older population and high-risk groups – HICs that have the older demographics and China drive most of the dose needs. As goal ambition increases and all ages are targeted, lower-income settings become the biggest driver of global demand.
In the “no booster” scenario, the one-dose primary vaccination course assumed for lower-income settings requires significantly reduced doses across all age targets.
1.X_Global_regional
SAGE meeting October 2021 71

Technical Document – Version 15 September 2021
72
Exhibit 28. Dose requirements
Some longer-term considerations are worth noting. The high-risk booster scenarios (boosters every two years and annual boosters for high-risk groups) have the largest variability since booster doses are required only for a small share of the target population on an annual basis and the whole target population every two years. Most importantly, as of the second year in all scenarios, there is a considerable drop in dose requirements as target populations are reached. Global programmatic dose requirements reach zero in all “no booster” scenarios by the third year. These longer-term considerations are important for the investment decisions of vaccine manufacturers (and governments), in terms of the speed and scale of the increase in manufacturing capacity and business sustainability (
1.X_Global_regional
SAGE meeting October 2021 72

Technical Document – Version 15 September 2021
73
Exhibit 29).
Exhibit 29. Evolution of dose requirements by scenario
1.X_Global_regional
SAGE meeting October 2021 73

Technical Document – Version 15 September 2021
74
7.5.3 Methodology: Global vaccine supply
Global supply is estimated on the basis of the Monte Carlo simulation global production model. The model incorporates all developers with vaccines licensed or in clinical development and accounts for risk and uncertainty about the following factors (in order of priority):
• the probability of technical and regulatory success (PTRS);
• the manufacturing risk and the experience of technology transfer;
• the availability of raw materials and manufacturing inputs, drug substance yields and manufacturing scale(s);
• the timing of regulatory approval and production launch; and
• companies’ strategy regarding variants.
The model is developed on the basis of publicly available sources (media monitoring) and BMGF, CEPI, Gavi and UNICEF intelligence. PTRS values are provided by Gavi and CEPI or estimated on the basis of the methodology of the Center for Global Development.63 On the basis of the Monte Carlo simulation outputs, three scenarios of low (5th percentile), base and high (95th percentile) supply have been introduced, as follows:
63 McDonnell A, Van Exan R, Lloyd S, Subramanian L, Chalkidou K, La Porta A et al. COVID-19 vaccine predictions: using mathematical modelling and expert opinions to estimate timelines and probabilities of success of COVID-19 vaccines. Washington (DC): Center for Global Development; 2020 (https://www.cgdev.org/sites/default/files/COVID-19-Vaccine-Predictions-Full.pdf, accessed 7 August 2021).
1.X_Global_regional
SAGE meeting October 2021 74

Technical Document – Version 15 September 2021
75
Year\scenario Low Base High
Year 1 ~6.5 billion doses ~7.5 billion doses ~9.0 billion doses
Year 2 ~9.0 billion doses ~14 billion doses ~17 billion doses
Input Description 2021 2022
Probability of technical and regulatory success
• Estimated volumes from vaccines still in the development pipeline are risk-adjusted using PTRS
+/- 0.9 billion +/- 3.0 billion
Timing of regulatory approval and production start date
• An estimated timing of first regulatory approval based on platform and stage is applied to candidates still in clinical trials and may differ from company claims
• Some companies may begin producing at risk early. However the doses will not be released until the first approval
+/- 0.4 billion +/- 0.8 billion Multiple companies have indicated late 2021 and 2022 production scale-ups through production launch at additional facilities
Manufacturing risk/scale-up curves
• General as well as manufacturer-specific scale-up curves incorporated if data are available
• Manufacturing risks for facilities were assessed on the basis of prior vaccine production and technology transfer experience
• Resulting scores were used to adjust scale-up curves; companies with a large number of technology transfers were the most affected
+/- 0.3 billion +/- 2.0 billion With multiple new entrants in the market, manufacturing risk is high
Scale, yield, capacity inputs
• Reported or estimated scale and yield data
• Reported manufacturer DP estimate
• We incorporate risk for all public inputs (amounts to at least 25% discount), except for vaccine developers deemed “trustworthy” by experts
+/-0.3 billion +/-0.6 billion
Raw materials, DP and adjuvant constraints
• Manufacturer-specific raw material, DP or adjuvant constraints were applied on the basis of the available data
+/-0.3 billion +/-0.6 billion
Variant strategy • Production volumes may vary according to company variant strategy: 1) booster, 2)
N/A +/-0.2 billion
1.X_Global_regional
SAGE meeting October 2021 75

Technical Document – Version 15 September 2021
76
Input Description 2021 2022
replacement, 3) multivalent vaccine
• Companies employing a multivalent booster will see a reduction in supply
• Depending on the strategy, timing of production and scale-up may also be pushed back
7.5.4 Methodology: Key distribution assumptions
Distribution indicates how available manufacturing capacity is allocated to countries. To allocate 2021 and 2022 manufacturing capacity to countries the following country-level supply types are considered:
1. Formalized bilateral, multilateral and COVAX deals 2. Domestic production capacity 3. Publicly-announced donations and transferred doses.
Key distribution assumptions include the following:
Assumptions
Bilateral and multilateral deals
• Only secured doses of formalized deals are taken into account.
• HICs are assumed to have all their mRNA deals (secured doses only) met first starting in the second half of 2021. All other deals are then fulfilled proportionally by the supplier based on deal size and estimated deal start date.
• Deal start date assumes the latest date of: 1) expected delivery date from media announcements; 2) country vaccine approval date; or 3) vaccine time to licensure estimates.
• Multilateral deal doses are allocated proportionately to Member States on the basis of population size.
COVAX deals • COVAX supply is distributed on the basis of the outputs from COVAX allocation rounds.
Domestic production
• The manufacturer’s domestic production capacity is allocated to the country where its headquarters is located.
Export bans • It is assumed that there will be no exports from India in the second half of 2021, and only 25% of total production exported from India in the first half of 2022.
Donations and dose donations
• All donations and transferred deals announced in the media are incorporated, in which the donated and transferred doses are subtracted from the supply of the donor.
• In addition to all announced donations, donations amounting to 1 billion doses in 2021–2022 from HICs to LICS/LMICs is assumed.
Note: Untapped manufacturing capacity in 2022, which has not yet been distributed since limited 2022 deals have been announced to date, shows up as kept in the country of manufacture.
1.X_Global_regional
SAGE meeting October 2021 76

Technical Document – Version 15 September 2021
77
7.5.5 Results: Global vaccine supply availability
Global vaccine supply forecasts depend on a set of parameters that are hard to predict accurately. The results and production distribution outcomes are summarized in three scenarios – low, base and high (Exhibit 30).
The production figures include multiple different technology platforms. In 2021, the production scenario is divided between mRNA, non-replicating viral vector and inactivated vaccines with about a 1/3, 1/3, 1/4 split in the base scenario. The 2022 scenarios reflect the potential entry of protein subunit vaccines with about a 1/3 from mRNA and 1/5 to viral vector, inactivated and protein subunit split in the base scenario. As described below, different platforms are more or less sensitive to different drivers of uncertainty and variance. The model leads to production forecasts which must therefore be taken with great caution.
Among multiple factors which have been considered, the key ones which lead to the largest variance in
supply estimates across the three scenarios are:
• The probability of technical and regulatory success (PTRS) – up to 3.9 billion doses variance over 2021–2022: o The model uses a probability of success to reach licensure. However, a candidate that is yet to
be registered will either pass or fail registration. Hence, the impact of this factor is the most significant.
o The technology platform most sensitive to this factor is the protein subunit platform. It combines the fact that: 1) no candidate has reached licensure yet and 2) large volumes are being claimed from this technology platform.
• The manufacturing risk, technology transfer experience and scale-up curve – up to 2.3 billion doses variance over 2021–2022: o The more technology transfers are being envisaged and the more limited the experience is at
the receiving sites of these transfers, the wider the variance of the outcome. o The technology platform most sensitive to this factor is the viral vector platform. Indeed, the
three leading companies have limited in-house capacity and rely on a very large number of technology transfer recipients to reach the production volumes successfully.
• The availability of raw materials and manufacturing inputs, which have impacts on both drug substance and drug product manufacturing steps – up to 1.8 billion dose variance over 2021–2022: o While the magnitude of the impact of raw materials and the scarcity of manufacturing supplies
varies across geographies, all technology platforms are affected by it.
• The timing of regulatory approval and actual production increase – up to 1.2 billion dose variance over 2021–2022.
According to the booster/variant strategies which will finally be applied, two more factors could
significantly reduce overall production capacity:
● The use of multivalent vaccine to protect against multiple variants at once would have immediate and substantial effect on reducing the drug substance capacity per dose.
● The move in certain countries from multi-dose to single-dose vials as they shift from mass vaccination to targeted booster vaccination. While this may make sense programmatically in a
1.X_Global_regional
SAGE meeting October 2021 77

Technical Document – Version 15 September 2021
78
country context, it would have immediate and substantial effects on reducing the vaccine product capacity per dose:
o The nominal speed of filling lines is expressed in vials per minute and varies only slightly as a function of vial size (and the number of doses the vial can contain).
o Therefore, the filling of single-dose vials versus multi-dose vials significantly reduces overall filling capacity when expressed in total vaccine doses.
It must be noted that only the first of these two factors has been reflected in capacity simulation.
Very importantly, throughout 2021–2022 countries’ ability to secure the supply they need for their vaccine programmes is linked not only to supply availability but also factors that drive distribution.
Exhibit 30. Production estimates in billion doses of COVID-19 vaccines per annum
7.5.6 Results: Dose required versus supply balance The feasibility analysis examines the supply–demand balance for 2021–2022 for the 12 vaccination
targets/dose requirements pairs under the three supply scenarios – low, base and high. By comparing
programmatic dose requirements over a two-year period with the supply available to countries based on
deals and donations, it is seen that under a high-supply scenario supply could meet all dose requirements.
Nevertheless, in the base- and low-supply scenarios, critical gaps remain visible in LICs and LMICs for those
aged 0+ years and 12+ years, while an increased number of doses can activate supply constraints even in
the 20+ age group (
1.X_Global_regional
SAGE meeting October 2021 78

Technical Document – Version 15 September 2021
79
Exhibit 31). This is despite an assumption of 1 billion doses from HICs.
Over-procurement and trade barriers/export bans contribute to supply and demand imbalance both in
country groupings and at country level. Misaligned product preferences are another factor that could lead
to shortages in a complex market with multiple vaccine technologies and products available with varying
levels of performance and characteristics, despite supply meeting demand in terms of gross total
numbers.
Nevertheless, it should be noted that there are an estimated ~1.5 billion doses of currently unreserved manufacturing capacity in the low -supply scenario and ~4.5 billion doses in the base-supply scenario that could be further secured to address gaps. However, this would require a clear signal to manufacturers of the intent to purchase these doses. This can be done through transparent goal-setting, accurate forecasting and early contracting to allow sufficient lead times to inform investment decisions and for the manufacturers to implement planned scale-up activities.
In summary, the feasibility analysis indicates that global production may be adequate over the course of the 2021–2022 biennium, but it will require active management of the supply and the market to ensure that:
• all worst-case scenarios across uncertainties are not realized simultaneously (e.g. the PTRS64 of
vaccine candidates does not drop significantly, or increased delays and/or failure of the multiple
scale-up do not materialize in parallel;
• there is important redistribution of doses now and in coming months as supply is building up;
• clear market signalling for 2022 sustains manufacturing cadence and capacity expansion;
• active portfolio management ensures proper planning, forecasting, acceptable product
characteristics, harmonized regulation and matching of product preferences; and
• multivalent and monodose vaccine presentations are postponed until equitable vaccination has
been reached in all countries.
64 PTRS = probability of technical and regulatory success.
1.X_Global_regional
SAGE meeting October 2021 79

Technical Document – Version 15 September 2021
80
Exhibit 31. Biennial supply–demand balance by group (low supply scenario)
Exhibit 31: Several supply-constrained scenarios for the 12+ and 0+ years age targets for all country groups except for HICs.
In the ‘no-booster’ scenarios the LICs/LMICs are not constrained as a consequence from the specific assumption about one-dose courses.
7.6 Annex VI: Costing and funding
7.6.1 Methodology: Costing
The programmatic dose requirements calculated in the previous step were used as a basis for calculating country vaccination cost. This analysis was performed for 130 countries – 38 self-financing countries and 92 Advance Market Commitment (AMC) economies – for COVAX for 2021 and 2022. The present analysis generates cost estimates for all LMICs except China and Russia. The calculations were based on cost-per-dose supplied, which was in turn broken down into three components: 1) procurement costs, 2) delivery costs and 3) HW surge costs, as follows:
● Procurement cost: US$ 6.7, constant across scenarios based on an analysis of estimated weighted average price currently paid across doses contracted under COVAX and non-COVAX deals according to data available to date.
● Delivery cost: US$ ~0.5 to US$ ~1, decreasing as the number of doses increases as the result of economies of scale.
● HW surge cost: US$ ~0.5 to US$ ~3, country-dependent and with a wide range even within the same country income archetype.
1.X_Global_regional
SAGE meeting October 2021 80

Technical Document – Version 15 September 2021
81
This work was conducted by the COVAX Global Market Assessment Working Group, the Country Readiness and Delivery Task Team for Global Delivery Costs and WHO. Cost estimates for reaching 20% of the population in AMC economies were published in February 202165 Similar cost categories and unit cost assumptions were used in the present analysis.
Cost categories are summarized in Table 9. The scaling factor refers to assumptions made for generating total cost values. When the scaling factor is “Country”, a total lump sum was assumed for the country according to size. For planning and coordination, US$ 590 000 was assumed for countries with less than 10 million population and US$ 800 000 for countries with more than 10 million population. Data sources for these assumptions are explained in the February 2020 report.56 With the “Facility” scaling factor, the number of health facilities in the respective country was used to generate total cost values. As an example, the costs of training health workers in new vaccine introduction was based on 23 previous cost studies. The total costs of training estimated in these studies were divided by the number of facilities in the country concerned to arrive at an average cost estimate per facility. This average cost was then used for extrapolation to the remaining countries. With the “Dose” scaling factor, a unit cost per vaccine dose delivered was derived from published studies and was used for extrapolation to all countries.
An important data source for unit costs was the Immunization Delivery Cost Catalogue (IDCC).66 This database stores resources on vaccine delivery costs in low- and middle-income countries from a large, systematic review of published and unpublished studies available since 2005. Data from IDCC were complemented with information from vaccination campaign budgets and human papillomavirus (HPV) vaccine introduction budgets. Cold chain equipment costs were derived from the PATH Installed Base and Forecast Model. All costs were inflated to 2020 values. Fixed costs were defined as items that do not vary substantially by the number of doses delivered, such as planning and coordination. Variable costs are those that vary with the number of vaccine doses delivered.
Unit costs vary between countries because of different salary levels and prices of goods, while the costs of tradable goods, such as cold chain equipment, are generally relatively similar across countries. Unit costs related to non-tradeable items were adjusted in the analysis. Four cost categories were adjusted according to purchasing power parity (PPP): 1) training, 2) vaccine transport, 3) per diems and 4) transportation for outreach. The methodology developed by Portnoy and colleagues for adjusting unit costs for PPP was used.67 For social media listening, country-specific salaries were used to adjust the estimates. Country-specific water tariffs for costs of infection prevention and control were used.
Table 9. Costs categories included in cost estimates
Cost category Scaling factor
1 Planning and coordination Country
2 Training Facility
65 Costs of delivering COVID-19 vaccine in 92 AMC countries (full report). New York (NY): UNICEF; 2021 (https://www.corecommitments.unicef.org/kp/costs-of-delivering-covid19-vaccine-in-92-amc-countries.url, accessed 7 August 2021). 66 Immunization Delivery Cost Catalogue. Medford (MA): Immunization Economics/Management Sciences for Health (https://immunizationeconomics.org/ican-idcc, accessed 7 August 2021). 67 Portnoy A, Vaughan K, Clarke-Deelder E, Suharlim C, Resch SC, Brenzel L et al. Producing standardized country-level immunization delivery unit cost estimates. Pharmacoeconomics. 2020;38(9):995–1005.
1.X_Global_regional
SAGE meeting October 2021 81

Technical Document – Version 15 September 2021
82
3 Social mobilization Facility and country
4 Cold chain equipment (2-8°) Dose
5 Cold chain recurrent Dose
6 Pharmacovigilance Facility and country
7 Vaccination certificates Dose
8 Protective personal equipment (PPE) for health care workers Dose
9 Hand hygiene for health care workers and vaccine recipients Facility and dose
10 Vaccine transport Dose
11 Waste management Dose
12 Per diem for outreach service delivery and supervision Dose
13 Transportation for outreach services Dose
14 Technical assistance Country
Costs of technical assistance were estimated as follows:
• 13 countries were sampled to gain an understanding of the use and costs of Technical Assistance consultants and staff as of June 2021 channelled through WHO and UNICEF country offices: Afghanistan, Bangladesh, Bosnia, Ethiopia, India, Kenya, Lao PDR, Malawi, Moldova, Nepal, Pakistan, Papua New Guinea and Uzbekistan.
• No activity costs were included.
• The 13 countries were sorted into seven categories from US$ 1.5 million required for 6 months to US$ 0.1 million required for the same period (India out of category).
• The seven categories were modelled with a series of combined indicators (income, Gavi status, conflict, fragile status, population).
• Extrapolation was carried out using the seven cost categories to the 130 countries.
• Cost requirements for five semesters were calculated, with full cost for Semester 2 of 2021 and Semester 1 of 2022, then decreasing the cost by 25% per semester.
• Technical Assistance costs of expanded partners were assumed to be 33% additional on top of WHO and UNICEF
Human resource surge costs were estimated separately from the other delivery costs by WHO. The calculation methodology reads as follows:
• “The estimation of health workforce requirements is based on a WISN (Workforce Indicators of Staffing Needs) approach adapted to vaccination of COVID-19. Based on dose allocation, it
1.X_Global_regional
SAGE meeting October 2021 82

Technical Document – Version 15 September 2021
83
computes for each country the need for health workers involved in vaccination including vaccinators, support staff and supervisors.
• Based on a redeployment factor fixed at 5% for the simulation purposes, proportional to the health workforce density in the country and the UHC service coverage index, the number of health workers is extracted from the current staff of medical doctors, nursing personnel, midwifery personnel and pharmacists from the National Health Workforce Accounts (https://apps.who.int/nhwaportal/Home/Index).
• Comparing the need and the available workforce redeployed and accounting for the production capacity of the country using graduate statistics, a gap in health workers is estimated. Therefore, the need of health workers is split between the domestic use of health workers and the additional health workers to employ to cover the gap.
• These numbers are multiplied by the duration in months and the average salaries for nursing personnel applied to supervisors and vaccinators and clerk for support staff to derive total health workforce costs, domestic costs and costs for additional health workers.”
All input parameters are available on request to [email protected]. Parameter assumptions for HW
costs are summarized in Table 10.
1.X_Global_regional
SAGE meeting October 2021 83

Technical Document – Version 15 September 2021
84
Table 10. Assumptions for human resource surge cost estimates
Description Assumed value
Minutes per intervention 10 minutes
Working hours per day 7 hours
Working days per week 4.5 days
Team efficiency (leave, recruitment) 85% efficiency
Percentage of health and care workers (HW) reassigned for COVID-19 vaccination
5% of HW
7.6.2 Results: Costing Given the wide range of dose requirement scenarios, there is a similarly wide range of costs up to
US$ ~57 billion for LICs/LMICs alone for the most ambitious vaccination target and booster scenarios in
2021 and 2022 accounting for vaccine procurement and delivery costs (
1.X_Global_regional
SAGE meeting October 2021 84

Technical Document – Version 15 September 2021
85
Exhibit 32).68
Under the assumption of US$ 6.7 per dose, COVID-19 vaccines would be among the most expensive vaccines in lower-income settings portfolios69 and their procurement clearly a major driver of cost. Delivery costs, driven primarily by HW surge costs, represent an essential one fifth of the total costs. Importantly, the analysis does not account for the opportunity cost of existing HW that would be leveraged and possibly diverted from their other immunization and primary health care tasks. Finally, the analysis shows that covering larger and larger shares of the population, plus the need for boosters, are important drivers of cost difference between scenarios. It is important to note that some of these costs have already been covered by existing investments by countries and the international community.
68 In comparison, ACT-A IMF, World Bank, WHO and WTO principals call for US$ 50 billion investment to generate US$ 9 trillion in global economic returns by 2025 (https://www.who.int/news/item/01-06-2021-new-50-billion-health-trade-and-finance-roadmap-to-end-the-pandemic-and-secure-a-global-recovery, accessed 9 August 2021). 69 Global Vaccine Market Report. World Health Organization/Market Information for Access to Vaccines; 2020 (https://www.who.int/immunization/programmes_systems/procurement/mi4a/platform/module2/2020_Global_Vaccine_Market_Report.pdf, accessed 9 August 2021).
1.X_Global_regional
SAGE meeting October 2021 85

Technical Document – Version 15 September 2021
86
Exhibit 32. Indicative cost of reaching different vaccination targets in LMICs and LICs over a two-year period
7.6.3 Funding
Successful delivery of a vaccination target depends both on the financial capacity of a country to support the goal (either through national resources and/or external support) and its health system’s capacity. Those aspects become increasingly important in the case of LICs/LMICs, since the resources are, in several cases, limited. Financial and systems criteria are formulated to assess a country’s capacity to realize each vaccination target–scenario combination.
When it comes to financial resources, various sources of funding can be considered:
• Multilateral Development Banks (MDB): As of writing ~US$ 3 billion have been committed in MDB lending for vaccine procurement and delivery (an additional ~US$ 5 billion in applications are under review) against an announced envelope of ~US$ 24 billion.70 Given the nature of the instrument (concessional loans), the attractiveness of vaccination financing for LICs/LMICs remains unclear. Trade-offs between COVID-19 vaccines and other health priorities will need to be considered carefully by each country in view of the opportunity costs for other health interventions, especially in epidemiological settings where there is a low perceived burden of disease.
• Official Development Assistance (ODA): Funding raised to date for vaccines in LICs/LMICs, largely via COVAX AMC, was mostly provided through Official Development Assistance (ODA), as well as contributions from the private sector and philanthropic bodies. In the high-demand scenario
70 World Bank Support for Country Access to COVID-19 Vaccines. Washington (DC): The World Bank (https://www.worldbank.org/en/who-we-are/news/coronavirus-covid19/world-bank-support-for-country-access-to-covid-19-vaccines, accessed 9 August 2021).
1.X_Global_regional
SAGE meeting October 2021 86

Technical Document – Version 15 September 2021
87
(corresponding to vaccinating the entire population plus boosters), the funding required could amount to 70% of yearly Official Development Assistance (ODA) from 2018,71 resulting in the need to rely on sources of financing other than ODA alone in certain scenarios and conditions.
• Dose donations: An important source of funding can be unlocked as countries start to share their excess supply. This is currently estimated at >1 billion doses.
• Returns on investment from vaccination: Economic returns on vaccination accrue to all countries as PHSM are progressively lifted and socioeconomic activity resumes. The IMF has estimated this benefit at US$ 9 trillion by 2025, with over 40% of this gain going to advanced economies.72 Under the premise that these levels of return can occur only in a global vaccination context, consideration for HICs sharing their returns on investment by funding part of the needs of LICs/LMICs can be envisaged.
The costing analysis has emphasized a broad range of costs for COVID-19 vaccination in lower-income settings, depending on the scenario. The mapping of financial resources has pointed to key funding sources that could be leveraged to fund such costs.
While it is hard to predict, particularly at a time of economic downturn, it is likely that at lower levels of the cost spectrum (older and/or all adults as the target population), economic returns from vaccination and ODA could be leveraged to cover most of the costs in lower-income settings, making vaccination targets seem feasible from a financial perspective. COVAX had already been able to mobilize US$ 8.6 billion as of mid-2021 and additional amounts have potentially been committed by LICs/LMICs through bilateral deals.73
Nevertheless, in more resource-demanding cost scenarios (adults and adolescents, children, annual boosters), the biennium costing estimate would represent about 70% of 2018 ODA – clearly too large a share. In such a case, MDBs would probably need to play a key function in supporting financially constrained settings. The mid-August estimate of funding availability is at US$ ~24 billion,74 out of which US$ 8 billion have been awarded. These amounts would also need to be complemented by government revenues in both LICs and HICs by leveraging very important returns on investment from vaccination.
The international economic community is united in highlighting important economic returns to HICs from global vaccination through trade and capital flows channel. With the right level of political will, such returns could be leveraged to support vaccination everywhere, but this certainly represents an ambitious endeavour and should not be underestimated. Importantly, reduced procurement costs, particularly for lower-income settings, can represent another significant means to redistribute resources and enhance access.
It is also important to note that the costing ranges provided do not account for investments required beyond procurement and delivery of vaccines at both country level (e.g. surveillance systems) and international level (e.g. support for technology transfer, regulatory efforts), nor for potential costs for
71 Net ODA. Paris: Organisation for Economic Co-operation and Development (https://data.oecd.org/oda/net-oda.htm, accessed 9 August 2021). 72 A proposal to end the COVID-19 pandemic. IMF Blog, 21 May 2021. Washington (DC): International Monetary Fund; 2021 (https://blogs.imf.org/2021/05/21/a-proposal-to-end-the-covid-19-pandemic/, accessed 9 August 2021). 73 Key assumption: ~50% of the deal value paid upfront. 74 World Bank Support for Country Access to COVID-19 Vaccines. Washington (DC): The World Bank (https://www.worldbank.org/en/who-we-are/news/coronavirus-covid19/world-bank-support-for-country-access-to-covid-19-vaccines, accessed 9 August 2021).
1.X_Global_regional
SAGE meeting October 2021 87

Technical Document – Version 15 September 2021
88
external support to mass campaigns to reach very ambitious targets in a short timeframe. It is essential to highlight these omitted costs because they would increase the financial requirements to reach different targets.
7.7 Annex VII: Programmatic constraints
In order to have a sense of a country’s ability to achieve a vaccination goal successfully, three indicators have been introduced that assess the relative capacity of country systems to support a given goal–scenario combination. Countries scoring below the threshold in at least one of the three indicators are considered to be at risk of not achieving the specific goal under the given scenario.
The three indicators are:
● Indicator 1: The cost of vaccinating x% of the population is over 1% of 2021–2022 general government expenditure75 for countries where expected government revenue per person vaccinated is less than the cost per person vaccinated.
● Indicator 2: The additional HW required for vaccinating x% of the population is larger than 10% of existing HW in countries where the number of physicians per 1000 population is lower than 0.2.
● Indicator 3: Countries are not able to reach DTP3 coverage above 60%.76
7.7.1 Methodology: Programmatic constraints
● Indicator 1: The cost of vaccinating x% of the population is over 1% of 2021–2022 general government expenditure66 for countries where expected government revenue per person vaccinated is less than the cost per person vaccinated.
Note that the indicator considers increased vaccination costs relative to the general government expenditure, indirectly measuring the country’s financial capacity to deal with a vaccination target. Since the cost per vaccine dose depends on the dose schedule (boosters/no boosters) and the age target, the overall vaccination cost and, therefore, the value of the indicator, varies per goal–scenario pair.
The indicator is active only if the expected government revenue per person vaccinated is less than the cost per person vaccinated, explicitly taking into account the accrued economic benefit of vaccination. To factor this into the approach, there is a need to model the public revenues generated by vaccinations. The methodology for this is described below:
75 World Economic Outlook (data April 2021). Washington (DC): International Monetary Fund. 76 WHO/UNICEF estimates of national immunization coverage, June 2021. Extracted from the WHO Immunization Information System.
1.X_Global_regional
SAGE meeting October 2021 88

Technical Document – Version 15 September 2021
89
Table 11. Modelling public revenues generated by vaccinations
What is the intuition behind the model?
The COVID-19 economic crisis has been driven by declines in household consumption spending.
Vaccination allows people to return to their normal consumption patterns and release some pent-up demand (i.e. spend down savings).
Increased household consumption spending translates into economic growth and additional tax revenues, which may offset all or partial costs of vaccination.
How do we actually do it?
Household budget survey (HBS) data are used to estimate means and standard deviations of “typical” per-person household spending by 5-year age bands.
Based on each country’s 2020 population by age, a synthetic population of 1000 people is constructed who have consumption spending based on the HBS data (following a random normal distribution).
It is assumed that in 2020, consumption was reduced to basic needs (food, housing and rent) + some multiple of “typical” spending so that, when calibrated, aggregate consumption expenditure declined by some predetermined amount.
Vaccines are allocated according to age, allowing some randomness in non-uptake (e.g. 80% of the population aged 50+).
Vaccinated people return to typical consumption patterns + spending some (random normal) share of their 2020 savings.
This is run 100 times to capture the uncertainty in consumption and savings behaviours and in who actually is vaccinated (this gives upper and lower bound estimates).
The growth in spending is converted to GDP and then to public revenues linearly using historical tax-to-GDP ratio.
Additional resources necessary for vaccine delivery beyond existing finances were also estimated. The
attention has focused on mapping available HW to quantify the needed surge. Countries’ performance on
1.X_Global_regional
SAGE meeting October 2021 89

Technical Document – Version 15 September 2021
90
diphtheria-tetanus-pertussis third dose (DTP3) vaccine delivery was finally used as a proxy for the ability
of the health system to deliver ambitious vaccination targets for COVID-19 vaccine.77
● Indicator 2: The extra HR for vaccinating x% of the population is larger than 10% of existing HW
The indicator considers the surge in health workforce costs with increasing dose requirements. As
with Indicator 1, since the HR cost increases depend on dose requirements, the value of the
indicator varies per goal–scenario pair. The detailed methodology for calculating both the surge
and the associated cost are detailed in Annex VI: Costing and funding.
● Indicator 3: Countries are not able to reach DTP3 coverage above 60%.
The coverage criterion is applied uniformly to all countries and does not depend on other variables.
The three indicators are applied in the context of an “OR” condition, namely, if any of the three indicators applies to a given country, then the country is shortlisted as “at risk”.
7.7.2 Results: Programmatic constraints A total of 137 countries were considered and evaluated against each of the above criteria, against the four
vaccination targets described in Table 3 and under all three dose schedule scenarios. Three intermediate
and two extreme scenarios are illustrated in
77 Immunization dashboard. Geneva: World Health Organization (https://immunizationdata.who.int/, accessed 9 August 2021).
1.X_Global_regional
SAGE meeting October 2021 90

Technical Document – Version 15 September 2021
91
Exhibit 33 below.
1.X_Global_regional
SAGE meeting October 2021 91

Technical Document – Version 15 September 2021
92
Exhibit 33. Number of countries and population with potential financial and system challenges by scenario
Exhibit 33: There were originally 61 at-risk countries in the yearly booster – 0+ years scenario, 45 of which were selected mainly
due to the HW surge. Of the 61 countries, two were written off the list since the public revenue generated per vaccinated person was above the vaccination cost threshold as per the methodology explained in Table 11, hence resulting in 59 countries in the list. Annex VI:
The analysis shown leads to the conclusion that, while systems are sufficiently strong to support lower levels of vaccination ambition, the majority of lower-income countries are likely to face key challenges in mobilizing system resources to reach the most ambitious targets – with the HW surge as the main obstacle. Some UMICs may also face issues. The total population at risk in this latter scenario reaches ~3 billion while 58 countries are affected. Even in the favourable goal–scenario combination of vaccinating persons of 50+ years without a booster, 13 LICs/LMICs with a total population of 0.5 billion population, are at risk of not achieving the goal.
1.X_Global_regional
SAGE meeting October 2021 92