Embed Size (px)
Citation preview

© 2010 IBM Corporation
Global Compliance Survey 2011Tabulations of the data collected in 2010/11

© 2011 IBM Corporation2
Table of Contents 1Glossary
Participation
Worldwide Results
• CP Manufacturers and Retailers & Wholesalers 3 yrs worldwide results 2008-2010• Enablers• Business Measures• Implementation Measures
• CP Manufacturers and Retailers & Wholesalers Detail s for 2010• Enablers• Business Measures• Implementation Measures
• CP Manufacturers 2008-2010 worldwide• Enablers• Business Measures• Implementation Measures
• CP Retailers & Wholesalers 2008-2010 worldwide• Enablers• Business Measures• Implementation Measures
• Regional breakdown CP Manufacturers 2010• Enablers• Business Measures• Implementation Measures
• Regional breakdown Retailers & Wholesalers 2010• Business Measures• Implementation Measures
© 2011 IBM Corporation3
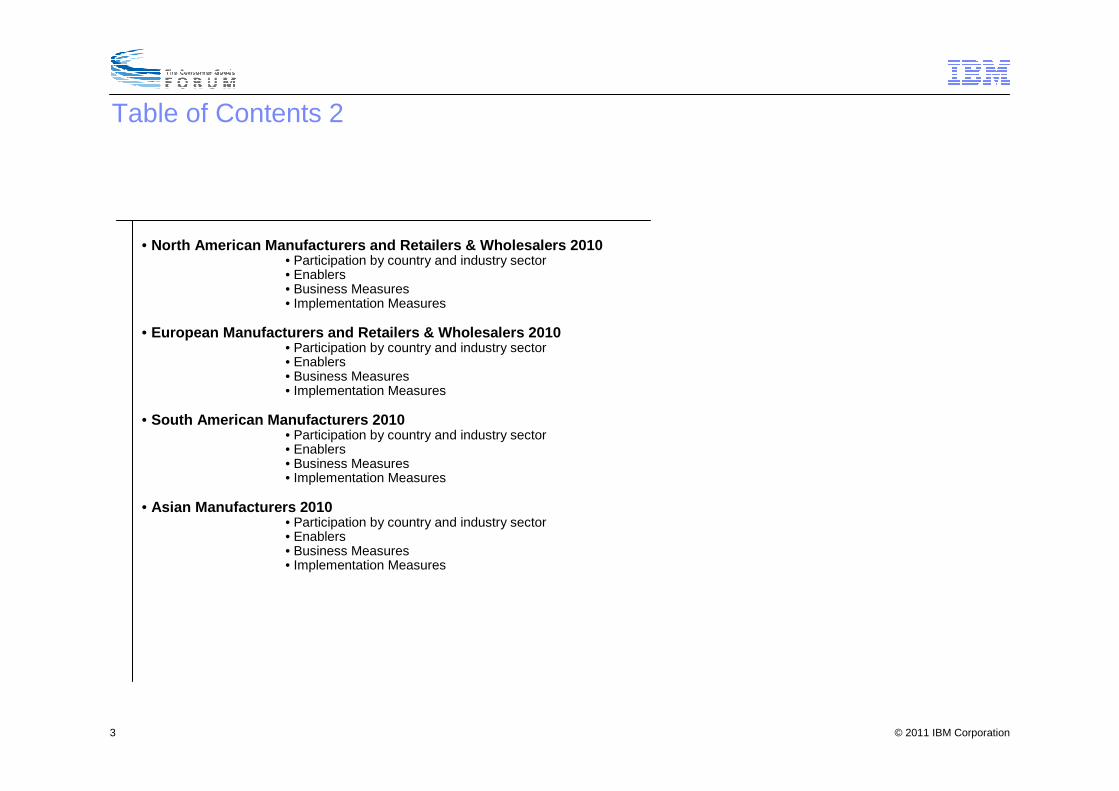
Table of Contents 2
• North American Manufacturers and Retailers & Wholes alers 2010• Participation by country and industry sector• Enablers• Business Measures• Implementation Measures
• European Manufacturers and Retailers & Wholesalers 2010• Participation by country and industry sector• Enablers• Business Measures• Implementation Measures
• South American Manufacturers 2010• Participation by country and industry sector• Enablers• Business Measures• Implementation Measures
• Asian Manufacturers 2010• Participation by country and industry sector• Enablers• Business Measures• Implementation Measures

© 2011 IBM Corporation4
Glossary
Enablers: A qualitative capability assessment on a 0 (nothing done) to 4 (fully implemented) scale that assess how a company has integrated the capability to make use of Global Standards and Industry Utilities (like GDSN).
Business Measures : Quantitative Key Performance Indicators that should improve with the integration and implementation of industry Standards, utilities and Best Practice.
Implementation Measures : Quantitative measures of the implementation of GS1 Standards and Utilities.
Weighted Revenue: Every participant in the survey enters their revenue in $US for the geography their data represents. While non-weighted data is available, this analysis reports revenue weighted results. Each measure is weighted with the company’s revenue in order to balance small and large companies results.
© 2011 IBM Corporation5
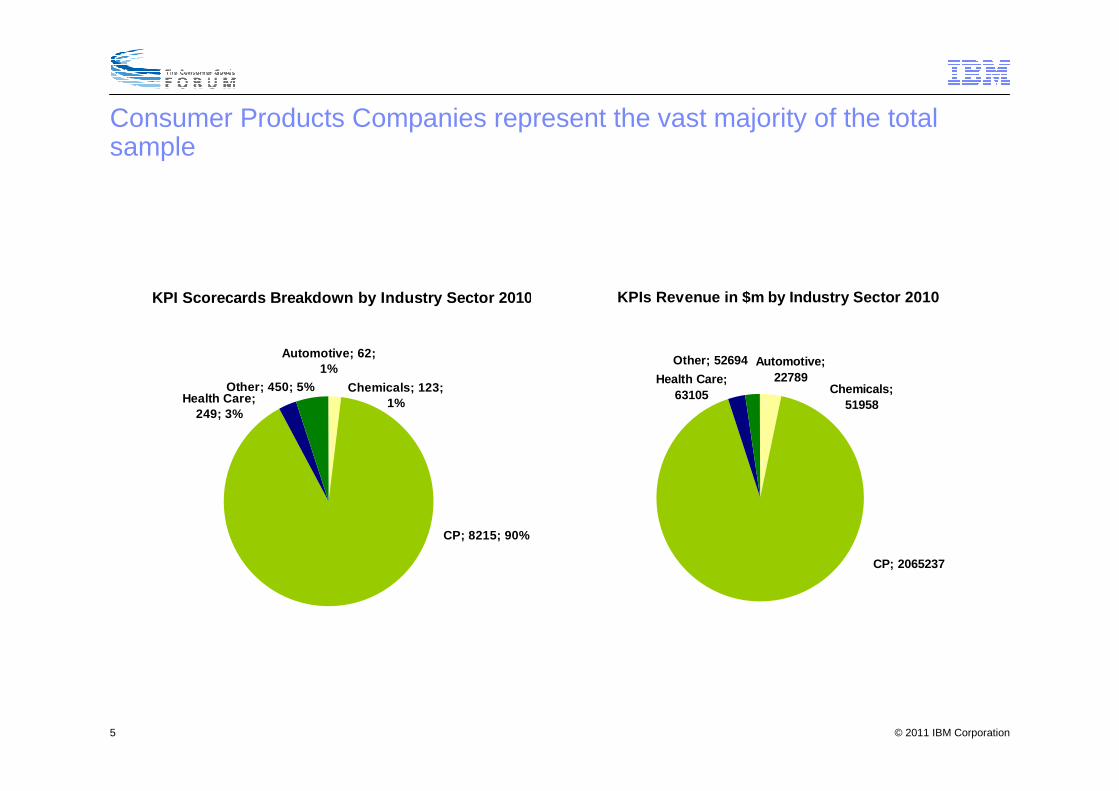
Consumer Products Companies represent the vast majority of the total sample
KPI Scorecards Breakdown by Industry Sector 2010
Health Care; 249; 3%
Other; 450; 5%
CP; 8215; 90%
Automotive; 62; 1%
Chemicals; 123; 1%
KPIs Revenue in $m by Industry Sector 2010
CP; 2065237
Health Care; 63105
Other; 52694 Automotive; 22789
Chemicals; 51958

© 2011 IBM Corporation6
Taking only the Consumer Products Companies in consideration, the manufacturers, retailers and wholesalers represent the strongest groups with 96% of the scorecards and 98% of the total revenue
CP KPI Scorecards by Business Type 2010
Others; 311; 4%
Wholesalers; 701; 9%
Retailers; 619; 8%
Manufacturers; 6584; 79%
KPIs Revenue in $m by Industry Sector 2010
Manufacturers; 884190
Retailers; 996232
Wholesalers; 134058
Others; 50758
For the whole analysis we only consider
CP Manufacturers, Retailers and Wholesalers7,904Total
619Retailers
701Wholesalers
6,584Manufacturers

© 2011 IBM Corporation7
The Consumer Products manufacturers are over-represented in Europe with regard to the submitted scorecards compared to their overall revenue
CP Manufacturers KPI Scorecards by Region 2010
Europe; 5690; 90%
North America; 532; 8%
Australasia; 4; 0,1%
South America; 17; 0,3%
Asia & Middle East; 152; 2%
CP Manufacturers KPIs Revenue in $m by Region 2010
South America; 15458
Europe; 567599
Asia & Middle East; 29117
Australasia; 5880
North America; 160439

© 2011 IBM Corporation8
Most of the Consumer Products retailers and wholesalers participating in the survey come from Europe, more than half of the revenue represented comes from North America
CP Retailers and Wholesalers KPI Scorecards by Region 2010
Australasia; 42; 3%
North America; 167; 13%
Europe; 1061; 84%
CP Retailers and Wholesalers KPIs Revenue in $m by Region 2010
Australasia; 21352
Europe; 477315
North America; 548089

© 2010 IBM Corporation
CP Manufacturers and Retailers & Wholesalers - 3 Years Worldwide Results 2008 - 2010

© 2011 IBM Corporation10
Three year Results for Enablers Scores Worldwide (Revenue-weighted Averages)
CF3- Category Tactics
3.3**3.83.03.93.4CF0301 Assortment Planning
3.9****3.3****CF0202 Information Management Market-; Shopper- & Consumer Data
3.7**1.62.43.52.6CF0203 Differentiated Solutions
3.2****2.7****CF0201 Ideation Process [Protection of Intellectual Property]
3.9**3.83.03.93.1CF0302 Assortment Evaluation
CF2- Collaborative Innovation
3.9**1.03.53.93.4CF0102 Category Management
3.0****2.8****CF0101 Joint Business Planning with Shopper & Consumer Focus
CF1- Strategy Alignment
Focus On The Consumer
3.8****3.6****P0104 Skills & Knowledge
3.3****3.3****P0103 Reward & Incentive Systems
3.8****3.1****P0102 Bi-lateral Trading Partner Collaboration (external)
3.8****3.3****P0101 Organizational Structure & Resources (internal)
P1- Prepare our People
Prepare our People
201020092008201020092008
Retailers & WholesalersManufacturers
2010
Note: Scale from 0 (Nothing planned) to 4 (Fully implemented)** insufficient data available to produce a benchmark, n<5

© 2011 IBM Corporation11
Three year results for Business Measures Worldwide(Revenue-weighted Averages)
95.390.692.895.393.696.3BM03 Store Service Level/Unit Fill Rate to Customer Distribution Centre (%)
83.282.084.795.996.493.8BM13 Invoice Accuracy (%)
2.61.51.6BM14 Retail Shrinkage Rate (%)
3.22.94.97.57.97.0BM12 Distribution Costs (% of sales value)
44.850.546.366.562.868.0BM11 Order to Delivery Cycle Time (hours)
3.03.54.84.33.94.7BM10 On-Shelf/Point-of-Sales Out-of-Stocks (%)
17.937.630.1BM09 Retail Store inventory Cover (days)
18.813.120.7BM08 Retail Distribution Centre Inventory Cover (days)
33.931.435.7BM07 Manufacturer/Supplier’s Finished Goods Inventory Cover (days)
21.815.419.8BM06 Raw Materials Inventory Cover (days)
87.289.186.092.791.792.1BM04 On-Time Delivery (%)
91.790.989.996.897.896.7BM02 Supplier Service Level/Unit Fill Rate to Customer Distribution Center (%)
1.66,64.33.63.15.9BM01 Annual Growth Rate (%)
201020092008201020092008
Retailers & WholesalersManufacturers

© 2011 IBM Corporation12
Three year results for implementation measures worldwide(Revenue-weighted Averages)
** insufficient data available to produce a benchmark, n<5
Note: lower values are due to many new smaller manufacturers participating in this year’s survey
69.771.047.2IM13 % of GTINs that are catalogued consistently with a GS1 Global Product
Classification brick code
15.426.57.0IM12 % of active SKUs where the master data has been synchronized using the
GS1 Global Data Synchronization Network
73.6**41.6IM11 % of sales with master data loaded into a GS1-certified data pool (%)
15.142.417.022.224.419.0IM10 % of sales with synchronized master data between trading partners via the
GS1 Global Data Synchronization Network
62.458.413.922.316.012.0IM09 % of shipments for which a receiving advice was transacted via EDI
59.458.722.430.135.527.6IM08 % of shipments for which a despatch advice was transmitted via EDI
79.978.667.140.545.647.7IM07 % of invoices transacted via EDI
81.375.870.451.547.051.7IM06 % of orders transacted via EDI
78.487.574.555.351.141.2IM05 % of shipping or receiving locations that have been allocated a GLN
66.671.649.457.167.249.4IM04 % of pallets/unit loads labeled with SSCC
90.387.082.673.486.687.6IM02 % of cases/cartons/inners allocated a GTIN
96.996.697.389.992.096.8IM01 % of consumer units allocated a GTIN
201020092008201020092008
Retailers & WholesalersManufacturers

© 2010 IBM Corporation
CP Manufacturer and Retailers and Wholesalers – Details for 2010
© 2011 IBM Corporation14
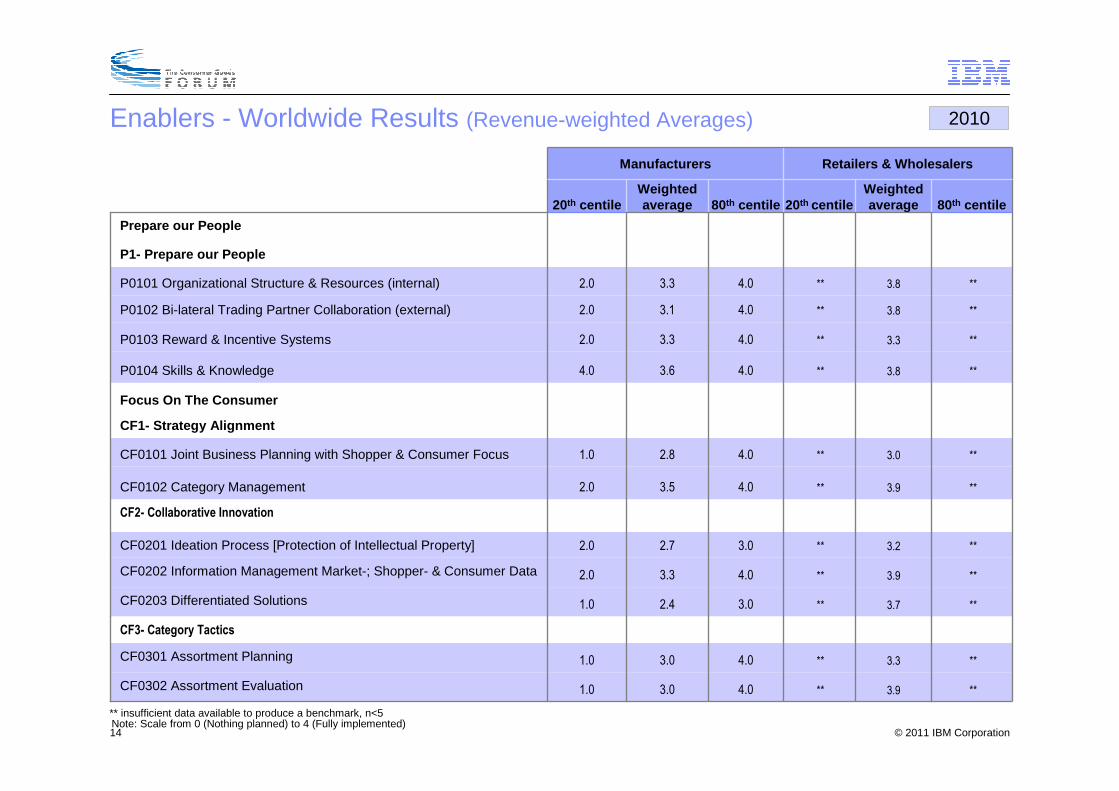
Enablers - Worldwide Results (Revenue-weighted Averages)
**3.3**4.03.01.0CF0301 Assortment Planning
**3.7**3.02.41.0CF0203 Differentiated Solutions
CF3- Category Tactics
**3.9**4.03.32.0CF0202 Information Management Market-; Shopper- & Consumer Data
**3.2**3.02.72.0CF0201 Ideation Process [Protection of Intellectual Property]
**3.9**4.03.01.0CF0302 Assortment Evaluation
CF2- Collaborative Innovation
**3.9**4.03.52.0CF0102 Category Management
**3.0**4.02.81.0CF0101 Joint Business Planning with Shopper & Consumer Focus
CF1- Strategy Alignment
Focus On The Consumer
**3.8**4.03.64.0P0104 Skills & Knowledge
**3.3**4.03.32.0P0103 Reward & Incentive Systems
**3.8**4.03.12.0P0102 Bi-lateral Trading Partner Collaboration (external)
**3.8**4.03.32.0P0101 Organizational Structure & Resources (internal)
P1- Prepare our People
Prepare our People
80th centileWeighted average20th centile80th centile
Weighted average20th centile
Retailers & WholesalersManufacturers
Note: Scale from 0 (Nothing planned) to 4 (Fully implemented)
2010
** insufficient data available to produce a benchmark, n<5

© 2011 IBM Corporation15
Business Measures - Worldwide Results (Revenue-weighted Averages)
9895.3949995.395BM03 Store Service Level/Unit Fill Rate to Customer Distribution Centre (%)
9583.28010095.992BM13 Invoice Accuracy (%)
32.61******BM14 Retail Shrinkage Rate (%)
43.2297.54BM12 Distribution Costs (% of sales value)
4844.8369066.536BM11 Order to Delivery Cycle Time (hours)
33.0364.31BM10 On-Shelf/Point-of-Sales Out-of-Stocks (%)
3517.94******BM09 Retail Store inventory Cover (days)
1818.89******BM08 Retail Distribution Centre Inventory Cover (days)
******4233.923BM07 Manufacturer/Supplier’s Finished Goods Inventory Cover (days)
******3021.89BM06 Raw Materials Inventory Cover (days)
8787.2859992.790BM04 On-Time Delivery (%)
9291.7909996.895BM02 Supplier Service Level/Unit Fill Rate to Customer Distribution Center (%)
31.6163.61BM01 Annual Growth Rate (%)
80th centileWeighted average
20th centile80th centileWeighted average
20th
centile
Retailers & WholesalersManufacturers
** insufficient data available to produce a benchmark, n<5
2010
© 2011 IBM Corporation16
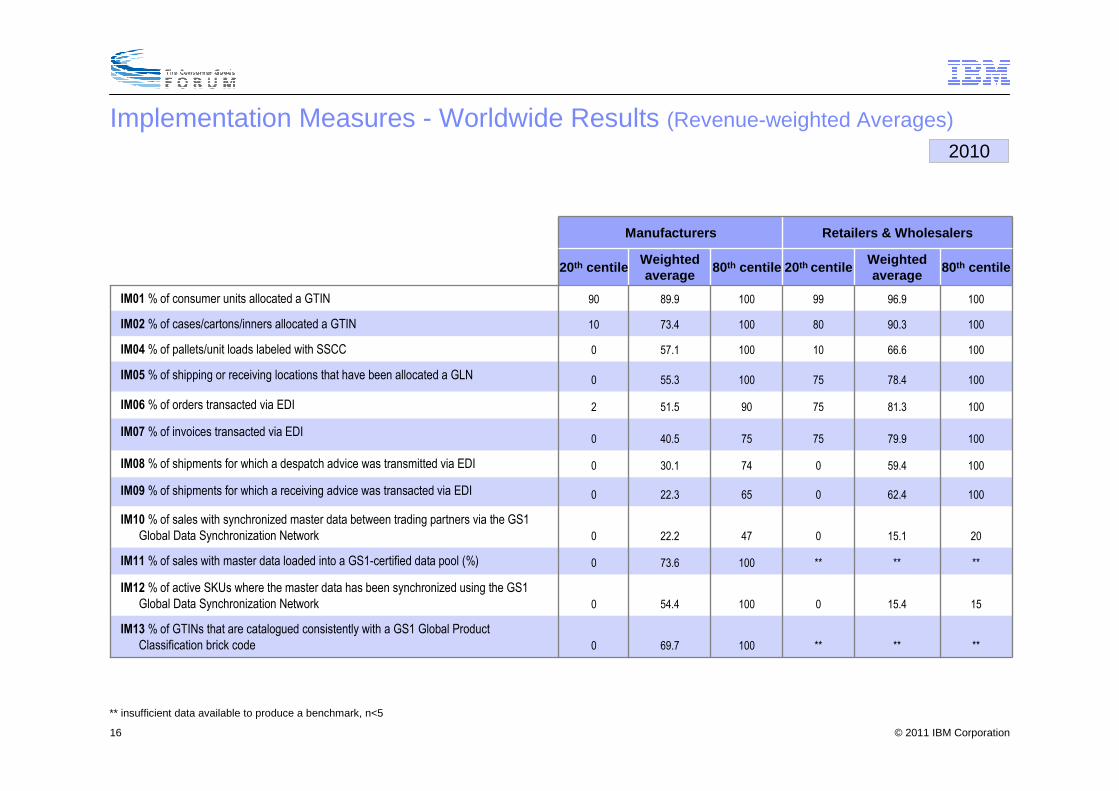
Implementation Measures - Worldwide Results (Revenue-weighted Averages)
******10069.70
IM13 % of GTINs that are catalogued consistently with a GS1 Global Product Classification brick code
1515.4010054.40
IM12 % of active SKUs where the master data has been synchronized using the GS1 Global Data Synchronization Network
******10073.60IM11 % of sales with master data loaded into a GS1-certified data pool (%)
2015.104722.20
IM10 % of sales with synchronized master data between trading partners via the GS1 Global Data Synchronization Network
10062.406522.30IM09 % of shipments for which a receiving advice was transacted via EDI
10059.407430.10IM08 % of shipments for which a despatch advice was transmitted via EDI
10079.9757540.50IM07 % of invoices transacted via EDI
10081.3759051.52IM06 % of orders transacted via EDI
10078.47510055.30IM05 % of shipping or receiving locations that have been allocated a GLN
10066.61010057.10IM04 % of pallets/unit loads labeled with SSCC
10090.38010073.410IM02 % of cases/cartons/inners allocated a GTIN
10096.99910089.990IM01 % of consumer units allocated a GTIN
80th centileWeighted average
20th centile80th centileWeighted average
20th centile
Retailers & WholesalersManufacturers
** insufficient data available to produce a benchmark, n<5
2010
© 2010 IBM Corporation
CP Manufacturer 2007-2010

© 2011 IBM Corporation18
116,129343.051,716153.934,255403.478,393823.2CF0301 Assortment Planning
116,129343.051,716153.934,255403.178,393822.7CF0302 Assortment Evaluation
CF3- Category Tactics
116,129342.451,716153.534,278412.681,660832.7CF0203 Differentiated Solutions
115,489333.3**<5****<5****<5**CF0202 Information Management Market-; Shopper- & Consumer Data
115,489332.7**<5****<5****<5**CF0201 Ideation Process [Protection of Intellectual Property]
CF2- Collaborative Innovation
116,129343.551,716153.934,578433.489,103873.2CF0102 Category Management
115,489332.8**<5****<5****<5**CF0101 Joint Business Planning with Shopper & Consumer Focus
CF1- Strategy Alignment
Focus On The Consumer
113,189323.6**<5****<5****<5**P0104 Skills & Knowledge
83,189313.3**<5****<5****<5**P0103 Reward & Incentive Systems
113,189323.1**<5****<5****<5**P0102 Bi-lateral Trading Partner Collaboration (external)
113,189323.3**<5****<5****<5**P0101 Organizational Structure & Resources (internal)
P1- Prepare our People
Prepare our People
Total revenue (millions of
US$)
Sample Size
Weighted average
Total revenue (millions of
US$)
Sample Size
Weighted average
Total revenue (millions of
US$)
Sample Size
Weighted average
Total revenue (millions of
US$)
Sample Size
Weighted average
2010200920082007
Consumer Products Manufacturers
Consumer Products Manufacturers Worldwide Results for Enablers (Revenue-weighted Averages)
Note: Scale from 0 (Nothing planned) to 4 (Fully implemented)** insufficient data available to produce a benchmark, n<5

© 2011 IBM Corporation19
Consumer Products Manufacturers Worldwide Results for Business Measures (Revenue-weighted Averages)
206,66151095.9226,27728896.4146,46825293.8151,09416194.4BM13 Invoice Accuracy (%)
256,8321237.5273,4952167.8223,2042797.0220,3212207.6BM12 Distribution Costs (% of sales value)
258,71012466.5285,97131162.8245,60831467.9276,11725785.6BM11 Order to Delivery Cycle Time (hours)
194,4784804.3210,7761303.9159,2381914.7199,2801055.1BM10 On-Shelf/Point-of-Sale Out-of-Stocks (%)
255,00211933.9274,78422331.4264,35732435.8262,37419132.6BM07 Manufacturer/Supplier's Finished Goods Inventory Cover (days)
194,9577521.8226,81415115.4174,29523419.8213,08212018.1BM06 Raw Materials Inventory Cover (days)
249,77953994.2272,11630891.6317,02138292.1274,54924491.9BM04 On-Time Delivery (%)
129,9706395.3202,34621093.6113,13317796.5128,7818796.0BM03 Store Service Level / Unit Fill Rate (%)
260,71212996.8272,24431997.8322,88937096.7262,89620195.1BM02 Supplier Service Level / Unit Fill Rate to Customer Distribution Centre (%)
290.1215393.6284,4052973.1275,1213416.4247,0572065.5BM01 Annual Growth Rate (%)
Total revenue (millions of
US$)
Sample Size
Weighted average
Total revenue (millions of
US$)
Sample Size
Weighted average
Total revenue (millions of
US$)
Sample Size
Weighted average
Total revenue (millions of
US$)
Sample Size
Weighted average
2010200920082007
Consumer Products Manufacturers
** insufficient data available to produce a benchmark, n<5
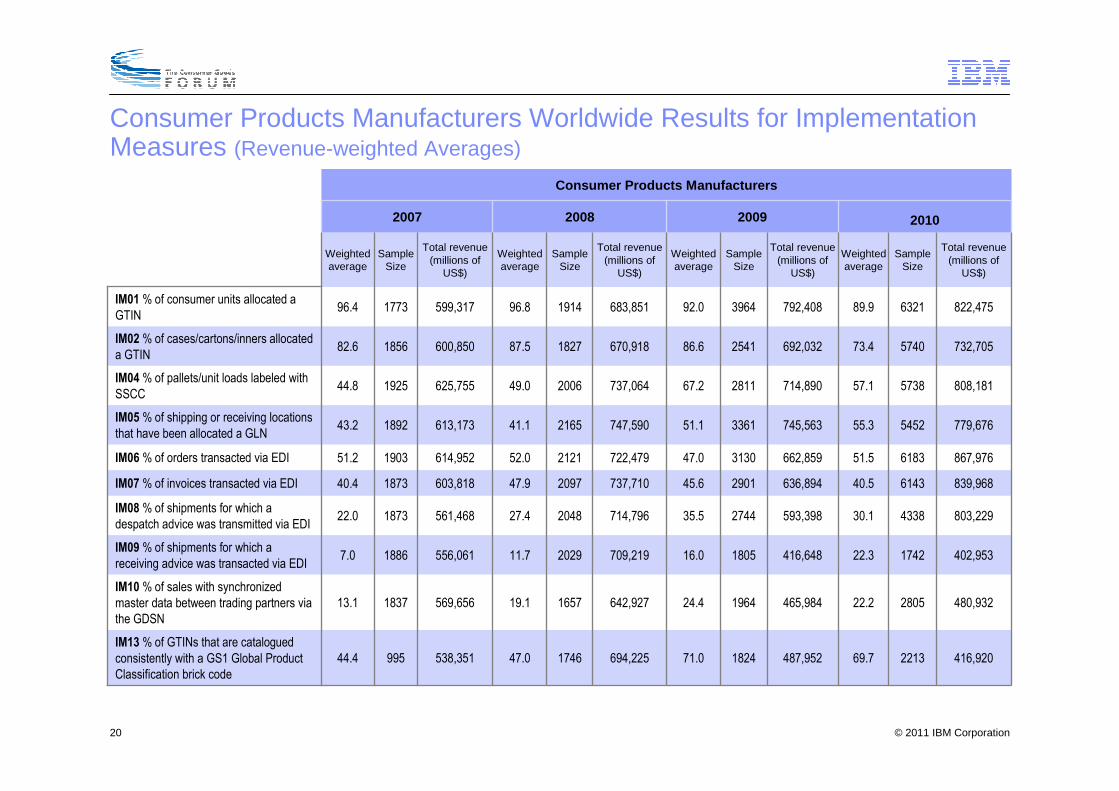
© 2011 IBM Corporation20
Consumer Products Manufacturers Worldwide Results for Implementation Measures (Revenue-weighted Averages)
416,920221369.7487,952182471.0694,225174647.0538,35199544.4IM13 % of GTINs that are catalogued consistently with a GS1 Global Product Classification brick code
480,932280522.2465,984196424.4642,927165719.1569,656183713.1IM10 % of sales with synchronized master data between trading partners via the GDSN
402,953174222.3416,648180516.0709,219202911.7556,06118867.0IM09 % of shipments for which a receiving advice was transacted via EDI
803,229433830.1593,398274435.5714,796204827.4561,468187322.0IM08 % of shipments for which a despatch advice was transmitted via EDI
839,968614340.5636,894290145.6737,710209747.9603,818187340.4IM07 % of invoices transacted via EDI
867,976618351.5662,859313047.0722,479212152.0614,952190351.2IM06 % of orders transacted via EDI
779,676545255.3745,563336151.1747,590216541.1613,173189243.2IM05 % of shipping or receiving locations that have been allocated a GLN
808,181573857.1714,890281167.2737,064200649.0625,755192544.8IM04 % of pallets/unit loads labeled with SSCC
732,705574073.4692,032254186.6670,918182787.5600,850185682.6IM02 % of cases/cartons/inners allocated a GTIN
822,475632189.9792,408396492.0683,851191496.8599,317177396.4IM01 % of consumer units allocated a GTIN
Total revenue (millions of
US$)
Sample Size
Weighted average
Total revenue (millions of
US$)
Sample Size
Weighted average
Total revenue (millions of
US$)
Sample Size
Weighted average
Total revenue (millions of
US$)
Sample Size
Weighted average
2010200920082007
Consumer Products Manufacturers

© 2010 IBM Corporation
CP Retailers & Wholesalers 2007-2010

© 2011 IBM Corporation22
533,67183.3**<5**392,08693.8370,830203.7CF0301 Assortment Planning
533,67183.9**<5**392,08693.8370,830203.6CF0302 Assortment Evaluation
CF3- Category Tactics
533,67183.7**<5**389,08681.6370,830203.2CF0203 Differentiated Solutions
528,66163.9**<5****<5****<5**CF0202 Information Management Market-; Shopper- & Consumer Data
528,66163.2**<5****<5****<5**CF0201 Ideation Process [Protection of Intellectual Property]
CF2- Collaborative Innovation
533,67183.9**<5**392,08691.0418,634213.2CF0102 Category Management
528,66163.0**<5****<5****<5**CF0101 Joint Business Planning with Shopper & Consumer Focus
CF1- Strategy Alignment
Focus On The Consumer
528,66163.8**<5****<5****<5**P0104 Skills & Knowledge
528,66163.3**<5****<5****<5**P0103 Reward & Incentive Systems
528,66163.8**<5****<5****<5**P0102 Bi-lateral Trading Partner Collaboration (external)
528,66163.8**<5****<5****<5**P0101 Organizational Structure & Resources (internal)
P1- Prepare our People
Prepare our People
Total revenue (millions of
US$)
Sample Size
Weighted average
Total revenue (millions of
US$)
Sample Size
Weighted average
Total revenue (millions of
US$)
Sample Size
Weighted average
Total revenue (millions of
US$)
Sample Size
Weighted average
2010200920082007
Consumer Products Retailers & Wholesalers
Consumer Products Retailers and Wholesalers Worldwide Results for Enablers (Revenue-weighted Averages)
Note: Scale from 0 (Nothing planned) to 4 (Fully implemented)** insufficient data available to produce a benchmark, n<5

© 2011 IBM Corporation23
Consumer Products Retailers and Wholesalers Worldwide Results for Business Measures (Revenue-weighted Averages)
157,413322.68,873121.5121,292621.6**<5**BM14 Retail shrinkage rate (%)
178,07817483.2311,2953281.9517,9348884.7547,1337290.1BM13 Invoice Accuracy (%)
85,635363.28,950152.9243,687834.9307,566673.4BM12 Distribution Costs (% of sales value) (%)
562,9793444.8360,3834350.5552,52710046.3518,5227362.2BM11 Order to Delivery Cycle Time (hours)
592,7801773.0338,927153.5500,659804.8512,762683.8BM10 On-Shelf/Point-of-Sale Out-of-Stocks (%)
169,9793417.960,2052437.6241,3638830.1308,4417923.7BM09 Retail Store Inventory Cover (days)
146,4322918.837,4521513.1215,5697420.7322,6376015.3BM08 Retail Distribution Centre Inventory Cover (days)
579,50317187.2360,4054789.1565,74113386.0581,6969387.9BM04 On-Time Delivery (%)
169,9793495.360,7864190.6305,00910192.8300,5197093.3BM03 Store Service Level / Unit Fill Rate (%)
555,4872091.7337,1153290.9571,6378889.9506,7406090.0
BM02 Supplier Service Level / Unit Fill Rate to Customer Distribution Centre (%)
645,5701861.6363,375376.6552,2941424.3602,855874.9BM01 Annual Growth Rate (%)
Total revenue (millions of US$)
Sample Size
Weighted average
Total revenue (millions of US$)
Sample Size
Weighted average
Total revenue (millions of US$)
Sample Size
Weighted average
Total revenue (millions of US$)
Sample Size
Weighted average
2010200920082007
Consumer Products Retailers & Wholesalers
** insufficient data available to produce a benchmark, n<5

© 2011 IBM Corporation24
Consumer Products Retailers and Wholesalers Worldwide Results for Implementation Measures (Revenue-weighted Averages)
Total revenue (millions of US$)
Sample Size
Weighted average
Total revenue (millions of US$)
Sample Size
Weighted average
Total revenue (millions of US$)
Sample Size
Weighted average
Total revenue (millions of US$)
Sample Size
Weighted average
310,2617715.4519,2308426.5673,1503547.0711,8934482.9IM12 % of active SKUs where the master data has been synchronized using GDSN
318,79223215.1459,13915042.4683,82338117.0850,9835009.4
IM10 % of sales with synchronized master data between trading partners via the GDSN
735,08531062.4588,32239358.4547,12859813.9899,25051329.8IM09 % of shipments for which a receiving advice was transacted via EDI
1,112,487115259.4668,76150858.7532,81060422.4916,38051828.0IM08 % of shipments for which a despatch advice was transmitted via EDI
1,115,976128479.9733,74854178.62882,63566267.1999,76954063.4IM07 % of invoices transacted via EDI
1,113,664129881.3684,56055875.8858,51465570.4932,87653668.8IM06 % of orders transacted via EDI
1,050,99098278.4756,49238787.5919,05080474.5974,62653264.3IM05 % of shipping or receiving locations that have been allocated a GLN
948,334115266.6670,98339471.6857,71260049.4895,78350351.1IM04 % of pallets/unit loads labeled with SSCC
1,048,683113190.3687,95248386.6832,41056082.6880,49248577.4IM02 % of cases/cartons/inners allocated a GTIN
1,097,474129096.9750,76963596.6899,10861997.3990,65154891.7IM01 % of consumer units allocated a GTIN
2010200920082007
Consumer Products Retailers & Wholesalers
** insufficient data available to produce a benchmark, n<5

© 2010 IBM Corporation
CP Manufacturers – Regional Breakdown 2010
© 2011 IBM Corporation26
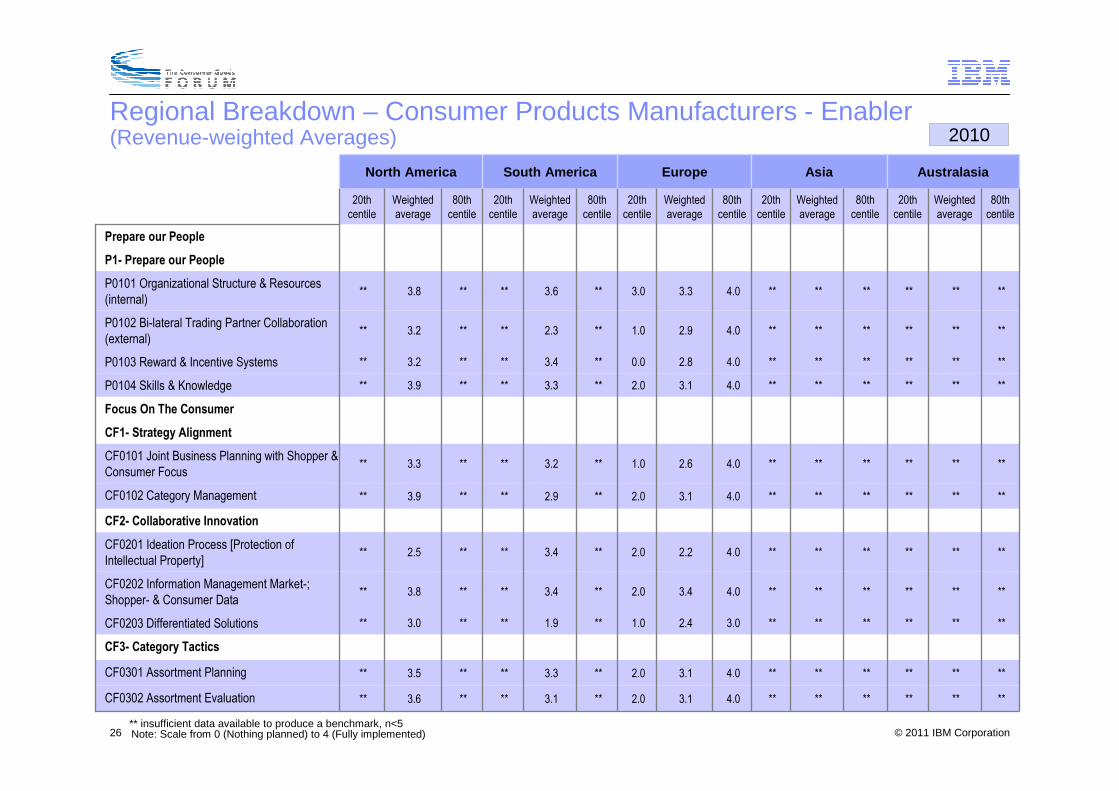
Regional Breakdown – Consumer Products Manufacturers - Enabler (Revenue-weighted Averages)
************4.03.12.0**3.3****3.5**CF0301 Assortment Planning
CF3- Category Tactics
************4.03.12.0**3.1****3.6**CF0302 Assortment Evaluation
************3.02.41.0**1.9****3.0**CF0203 Differentiated Solutions
************4.03.42.0**3.4****3.8**CF0202 Information Management Market-; Shopper- & Consumer Data
************4.02.22.0**3.4****2.5**CF0201 Ideation Process [Protection of Intellectual Property]
CF2- Collaborative Innovation
************4.03.12.0**2.9****3.9**CF0102 Category Management
************4.02.61.0**3.2****3.3**CF0101 Joint Business Planning with Shopper & Consumer Focus
CF1- Strategy Alignment
Focus On The Consumer
************4.03.12.0**3.3****3.9**P0104 Skills & Knowledge
************4.02.80.0**3.4****3.2**P0103 Reward & Incentive Systems
************4.02.91.0**2.3****3.2**P0102 Bi-lateral Trading Partner Collaboration (external)
************4.03.33.0**3.6****3.8**P0101 Organizational Structure & Resources (internal)
P1- Prepare our People
Prepare our People
80th centile
Weighted average
20th centile
80th centile
Weighted average
20th centile
80th centile
Weighted average
20th centile
80th centile
Weighted average
20th centile
80th centile
Weighted average
20th centile
AustralasiaAsiaEuropeSouth AmericaNorth America
2010
Note: Scale from 0 (Nothing planned) to 4 (Fully implemented)** insufficient data available to produce a benchmark, n<5
© 2011 IBM Corporation27
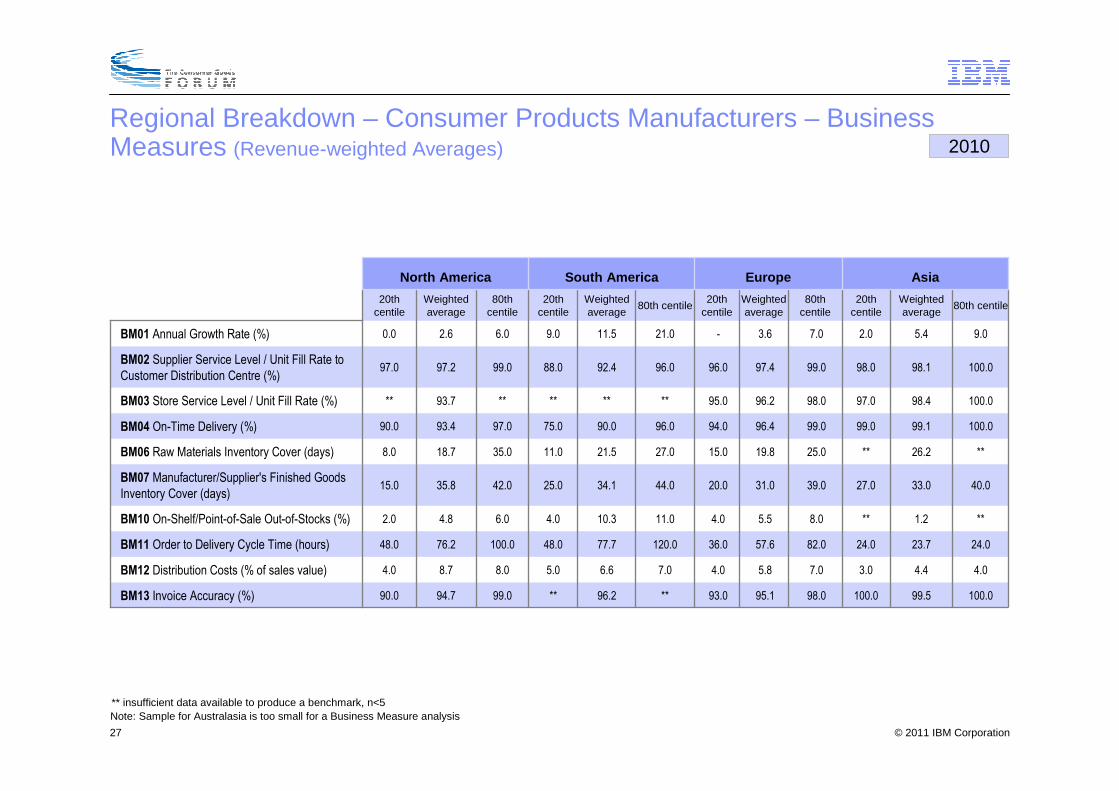
Regional Breakdown – Consumer Products Manufacturers – Business Measures (Revenue-weighted Averages)
100.099.5100.098.0 95.1 93.0 **96.2**99.094.790.0BM13 Invoice Accuracy (%)
4.04.43.07.0 5.8 4.0 7.06.65.08.08.74.0BM12 Distribution Costs (% of sales value)
24.023.724.082.0 57.6 36.0 120.077.748.0100.076.248.0BM11 Order to Delivery Cycle Time (hours)
**1.2**8.0 5.5 4.0 11.010.34.06.04.82.0BM10 On-Shelf/Point-of-Sale Out-of-Stocks (%)
40.033.027.039.0 31.020.0 44.034.125.042.035.815.0BM07 Manufacturer/Supplier's Finished Goods Inventory Cover (days)
**26.2**25.0 19.815.0 27.021.511.035.018.78.0BM06 Raw Materials Inventory Cover (days)
100.099.199.099.0 96.4 94.0 96.090.075.097.093.490.0BM04 On-Time Delivery (%)
100.098.497.098.0 96.295.0 ********93.7**BM03 Store Service Level / Unit Fill Rate (%)
100.098.198.099.0 97.496.0 96.092.488.099.097.297.0BM02 Supplier Service Level / Unit Fill Rate to Customer Distribution Centre (%)
9.05.42.07.0 3.6-21.011.59.06.02.60.0BM01 Annual Growth Rate (%)
80th centileWeighted average
20th centile
80th centile
Weighted average
20th centile
80th centileWeighted average
20th centile
80th centile
Weighted average
20th centile
AsiaEuropeSouth AmericaNorth America
Note: Sample for Australasia is too small for a Business Measure analysis** insufficient data available to produce a benchmark, n<5
2010

© 2011 IBM Corporation28
Regional Breakdown – Consumer Products Manufacturers –Implementation Measures (Revenue-weighted Averages)
0.012.70.0100.0 56.3 **100.037.20.0100.095.395.0IM13 % of GTINs that are catalogued consistently with a GS1 Global Product Classification brick code
0.00.60.040.0 16.2 **6.04.70.050.038.020.0IM10 % of sales with synchronized master data between trading partners via the GDSN
0.01.60.065.0 32.2 **0.00.10.060.021.00.0IM09 % of shipments for which a receiving advice was transacted via EDI
0.04.70.075.0 31.7 **0.00.60.074.045.05.0IM08 % of shipments for which a despatch advice was transmitted via EDI
3.09.40.075.0 35.9 ** 82.053.710.090.071.540.0IM07 % of invoices transacted via EDI
75.023.90.080.0 50.7 **82.067.740.094.071.66.0IM06 % of orders transacted via EDI
20.017.00.0100.0 55.9 **100.071.60.0100.063.70.0IM05 % of shipping or receiving locations that have been allocated a GLN
0.012.30.0100.0 52.6 ** 100.045.10.0100.089.775.0IM04 % of pallets/unit loads labeled with SSCC
100.095.7100.0100.0 66.1** 100.098.5100.0100.093.790.0IM02 % of cases/cartons/inners allocated a GTIN
100.099.3100.0100.0 87.0 75.0 100.0100.0100.0100.099.1100.0IM01 % of consumer units allocated a GTIN
80th centile
Weighted average
20th centile80th centile
Weighted average
20th centile
80th centile
Weighted average
20th centile
80th centile
Weighted average
20th centile
AsiaEuropeSouth AmericaNorth America
2010
** insufficient data available to produce a benchmark, n<5
© 2010 IBM Corporation
CP Retailers and Wholesalers – Regional Breakdown 2010
© 2011 IBM Corporation30
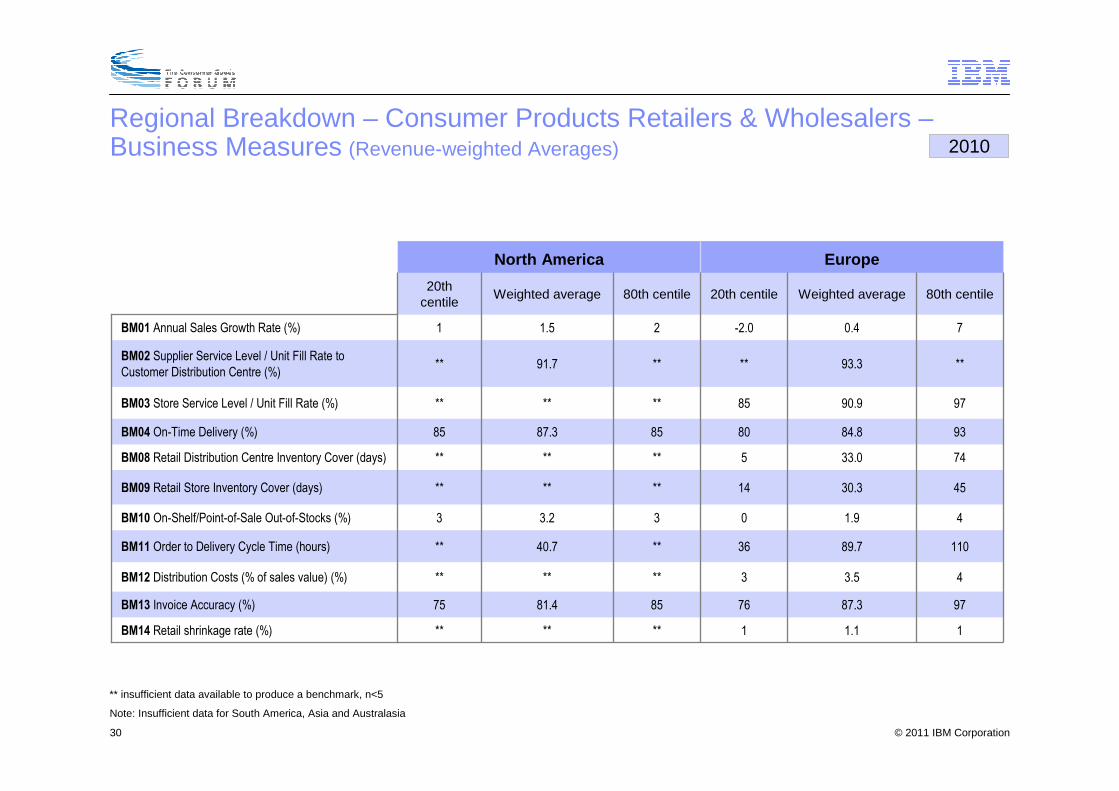
Regional Breakdown – Consumer Products Retailers & Wholesalers –Business Measures (Revenue-weighted Averages)
Note: Insufficient data for South America, Asia and Australasia
11.11******BM14 Retail shrinkage rate (%)
9787.3768581.475BM13 Invoice Accuracy (%)
43.53******BM12 Distribution Costs (% of sales value) (%)
11089.736**40.7**BM11 Order to Delivery Cycle Time (hours)
41.9033.23BM10 On-Shelf/Point-of-Sale Out-of-Stocks (%)
4530.314******BM09 Retail Store Inventory Cover (days)
7433.05******BM08 Retail Distribution Centre Inventory Cover (days)
9384.8808587.385BM04 On-Time Delivery (%)
9790.985******BM03 Store Service Level / Unit Fill Rate (%)
**93.3****91.7**BM02 Supplier Service Level / Unit Fill Rate to Customer Distribution Centre (%)
70.4-2.021.51BM01 Annual Sales Growth Rate (%)
80th centileWeighted average20th centile80th centileWeighted average20th
centile
EuropeNorth America
** insufficient data available to produce a benchmark, n<5
2010
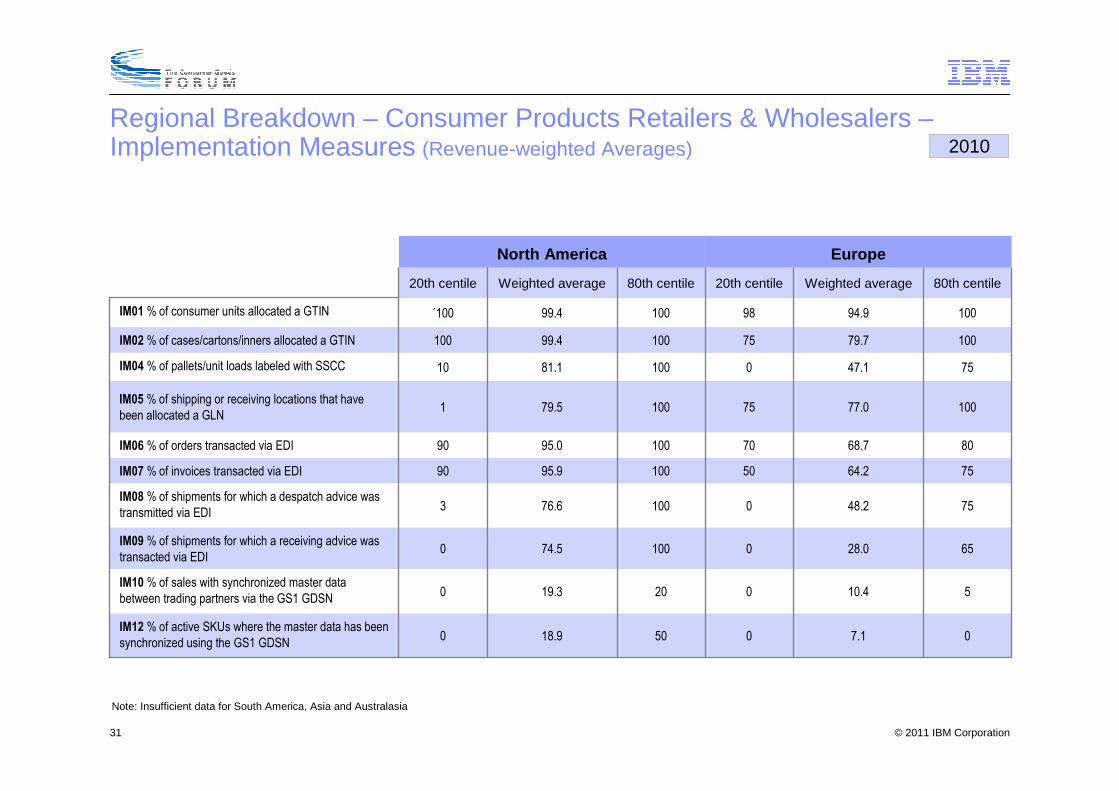
© 2011 IBM Corporation31
Regional Breakdown – Consumer Products Retailers & Wholesalers –Implementation Measures (Revenue-weighted Averages)
Note: Insufficient data for South America, Asia and Australasia
07.105018.90IM12 % of active SKUs where the master data has been synchronized using the GS1 GDSN
510.402019.30IM10 % of sales with synchronized master data between trading partners via the GS1 GDSN
6528.0010074.50IM09 % of shipments for which a receiving advice was transacted via EDI
7548.2010076.63IM08 % of shipments for which a despatch advice was transmitted via EDI
7564.25010095.990IM07 % of invoices transacted via EDI
8068.77010095.090IM06 % of orders transacted via EDI
10077.07510079.51IM05 % of shipping or receiving locations that have been allocated a GLN
7547.1010081.110IM04 % of pallets/unit loads labeled with SSCC
10079.77510099.4100IM02 % of cases/cartons/inners allocated a GTIN
10094.99810099.4´100IM01 % of consumer units allocated a GTIN
80th centileWeighted average20th centile80th centileWeighted average20th centile
EuropeNorth America
2010

© 2010 IBM Corporation
CP Manufacturers, Retailers and Wholesalers - North America

© 2011 IBM Corporation33
Participation by country in North America for Manufacturers
CP KPI Scorecards by Country 2010
Mexico; 5; 1%
Canada; 56; 11%
Multiple Countries; 5; 1%
United States; 466; 87%
KPIs Revenue in $m by Country 2010
Mexico; 6698; 4%
United States; 5387; 3%
Multiple Countries; 23892; 15%
Canada; 124462; 78%

© 2011 IBM Corporation34
Participation by country in North America for Retailers and Wholesalers
CP KPI Scorecards by Country 2010
Canada; 14; 8%
United States; 153; 92%
KPIs Revenue in $m by Country Sector 2010
Canada; 15756; 3%
United States; 532333; 97%

© 2011 IBM Corporation35
52,41173.5**<5**18,97473.532,029153.1CF0301 Assortment Planning
201020092008
Consumer Products Manufacturers – North America
2007
52,41173.6**<5**18,97473.332,029152.9CF0302 Assortment Evaluation
CF3- Category Tactics
52,41173.0**<5**18,97472.932,029153.1CF0203 Differentiated Solutions
52,41173.8**<5****<5****<5**CF0202 Information Management Market-; Shopper- & Consumer Data
52,41172.5**<5****<5****<5**CF0201 Ideation Process [Protection of Intellectual Property]
CF2- Collaborative Innovation
52,41173.9**<5**18,97473.539,029163.0CF0102 Category Management
52,41173.3**<5****<5****<5**CF0101 Joint Business Planning with Shopper & Consumer Focus
CF1- Strategy Alignment
Focus On The Consumer
50,11163.9**<5****<5****<5**P0104 Skills & Knowledge
20,11153.2**<5****<5****<5**P0103 Reward & Incentive Systems
50,11163.2**<5****<5****<5**P0102 Bi-lateral Trading Partner Collaboration (external)
50,11163.8**<5****<5****<5**P0101 Organizational Structure & Resources (internal)
P1- Prepare our People
Prepare our People
Total revenue (millions of
US$)
Sample Size
Weighted average
Total revenue (millions of
US$)
Sample Size
Weighted average
Total revenue (millions of US$)
Sample Size
Weighted average
Total revenue (millions of
US$)
Sample Size
Weighted average
** insufficient data available to produce a benchmark, n<5
Note: Scale from 0 (Nothing planned) to 4 (Fully implemented)
Consumer Products Manufacturers North American Results for Enablers. (Revenue-weighted Averages)
© 2011 IBM Corporation36
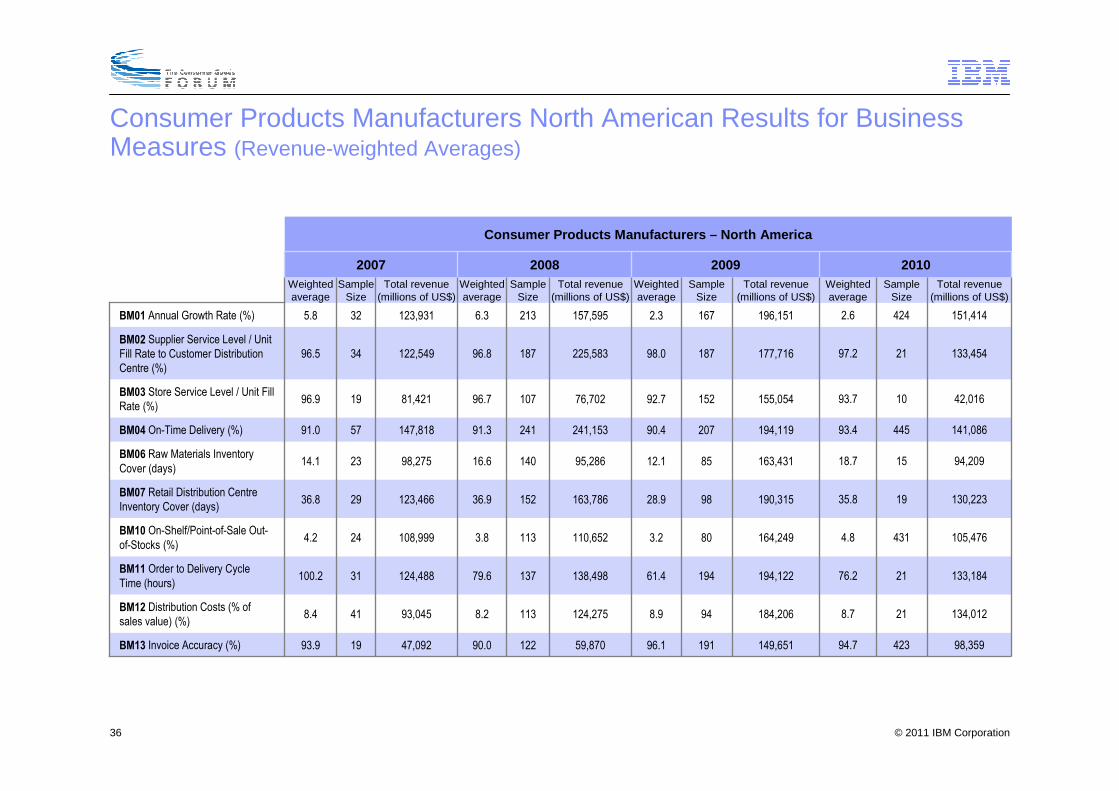
Consumer Products Manufacturers North American Results for Business Measures (Revenue-weighted Averages)
94,2091518.7163,4318512.195,28614016.698,2752314.1BM06 Raw Materials Inventory Cover (days)
98,35942394.7149,65119196.159,87012290.047,0921993.9BM13 Invoice Accuracy (%)
134,012218.7184,206948.9124,2751138.293,045418.4BM12 Distribution Costs (% of sales value) (%)
133,1842176.2194,12219461.4138,49813779.6124,48831100.2BM11 Order to Delivery Cycle Time (hours)
105,4764314.8164,249803.2110,6521133.8108,999244.2BM10 On-Shelf/Point-of-Sale Out-of-Stocks (%)
130,2231935.8190,3159828.9163,78615236.9123,4662936.8BM07 Retail Distribution Centre Inventory Cover (days)
141,08644593.4194,11920790.4241,15324191.3147,8185791.0BM04 On-Time Delivery (%)
42,0161093.7155,05415292.776,70210796.781,4211996.9BM03 Store Service Level / Unit Fill Rate (%)
133,4542197.2177,71618798.0225,58318796.8122,5493496.5BM02 Supplier Service Level / Unit Fill Rate to Customer Distribution Centre (%)
151,4144242.6196,1511672.3157,5952136.3123,931325.8BM01 Annual Growth Rate (%)
Total revenue (millions of US$)
Sample Size
Weighted average
Total revenue (millions of US$)
Sample Size
Weighted average
Total revenue (millions of US$)
Sample Size
Weighted average
Total revenue (millions of US$)
Sample Size
Weighted average
2010200920082007
Consumer Products Manufacturers – North America

© 2011 IBM Corporation37
Consumer Products Manufacturers North American Results for Implementation Measures (Revenue-weighted Averages)
Consumer Products Manufacturers – North America
2010200920082007Total revenue
(millions of US$)
Sample Size
Weighted average
Total revenue (millions of
US$)
Sample Size
Weighted average
Total revenue (millions of
US$)
Sample Size
Weighted average
Total revenue (millions of
US$)
Sample Size
Weighted average
152,21344295.3208,65311591.7460,34163952.3285,56545651.4IM13 % of GTINs that are catalogued consistently with a GS1 Global Product Classification brick code
144,70715438.0204,34725236.2452,59161825.0287,18947720.9IM10 % of sales with synchronized master data between trading partners via GDSN
144,35646721.0165,44314519.6453,20064016.3257,5204678.2IM09 % of shipments for which a receiving advice was transacted via EDI
146,13250345.0165,44714848.0460,37364131.9259,28346928.5IM08 % of shipments for which a despatch advice was transmitted via EDI
147,26250771.5211,51624262.8460,37764359.6299,31147953.5IM07 % of invoices transacted via EDI
157,30051171.6205,07924553.3460,37764358.9308,27647966.9IM06 % of orders transacted via EDI
156,01847863.7211,38625748.4460,35064229.0290,01246037.7IM05 % of shipping or receiving locations that have been allocated a GLN
143,82251789.7211,04325761.0460,35064245.8300,66246939.5IM04 % of pallets/unit loads labeled with SSCC
160,18252493.7212,50927290.3404,77037291.6309,13648587.3IM02 % of cases/cartons/inners allocated a GTIN
159,85352599.1205,55727699.6404,77037298.7309,10348596.7IM01 % of consumer units allocated a GTIN

© 2011 IBM Corporation38
510,00053.3**<5****<5**324,08453.8CF0301 Assortment Planning
201020092008
Consumer Products Retailers & Wholesalers - North Am erica
2007
510,00053.9**<5****<5**324,08453.7CF0302 Assortment Evaluation
CF3- Category Tactics
510,00053.8**<5****<5**324,08453.3CF0203 Differentiated Solutions
**<5****<5****<5****<5**CF0202 Information Management Market-; Shopper- & Consumer Data
**<5****<5****<5****<5**CF0201 Ideation Process [Protection of Intellectual Property]
CF2- Collaborative Innovation
510,00053.9**<5****<5**324,08453.1CF0102 Category Management
**<5****<5****<5****<5**CF0101 Joint Business Planning with Shopper & Consumer Focus
CF1- Strategy Alignment
Focus On The Consumer
**<5****<5****<5****<5**P0104 Skills & Knowledge
**<5****<5****<5****<5**P0103 Reward & Incentive Systems
**<5****<5****<5****<5**P0102 Bi-lateral Trading Partner Collaboration (external)
**<5****<5****<5****<5**P0101 Organizational Structure & Resources (internal)
P1- Prepare our People
Prepare our People
Total revenue (millions of
US$)
Sample Size
Weighted average
Total revenue (millions of
US$)
Sample Size
Weighted average
Total revenue (millions of US$)
Sample Size
Weighted average
Total revenue (millions of
US$)
Sample Size
Weighted average
** insufficient data available to produce a benchmark, n<5
Note: Scale from 0 (Nothing planned) to 4 (Fully implemented)
Consumer Products Retailers and Wholesalers North American Results for Enablers (Revenue-weighted Averages)

© 2011 IBM Corporation39
Consumer Products Retailers and Wholesalers North American Results for Business Measures (Revenue-weighted Averages)
** insufficient data available to produce a benchmark, n<5
Consumer Products Retailers & Wholesalers - North Am erica
2010200920082007
123,90214481.4305,7472881.9293,1782982.1**<5**BM13 Invoice Accuracy (%)
**<5**3,112103.04,656233.3138,146162.44BM12 Distribution Costs (% of sales value) (%)
510,000540.7302,7572548.0288,5773347.6**<5**BM11 Order to Delivery Cycle Time (hours)
528,8921493.2305,642113.6288,540273.6**<5**BM10 On-Shelf/Point-of-Sale Out-of-Stocks (%)
**<5**3,028721.14,6592218.1**<5**BM09 Retail Store Inventory Cover (days)
**<5**3,114916.44,6902514.7**<5**BM08 Retail Distribution Centre Inventory Cover (days)
514,52414187.3302,7792988.5297,9936584.2387,7372486.0BM04 On-Time Delivery (%)
**<5**3,1612394.74,6062896.2**<5**BM03 Store Service Level / Unit Fill Rate (%)
510,000591.7302,7772690.5297,6332787.4**<5**BM02 Supplier Service Level / Unit Fill Rate (%)
546,6861451.5305,749197.1289,494693.5**<5**BM01 Annual Sales Growth Rate (%)
Total revenue (millions of
US$)
Sample Size
Weighted average
Total revenue (millions of
US$)
Sample Size
Weighted average
Total revenue (millions of US$)
Sample Size
Weighted average
Total revenue (millions of
US$)
Sample Size
Weighted average

© 2011 IBM Corporation40
Consumer Products Retailers and Wholesalers North American Results for Implementation Measures (Revenue-weighted Averages)
Total revenue
(millions of US$)
Sample Size
Weighted average
Total revenue (millions of
US$)
Sample Size
Weighted average
Total revenue (millions of
US$)
Sample Size
Weighted average
Total revenue (millions of
US$)
Sample Size
Weighted average
2010200920082007
Consumer Products Retailers & Wholesalers – North Am erica
122,8591318.9341,9002633418,9272202.3380,6191994.7IM12 % of active SKUs where the master data has been synchronized via GDSN
122,8591319.3341,4934053.5418,92621927.4406,82220818.8IM10 % of sales with synchronized master data between trading partners via GDSN
546,70215374.5341,9082688.6135,05622042.9424,67920459.3IM09 % of shipments for which a receiving advice was transacted via EDI
547,44116176.6341,9242788.9135,05622037.7443,17920639.7IM08 % of shipments for which a despatch advice was transmitted via EDI
547,44116195.9341,4683896.7418,94222192.2443,76321385.7IM07 % of invoices transacted via EDI
547,38116095.1341,9294194.0418,94222093.5438,24821191.3IM06 % of orders transacted via EDI
546,04215179.5341,4944088.7418,94222175.0409,59919763.3IM05 % of shipping or receiving locations that have been allocated a GLN
531,79116281.1341,4944088.7418,94222169.3410,83819874.7IM04 % of pallets/unit loads labeled with SSCC
548,02116599.4349,3484598.6390,0328894.2413,72221088.1IM02 % of cases/cartons/inners allocated a GTIN
547,97116499.4349,3944598.8390,0328899.1443,74421698.8IM01 % of consumer units allocated a GTIN

© 2010 IBM Corporation
CP Manufacturers, Retailers and Wholesalers - Europe
© 2011 IBM Corporation42
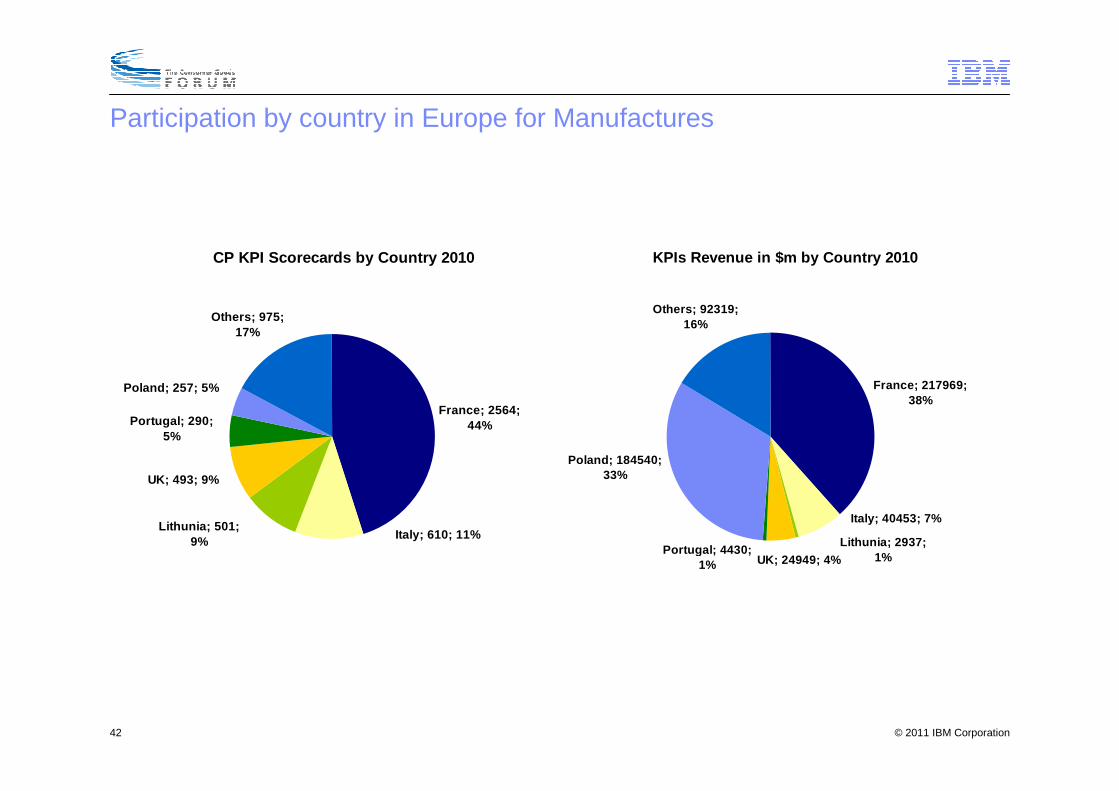
Participation by country in Europe for Manufactures
CP KPI Scorecards by Country 2010
France; 2564; 44%
Italy; 610; 11%Lithunia; 501;
9%
UK; 493; 9%
Portugal; 290; 5%
Poland; 257; 5%
Others; 975; 17%
KPIs Revenue in $m by Country 2010
France; 217969; 38%
Portugal; 4430; 1% UK; 24949; 4%
Lithunia; 2937; 1%
Italy; 40453; 7%
Poland; 184540; 33%
Others; 92319; 16%

© 2011 IBM Corporation43
Participation by country in Europe for Retailers and Wholesalers
CP KPI Scorecards by Country 2010
UK; 252; 24%
France; 157; 15%
Others; 535; 50%
Poland; 117; 11%
KPIs Revenue in $m by Country Sector 2010
Poland; 250977; 53%
Others; 201067; 42%
France; 11192; 2%
UK; 14079; 3%
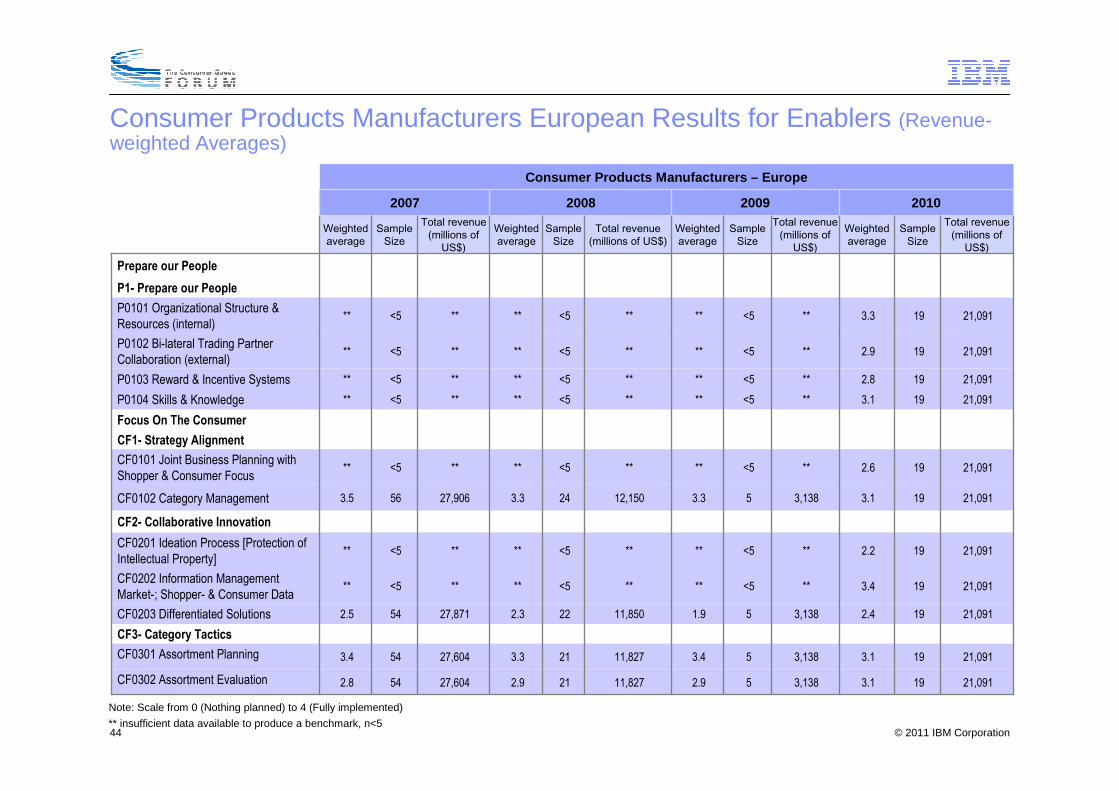
© 2011 IBM Corporation44
21,091193.13,13853.411,827213.327,604543.4CF0301 Assortment Planning
201020092008
Consumer Products Manufacturers – Europe
2007
21,091193.13,13852.911,827212.927,604542.8CF0302 Assortment Evaluation
CF3- Category Tactics
21,091192.43,13851.911,850222.327,871542.5CF0203 Differentiated Solutions
21,091193.4**<5****<5****<5**CF0202 Information Management Market-; Shopper- & Consumer Data
21,091192.2**<5****<5****<5**CF0201 Ideation Process [Protection of Intellectual Property]
CF2- Collaborative Innovation
21,091193.13,13853.312,150243.327,906563.5CF0102 Category Management
21,091192.6**<5****<5****<5**CF0101 Joint Business Planning with Shopper & Consumer Focus
CF1- Strategy Alignment
Focus On The Consumer
21,091193.1**<5****<5****<5**P0104 Skills & Knowledge
21,091192.8**<5****<5****<5**P0103 Reward & Incentive Systems
21,091192.9**<5****<5****<5**P0102 Bi-lateral Trading Partner Collaboration (external)
21,091193.3**<5****<5****<5**P0101 Organizational Structure & Resources (internal)
P1- Prepare our People
Prepare our People
Total revenue (millions of
US$)
Sample Size
Weighted average
Total revenue (millions of
US$)
Sample Size
Weighted average
Total revenue (millions of US$)
Sample Size
Weighted average
Total revenue (millions of
US$)
Sample Size
Weighted average
** insufficient data available to produce a benchmark, n<5
Note: Scale from 0 (Nothing planned) to 4 (Fully implemented)
Consumer Products Manufacturers European Results for Enablers (Revenue-weighted Averages)

© 2011 IBM Corporation45
Consumer Products Manufacturers European Results for Business Measures (Revenue-weighted Averages)
Consumer Products Manufacturers – Europe
52,5786295.143,2245696.142,4207994.457,44110894.7BM13 Invoice Accuracy (%)
49,701615.843,343645.547,262925.963,6271356.3BM12 Distribution Costs (% of sales value) (%)
53,0326456.647,1856964.552,63310466.574,39117269.0BM11 Order to Delivery Cycle Time (hours)
30,537275.527,221255.232,231427.835,042545.1BM10 On-Shelf/Point-of-Sale Out-of-Stocks (%)
53,3236331.045,8136732.052,93510037.264,52511632.3BM07 Manufacturer/Supplier's Finished Goods Inventory Cover (days)
33,3063319.828,5872620.238,0074423.345,4725924.2BM06 Raw Materials Inventory Cover (days)
47,9926196.438,9644894.442,9887795.157,58313794.1BM04 On-Time Delivery (%)
32,6993496.222,4422897.923,1913796.832,7124995.5BM03 Store Service Level / Unit Fill Rate (%)
54,0696697.448,7027497.652,55310697.667,76812196.4BM02 Supplier Service Level / Unit Fill Rate to Customer Distribution Centre (%)
52,516653.641,590670.437,477705.357,3501294.9BM01 Annual Sales Growth Rate (%)
Total revenue
(millions of US$)
Sample Size
Weighted average
Total revenue (millions of
US$)
Sample Size
Weighted average
Total revenue (millions of
US$)
Sample Size
Weighted average
Total revenue (millions of
US$)
Sample Size
Weighted average
2010200920082007

© 2011 IBM Corporation46
Consumer Products Manufacturers European Results for Implementation Measures (Revenue-weighted Averages)
Consumer Products Manufacturers – Europe
183,548169956.3227,791164560.8174,816101539.890,05144355.5IM13 % of GTINs that are catalogued consistently with a GS1 Global Product Classification brick code
254,267257116.2209,888164916.2137,4939515.6109,28510738.6IM10 % of sales with synchronized master data between trading partners via GDSN
177,164121432.2208,952159814.6199,91912994.7127,71311084.4IM09 % of shipments for which a receiving advice was transacted via EDI
503,270351631.7377,841253132.8198,219131624.9131,383109325.6IM08 % of shipments for which a despatch advice was transmitted via EDI
536,717528535.9373,035259337.4218,275136233.2133,705111345.3IM07 % of invoices transacted via EDI
554,632531750.7405,704281943.6202,955138545.3135,699110249.5IM06 % of orders transacted via EDI
529,585466155.9482,224304053.4228,458143368.2145,690112269.7IM05 % of shipping or receiving locations that have been allocated a GLN
540,147489052.6451,890249073.8217,946127462.4149,196114473.3IM04 % of pallets/unit loads labeled with SSCC
463,930489666.1427,410220183.5207,000136280.8111,674105787.9IM02 % of cases/cartons/inners allocated a GTIN
530,012544487.0534,278361688.4219,933144993.1111,38697697.8IM01 % of consumer units allocated a GTIN
Total revenue (millions of
US$)
Sample Size
Weighted average
Total revenue (millions of
US$)Sample
SizeWeighted average
Total revenue (millions of
US$)
Sample Size
Weighted average
Total revenue (millions of
US$)
Sample Size
Weighted average
2010200920082007

© 2011 IBM Corporation47
**<5****<5****<5**39,235122.7CF0301 Assortment Planning
201020092008
Consumer Products Retailers & Wholesalers – Europe
2007
**<5****<5****<5**39,235122.6CF0302 Assortment Evaluation
CF3- Category Tactics
**<5****<5****<5**39,235122.3CF0203 Differentiated Solutions
**<5****<5****<5****<5**CF0202 Information Management Market-; Shopper- & Consumer Data
**<5****<5****<5****<5**CF0201 Ideation Process [Protection of Intellectual Property]
CF2- Collaborative Innovation
**<5****<5****<5**87,039133.5CF0102 Category Management
**<5****<5****<5****<5**CF0101 Joint Business Planning with Shopper & Consumer Focus
CF1- Strategy Alignment
Focus On The Consumer
**<5****<5****<5****<5**P0104 Skills & Knowledge
**<5****<5****<5****<5**P0103 Reward & Incentive Systems
**<5****<5****<5****<5**P0102 Bi-lateral Trading Partner Collaboration (external)
**<5****<5****<5****<5**P0101 Organizational Structure & Resources (internal)
P1- Prepare our People
Prepare our People
Total revenue (millions of
US$)
Sample Size
Weighted average
Total revenue (millions of
US$)
Sample Size
Weighted average
Total revenue (millions of US$)
Sample Size
Weighted average
Total revenue (millions of
US$)
Sample Size
Weighted average
** insufficient data available to produce a benchmark, n<5
Note: Scale from 0 (Nothing planned) to 4 (Fully implemented)
Consumer Products Retailers and Wholesalers European Results forEnablers (Revenue-weighted Averages)

© 2011 IBM Corporation48
Consumer Products Retailers and Wholesalers European Results forBusiness Measures (Revenue-weighted Averages)
Consumer Products Retailers & Wholesalers – Europe
2010200920082007
45,4241987.3**<5**149,3823984.9201,3715088.8BM13 Invoice Accuracy (%)
51,918233.5**<5**137,753374.2154,852424.0BM12 Distribution Costs (% of sales value) (%)
44,3142089.728,2321549.9158,4544745.8179,3626050.1BM11 Order to Delivery Cycle Time (hours)
44,314201.9**<5**145,618376.7197,420474.6BM10 On-Shelf/Point-of-Sale Out-of-Stocks (%)
44,3142030.327,7831462.0169,6445032.5215,1935822.9BM09 Retail Store Inventory Cover (days)
36,8201933.0**<5**136,1123424.6195,6634317.0BM08 Retail Distribution Centre Inventory Cover (days)
44,3142084.828,2321586.9169,0274988.9178,3735991.5BM04 On-Time Delivery (%)
44,3142090.928,2321585.3173,1445191.2187,3255792.3BM03 Store Service Level / Unit Fill Rate (%)
27,423993.3**<5**144,9183693.4165,7304194.6BM02 Supplier Service Level / Unit Fill Rate to Customer Distribution Centre (%)
66,038240.428,23215-2.3123,571474.8222,997655.1BM01 Annual Sales Growth Rate (%)
Total revenue (millions of
US$)
Sample Size
Weighted average
Total revenue (millions of
US$)
Sample Size
Weighted average
Total revenue (millions of
US$)
Sample Size
Weighted average
Total revenue (millions of
US$)
Sample Size
Weighted average
** insufficient data available to produce a benchmark, n<5

© 2011 IBM Corporation49
Consumer Products Retailers and Wholesalers European Results forImplementation Measures (Revenue-weighted Averages)
Consumer Products Retailers & Wholesalers – Europe
2010200920082007
151,85119710.4114,91710610.3167,431570.7265,954721.2IM10 % of sales with synchronized master data between trading partners via the GDSN
144,22413528.0242,80936216.8272,2242686.3302,404933.4IM09 % of shipments for which a receiving advice was transacted via EDI
459,68488048.2294,73247529.1257,90727425.3299,8049623.7IM08 % of shipments for which a despatch advice was transmitted via EDI
471,320101164.2360,17549762.0323,84633158.8377,47410464.6IM07 % of invoices transacted via EDI
467,304102368.7310,52651154.8299,89032657.8329,99510368.5IM06 % of orders transacted via EDI
449,53373177.0382,89334186.3360,26147388.7386,35511384.7IM05 % of shipping or receiving locations that have been allocated a GLN
342,20589147.1297,38334850.5299,08827035.1309,9428541.7IM04 % of pallets/unit loads labeled with SSCC
434,40786479.7306,49943272.2302,53236277.9318,2039081.6IM02 % of cases/cartons/inners allocated a GTIN
471,409101694.9369,27058494.2369,23042195.4386,87511496.9IM01 % of consumer units allocated a GTIN
Total revenue (millions of
US$)
Sample Size
Weighted average
Total revenue (millions of
US$)
Sample Size
Weighted average
Total revenue (millions of
US$)
Sample Size
Weighted average
Total revenue (millions of
US$)
Sample Size
Weighted average
© 2010 IBM Corporation
CP Manufacturers - South America
© 2011 IBM Corporation51
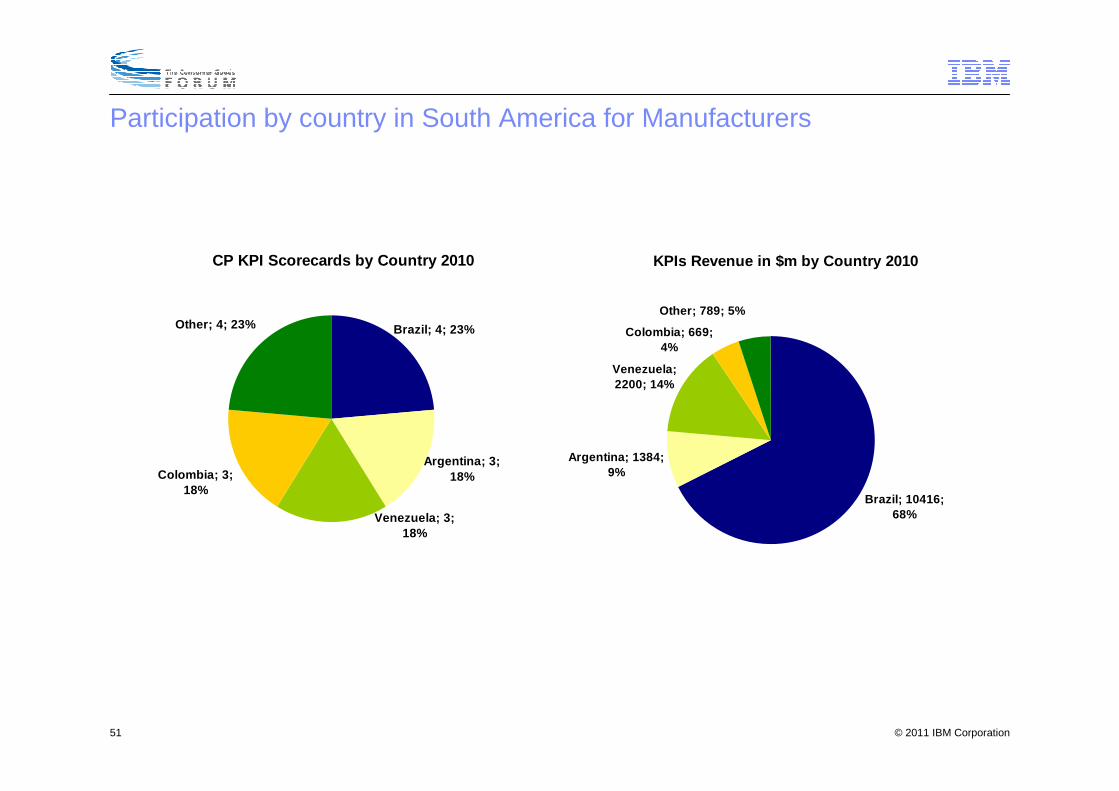
Participation by country in South America for Manufacturers
CP KPI Scorecards by Country 2010
Other; 4; 23%
Colombia; 3; 18%
Argentina; 3; 18%
Brazil; 4; 23%
Venezuela; 3; 18%
KPIs Revenue in $m by Country 2010
Brazil; 10416; 68%
Argentina; 1384; 9%
Venezuela; 2200; 14%
Colombia; 669; 4%
Other; 789; 5%

© 2011 IBM Corporation52
4,51753.3**<5****<5****<5**CF0301 Assortment Planning
201020092008
Consumer Products Manufacturers – South America
2007
4,51753.1**<5****<5****<5**CF0302 Assortment Evaluation
CF3- Category Tactics
4,51751.9**<5****<5****<5**CF0203 Differentiated Solutions
4,51753.4**<5****<5****<5**CF0202 Information Management Market-; Shopper- & Consumer Data
4,51753.4**<5****<5****<5**CF0201 Ideation Process [Protection of Intellectual Property]
CF2- Collaborative Innovation
4,51752.9**<5****<5****<5**CF0102 Category Management
4,51753.2**<5****<5****<5**CF0101 Joint Business Planning with Shopper & Consumer Focus
CF1- Strategy Alignment
Focus On The Consumer
4,51753.3**<5****<5****<5**P0104 Skills & Knowledge
4,51753.4**<5****<5****<5**P0103 Reward & Incentive Systems
4,51752.3**<5****<5****<5**P0102 Bi-lateral Trading Partner Collaboration (external)
4,51753.6**<5****<5****<5**P0101 Organizational Structure & Resources (internal)
P1- Prepare our People
Prepare our People
Total revenue (millions of
US$)
Sample Size
Weighted average
Total revenue (millions of
US$)
Sample Size
Weighted average
Total revenue (millions of US$)
Sample Size
Weighted average
Total revenue (millions of
US$)
Sample Size
Weighted average
** insufficient data available to produce a benchmark, n<5
Note: Scale from 0 (Nothing planned) to 4 (Fully implemented)
Consumer Products Manufacturers South American Results for Enablers (Revenue-weighted Averages)

© 2011 IBM Corporation53
Consumer Products Manufacturers – South America
2010200920082007
**<5****<5****<5****<5**BM14 Retail shrinkage rate (%)
4,056896.26,478996.26,075692.73,832793.5BM13 Invoice Accuracy (%)
15,457176.613,934216.99,467187.38,678107.6BM12 Distribution Costs (% of sales value) (%)
15,3071677.712,2921177.98,533973.49,1101560.5BM11 Order to Delivery Cycle Time (hours)
8,1211110.37,2041013.84,846810.18,702108.5BM10 On-Shelf/Point-of-Sale Out-of-Stocks (%)
14,1401434.113,3782040.29,4671835.28,8171427.6BM07 Manufacturer/Supplier's Finished Goods Inventory Cover (days)
12,2621221.511,5471327.48,2931327.58,436914.5BM06 Raw Materials Inventory Cover (days)
9,1911490.09,3922087.94,846883.29,1081785.1BM04 On-Time Delivery (%)
**<5**9,060794.05,282593.9874592.3BM03 Store Service Level / Unit Fill Rate (%)
15,4571792.413,9342194.69,4671893.58,8821692.8BM02 Supplier Service Level / Unit Fill Rate to Customer Distribution Centre (%)
15,4571711.513,9342117.88,533914.95,6791010.7BM01 Annual Sales Growth Rate (%)
Total revenue (millions of
US$)
Sample Size
Weighted average
Total revenue (millions of
US$)
Sample Size
Weighted average
Total revenue (millions of
US$)
Sample Size
Weighted average
Total revenue (millions of
US$)
Sample Size
Weighted average
Consumer Products Manufacturers South American Results for Business Measures (Revenue-weighted Averages)
** insufficient data available to produce a benchmark, n<5

© 2011 IBM Corporation54
Consumer Products Manufacturers South American Results for Implementation Measures (Revenue-weighted Averages)
Consumer Products Manufacturers – South America
2010200920082007
15,4571737.213,9342136.312,3211942.96,4571074.5IM13 % of GTINs that are catalogued consistently with a GS1 Global Product Classification brick code
15,457174.713,934213.29,467181.913,9351715.5IM10 % of sales with synchronized master data between trading partners via GDSN
15,457170.113,934216.19,467181.315,1921931.9IM09 % of shipments for which a receiving advice was transacted via EDI
15,457170.613,934219.29,467186.115,1921938.3IM08 % of shipments for which a despatch advice was transmitted via EDI
15,4571753.713,9342145.712,3211930.015,19219317.6IM07 % of invoices transacted via EDI
15,4571767.713,9342160.012,3211938.215,19219336.2IM06 % of orders transacted via EDI
15,1841671.613,9342176.812,3211983.918,19019458IM05 % of shipping or receiving locations that have been allocated a GLN
14,8471545.113,9342116.812,3211964.018,17619345.0IM04 % of pallets/unit loads labeled with SSCC
15,4571798.513,9342198.712,3211998.018,19019480.2IM02 % of cases/cartons/inners allocated a GLN
15,45717100.013,9342110012,3211999.718,19019481.9IM01 % of consumer units allocated a GTIN
Total revenue (millions of
US$)
Sample Size
Weighted average
Total revenue (millions of
US$)
Sample Size
Weighted average
Total revenue (millions of US$)
Sample Size
Weighted average
Total revenue (millions of
US$)
Sample Size
Weighted average

© 2010 IBM Corporation
CP Manufacturers - Asia
© 2011 IBM Corporation56
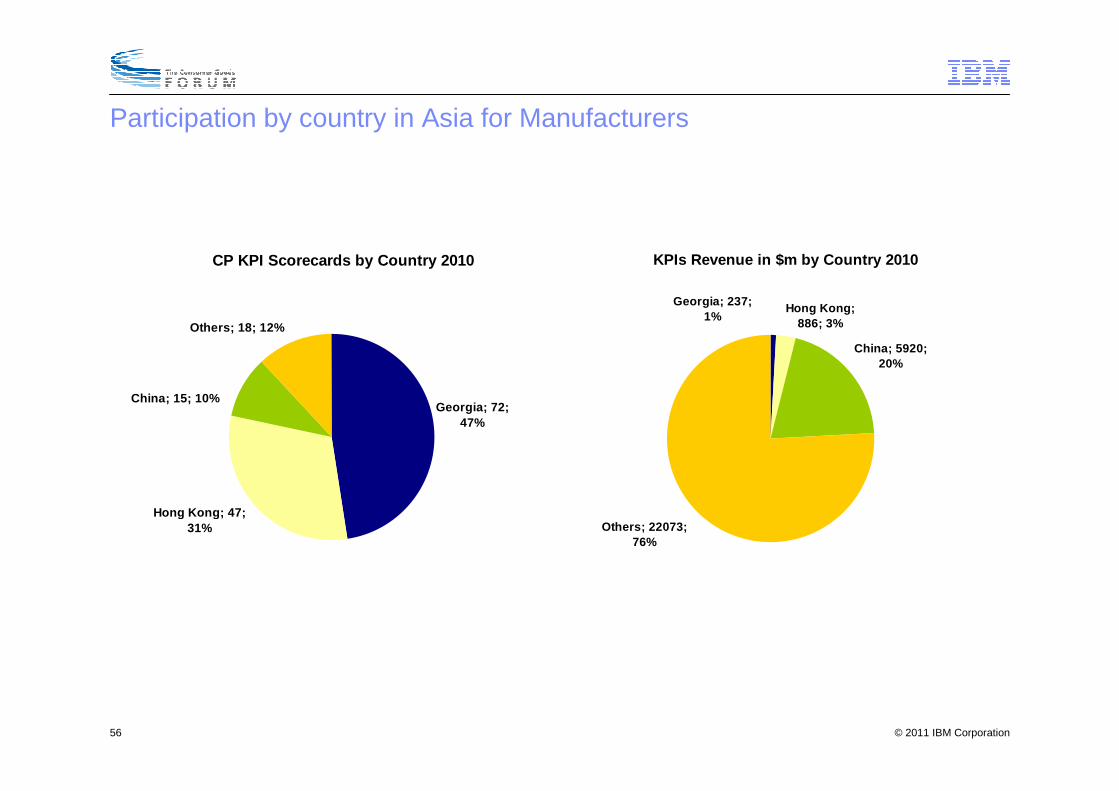
Participation by country in Asia for Manufacturers
CP KPI Scorecards by Country 2010
Others; 18; 12%
Hong Kong; 47; 31%
Georgia; 72; 47%
China; 15; 10%
KPIs Revenue in $m by Country 2010
China; 5920; 20%
Hong Kong; 886; 3%
Georgia; 237; 1%
Others; 22073; 76%
© 2011 IBM Corporation57
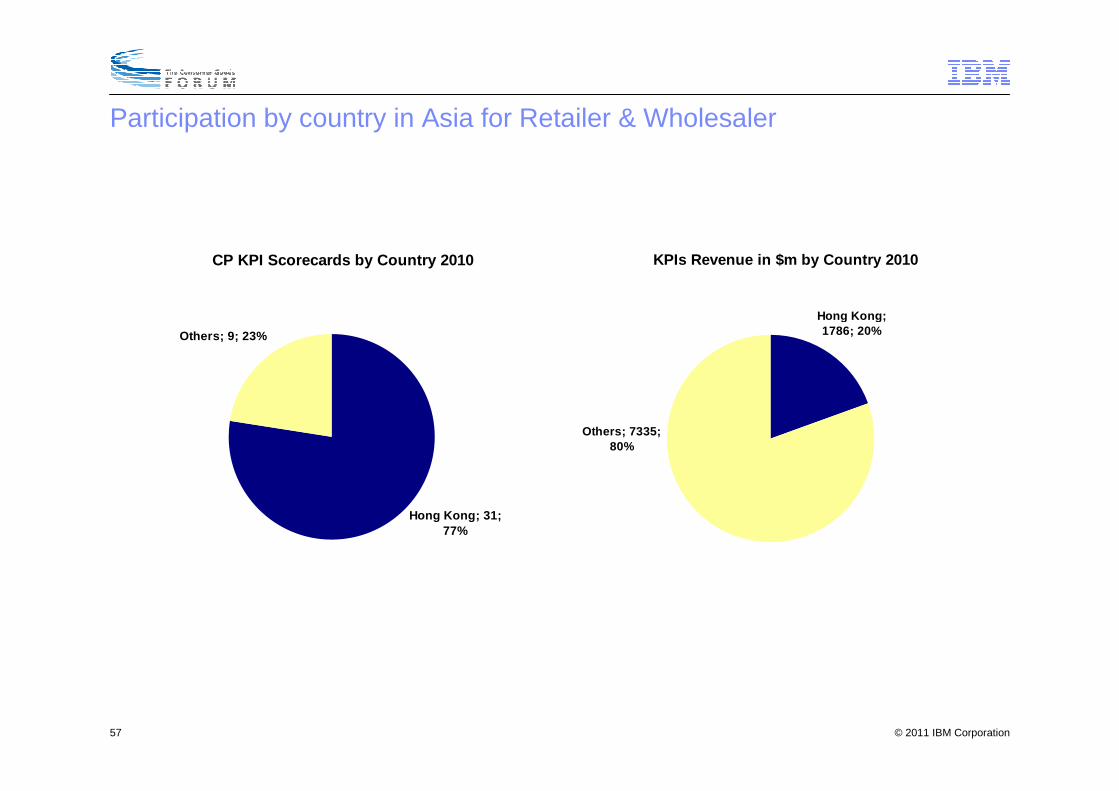
Participation by country in Asia for Retailer & Wholesaler
CP KPI Scorecards by Country 2010
Others; 9; 23%
Hong Kong; 31; 77%
KPIs Revenue in $m by Country 2010
Others; 7335; 80%
Hong Kong; 1786; 20%

© 2011 IBM Corporation58
Consumer Products Manufacturers Asian Results for Business Measures (Revenue-weighted Averages)
** insufficient data available to produce a benchmark, n<5
Consumer Products Manufacturers – Asia
2010200920082007
24,6761399.518,8442098.733,0062699.716,9321798.6BM13 Invoice Accuracy (%)
27,502174.420,932215.334,666273.923,713224.8BM12 Distribution Costs (% of sales value) (%)
27,0271623.721,5812231.035,7862926.423,7122323.2BM11 Order to Delivery Cycle Time (hours)
23,45761.24,72994.68,121122.99,74894.1BM10 On-Shelf/Point-of-Sale Out-of-Stocks (%)
27,1561633.014,0812139.630,6872626.723,5922028.3BM07 Manufacturer/Supplier's Finished Goods Inventory Cover (days)
26,0431026.212,9421518.328,1931720.818,9261720.6BM06 Raw Materials Inventory Cover (days)
27,4881699.121,5812298.820,6652798.019,8572096.3BM04 On-Time Delivery (%)
24,9771198.410,0321097.32,265996.92,077795.6BM03 Store Service Level / Unit Fill Rate (%)
27,5721898.120,9652298.825,4792897.019,7021895.5BM02 Supplier Service Level / Unit Fill Rate to Customer Distribution Centre (%)
27,572195.421,61423-0.434,202182.722,962215.5BM01 Annual Sales Growth Rate (%)
Total revenue (millions of
US$)
Sample Size
Weighted average
Total revenue (millions of
US$)
Sample Size
Weighted average
Total revenue (millions of
US$)
Sample Size
Weighted average
Total revenue (millions of
US$)
Sample Size
Weighted average

© 2011 IBM Corporation59
Consumer Products Manufacturers Asian Results for ImplementationMeasures (Revenue-weighted Averages)
Consumer Products Manufacturers – Asia
2010200920082007
27,5721812.721,261222.037,748459.893,407456.9IM13 % of GTINs that are catalogued consistently with a GS1 Global Product Classification brick code
27,272170.621,61423037,748450.693,407451.0IM10 % of sales with synchronized master data between trading partners via GDSN
27,572181.611,880210.837,748450.189,607441.5IM09 % of shipments for which a receiving advice was transacted via EDI
29,0241504.719,380226.737,748450.893,407453.0IM08 % of shipments for which a despatch advice was transmitted via EDI
29,0241509.421,6142315.637,748454.693,407454.1IM07 % of invoices transacted via EDI
29,02415023.921,2612225.637,748458.190,742455.3IM06 % of orders transacted via EDI
29,00513817.021,6142313.137,748456.293,407452.9IM05 % of shipping or receiving locations that have been allocated a GLN
28,46413812.321,614239.237,748452.591,490442.2IM04 % of pallets/unit loads labeled with SSCC
28,91913095.721,6142398.037,7484575.095,7624855.8IM02 % of cases/cartons/inners allocated a GTIN
29,07414899.321,6142310037,7484596.995,7624899.0IM01 % of consumer units allocated a GTIN
Total revenue (millions of
US$)
Sample Size
Weighted average
Total revenue (millions of US$)Sample
SizeWeighted average
Total revenue (millions of
US$)
Sample Size
Weighted average
Total revenue (millions of
US$)
Sample Size
Weighted average

© 2011 IBM Corporation60
Consumer Products Retailer & Wholesaler Asian Results for Business Measures (Revenue-weighted Averages)
** insufficient data available to produce a benchmark, n<5
Consumer Products Manufacturers – Asia
2010200920082007
8,7171088.6******58,4701398.516,2881397.4BM13 Invoice Accuracy (%)
8,717102.2******85,776184.29,88162.2BM12 Distribution Costs (% of sales value) (%)
8,665958.8******54,3171318.711,649757.8BM11 Order to Delivery Cycle Time (hours)
7,57475.0******23,323103.416,288134.0BM10 On-Shelf/Point-of-Sale Out-of-Stocks (%)
**<5**********<5****<5**BM07 Manufacturer/Supplier's Finished Goods Inventory Cover (days)
**<5**********<5****<5**BM06 Raw Materials Inventory Cover (days)
8,665987.5******56,8231397.811,649794.5BM04 On-Time Delivery (%)
8,665986.9******78,0021596.49,881693.8BM03 Store Service Level / Unit Fill Rate (%)
6,064584.4******77,8471796.315,6041190.6BM02 Supplier Service Level / Unit Fill Rate to Customer Distribution Centre (%)
8,7171011.4******87,990183.553,833149.1BM01 Annual Sales Growth Rate (%)
Total revenue (millions of
US$)
Sample Size
Weighted average
Total revenue (millions of
US$)
Sample Size
Weighted average
Total revenue (millions of
US$)
Sample Size
Weighted average
Total revenue (millions of
US$)
Sample Size
Weighted average

© 2011 IBM Corporation61
Consumer Products Retailer & Wholesaler Asian Results for Implementation Measures (Revenue-weighted Averages)
Consumer Products Manufacturers – Asia
2010200920082007
**<5**********<5****<5**IM13 % of GTINs that are catalogued consistently with a GS1 Global Product Classification brick code
8,717100.0******46,062960.0171,8381840.1IM10 % of sales with synchronized master data between trading partners via GDSN
8,7171017.8******88,443 1011.0167,4371793.5IM09 % of shipments for which a receiving advice was transacted via EDI
9,121400.0******88,443 1010.9168,6671795.7IM08 % of shipments for which a despatch advice was transmitted via EDI
9,1214032.0******88,443 1010.7171,8381843.9IM07 % of invoices transacted via EDI
9,1214035.9******88,443 1014.6157,1901826.7IM06 % of orders transacted via EDI
9,119375.5******88,443 10113.8171,97818321.8IM05 % of shipping or receiving locations that have been allocated a GLN
5,545300.1******88,443 1010.1171,96018212.5IM04 % of pallets/unit loads labeled with SSCC
8,7743557.3******88,443 10139.8141,87414636.5IM02 % of cases/cartons/inners allocated a GTIN
9,1213979.7******88,44310196.1152,58917857.9IM01 % of consumer units allocated a GTIN
Total revenue (millions of
US$)
Sample Size
Weighted average
Total revenue (millions of US$)Sample
SizeWeighted average
Total revenue (millions of
US$)
Sample Size
Weighted average
Total revenue (millions of
US$)
Sample Size
Weighted average
** insufficient data available to produce a benchmark, n<5
© 2011 IBM Corporation62
For additional insights about the global scorecard, please visit globalscorecard.net: There are several documents available:
•The executive report (W hite paper)
•Details on the findings of the survey
For further information please contact Rüdiger Hagedorn, CGF ([email protected]) or David McCarty, IBM ([email protected]).

© 2011 IBM Corporation63
Trademarks and notes
©IBM Corporation 2012
� IBM, the IBM logo, and ibm.com are trademarks or registered trademarks of International Business Machines Corporation in the United States, other countries, or both. If these and other IBM trademarked terms are marked on their first occurrence in this information with the appropriate symbol (®or ™), these symbols indicate US registered or common law trademarks owned by IBM at the time this information was published. Such trademarks may also be registered or common law trademarks in other countries. A current list of IBM trademarks is available on the web at “Copyright and trademark information” at www.ibm.com/legal/copytrade.shtml.
� Other company, product and service names may be trademarks or service marks of others.
� References in this publication to IBM products or services do not imply that IBM intends to make them available in all countries in which IBM operates.