Embed Size (px)
Citation preview
Global compilation of interferometric syntheticaperture radar earthquake source models:1. Comparisons with seismic catalogs
J. Weston,1 A. M. G. Ferreira,1,2 and G. J. Funning3
Received 30 November 2010; revised 10 April 2011; accepted 12 May 2011; published 25 August 2011.
[1] While many earthquakes have now been studied using interferometric syntheticaperture radar (InSAR) data, a full assessment of the quality and additional value ofInSAR source parameters compared to seismological techniques is still lacking. Wecompile a catalog of source models obtained using InSAR and estimate the correspondingcentroid moment tensor (CMT) parameters; we refer to this compilation as the ICMTarchive. We compare source parameters from over 70 InSAR studies of 57 globalearthquakes with those in the Global CMT (GCMT), International Seismological Centre(ISC) and Engdahl‐Hilst‐Buland (EHB) seismic catalogs. We find an overall goodagreement between fault strike, dip and rake values in the GCMT and ICMT archives.Likewise, the differences in seismic moment between these two archives are relativelysmall, and we do not find support for previously suggested trends of InSAR leading tolarger moments than seismic data. However, epicentral locations show substantialdiscrepancies, which are larger for the GCMT (median differences of ∼21 km) than for theEHB and ISC catalogs (median differences of ∼10 km). Since InSAR data have a highspatial resolution, and thus should map epicentral locations accurately, this allows us toobtain a first independent estimate of epicentral location errors in the seismic catalogs.Earthquake depths from InSAR are systematically shallower than those in the EHBcatalog, with a median of differences of ∼5 km. While this trend may be partly due tounmodeled crustal complexity, it is also compatible with the observation that the rupture ofcrustal earthquakes tends to propagate upward in the seismogenic layer.
Citation: Weston, J., A. M. G. Ferreira, and G. J. Funning (2011), Global compilation of interferometric synthetic aperture radarearthquake source models: 1. Comparisons with seismic catalogs, J. Geophys. Res., 116, B08408, doi:10.1029/2010JB008131.
1. Introduction
[2] The launch of the European Space Agency satelliteERS‐1 in 1991 heralded the beginning of an era of globalcoverage of synthetic aperture radar (SAR) observations. Asgeodesists learned how to exploit this data source andadditional SAR satellites were launched by multiple agen-cies, an alternative, nonseismological, method for the studyof shallow earthquakes was established.[3] The phase of a radar signal is a function of the distance
between the radar antenna (in this case, the satellite) and theradar target (in this case, the ground). Therefore, bydifferencing the phase of SAR images acquired at differenttimes we can in principle detect changes in that distance thatare due to the movement of the ground toward or away from
the satellite between acquisitions. If one SAR image isacquired before, and another after, an earthquake, a fineresolution map of the surface deformation due to that earth-quake can be generated. This technique is known as inter-ferometric SAR (InSAR). Elastic dislocation modeling of thesurface displacements measured by InSAR can then be usedto estimate the source parameters of the earthquake, inde-pendent of any information from seismology (for a review,see, e.g., Feigl [2002]).[4] Since the breakthrough study of the 1992 Landers
earthquake [Massonnet et al., 1994], over 60 earthquakes havebeen studied with InSAR, spanning a range of magnitudesfrom 4.4 to 8.5. The number of events is such that it is nowpossible to make statistically significant comparisons betweensource parameters obtained by analysis of InSAR data andthose derived from teleseismic data. This study, along with thecompanion study by Ferreira et al. [2011], is the first attemptto make such a comprehensive comparison. For each eventthat we consider, one or more centroid moment tensors(CMTs) are calculated from published InSAR earthquakestudies, and compared to equivalent seismic information.[5] Various organizations routinely report earthquake
source parameters shortly after an earthquake. For example, the
1School of Environmental Sciences, University of East Anglia, Norwich,UK.
2Also at ICIST, Instituto Superior Técnico, Technical University ofLisbon, Lisbon, Portugal.
3Department of Earth Sciences, University of California, Riverside,California, USA.
Published in 2011 by the American Geophysical Union.
JOURNAL OF GEOPHYSICAL RESEARCH, VOL. 116, B08408, doi:10.1029/2010JB008131, 2011
B08408 1 of 20
Global CMT (GCMT) project has reported source parametersof moderate to large global earthquakes from 1976 to thepresent day. The GCMT method [Dziewonski et al., 1981;Dziewonski and Woodhouse, 1983a, 1983b] uses long‐periodbody and surface waveforms to estimate the origin time,location and depth of a centroid of stress glut along with thecorrespondingmomentmagnitude and seismicmoment tensor.The magnitudes and moment tensors in the GCMT catalog aregenerally considered authoritative, being extensively used in alarge range of applications from seismic hazard assessment toactive tectonic studies. Another widely used seismic catalog isthat produced by the International Seismological Center (ISC),which compiles earthquake information and bodywave arrivaltimes from over 100 organizations worldwide into a compre-hensive data set [e.g., Adams et al. 1982]. This data set is thenreprocessed and reanalyzed by the ISC, resulting in an exten-sive bulletin of hypocenters and phase readings of globalseismicity; the total number of events listed each month in theISC bulletin is several times greater than those obtained by anyother worldwide earthquake location service. TheEngdahl et al.[1998] (EHB) algorithm has been developed to improvehypocenter determinations made by the ISC and other organi-zations. Among other features, the EHBmethod uses traveltimetables from an improved Earth model, corrects for ellipticityand for lateral variations in crustal and upper mantle proper-ties and uses a new statistical procedure for the inclusion of avariety of teleseismic depth phases. This method has beenapplied to a large number of earthquakes and has resulted insignificant improvements, notably in depth determinations,which are reported in the EHB bulletin. All these catalogsrepresent considerable efforts by the seismological commu-nity and led to significant advances in geosciences. Never-theless, a current limitation is that often earthquake catalogsdo not report accurate uncertainties associated with earth-quake parameters, which, together with the general nonexis-tence of ground truth solutions, makes the assessment of thequality of the catalogs very difficult. Thus, the comparisonswith InSAR solutions that we carry out in this study constitutea novel, alternative approach to address these issues.[6] One simple, yet instructive, comparison we perform is
between the locations of earthquakes obtained throughInSAR, and those estimated by various seismic methods.Since InSAR provides an “in situ” observation of the earth-quake deformation, we should expect those locations to be themore accurate, especially in regions where seismic networksare sparse or where velocity models of the crust and uppermantle are poorly constrained. Indeed, regionally systematicpatterns of mislocation of seismically estimated earthquakecentroids and/or hypocenters when compared to InSARlocations may be one identifier of the effects of incorrectvelocity models.[7] Additionally, we compare the geometric parameters
(strike, dip, rake) of our InSAR centroid moment tensors withtheir seismic counterparts, to see if these, too have systematicdifferences. Again, such differences can be reflective ofproblems with the velocity models, but may also reflectambiguities in the InSAR studies; indeed we include modelsbased upon multiple published studies, in order to assess thelevel of model‐based uncertainty in those estimates.[8] Finally, consideration of differences in seismic moment
allow us to evaluate a hypothesis proposed around a decadeago, that InSAR data can routinely overestimate the “true”
seismic moment [e.g.,Wright et al., 1999; Feigl, 2002]. Suchoverestimates could reflect the capturing of some earlypostseismic deformation within coseismic interferograms.Our comparisons can cast light on whether such issues are, ingeneral, significant.
2. InSAR CMT (ICMT) Compilation
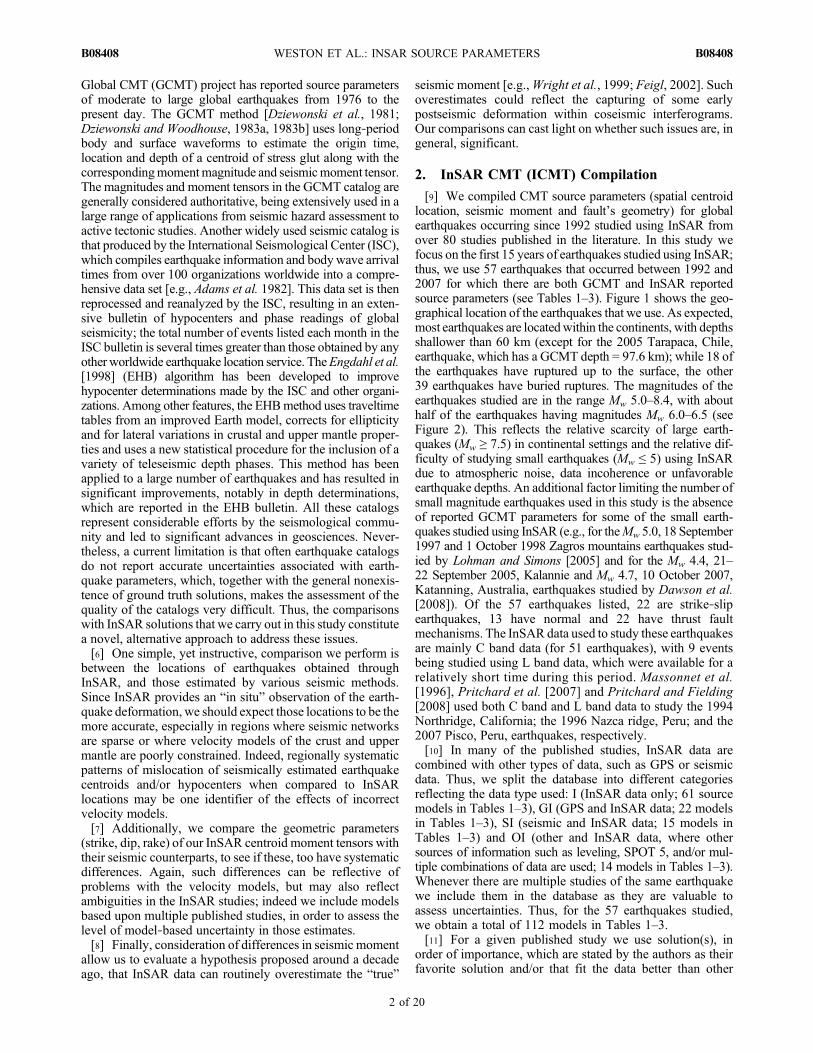
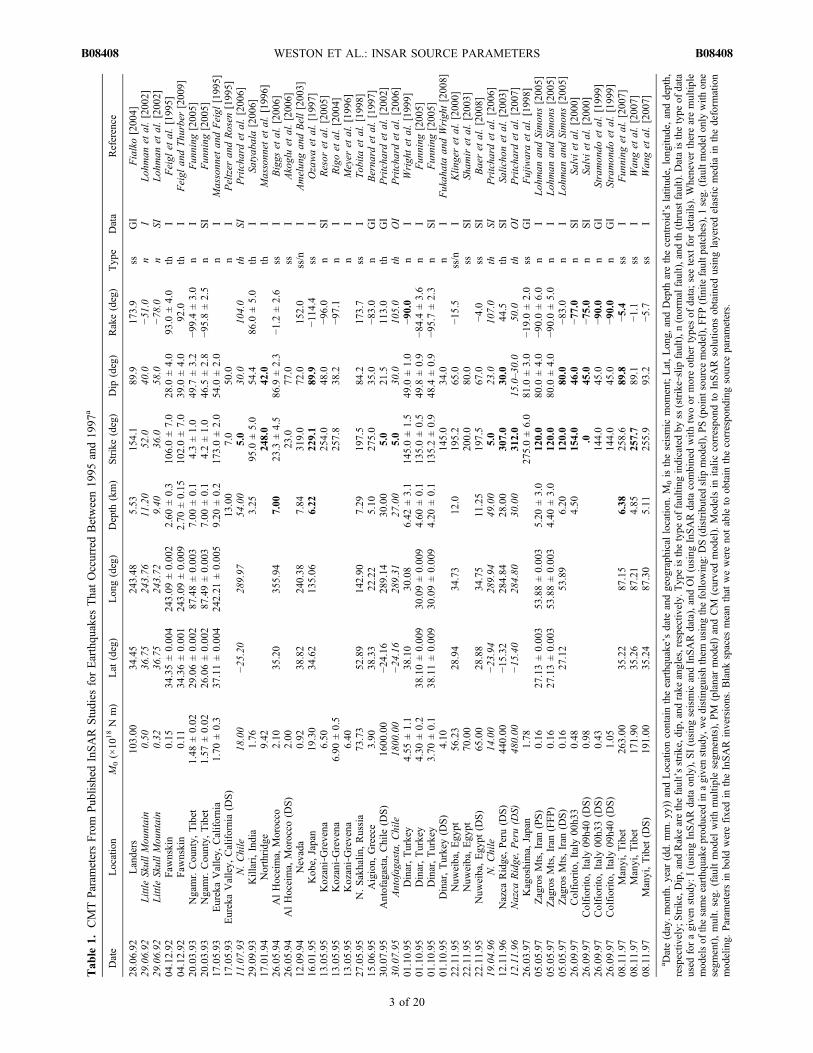
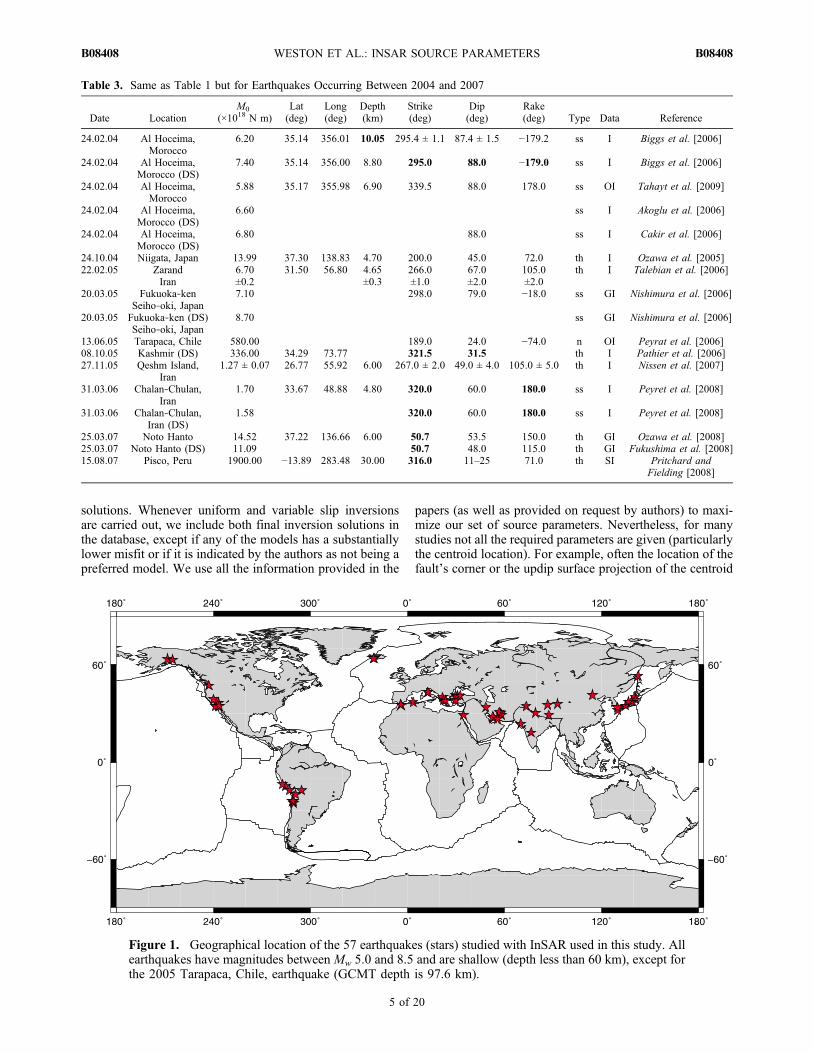
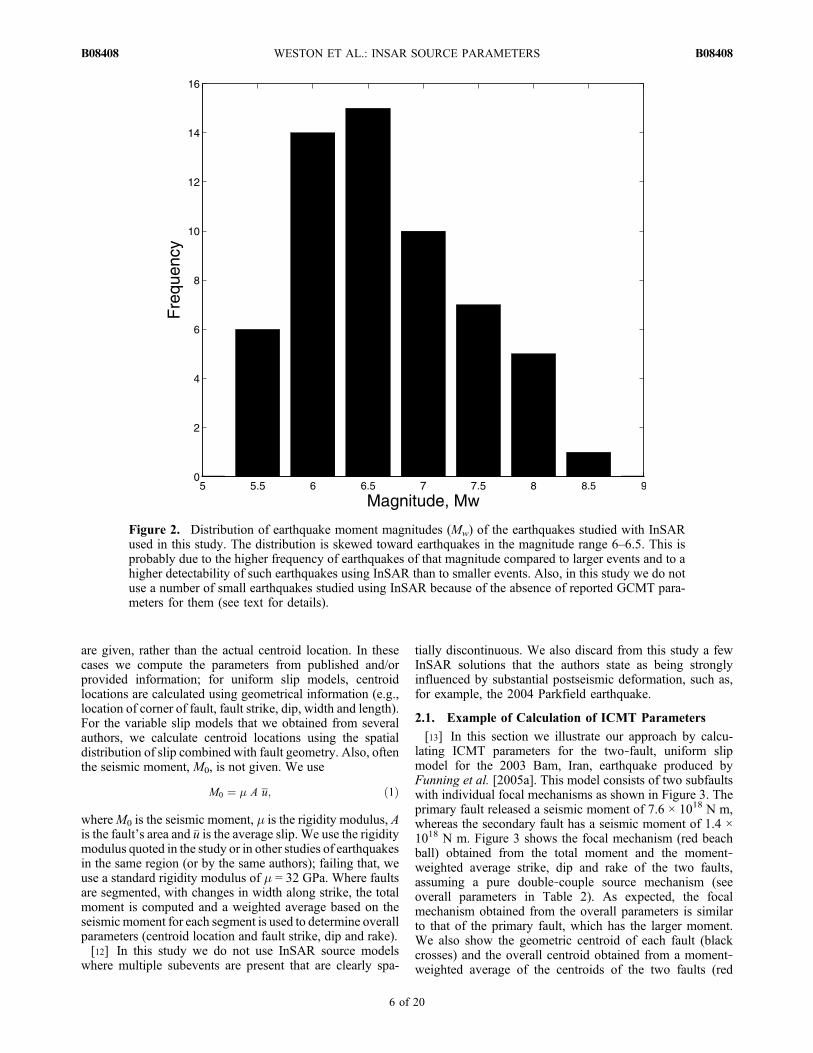
[9] We compiled CMT source parameters (spatial centroidlocation, seismic moment and fault’s geometry) for globalearthquakes occurring since 1992 studied using InSAR fromover 80 studies published in the literature. In this study wefocus on the first 15 years of earthquakes studied using InSAR;thus, we use 57 earthquakes that occurred between 1992 and2007 for which there are both GCMT and InSAR reportedsource parameters (see Tables 1–3). Figure 1 shows the geo-graphical location of the earthquakes that we use. As expected,most earthquakes are locatedwithin the continents, with depthsshallower than 60 km (except for the 2005 Tarapaca, Chile,earthquake, which has a GCMT depth = 97.6 km); while 18 ofthe earthquakes have ruptured up to the surface, the other39 earthquakes have buried ruptures. The magnitudes of theearthquakes studied are in the range Mw 5.0–8.4, with abouthalf of the earthquakes having magnitudes Mw 6.0–6.5 (seeFigure 2). This reflects the relative scarcity of large earth-quakes (Mw ≥ 7.5) in continental settings and the relative dif-ficulty of studying small earthquakes (Mw ≤ 5) using InSARdue to atmospheric noise, data incoherence or unfavorableearthquake depths. An additional factor limiting the number ofsmall magnitude earthquakes used in this study is the absenceof reported GCMT parameters for some of the small earth-quakes studied using InSAR (e.g., for theMw 5.0, 18 September1997 and 1 October 1998 Zagros mountains earthquakes stud-ied by Lohman and Simons [2005] and for the Mw 4.4, 21–22 September 2005, Kalannie and Mw 4.7, 10 October 2007,Katanning, Australia, earthquakes studied by Dawson et al.[2008]). Of the 57 earthquakes listed, 22 are strike‐slipearthquakes, 13 have normal and 22 have thrust faultmechanisms. The InSAR data used to study these earthquakesare mainly C band data (for 51 earthquakes), with 9 eventsbeing studied using L band data, which were available for arelatively short time during this period. Massonnet et al.[1996], Pritchard et al. [2007] and Pritchard and Fielding[2008] used both C band and L band data to study the 1994Northridge, California; the 1996 Nazca ridge, Peru; and the2007 Pisco, Peru, earthquakes, respectively.[10] In many of the published studies, InSAR data are
combined with other types of data, such as GPS or seismicdata. Thus, we split the database into different categoriesreflecting the data type used: I (InSAR data only; 61 sourcemodels in Tables 1–3), GI (GPS and InSAR data; 22 modelsin Tables 1–3), SI (seismic and InSAR data; 15 models inTables 1–3) and OI (other and InSAR data, where othersources of information such as leveling, SPOT 5, and/or mul-tiple combinations of data are used; 14 models in Tables 1–3).Whenever there are multiple studies of the same earthquakewe include them in the database as they are valuable toassess uncertainties. Thus, for the 57 earthquakes studied,we obtain a total of 112 models in Tables 1–3.[11] For a given published study we use solution(s), in
order of importance, which are stated by the authors as theirfavorite solution and/or that fit the data better than other
WESTON ET AL.: INSAR SOURCE PARAMETERS B08408B08408
2 of 20
Tab
le1.
CMTParam
etersFrom
Pub
lishedInSAR
Studies
forEarthqu
akes
ThatOccurredBetween19
95and19
97a
Date
Location
M0(×10
18N
m)
Lat
(deg)
Lon
g(deg)
Depth
(km)
Strike(deg)
Dip
(deg)
Rake(deg)
Typ
eData
Reference
28.06.92
Landers
103.00
34.45
243.48
5.53
154.1
89.9
173.9
ssGI
Fialko[200
4]29
.06.92
Little
SkullMou
ntain
0.50
36.75
243.76
11.20
52.0
40.0
−51
.0n
ILoh
man
etal.[200
2]29
.06.92
Little
SkullMou
ntain
0.32
36.75
243.72
9.40
36.0
58.0
−78
.0n
SILoh
man
etal.[200
2]04
.12.92
Faw
nskin
0.15
34.35±0.00
424
3.09
±0.00
22.60
±0.3
106.0±7.0
28.0
±4.0
93.0
±4.0
thI
Feigl
etal.[199
5]04
.12.92
Faw
nskin
0.11
34.36±0.00
124
3.09
±0.00
92.70
±0.15
102.0±7.0
39.0
±4.0
92.0
thI
Feigl
andThu
rber
[200
9]20
.03.93
Ngamr.Cou
nty,
Tibet
1.48
±0.02
29.06±0.00
287
.48±0.00
37.00
±0.1
4.3±1.0
49.7
±3.2
−99.4±3.0
nI
Fun
ning
[200
5]20
.03.93
Ngamr.Cou
nty,
Tibet
1.57
±0.02
26.06±0.00
287
.49±0.00
37.00
±0.1
4.2±1.0
46.5
±2.8
−95.8±2.5
nSI
Fun
ning
[200
5]17
.05.93
EurekaValley,
California
1.70
±0.3
37.11±0.00
424
2.21
±0.00
59.20
±0.2
173.0±2.0
54.0
±2.0
nI
Massonn
etan
dFeigl
[199
5]17
.05.93
EurekaValley,
California(D
S)
13.00
7.0
50.0
nI
Peltzer
andRosen
[199
5]11
.07.93
N.Chile
18.00
−25
.20
289.97
54.00
5.0
30.0
104.0
thSI
Pritcha
rdet
al.[200
6]29
.09.93
Killari,India
1.76
3.25
95.0
±5.0
54.4
86.0
±5.0
thI
Satyab
ala[200
6]17
.01.94
Northridg
e9.42
248.0
42.0
thI
Massonn
etet
al.[199
6]26
.05.94
AlHoceima,
Morocco
2.10
35.20
355.94
7.00
23.3
±4.5
86.9
±2.3
−1.2
±2.6
ssI
Biggs
etal.[200
6]26
.05.94
AlHoceima,
Morocco
(DS)
2.00
23.0
77.0
ssI
Akogluet
al.[200
6]12
.09.94
Nevada
0.92
38.82
240.38
7.84
319.0
72.0
152.0
ss/n
IAmelun
gan
dBell[200
3]16
.01.95
Kob
e,Japan
19.30
34.62
135.06
6.22
229.1
89.9
−114
.4ss
IOzawaet
al.[199
7]13
.05.95
Kozani‐Grevena
6.50
254.0
48.0
−96.0
nSI
Resor
etal.[200
5]13
.05.95
Kozani‐Grevena
6.90
±0.5
257.8
38.2
−97.1
nI
Rigoet
al.[200
4]13
.05.95
Kozani‐Grevena
6.40
nI
Meyer
etal.[199
6]27
.05.95
N.Sakhalin
,Russia
73.73
52.89
142.90
7.29
197.5
84.2
173.7
ssI
Tob
itaet
al.[199
8]15
.06.95
Aigion,
Greece
3.90
38.33
22.22
5.10
275.0
35.0
−83.0
nGI
Berna
rdet
al.[199
7]30
.07.95
Antofagasta,Chile
(DS)
1600
.00
−24.16
289.14
30.00
5.0
21.5
113.0
thGI
Pritcha
rdet
al.[200
2]30
.07.95
Antofag
asta,Chile
1800
.00
−24
.16
289.31
27.00
5.0
30.0
105.0
thOI
Pritcha
rdet
al.[200
6]01
.10.95
Dinar,Turkey
4.55
±1.1
38.10
30.08
6.42
±3.1
145.0±1.5
49.0
±1.0
−90.0
nI
Wrigh
tet
al.[199
9]01
.10.95
Dinar,Turkey
4.30
±0.2
38.10±0.00
930
.09±0.00
94.60
±0.1
135.0±0.5
49.8
±0.9
−84.4±3.6
nI
Fun
ning
[200
5]01
.10.95
Dinar,Turkey
3.70
±0.1
38.11±0.00
930
.09±0.00
94.20
±0.1
135.2±0.9
48.4
±0.9
−95.7±2.3
nSI
Fun
ning
[200
5]01
.10.95
Dinar,Turkey(D
S)
4.10
145.0
34.0
nI
Fukah
ataan
dWrigh
t[200
8]22
.11.95
Nuw
eiba,Egy
pt56
.23
28.94
34.73
12.0
195.2
65.0
−15.5
ss/n
IKlin
geret
al.[200
0]22
.11.95
Nuw
eiba,Egy
pt70
.00
200.0
80.0
ssSI
Sham
iret
al.[200
3]22
.11.95
Nuw
eiba,Egy
pt(D
S)
65.00
28.88
34.75
11.25
197.5
67.0
−4.0
ssSI
Baeret
al.[200
8]19
.04.96
N.Chile
14.00
−23
.94
289.94
49.00
5.0
23.0
107.0
thSI
Pritcha
rdet
al.[200
6]12
.11.96
Nazca
Ridge,Peru(D
S)
440.00
−15.32
284.84
28.00
307.0
30.0
44.5
thSI
Salicho
net
al.[200
3]12
.11.96
Nazca
Ridge,Peru(D
S)48
0.00
−15
.40
284.80
30.00
312.0
15.0–3
0.0
50.0
thOI
Pritcha
rdet
al.[200
7]26
.03.97
Kagoshima,
Japan
1.78
275.0±6.0
81.0
±3.0
−19.0±2.0
ssGI
Fujiwaraet
al.[199
8]05
.05.97
ZagrosMts,Iran
(PS)
0.16
27.13±0.00
353
.88±0.00
35.20
±3.0
120.0
80.0
±4.0
−90.0±6.0
nI
Loh
man
andSimon
s[200
5]05
.05.97
ZagrosMts,Iran
(FFP)
0.16
27.13±0.00
353
.88±0.00
34.40
±3.0
120.0
80.0
±4.0
−90.0±5.0
nI
Loh
man
andSimon
s[200
5]05
.05.97
ZagrosMts,Iran
(DS)
0.16
27.12
53.89
6.20
120.0
80.0
−83.0
nI
Loh
man
andSimon
s[200
5]26
.09.97
Colfiorito
,Italy00
h33
0.48
4.50
154.0
46.0
−77.0
nSI
Salviet
al.[200
0]26
.09.97
Colfiorito
,Italy09
h40(D
S)
0.98
.045
.0−7
5.0
nSI
Salviet
al.[200
0]26
.09.97
Colfiorito
,Italy00
h33(D
S)
0.43
144.0
45.0
−90.0
nGI
Stramon
doet
al.[199
9]26
.09.97
Colfiorito
,Italy09
h40(D
S)
1.05
144.0
45.0
−90.0
nGI
Stramon
doet
al.[199
9]08
.11.97
Manyi,Tibet
263.00
35.22
87.15
6.38
258.6
89.8
−5.4
ssI
Fun
ning
etal.[200
7]08
.11.97
Manyi,Tibet
171.90
35.26
87.21
4.85
257.7
89.1
−1.1
ssI
Wan
get
al.[200
7]08
.11.97
Manyi,Tibet
(DS)
191.00
35.24
87.30
5.11
255.9
93.2
−5.7
ssI
Wan
get
al.[200
7]
a Date(day.mon
th.year
(dd.
mm.yy
))andLocationcontaintheearthq
uake’s
date
andgeog
raph
ical
locatio
n.M
0istheseismic
mom
ent;Lat,Lon
g,andDepth
arethecentroid’s
latitud
e,long
itude,anddepth,
respectiv
ely;
Strike,Dip,and
Rakearethefault’sstrike,d
ip,and
rake
angles,respectively.
Typ
eisthetype
offaultin
gindicatedby
ss(strike‐slip
fault),n
(normalfault),and
th(thrustfault).D
ataisthetype
ofdata
used
foragivenstud
y:I(using
InSARdata
only),SI(using
seismic
andInSARdata),andOI(using
InSARdata
combinedwith
twoor
moreothertypesof
data;seetext
fordetails).Whenevertherearemultip
lemod
elsof
thesameearthq
uake
prod
uced
inagivenstud
y,wedistingu
ishthem
usingthefollo
wing:
DS(distributed
slip
mod
el),PS(point
source
mod
el),FFP(finite
faultp
atches),1seg.
(faultmod
elon
lywith
one
segm
ent),mult.seg.
(faultmod
elwith
multiplesegm
ents),PM
(planarmod
el)andCM
(curvedmod
el).Mod
elsin
italiccorrespo
ndto
InSAR
solution
sob
tained
usinglayeredelasticmedia
inthedeform
ation
mod
eling.
Param
etersin
bold
werefixedin
theInSAR
inversions.Blank
spaces
meanthat
wewereno
table
toob
tain
thecorrespo
ndingsource
parameters.
WESTON ET AL.: INSAR SOURCE PARAMETERS B08408B08408
3 of 20
Tab
le2.
Sam
eas
Table
1bu
tforEarthqu
akes
Occurring
Between19
98and20
03
Date
Location
M0(×10
18N
m)
Lat
(deg)
Long(deg)
Depth
(km)
Strike(deg)
Dip
(deg)
Rake(deg)
Type
Data
Reference
10.01.98
Zhangbei,China
0.48
41.14±0.004
114.44
±0.004
5.40
±0.3
200.8±6.4
42.7
±3.6
85.9
±10.2
thI
Liet
al.[2008]
10.01.98
Zhangbei,China
(DS)
0.47
41.13
114.51
5.00
200.8
42.7
85.9
thI
Liet
al.[2008]
30.01.98
N.Chile
61.00
−23.96
289.83
45.00
5.0
23.0
102.0
thSI
Pritchard
etal.[2006]
14.03.98
Fandoqa,Iran
8.90
±1.4
30.03±0.004
57.64±0.004
3.50
±0.3
145.2±1.1
63.2
±2.2
−151.6
±11.5
ssI
Funning
[2005]
14.03.98
Fandoqa,Iran
8.28
30.01
57.64
3.67
150.0
52.0
−146.0
ssI
Berberian
etal.[2001]
14.03.98
Fandoqa,Iran
8.40
±0.4
30.02±0.004
57.65±0.002
3.50
±0.2
147.3±1.1
65.1
±3.2
−154.1
±3.44
ssSI
Funning
[2005]
22.05.98
Aiquile,Bolivia
(DS)
8.44
−17.89
294.82
7.30
7.0
79.0
171.0
ssI
Funning
etal.[2005b]
22.05.98
Aiquile,Bolivia
7.77
−17.90
294.84
7.40
7.0
79.0
171.0
ssI
Funning
etal.[2005b]
03.09.98
MtIw
ate,
Japan(D
S)
1.40
39.80
140.90
1.30
200.0
35.8
112.0
thGI
Nishimuraet
al.[2001]
28.03.99
Chamoli,Him
alaya
2.70
30.44
79.39
300.0
15.0
90.0
thI
SatyabalaandBilh
am[2006]
30.04.99
ZagrosMts,
0.112
27.87
53.63
4.10
110.0
42.0
−85.0
nI
Lohman
andSimons[2005]
Iran
(PS)
±0.002
±0.002
±0.18
±6.0
±7.0
30.04.99
ZagrosMts,
0.112
27.87
53.63
3.20
110.0
53.0
−77.0
nI
Lohman
andSimons[2005]
Iran
(FFP)
±0.002
±0.002
±0.15
±5.0
±13.0
30.04.99
ZagrosMts,Iran
(DS)
0.112
27.87
53.63
5.30
110.0
53.0
−79.0
nI
Lohman
andSimons[2005]
17.08.99
Izmit,
Turkey
253.59
40.73
30.05
10.80
271.2
89.7
−173.1
ssI
Wright[2000]
17.08.99
Izmit,
Turkey(D
S)
184.00
ssOI
Feigl
etal.[2002]
17.08.99
Izmit,
Turkey
85.0
ssOI
Delouiset
al.[2000]
17.08.99
Izmit,
Turkey(D
S)
240.00
40.72
30.21
7.90
267.6
85.0
179.6
ssOI
Delouiset
al.[2002]
17.08.99
Izmit,
Turkey(D
S)
190.00
40.72
30.07
6.99
90.7
88.3
178.7
ssI
Cakiret
al.[2003]
07.09.99
Athens,GreeceModel
11.29
38.09
23.63
9.50
100.0
43.0
nI
Kontoes
etal.[2000]
07.09.99
Athens,GreeceModel
21.46
38.11
23.63
9.50
116.0
54.0
nI
Kontoes
etal.[2000]
16.10.99
HectorMine(D
S)
72.00
34.56
243.73
1.90
153.3
85.3
177.4
ssGI
Simonset
al.[2002]
16.10.99
HectorMine(D
S)
59.30
34.56
243.73
6.08
332.3
83.0
184.6
ss/th
GI
Jonssonet
al.[2002]
16.10.99
HectorMine(D
S)
58.00
34.58
243.72
4.89
332.7
81.4
176.0
ssOI
Salichonet
al.[2004]
12.11.99
Duzce,Turkey1seg.
65.60±3.4
40.80
31.27
6.30
±1.0
259.0±1.0
51.0
±4.0
−178.0
±3.0
ssI
Wright[2000]
12.11.99
Duzce,TurkeyMult.seg.
41.46
40.81
31.21
7.65
273.9
57.0
±4.0
−134.0
±17.0
ssI
Wright[2000]
12.11.99
Duzce,Turkey
51.40
40.72
31.26
6.77
84.5
56.7
−174.0
ss/n
GI
Burgm
annet
al.[2002]
12.11.99
Duzce,Turkey(D
S)
56.60
86.7
54.0
ss/n
GI
Burgm
annet
al.[2002]
06.06.00
Cankiri,Turkey
1.40
40.63
32.99
5.50
357.0±15.0
55.0
±19.0
−20.0±15.0
nI
Wright[2000]
06.06.00
Cankiri,Turkey
1.38
40.63
32.99
4.0–6.6
2.0
33.0
−37.0
nI
CakirandAkoglu[2008]
17.06.00
S.Iceland
5.42
63.96
339.65
4.99
5.0
86.0
175.0
ssI
Pedersenet
al.[2001]
17.06.00
S.Iceland
4.40
63.97
339.66
3.94
1.0
87.0
180.0
ssGI
Pedersenet
al.[2003]
17.06.00
S.Iceland(D
S)
4.50
63.97
339.66
3.09
2.0
87.0
180.0
ssGI
Pedersenet
al.[2003]
21.06.00
S.Iceland
5.06
63.99
339.30
4.50
359.0
90.0
180.0
ssI
Pedersenet
al.[2001]
21.06.00
S.Iceland
5.30
63.99
339.30
4.10
0.0
90.0
180.0
ssGI
Pedersenet
al.[2003]
21.06.00
S.Iceland(D
S)
5.00
63.98
339.30
2.97
0.0
90.0
180.0
ssGI
Pedersenet
al.[2003]
26.01.01
Bhuj,India
190.00
23.51
70.27
13.00±1.1
82.0
51.0
77.0
thI
Schm
idtandBurgm
ann[2006]
26.01.01
Bhuj,India(D
S)
250.00
82.0
51.0
thI
Schm
idtandBurgm
ann[2006]
28.02.01
Nisqually
20.00
47.10
237.33
51.00
180.0
20.0
nGI
Bustin
etal.[2004]
28.02.01
Nisqually
60.0
180.0
20.0
nGI
Bustin
etal.[2004]
23.06.01
Arequipa,
Peru(D
S)6300.00
−17.36
287.39
27.00
316.0
11–25
69.0
thOI
Pritchard
etal.[2007]
14.11.01
Kokoxili,Tibet
(DS)
710.00
35.84
92.45
11.00
97.6
90.0
0.0
ssI
Lasserreet
al.[2005]
23.10.02
NenanaMountain
10.80
63.50
211.95
12.90
261.8
81.2
173.7
ssI
Wrightet
al.[2003]
Alaska
±0.8
±0.002
±0.004
±0.7
±0.9
±1.7
±1.3
03.11.02
Denali,Alaska
649.82
63.22
214.85
6.93
108.5
84.4
171.9
ssGI
Wrightet
al.[2004a]
21.05.03
Zem
mouri,Algeria
(PM)
17.80
8.0–10.0
65.0
40.0
90.0
thOI
Belabbéset
al.[2009]
21.05.03
Zem
mouri,Algeria
(CM)
21.50
8.0–10.0
65.0
40.0
90.0
thOI
Belabbéset
al.[2009]
26.07.03
Miyagi,Japan
1.80
38.45
141.19
2.29
212.2
38.7
102.7
thOI
Nishimuraet
al.[2003]
26.12.03
Bam
,Iran
9.00
±0.3
29.03
58.36
5.69
355.4
89.9
−173.5
ss/th
IFunning
etal.[2005a]
26.12.03
Bam
,Iran
6.20
±0.4
29.04
58.36
4.70
±0.4
355.2±1.0
86.6
±3.6
173.7±1.7
ss/th
SI
Funning
etal.[2005a]
26.12.03
Bam
,Iran
5.00
29.05
58.35
5.8
359.6
86.0
−179.8
ssI
Peyretet
al.[2007]
26.12.03
Bam
,Iran
29.06
58.36
4.8
1.6
88.0
−170.9
ssOI
Peyretet
al.[2007]
26.12.03
Bam
,Iran
(DS)
6.79
5.60
358.2
88.8
180.0
ssOI
Motaghet
al.[2006]
WESTON ET AL.: INSAR SOURCE PARAMETERS B08408B08408
4 of 20
solutions. Whenever uniform and variable slip inversionsare carried out, we include both final inversion solutions inthe database, except if any of the models has a substantiallylower misfit or if it is indicated by the authors as not being apreferred model. We use all the information provided in the
papers (as well as provided on request by authors) to maxi-mize our set of source parameters. Nevertheless, for manystudies not all the required parameters are given (particularlythe centroid location). For example, often the location of thefault’s corner or the updip surface projection of the centroid
Table 3. Same as Table 1 but for Earthquakes Occurring Between 2004 and 2007
Date LocationM0
(×1018 N m)Lat(deg)
Long(deg)
Depth(km)
Strike(deg)
Dip(deg)
Rake(deg) Type Data Reference
24.02.04 Al Hoceima,Morocco
6.20 35.14 356.01 10.05 295.4 ± 1.1 87.4 ± 1.5 −179.2 ss I Biggs et al. [2006]
24.02.04 Al Hoceima,Morocco (DS)
7.40 35.14 356.00 8.80 295.0 88.0 −179.0 ss I Biggs et al. [2006]
24.02.04 Al Hoceima,Morocco
5.88 35.17 355.98 6.90 339.5 88.0 178.0 ss OI Tahayt et al. [2009]
24.02.04 Al Hoceima,Morocco (DS)
6.60 ss I Akoglu et al. [2006]
24.02.04 Al Hoceima,Morocco (DS)
6.80 88.0 ss I Cakir et al. [2006]
24.10.04 Niigata, Japan 13.99 37.30 138.83 4.70 200.0 45.0 72.0 th I Ozawa et al. [2005]22.02.05 Zarand 6.70 31.50 56.80 4.65 266.0 67.0 105.0 th I Talebian et al. [2006]
Iran ±0.2 ±0.3 ±1.0 ±2.0 ±2.020.03.05 Fukuoka‐ken 7.10 298.0 79.0 −18.0 ss GI Nishimura et al. [2006]
Seiho‐oki, Japan20.03.05 Fukuoka‐ken (DS) 8.70 ss GI Nishimura et al. [2006]
Seiho‐oki, Japan13.06.05 Tarapaca, Chile 580.00 189.0 24.0 −74.0 n OI Peyrat et al. [2006]08.10.05 Kashmir (DS) 336.00 34.29 73.77 321.5 31.5 th I Pathier et al. [2006]27.11.05 Qeshm Island,
Iran1.27 ± 0.07 26.77 55.92 6.00 267.0 ± 2.0 49.0 ± 4.0 105.0 ± 5.0 th I Nissen et al. [2007]
31.03.06 Chalan‐Chulan,Iran
1.70 33.67 48.88 4.80 320.0 60.0 180.0 ss I Peyret et al. [2008]
31.03.06 Chalan‐Chulan,Iran (DS)
1.58 320.0 60.0 180.0 ss I Peyret et al. [2008]
25.03.07 Noto Hanto 14.52 37.22 136.66 6.00 50.7 53.5 150.0 th GI Ozawa et al. [2008]25.03.07 Noto Hanto (DS) 11.09 50.7 48.0 115.0 th GI Fukushima et al. [2008]15.08.07 Pisco, Peru 1900.00 −13.89 283.48 30.00 316.0 11–25 71.0 th SI Pritchard and
Fielding [2008]
Figure 1. Geographical location of the 57 earthquakes (stars) studied with InSAR used in this study. Allearthquakes have magnitudes between Mw 5.0 and 8.5 and are shallow (depth less than 60 km), except forthe 2005 Tarapaca, Chile, earthquake (GCMT depth is 97.6 km).
WESTON ET AL.: INSAR SOURCE PARAMETERS B08408B08408
5 of 20
are given, rather than the actual centroid location. In thesecases we compute the parameters from published and/orprovided information; for uniform slip models, centroidlocations are calculated using geometrical information (e.g.,location of corner of fault, fault strike, dip, width and length).For the variable slip models that we obtained from severalauthors, we calculate centroid locations using the spatialdistribution of slip combined with fault geometry. Also, oftenthe seismic moment, M0, is not given. We use
M0 ¼ � A u; ð1Þ
whereM0 is the seismic moment, m is the rigidity modulus, Ais the fault’s area and �u is the average slip. We use the rigiditymodulus quoted in the study or in other studies of earthquakesin the same region (or by the same authors); failing that, weuse a standard rigidity modulus of m = 32 GPa. Where faultsare segmented, with changes in width along strike, the totalmoment is computed and a weighted average based on theseismic moment for each segment is used to determine overallparameters (centroid location and fault strike, dip and rake).[12] In this study we do not use InSAR source models
where multiple subevents are present that are clearly spa-
tially discontinuous. We also discard from this study a fewInSAR solutions that the authors state as being stronglyinfluenced by substantial postseismic deformation, such as,for example, the 2004 Parkfield earthquake.
2.1. Example of Calculation of ICMT Parameters
[13] In this section we illustrate our approach by calcu-lating ICMT parameters for the two‐fault, uniform slipmodel for the 2003 Bam, Iran, earthquake produced byFunning et al. [2005a]. This model consists of two subfaultswith individual focal mechanisms as shown in Figure 3. Theprimary fault released a seismic moment of 7.6 × 10¹⁸ N m,whereas the secondary fault has a seismic moment of 1.4 ×10¹⁸ N m. Figure 3 shows the focal mechanism (red beachball) obtained from the total moment and the moment‐weighted average strike, dip and rake of the two faults,assuming a pure double‐couple source mechanism (seeoverall parameters in Table 2). As expected, the focalmechanism obtained from the overall parameters is similarto that of the primary fault, which has the larger moment.We also show the geometric centroid of each fault (blackcrosses) and the overall centroid obtained from a moment‐weighted average of the centroids of the two faults (red
Figure 2. Distribution of earthquake moment magnitudes (Mw) of the earthquakes studied with InSARused in this study. The distribution is skewed toward earthquakes in the magnitude range 6–6.5. This isprobably due to the higher frequency of earthquakes of that magnitude compared to larger events and to ahigher detectability of such earthquakes using InSAR than to smaller events. Also, in this study we do notuse a number of small earthquakes studied using InSAR because of the absence of reported GCMT para-meters for them (see text for details).
WESTON ET AL.: INSAR SOURCE PARAMETERS B08408B08408
6 of 20
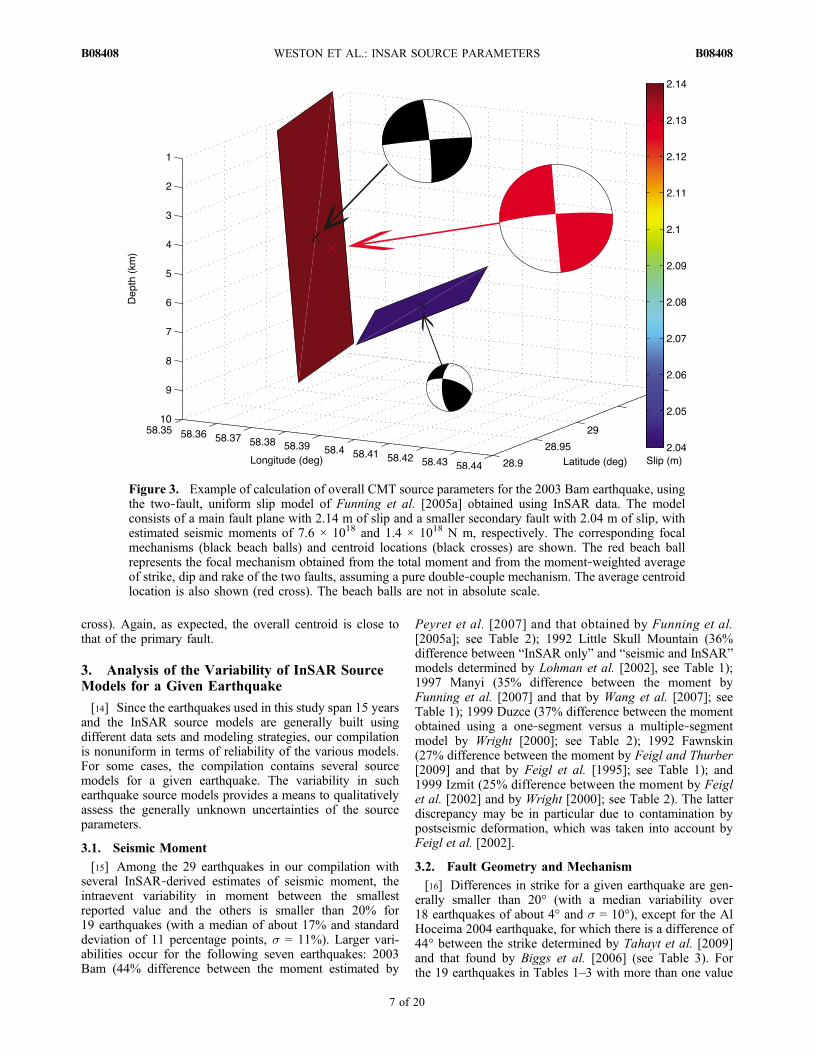
cross). Again, as expected, the overall centroid is close tothat of the primary fault.
3. Analysis of the Variability of InSAR SourceModels for a Given Earthquake
[14] Since the earthquakes used in this study span 15 yearsand the InSAR source models are generally built usingdifferent data sets and modeling strategies, our compilationis nonuniform in terms of reliability of the various models.For some cases, the compilation contains several sourcemodels for a given earthquake. The variability in suchearthquake source models provides a means to qualitativelyassess the generally unknown uncertainties of the sourceparameters.
3.1. Seismic Moment
[15] Among the 29 earthquakes in our compilation withseveral InSAR‐derived estimates of seismic moment, theintraevent variability in moment between the smallestreported value and the others is smaller than 20% for19 earthquakes (with a median of about 17% and standarddeviation of 11 percentage points, s = 11%). Larger vari-abilities occur for the following seven earthquakes: 2003Bam (44% difference between the moment estimated by
Peyret et al. [2007] and that obtained by Funning et al.[2005a]; see Table 2); 1992 Little Skull Mountain (36%difference between “InSAR only” and “seismic and InSAR”models determined by Lohman et al. [2002], see Table 1);1997 Manyi (35% difference between the moment byFunning et al. [2007] and that by Wang et al. [2007]; seeTable 1); 1999 Duzce (37% difference between the momentobtained using a one‐segment versus a multiple‐segmentmodel by Wright [2000]; see Table 2); 1992 Fawnskin(27% difference between the moment by Feigl and Thurber[2009] and that by Feigl et al. [1995]; see Table 1); and1999 Izmit (25% difference between the moment by Feiglet al. [2002] and by Wright [2000]; see Table 2). The latterdiscrepancy may be in particular due to contamination bypostseismic deformation, which was taken into account byFeigl et al. [2002].
3.2. Fault Geometry and Mechanism
[16] Differences in strike for a given earthquake are gen-erally smaller than 20° (with a median variability over18 earthquakes of about 4° and s = 10°), except for the AlHoceima 2004 earthquake, for which there is a difference of44° between the strike determined by Tahayt et al. [2009]and that found by Biggs et al. [2006] (see Table 3). Forthe 19 earthquakes in Tables 1–3 with more than one value
Figure 3. Example of calculation of overall CMT source parameters for the 2003 Bam earthquake, usingthe two‐fault, uniform slip model of Funning et al. [2005a] obtained using InSAR data. The modelconsists of a main fault plane with 2.14 m of slip and a smaller secondary fault with 2.04 m of slip, withestimated seismic moments of 7.6 × 10¹⁸ and 1.4 × 10¹⁸ N m, respectively. The corresponding focalmechanisms (black beach balls) and centroid locations (black crosses) are shown. The red beach ballrepresents the focal mechanism obtained from the total moment and from the moment‐weighted averageof strike, dip and rake of the two faults, assuming a pure double‐couple mechanism. The average centroidlocation is also shown (red cross). The beach balls are not in absolute scale.
WESTON ET AL.: INSAR SOURCE PARAMETERS B08408B08408
7 of 20
of fault dip reported, the variability in dip is smaller than 20°(with a median of about 8° and s = 6°), except for the 2000Cankiri earthquake, for which there is a difference of 22°between the fault dip determined by Wright [2000] and thatobtained by Cakir and Akoglu [2008]. The variability inrake for a given earthquake is also generally smaller than20° (with a median over 21 earthquakes of about 7° and s =11°), except for the following earthquakes: 1992 Little Skull(27° difference; see Table 1), 1999 Duzce (44° difference;see Table 2) and 2007 Noto Hanto (35° difference; seeTable 3).
3.3. Centroid Spatial Location
[17] Differences in epicentral location for a given earth-quake are smaller than 10 km for 18 earthquakes (with amedian over 20 earthquakes of about 3 km and s = 5 km),with the following three earthquakes showing larger dif-ferences: 1995 Antofagasta (17 km difference between thestudies of Pritchard et al. [2002, 2006]); 1997 Manyi (14 kmdifference between the results of Funning et al. [2007] andWang et al. [2007]); and 1999 Izmit (14 km between theresults ofWright [2000] and Delouis et al. [2000]). There is avery good agreement between the centroid depths in thevarious InSAR source models for a given earthquake, with avariability smaller than 5 km for most earthquakes (with themedian of the variabilities for 20 earthquakes being about2 km and s = 2 km). The maximum variability in depth is of9 km for the 2001 Nisqually earthquake between sourcemodels obtained using layered 1‐D and 3‐D media by Bustinet al. [2004].
4. Comparisons Between Seismicallyand Geodetically Derived EarthquakeSource Parameters
[18] In this section we compare the various ICMT param-eters with those in three different seismic catalogs: theGlobal CMT (GCMT) catalog, the ISC catalog and the EHBcatalog. In order to reduce the effect of the nonhomogeneityof our ICMT compilation on the comparisons, we do not usea few InSAR solutions for which the authors clearly statethat there is low signal‐to‐noise ratio in the InSAR data orpotential contamination of the signal by aftershocks or bypostseismic deformation.
4.1. Seismic Moment
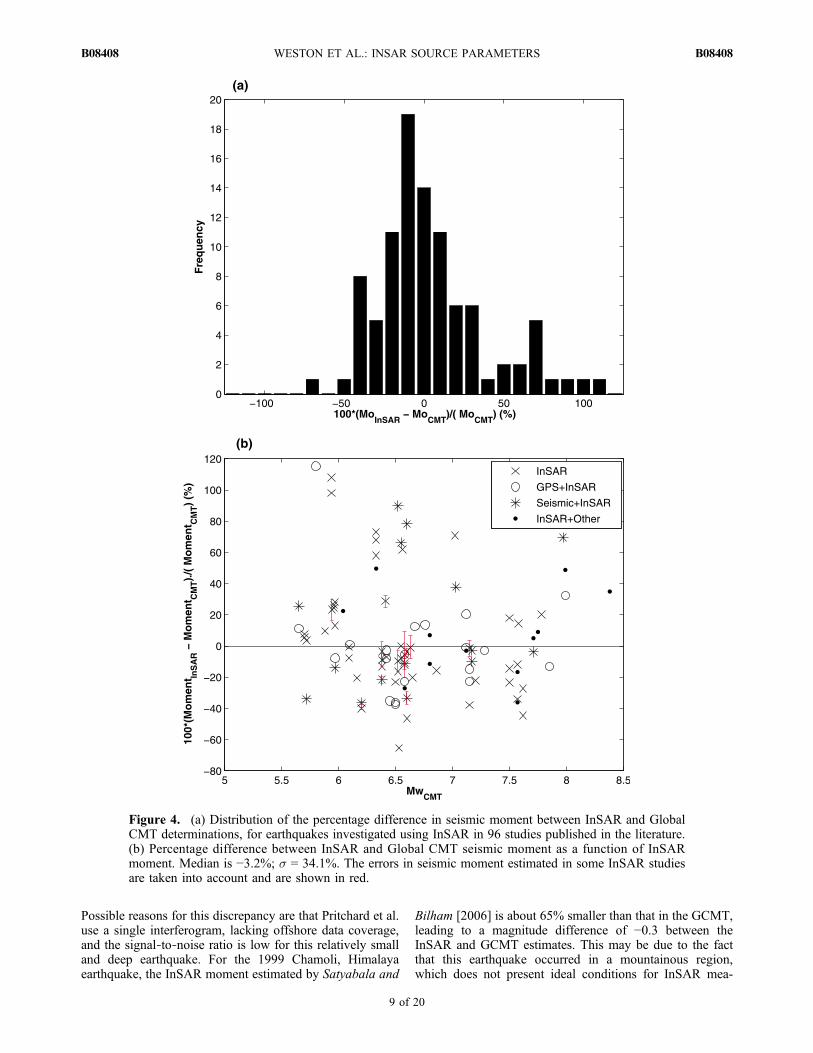
[19] Figure 4 compares seismic moment values from theGlobal CMT catalog with estimates from 96 InSAR sourcemodels. Overall, the differences in seismic moment calculatedusing these two techniques are relatively small, following adistribution close to Gaussian with a median of −3.2%, anaverage of 4.1% and a standard deviation of 34.1%. We findthat the mean difference between InSAR and GCMT momentvalues is not statistically significantly different from zero at a95% confidence interval (Student’s t test). This disagrees withprevious studies using fewer earthquakes [e.g., Feigl et al.,2002; Lohman and Simons, 2005] and using simulations[Dawson et al., 2008], which suggested that seismic momentsdetermined using InSAR were larger than those obtained fromseismic data. If anything, we find a slight tendency of InSARpredicting smaller seismic moments than those reported in theGlobal CMT catalog.
[20] There is no relationship between differences in seis-mic moment and the specific combination of data used todetermine the InSAR solutions: I, GI, SI, OI (see Figure 4b);likewise, there is no dependence of the differences of seis-mic moment on the size of the earthquake. We also examinethe differences in seismic moment as a function of post-seismic time elapsed between the earthquake and the latestInSAR data used to investigate potential effects of con-tamination by postseismic deformation, but do not find anyclear relationship (see Figure S2a in the auxiliary material).1
Moreover, we examine the differences in seismic moment asa function of the non‐double‐couple component of theearthquakes in the Global CMT catalog to investigatewhether the discrepancies were larger for earthquakes withreported large non‐double‐couple component but do notfind any clear dependency (see Figure S2b). In addition, weexamine the differences in seismic moment as a function ofstrike, dip, rake and earthquake depth and do not find anyclear trend (see Figure S2, which shows all these compar-isons). Analyzing the differences in seismic moment as afunction of fault mechanism, it seems that for thrust earth-quakes there is a slight tendency for InSAR to overestimatethe seismic moment compared to GCMT moment values(see captions of Figure S2). However, our moment com-parisons only include 24 thrust earthquake models and thestandard deviation of the differences is large, so this ten-dency is not statistically significant. We also split the set ofseismic moments into two subsets corresponding to InSARdeterminations using uniform and variable slip models; wefound similar tendencies in the comparisons between InSARand GCMT moments for these two subsets to that found inFigure 4 (see Figure S3). Among all the InSAR models usedhere, only fifteen report uncertainties for the estimatedseismic moments (see Tables 1–3); the observed trend in thedifferences in seismic moment between InSAR and GCMTdoes not change when taking these uncertainties into account.We also compare moment magnitudes Mw calculated fromthe InSAR and GCMT seismic moments; Figure S2 showsthat the differences in Mw are small (generally smaller than0.16) and broadly normally distributed with a median of−0.0093.[21] For some studies there are large differences between
seismically and InSAR‐determined moments. For example,for the 1994 Al Hoceima earthquake there are differences inmoment of over 100% between the InSAR solutions ofBiggs et al. [2006] and Akoglu et al. [2006] and the GlobalCMT solution, corresponding to a difference in Mw of 0.2,with the InSAR moment being larger than that in the GCMTcatalog. A possible reason for this is that a substantialamount of surface deformation for this earthquake wasoffshore and the onshore deformation was relatively small,thus the signal‐to‐noise ratio in the interferogram was rela-tively low, which makes InSAR determinations moredifficult. As a result, Biggs et al. [2006] report a strong trade‐off between slip and length, which might have affectedmoment estimations. Likewise, for the 1993 northern Chileearthquake the InSAR moment estimated by Pritchard et al.[2006] is 78% larger than that reported in the GCMT cata-log, leading to a moment magnitude difference of 0.17.
1Auxiliary materials are available in the HTML. doi:10.1029/2010JB008131.
WESTON ET AL.: INSAR SOURCE PARAMETERS B08408B08408
8 of 20
Possible reasons for this discrepancy are that Pritchard et al.use a single interferogram, lacking offshore data coverage,and the signal‐to‐noise ratio is low for this relatively smalland deep earthquake. For the 1999 Chamoli, Himalayaearthquake, the InSAR moment estimated by Satyabala and
Bilham [2006] is about 65% smaller than that in the GCMT,leading to a magnitude difference of −0.3 between theInSAR and GCMT estimates. This may be due to the factthat this earthquake occurred in a mountainous region,which does not present ideal conditions for InSAR mea-
Figure 4. (a) Distribution of the percentage difference in seismic moment between InSAR and GlobalCMT determinations, for earthquakes investigated using InSAR in 96 studies published in the literature.(b) Percentage difference between InSAR and Global CMT seismic moment as a function of InSARmoment. Median is −3.2%; s = 34.1%. The errors in seismic moment estimated in some InSAR studiesare taken into account and are shown in red.
WESTON ET AL.: INSAR SOURCE PARAMETERS B08408B08408
9 of 20
surements; a 50° slope was facing the radar for bothascending and descending tracks [Satyabala and Bilham,2006]. Thus, InSAR may have not been able to detect allthe surface deformation caused by the event and hence led toan underestimation of the seismic moment. In addition, forthe 2003 Bam earthquake, all InSAR studies [Funning et al.,2005a; Motagh et al., 2006; Peyret et al., 2007] estimated asmaller magnitude than that reported by the GCMT catalog,with the estimate by Peyret et al. [2007] having the largestdiscrepancy, with a moment of 46% smaller than theGCMT, which corresponds to a difference in momentmagnitude of about −0.18. A potential source of error whenestimating the horizontal motion close to the rupture is theangle at which the satellite acquired the data, combined withthe fault’s orientation. Other possible causes are the paucityof well‐correlated pixels on the west side of the fault insome studies and the use of different smoothing parameters
in the source inversions. This is further supported by thelarge intraevent variability in seismic moment obtainedusing InSAR for this earthquake, as discussed in section 3.1.Finally, for the 2001 Bhuj earthquake, the seismic momentdetermined by Schmidt and Burgmann [2006] is 45%smaller than that reported by the GCMT catalog, corre-sponding to a moment magnitude difference of about −0.17.Poor InSAR data for this earthquake is a possible reason forthis discrepancy, as the earthquake’s region is characterizedby low lying vegetated land, which was flooded at the timeof the earthquake. Consequently, there is a lack of coherencein the epicentral region and the near surface slip is not wellconstrained.
4.2. Fault Geometry and Mechanism
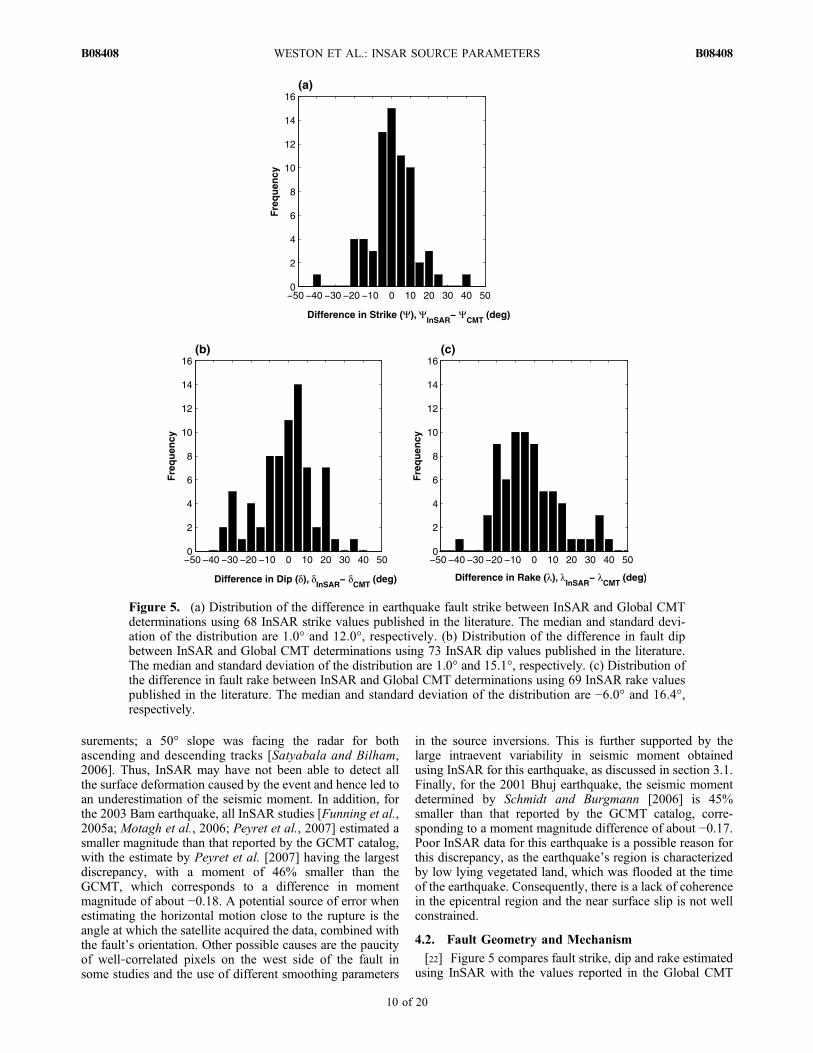
[22] Figure 5 compares fault strike, dip and rake estimatedusing InSAR with the values reported in the Global CMT
Figure 5. (a) Distribution of the difference in earthquake fault strike between InSAR and Global CMTdeterminations using 68 InSAR strike values published in the literature. The median and standard devi-ation of the distribution are 1.0° and 12.0°, respectively. (b) Distribution of the difference in fault dipbetween InSAR and Global CMT determinations using 73 InSAR dip values published in the literature.The median and standard deviation of the distribution are 1.0° and 15.1°, respectively. (c) Distribution ofthe difference in fault rake between InSAR and Global CMT determinations using 69 InSAR rake valuespublished in the literature. The median and standard deviation of the distribution are −6.0° and 16.4°,respectively.
WESTON ET AL.: INSAR SOURCE PARAMETERS B08408B08408
10 of 20
catalog. We do not consider strike, dip and rake values thatwere held fixed in some InSAR studies (see Tables 1–3).Overall, there is a good agreement between fault strike, dipand rake determined by these two techniques, with differ-ences following a distribution close to normal, centeredaround zero. The distribution of differences in strike has thesmallest standard deviation, with most strike differencesbeing smaller than 20°. The greatest difference in strike is44°, for the model by Tahayt et al. [2009] of the 2004 AlHoceima earthquake, which was also found to be quitedifferent to other InSAR strike estimations, as discussed insection 3.2. A possible explanation for this discrepancy isthat this model is a cross fault model, consisting of twosubevents separated by about 3 s [e.g., Stich et al., 2005]being quite different from a point source model, such asused in the GCMT approach. The distribution of differencesin dip is also centered around zero, with most fault dip angledifferences being smaller than 20°, but shows a greaterspread. The distribution of differences in rake shows thegreatest spread, with a maximum difference in rake of 42°for the earthquake model by Ozawa et al. [2008] for the2007 Noto Hanto earthquake. A possible reason for thisdiscrepancy is that this earthquake occurred on the coast ofthe Noto peninsula, thus limiting the use of InSAR data.Moreover, this difference may also be due to limitations inthe GCMT technique, as the rake value determined byOzawa et al. [2008] is more compatible with that deter-mined using regional seismic data [Ozawa et al., 2008].[23] We do not find any relationship between differences
in strike, dip and rake and the type of data used in theInSAR modeling (InSAR only, InSAR and GPS, InSAR andseismic, InSAR and other). Moreover, we examined thedifferences in strike, dip and rake as a function of otherparameters such as seismic moment, postseismic elapsedtime, non‐double‐couple component of the earthquakesreported in the Global CMT catalog and earthquake depth,and did not find any clear relationship (see Figures S4–S6,which show all these comparisons).
4.3. Centroid Spatial Location
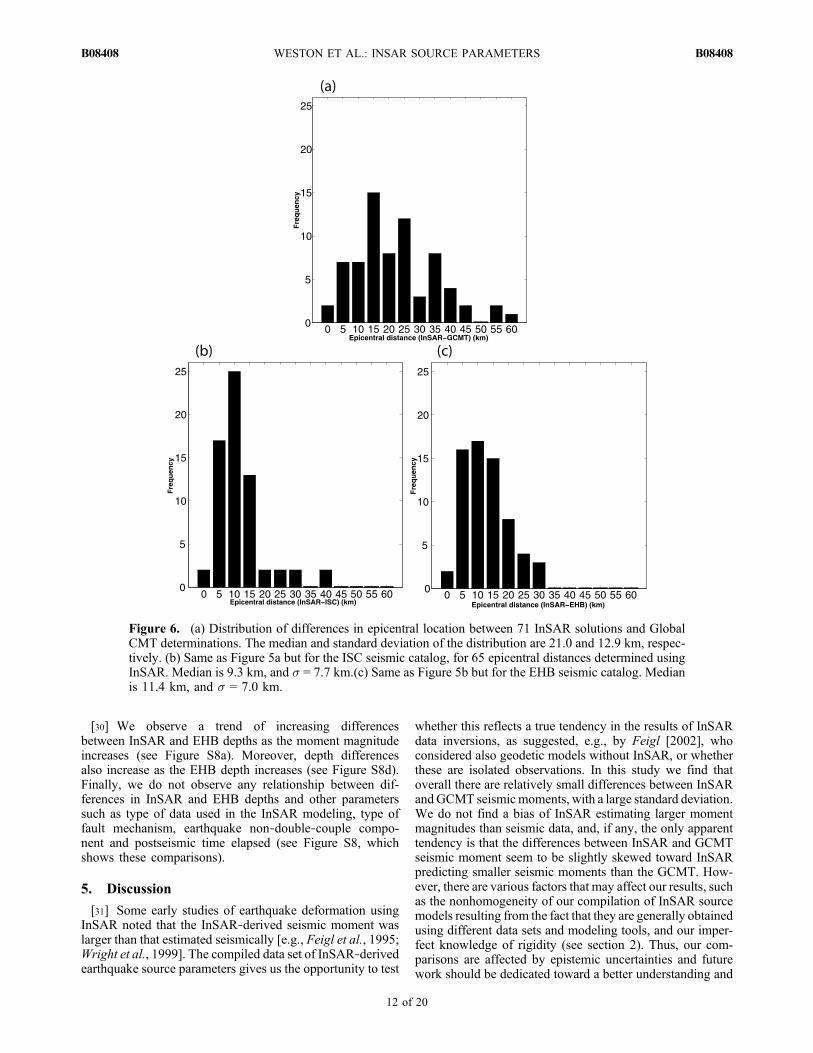
4.3.1. Epicentral Location[24] Figure 6 shows the distribution of epicentral distance
between InSAR‐determined and seismically determinedepicenters from the GCMT, ISC and EHB catalogs, andFigure 7 shows the corresponding mislocation arrows. Thedifferences in centroid epicenter are greater for the GCMTcatalog (Figure 6), which shows a distribution of differenceswith a median of about 21 km and a standard deviation ofs ≈ 13 km. A number of solutions show epicentral distancesbetween InSAR and the GCMT larger than 40 km, partic-ularly for subduction earthquakes in South America: 2007Pisco [Pritchard and Fielding, 2008]; 1993, 1996 and 1998northern Chile [Pritchard et al., 2006] and 1996 NazcaRidge [Salichon et al., 2003]. This is probably due to thefact that seismic locations tend to be systematically mis-located in these subduction zones toward the trench [e.g.,Syracuse and Abers, 2009]. However, the InSAR locationsmight also be systematically located landward due to a lackof InSAR data coverage offshore. For the 1992 Little SkullMountain earthquake, there is an epicentral difference ofabout 42 km between the GCMT location and that byLohman et al. [2002]. This is possibly due to limitations in
the GCMT method, as there is a disagreement in location ofup to 11 km between different seismic studies [Lohmanet al., 2002].[25] Epicentral differences are smaller for the ISC and
EHB catalogs, which show narrower distributions withmedians of about 9 km and 11 km, respectively. For thesecatalogs all differences in epicentral location are generallysmaller than 40 km, except for the 1998 Aiquile earthquake.There is a difference of about 40 km between the ISC epi-central location and the InSAR location obtained byFunning et al. [2005b] using an uniform slip model, whichis consistent with the damage distribution for that event. It isimportant to note though that the epicentral distance com-parisons for the ISC and EHB catalogs contain 7 fewercomparisons than for the GCMT. The reason for this is thatwe do not carry out comparisons for very large earthquakes(Mw ≥ 7.7) because for such large earthquakes the earth-quake centroid (as determined by InSAR) will be differentto the rupture’s initiation point (reported by ISC and EHB)and thus the comparisons would be inappropriate.[26] In some cases, the seismic epicentral mislocation
arrows relative to the InSAR solutions show some geo-graphic consistency, such as in South America (Figure 7)and in Morocco, Greece and Turkey (Figure 8). However,for other regions, there is no geographic consistency, such asin Iran and in California (Figure 8).[27] We do not find any relationship between the seis-
mic‐InSAR epicentral differences and any other parameterssuch as seismic moment, earthquake depth, type of earth-quake mechanism, type of data used in the InSAR mod-eling, non‐double‐couple component of the earthquake andpostseismic time elapsed (see Figure S7, which shows allthese comparisons).4.3.2. Depth[28] Figure 9 (M = 0.150) shows differences between
InSAR centroid depth estimates and depth values reported inthe EHB catalog obtained from free depth determinations.We do not carry out comparisons for depth values reportedin the GCMT catalog because for most earthquakes in thisstudy the depths in the catalog are fixed at 15 km. Moreover,we do not show comparisons with ISC depths, because theresults are very similar to those obtained using depths in theEHB catalog. With the exception of a few outliers, Figure 9shows that differences between InSAR and EHB depths arerelatively small, with a median difference on the order of5 km. The largest difference in depth occurs for the 2005Qeshm earthquake, where the InSAR depth determined byNissen et al. [2007] is 39 km shallower than that reported byEHB. The same authors also use teleseismic data to deter-mine a depth that is 36 km shallower than that reported bythe EHB catalog; thus, this difference probably results fromlimitations in the EHB method. The distribution of depthdifferences is biased toward InSAR depths being shallowerthan EHB depths, which is consistent with previous studies(see, e.g., Feigl [2002] for a summary).[29] We also compare EHB depths with the maximum
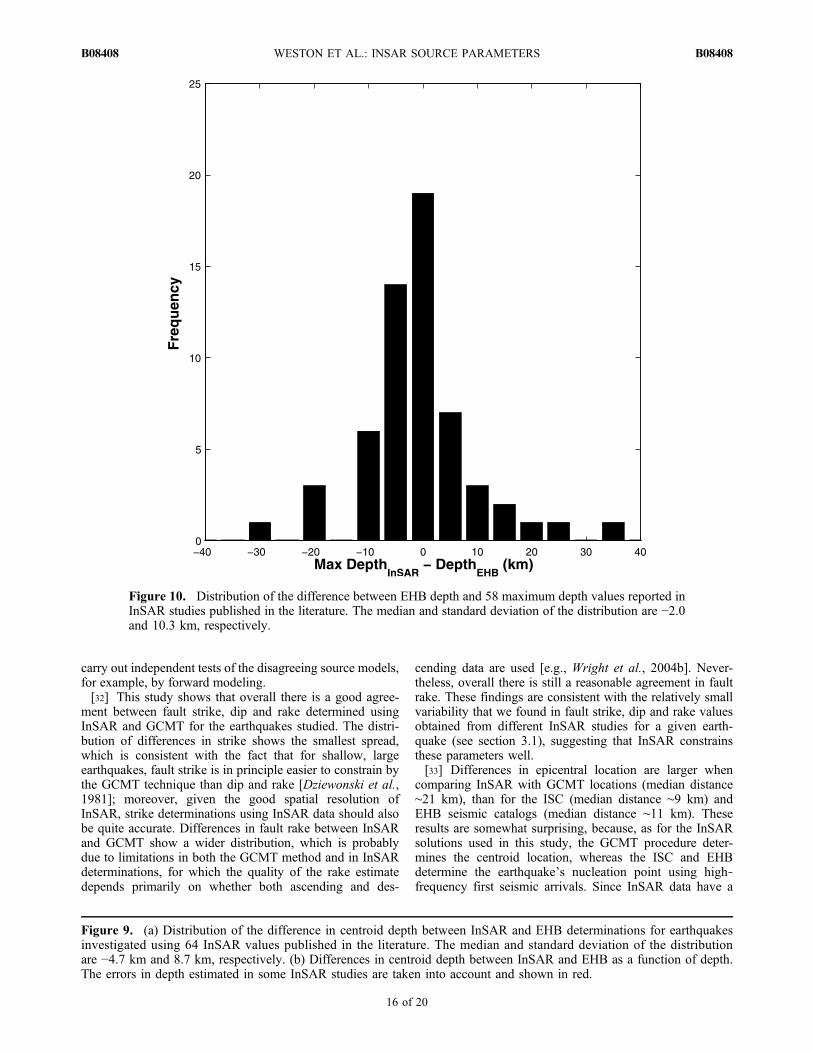
depth determined using InSAR. Figure 10 shows that thereis a good agreement between maximum earthquake depthsdetermined using InSAR and EHB depths; the differencesare normally distributed around zero with a standard devi-ation of about 10 km.
WESTON ET AL.: INSAR SOURCE PARAMETERS B08408B08408
11 of 20
[30] We observe a trend of increasing differencesbetween InSAR and EHB depths as the moment magnitudeincreases (see Figure S8a). Moreover, depth differencesalso increase as the EHB depth increases (see Figure S8d).Finally, we do not observe any relationship between dif-ferences in InSAR and EHB depths and other parameterssuch as type of data used in the InSAR modeling, type offault mechanism, earthquake non‐double‐couple compo-nent and postseismic time elapsed (see Figure S8, whichshows these comparisons).
5. Discussion
[31] Some early studies of earthquake deformation usingInSAR noted that the InSAR‐derived seismic moment waslarger than that estimated seismically [e.g., Feigl et al., 1995;Wright et al., 1999]. The compiled data set of InSAR‐derivedearthquake source parameters gives us the opportunity to test
whether this reflects a true tendency in the results of InSARdata inversions, as suggested, e.g., by Feigl [2002], whoconsidered also geodetic models without InSAR, or whetherthese are isolated observations. In this study we find thatoverall there are relatively small differences between InSARandGCMT seismicmoments, with a large standard deviation.We do not find a bias of InSAR estimating larger momentmagnitudes than seismic data, and, if any, the only apparenttendency is that the differences between InSAR and GCMTseismic moment seem to be slightly skewed toward InSARpredicting smaller seismic moments than the GCMT. How-ever, there are various factors that may affect our results, suchas the nonhomogeneity of our compilation of InSAR sourcemodels resulting from the fact that they are generally obtainedusing different data sets and modeling tools, and our imper-fect knowledge of rigidity (see section 2). Thus, our com-parisons are affected by epistemic uncertainties and futurework should be dedicated toward a better understanding and
Figure 6. (a) Distribution of differences in epicentral location between 71 InSAR solutions and GlobalCMT determinations. The median and standard deviation of the distribution are 21.0 and 12.9 km, respec-tively. (b) Same as Figure 5a but for the ISC seismic catalog, for 65 epicentral distances determined usingInSAR. Median is 9.3 km, and s = 7.7 km.(c) Same as Figure 5b but for the EHB seismic catalog. Medianis 11.4 km, and s = 7.0 km.
WESTON ET AL.: INSAR SOURCE PARAMETERS B08408B08408
12 of 20
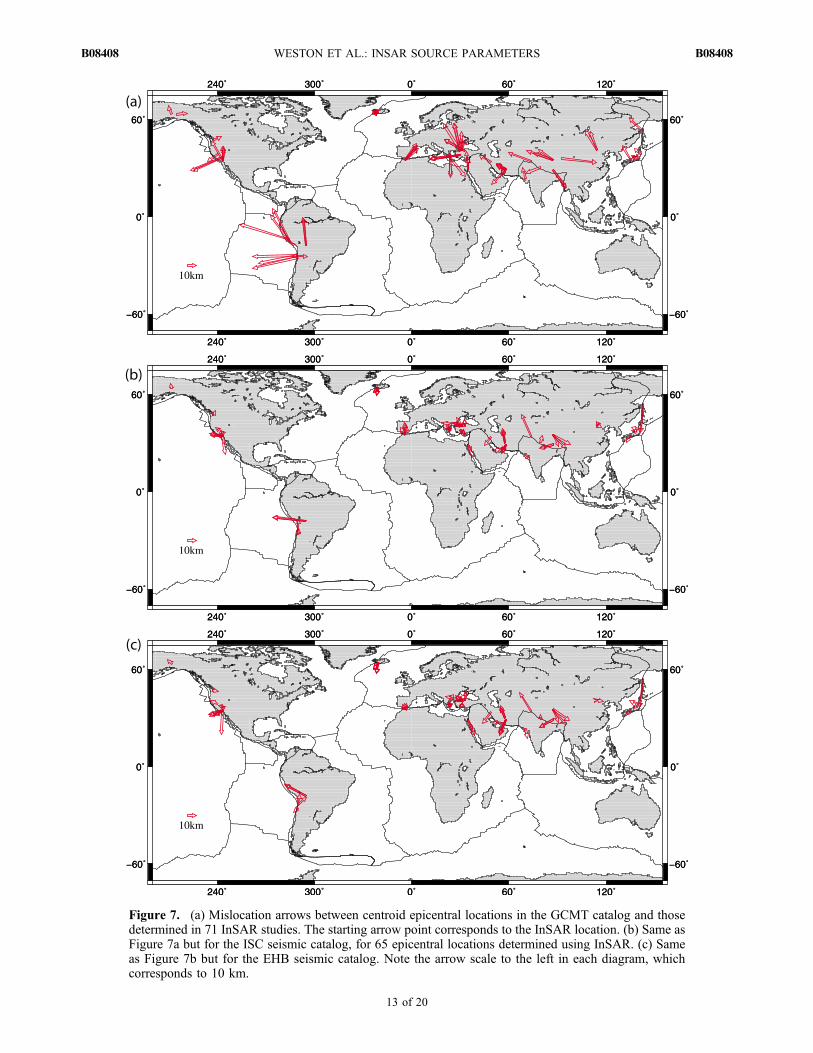
Figure 7. (a) Mislocation arrows between centroid epicentral locations in the GCMT catalog and thosedetermined in 71 InSAR studies. The starting arrow point corresponds to the InSAR location. (b) Same asFigure 7a but for the ISC seismic catalog, for 65 epicentral locations determined using InSAR. (c) Sameas Figure 7b but for the EHB seismic catalog. Note the arrow scale to the left in each diagram, whichcorresponds to 10 km.
WESTON ET AL.: INSAR SOURCE PARAMETERS B08408B08408
13 of 20
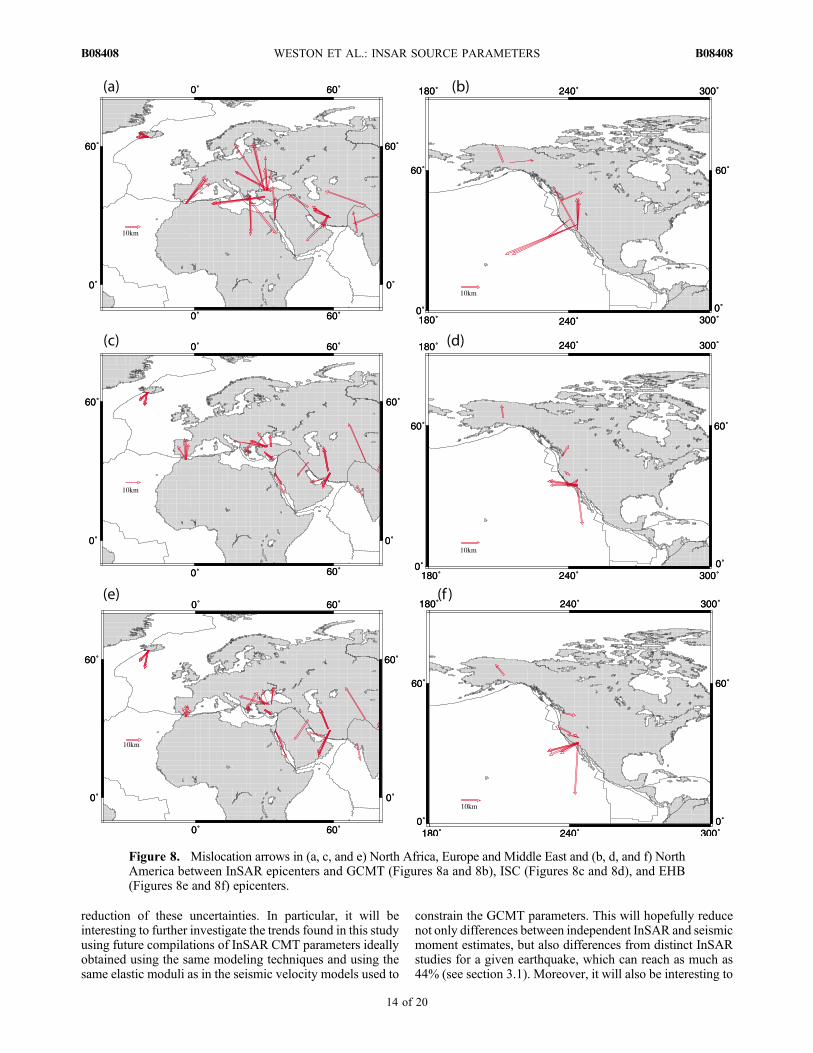
reduction of these uncertainties. In particular, it will beinteresting to further investigate the trends found in this studyusing future compilations of InSAR CMT parameters ideallyobtained using the same modeling techniques and using thesame elastic moduli as in the seismic velocity models used to
constrain the GCMT parameters. This will hopefully reducenot only differences between independent InSAR and seismicmoment estimates, but also differences from distinct InSARstudies for a given earthquake, which can reach as much as44% (see section 3.1). Moreover, it will also be interesting to
Figure 8. Mislocation arrows in (a, c, and e) North Africa, Europe and Middle East and (b, d, and f) NorthAmerica between InSAR epicenters and GCMT (Figures 8a and 8b), ISC (Figures 8c and 8d), and EHB(Figures 8e and 8f) epicenters.
WESTON ET AL.: INSAR SOURCE PARAMETERS B08408B08408
14 of 20
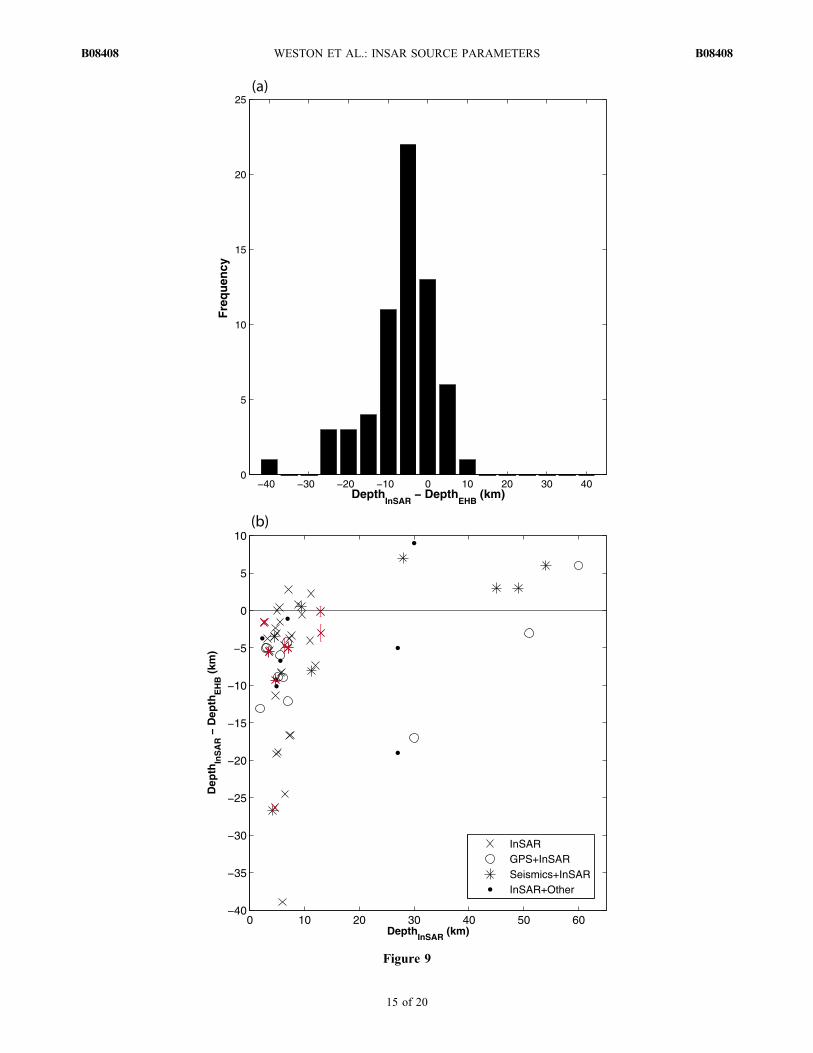
Figure 9
WESTON ET AL.: INSAR SOURCE PARAMETERS B08408B08408
15 of 20
carry out independent tests of the disagreeing source models,for example, by forward modeling.[32] This study shows that overall there is a good agree-
ment between fault strike, dip and rake determined usingInSAR and GCMT for the earthquakes studied. The distri-bution of differences in strike shows the smallest spread,which is consistent with the fact that for shallow, largeearthquakes, fault strike is in principle easier to constrain bythe GCMT technique than dip and rake [Dziewonski et al.,1981]; moreover, given the good spatial resolution ofInSAR, strike determinations using InSAR data should alsobe quite accurate. Differences in fault rake between InSARand GCMT show a wider distribution, which is probablydue to limitations in both the GCMT method and in InSARdeterminations, for which the quality of the rake estimatedepends primarily on whether both ascending and des-
cending data are used [e.g., Wright et al., 2004b]. Never-theless, overall there is still a reasonable agreement in faultrake. These findings are consistent with the relatively smallvariability that we found in fault strike, dip and rake valuesobtained from different InSAR studies for a given earth-quake (see section 3.1), suggesting that InSAR constrainsthese parameters well.[33] Differences in epicentral location are larger when
comparing InSAR with GCMT locations (median distance∼21 km), than for the ISC (median distance ∼9 km) andEHB seismic catalogs (median distance ∼11 km). Theseresults are somewhat surprising, because, as for the InSARsolutions used in this study, the GCMT procedure deter-mines the centroid location, whereas the ISC and EHBdetermine the earthquake’s nucleation point using high‐frequency first seismic arrivals. Since InSAR data have a
Figure 10. Distribution of the difference between EHB depth and 58 maximum depth values reported inInSAR studies published in the literature. The median and standard deviation of the distribution are −2.0and 10.3 km, respectively.
Figure 9. (a) Distribution of the difference in centroid depth between InSAR and EHB determinations for earthquakesinvestigated using 64 InSAR values published in the literature. The median and standard deviation of the distributionare −4.7 km and 8.7 km, respectively. (b) Differences in centroid depth between InSAR and EHB as a function of depth.The errors in depth estimated in some InSAR studies are taken into account and shown in red.
WESTON ET AL.: INSAR SOURCE PARAMETERS B08408B08408
16 of 20
fine spatial resolution, which was confirmed by the verysmall variabilities in location for a given earthquake seen insection 3, it should map fault locations accurately. Thus, theepicentral differences found in this study indicate that theepicentral locations in the ISC and EHB catalogs are moreaccurate than those in the Global CMT catalog, even thoughin principle GCMT locations should be more comparablewith InSAR centroid locations. InSAR epicentral shiftvectors relative to seismic estimates are systematic in someregions (e.g., in Chile, Morocco, Greece and Turkey), butshow no geographic consistency in other regions, such as inIran and in California, suggesting a lack of epicentral res-olution in some of the seismological estimates used in thisstudy. The epicentral location errors that we estimate for theEHB and ISC catalogs are slightly smaller than the error inhypocentral locations determined by Smith and Ekström[1996], who obtain a RMS misfit to known locationsclose to 15 km when using corrections for three‐dimensionalEarth structure in inversions of high‐frequency body wavetraveltimes. Nevertheless, the EHB and ISC locations stillseem to be less accurate than regional locations, whoseerrors are estimated by Ritzwoller et al. [2003] to be ofabout 5 km when using 3‐D Earth models.[34] As reported in previous studies, InSAR centroid
depths are systematically shallower than the depths reportedin the EHB catalog, with a median discrepancy of about5 km. A tendency of geodetic estimates locating coseismicslip at shallower depths than seismological determinationshas also been reported, e.g., by Feigl [2002]. A possiblereason for this tendency is that the lower sensitivity ofsurface deformation to deep slip could bias the earthquakeslip inferred by InSAR toward shallow depths. This isconsistent with the fact that differences between InSARand EHB depths are larger for greater EHB depths (seesection 4.3.2). Several studies have highlighted that depthsestimated using InSAR can be biased toward shallow valuesdue to the use of elastic homogeneous half‐spaces to modelthe InSAR data [e.g., Savage, 1987; Marshall et al., 1991;Eberhart‐Phillips and Stuart, 1992; Wald and Graves,2001]. There are large variations in the properties of theupper crust and therefore such homogeneous half‐spaceapproximations will have the largest influence for shallowearthquakes, which constitute most of the earthquakes in ourdatabase. Quantifications of this effect using more realisticmedia such as layered 1‐D and 3‐D media, showed thatusing elastic homogeneous half‐spaces in the modelingcould lead to depths 10–30% shallower than the actual depth[e.g., Marshall et al., 1991; Savage, 1998; Lohman andSimons, 2005; Simons et al., 2002; Bustin et al., 2004].Comparing InSAR depth values in our database for earth-quakes studied using both half‐space and layered models,we observe depth differences in this same range, except forthe 1995 Antofagasta earthquake, for which the depth in thelayered model is actually shallower than for a half‐space(see Table 1). Our ICMT database includes a total of nineInSAR earthquake models with reported depth obtainedusing layered media in the modeling (these models areindicated in italic in Tables 1–3). The median difference forthese depths compared to EHB depths is of 2.6 km, i.e., forlayered models, the InSAR depths are actually overall largerthan the EHB depths, suggesting that indeed the use of half‐space models could at least partly explain the depth dis-
crepancies. However, this needs to be further investigated,since our ICMT compilation contains a very small numberof InSAR solutions determined using a layered model.[35] Other possible reasons for the observed differences in
depth include the use of incorrect rigidity and/or Poisson’sratio values [e.g., Cattin et al., 1999], nonplanar faultgeometries, irregular distribution of InSAR data or unmo-deled rheological heterogeneity. Yet another possible causefor the trend observed in this study is that we compareInSAR estimates of centroid depth with depths reported inthe EHB catalog, which are rupture initiation depths. It hasbeen observed that the rupture of most shallow crustalearthquakes tends to propagate upward from a given depthtoward the surface [e.g., Mai et al., 2005], which is com-patible with our observed tendency of the earthquake’scentroid being systematically shallower than the rupture’sinitiation point, with a relatively small median of differencesof about 5 km. Such small median of depth differences isreasonable, as most of the earthquakes used have magni-tudes in the range Mw 6–6.5. The explanation of theobserved trend in terms of upward propagation of the rup-ture is further supported by the good agreement that weobtain between EHB depths and maximum depths deter-mined using InSAR (see Figure 10). Moreover, this expla-nation is also consistent with our observation thatdifferences between InSAR and EHB depths are larger forgreater moment magnitude earthquakes (see section 4.3.2).Thus, systematic differences between rupture initiation pointand centroid for crustal earthquakes do seem to be a plau-sible explanation for the differences in depth that weobserve, suggesting that the EHB and InSAR depths areboth accurate within about 5 km.
6. Conclusions
[36] In this study we compare CMT source parametersdetermined using InSAR with those in the Global CMT, ISCand EHB seismic catalogs for 57 global earthquakes. Weshow that fault strike, dip and rake angles determined usingInSAR are generally compatible with those in the GlobalCMT catalog. The comparisons suggest that at least forcontinental, moderate magnitude earthquakes that can bestudied using InSAR, estimates of fault geometry andmechanism in the GCMT catalog and using InSAR data areaccurate within about 15° in fault strike, dip and rake. Wealso show that the seismic moments determined usingInSAR and seismic data are on average compatible witheach other, with a standard deviation in moment magnitudeof about 0.1. Moreover, we do not find support for previ-ously suggested tendencies of InSAR data producing largerseismic moments than seismic data. We show that themedian difference of GCMT epicentral locations relative toInSAR is of about 21 km, with a spread of 13 km, whichreduces to half when using EHB and ISC locations. SinceInSAR data have a high spatial resolution and are a new,independent data source, these comparisons constitute a firstindependent assessment of the epicentral location uncer-tainties in the GCMT, EHB and ISC catalogs. They suggestthat the locations in the GCMT catalog can be improved,possibly by the use of future, high‐resolution models of3‐D Earth structure; this issue deserves further investigation.Finally, we show that InSAR depths are biased by about 5 km
WESTON ET AL.: INSAR SOURCE PARAMETERS B08408B08408
17 of 20
to shallower depths compared to EHB depths. This may bedue to unmodeled local crustal structure and to the fact thatwhile the InSAR solutions used here should represent thecentroid of fault slip, the EHB method determines the earth-quake’s nucleation point. The latter explanation is consistentwith the observation that shallow crustal earthquakes tend topropagate upward in the seismogenic layer. While in thisstudywe focus on 57 earthquakes that occurred between 1992and 2007, we are currently expanding our ICMT database byincluding InSAR source models that occurred since 2007 andwill make it available to the wide community in the nearfuture, thus contributing to current earthquake source modelvalidation efforts. Moreover, we anticipate that this databasewill also form the basis for future comparisons of other rel-evant parameters, such as average slip and stress drop.
[37] Acknowledgments. We thank all the authors of earthquake studiesusing InSAR that answered our queries for their support and for providingvaluable information for this study, notably, F.Amelung,G.Baer, S.Belabbés,J. Biggs, R. Burgmann, A. Bustin, Z. Cakir, B. Delouis, Y. Fialko, Y. Fukahata,Y. Klinger, C. Lasserre, Z. Li, R. Lohman, B.Meyer,M.Motagh, T.Nishimura,E.Nissen, E. Pathier, R. Pedersen,M. Peyret,M. Pritchard, P. Resor, J. Salichon,S. Satyabala, M. Simons, H. Sudhaus, M. Tobita, H. Wang, R. Wang andT. Wright. A.M.G.F. thanks Martin Vallée, Yann Klinger, John Woodhouseand James Jackson for useful discussions, which helped to improve this manu-script. A.M.G.F. is grateful for the support from the European Commission’sInitial Training Network project QUEST (contract FP7‐PEOPLE‐ITN‐2008‐238007). J.W. is supported by a UK Natural Environment Research Council(NERC) studentship and is grateful for initial support from a summer bursaryby the School of Environmental Sciences, University of East Anglia, UnitedKingdom and from a grant by the UK Royal Astronomical Society (RAS). Amachine‐readable file with the information in Tables 1–3 can be provided bythe authors upon request.
ReferencesAdams, R. D., A. A. Hughes, and D. M. McGregor (1982), Analysis pro-cedures at the International Seismological Centre, Phys. Earth Planet.Inter., 30, 85–93, doi:10.1016/0031-9201(82)90093-0.
Akoglu, A. M., Z. Cakir, M. Meghraoui, S. Belabbes, S. O. El Alami,S. Ergintav, and H. S. Akyuz (2006), The 1994–2004 Al Hoceima(Morocco) earthquake sequence: Conjugate fault ruptures deduced fromInSAR, Earth Planet. Sci. Lett., 252, 467–480, doi:10.1016/j.epsl.2006.10.010.
Amelung, F., and J. W. Bell (2003), Double Spring Flat, Nevada, earth-quake (M5.9): Main shock accompanied by triggered slip on a conjugatefault, J. Geophys. Res., 108(B9), 2433, doi:10.1029/2002JB001953.
Baer, G., G. J. Gunning, G. Shamir, and T. J. Wright (2008), The 1995November 22, Mw 7.2 Gulf of Elat earthquake cycle revisited, Geophys.J. Int., 175, 1040–1054, doi:10.1111/j.1365-246X.2008.03901.x.
Belabbés, S., C. Wicks, Z. Cakir, and M. Meghraoui (2009), Rupture para-meters of the 2003 Zemmouri (Mw 6.8), Algeria, earthquake from jointinversion of interferometric synthetic aperture radar, coastal uplift, andGPS, J. Geophys. Res., 114, B03406, doi:10.1029/2008JB005912.
Berberian, M., J. A. Jackson, E. Fielding, B. E. Parsons, K. Priestley,M. Qorashi, M. Tabelian, R. Walker, T. J. Wright, and C. Baker (2001),The 1998 March 14 Fandoqa earthquake (Mw 6.6) in Kerman province,southeast Iran: Re‐rupture of the 1981 Sirch earthquake fault, triggeringof slip on adjacent thrusts and the active tectonics of the Gowk fault zone,Geophys. J. Int., 146, 371–398, doi:10.1046/j.1365-246x.2001.01459.x.
Bernard, P., et al. (1997), The Ms = 6.2, June 15, 1995 Aigion earthquake(Greece): evidence for low angle normal faulting in the Corinth rift,J. Seismol., 1, 131–150, doi:10.1023/A:1009795618839.
Biggs, J., E. Bergman, B. Emmerson, G. J. Funning, J. Jackson, B. Parsons, andT. J. Wright (2006), Fault identification for buried strike‐slip earthquakesusing InSAR: The 1994 and 2004 Al Hoceima, Morocco earthquakes, Geo-phys. J. Int., 166, 1347–1362, doi:10.1111/j.1365-246X.2006.03071.x.
Burgmann, R., M. Emin Ayhan, E. J. Fielding, T. J. Wright, S. McClusky,B. Aktug, C. Demir, O. Lenk, andA. Turkezer (2002), Deformation duringthe 12 November 1999 Duzce, Turkey earthquake, from GPS and InSARdata, Bull. Seismol. Soc. Am., 92, 161–171, doi:10.1785/0120000834.
Bustin, A., R. D. Hyndman, A. Lambert, J. Ristau, J. He, H. Dragert, andM. Van der Kooij (2004), Fault parameters of the Nisqually earthquake
determined from moment tensor solutions and the surface deformationfrom GPS and InSAR, Bull. Seismol. Soc. Am., 94, 363–376, doi:10.1785/0120030073.
Cakir, Z., and A. M. Akoglu (2008), Synthetic aperture radar interferometryobservations of the M = 6.0 Orta earthquake of 6 June 2000 (NW Turkey):Reactivation of a listric fault, Geochem. Geophys. Geosyst., 9, Q08009,doi:10.1029/2008GC002031.
Cakir, Z., J.‐B. de Chabalier, R. Armijo, B. Meyer, A. Barka, and G. Peltzer(2003), Coseismic and early post‐seismic slip associated with the 1999Izmit earthquake (Turkey), from SAR interferometry and tectonic fieldobservations, Geophys. J. Int., 155, 93–110, doi:10.1046/j.1365-246X.2003.02001.x.
Cakir, Z., M. Meghraoui, A. M. Akoglu, N. Jabour, S. Belabbes, andL. Ait‐Brahim (2006), Surface deformation associated with the Mw 6.4,24 February 2004 Al Hoceima, Morocco, earthquake deduced fromInSAR: Implications for the active tectonics along North Africa, Bull. Seis-mol. Soc. Am., 96, 59–68, doi:10.1785/0120050108.
Cattin, R., P. Briole, H. Lyon‐Caen, P. Bernard, and P. Pinettes (1999),Effects of superficial layers on coseismic displacements for a dip‐slip faultand geophysical implications, Geophys. J. Int., 137, 149–158, doi:10.1046/j.1365-246x.1999.00779.x.
Dawson, J., P. Cummins, P. Tregoning, andM.Leonard (2008), Shallow intra-plate earthquakes inwesternAustralia observed by InSAR, J.Geophys. Res.,113, B11408, doi:10.1029/2008JB005807.
Delouis, B., P. Lundgren, J. Salichon, and D. Giardini (2000), Joint inver-sion of InSAR and teleseismic data for the slip history of the 1999 Izmit(Turkey) earthquake, Geophys. Res. Lett., 27, 3389–3392, doi:10.1029/2000GL011511.
Delouis, B., D. Giardini, P. Lundgren, and J. Salichon (2002), Joint inver-sion of InSAR, GPS, Teleseismic, and Strong‐Motion data for the spatia-land temporal distribution of earthquake slip: application to the 1999Izmit aftershock, Bull. Seismol. Soc. Am., 92, 278–299, doi:10.1785/0120000806.
Dziewonski, A. M., and J. H. Woodhouse (1983a), Studies of the seismicsource using normal‐mode theory, Proc. Enrico Fermi Int. Sch. Phys.,LXXXV, 45–137.
Dziewonski, A. M., and J. H. Woodhouse (1983b), An experiment in sys-tematic study of global seismicity: Centroid moment tensor solution for201 moderate and large earthquakes of 1981, J. Geophys. Res., 88,3247–3271, doi:10.1029/JB088iB04p03247.
Dziewonski, A. M., T.‐A. Chou, and J. H. Woodhouse (1981), Determina-tion of earthquake source parameters from waveform data for studies ofglobal and regional seismicity, J. Geophys. Res., 86, 2825–2852,doi:10.1029/JB086iB04p02825.
Eberhart‐Phillips, D., and W. D. Stuart (1992), Material heterogeneity sim-plifies the picture: Loma Prieta,Bull. Seismol. Soc. Am., 82(4), 1964–1968.
Engdahl, E. R., R. van der Hilst, and R. Buland (1998), Global teleseismicearthquake relocation with improved travel times and procedures fordepth determination, Bull. Seismol. Soc. Am., 88, 722–743.
Feigl, K. L. (2002), Estimating earthquake source parameters from geodeticmeasurements, in International Handbook of Earthquake and EngineeringSeismology, Int. Geophys. Ser., vol. 81A, edited by W. H. K. Lee et al.,pp. 607–620, Academic, Amsterdam, doi:10.1016/S0074-6142(02)80240-6.
Feigl, K. L., and C. H. Thurber (2009), A method for modelling radar interfer-ograms without phase unwrapping: application to the M 5 Fawnskin, Cali-fornia earthquake of 1992 December 4, Geophys. J. Int., 176, 491–504,doi:10.1111/j.1365-246X.2008.03881.x.
Feigl, K. L., A. Sergent, and D. Jacq (1995), Estimation of an earthquakefocal mechanism from a satellite radar interferogram: Application to theDecember 4, 1992 Landers aftershock, Geophys. Res. Lett., 22, 1037–1040,doi:10.1029/94GL03212.
Feigl, K. L., F. Sarti, H. Vadon, Mc, S. Ergintav, P. Durand, R. Burgmann,A. Rigo, D. Massonnet, and R. Reilinger (2002), Estimating slip distribu-tion for the Izmit mainshock from coseismic GPS, ERS‐1, RADARSAT,and SPOT measurements, Bull. Seismol. Soc. Am., 92, 138–160,doi:10.1785/0120000830.
Ferreira, A. M. G., J. Weston, and G. J. Funning (2011), Global compila-tion of interferometric synthetic aperture earthquake source models:2. Effects of 3‐D Earth structure, J. Geophys. Res., doi:10.1029/2010JB008132, in press.
Fialko, Y. (2004), Probing the mechanical properties of seismically activecrust with space geodesy: Study of the coseismic deformation due to the1992 Mw7.3 Landers (southern California) earthquake, J. Geophys. Res.,109, B03307, doi:10.1029/2003JB002756.
Fujiwara, S., H. Yarai, S. Ozawa, M. Tobita, M. Murakami, H. Nakagawa,and K. Nitta (1998), Surface displacement of the March 26, 1997Kagoshima‐ken Hokuseibu earthquake in Japan from synthetic apertureradar interferometry, Geophys. Res. Lett., 25, 4541–4544, doi:10.1029/1998GL900191.
WESTON ET AL.: INSAR SOURCE PARAMETERS B08408B08408
18 of 20
Fukahata, Y., and T. J. Wright (2008), A non‐linear geodetic data inversionusing ABIC for slip distribution on a fault with an unknown dip angle,Geophys. J. Int., 173, 353–364, doi:10.1111/j.1365-246X.2007.03713.x.
Fukushima, Y., T. Ozawa, and M. Hashimoto (2008), Fault model of the2007 Noto Hanto earthquake estimated from PALSAR radar interferom-etry and GPS data, Earth Planets Space, 60, 99–104.
Funning, G. J. (2005), Source parameters of large shallow earthquakesin the Alpine‐Himalayan belt from InSAR and waveform modelling,Ph.D. thesis, Fac. of Phys. Sci., Univ. of Oxford., Oxford, U. K.
Funning, G. J., B. Parsons, T. J. Wright, J. A. Jackson, and E. J. Fielding(2005a), Surface displacements and source parameters of the 2003 Bam(Iran) earthquake from Envisat advanced synthetic aperture radar imag-ery, J. Geophys. Res., 110, B09406, doi:10.1029/2004JB003338.
Funning, G. J., R. M. D. Barker, S. H. Lamb, E. Minaya, B. Parsons, andT. J. Wright (2005b), The 1998 Aiquile, Bolivia earthquake: A seismi-cally active fault revealed with InSAR, Earth Planet. Sci. Lett., 232,39–49, doi:10.1016/j.epsl.2005.01.013.
Funning,G. J., B. Parsons, andT. J.Wright (2007), Fault slip in the 1997Manyi,Tibet earthquake from linear elastic modelling of InSAR displacements,Geo-phys. J. Int., 169, 988–1008, doi:10.1111/j.1365-246X.2006.03318.x.
Jonsson, S., H. Zebker, P. Segall, and F. Amelung (2002), Fault slip distri-bution of the 1999 Mw 7.1 Hector Mine, California, earthquake, esti-mated from satellite radar and GPS measurements, Bull. Seismol. Soc.Am., 92, 1377–1389, doi:10.1785/0120000922.
Klinger, Y., R. Michel, and J.‐P. Avouac (2000), Co‐seismic deformationduring the Mw 7.3 Aqaba earthquake (1995) from ERS‐SAR interferom-etry, Geophys. Res. Lett., 27, 3651–3654, doi:10.1029/1999GL008463.
Kontoes, C., P. Elias, O. Sykioti, P. Briole, D. Remy, M. Sachpazi, I. Veis,and G. Kotsis (2000), Displacement field and fault model for the September7, 1999 Athens earthquake inferred from ERS2 satellite radar interferome-try, Geophys. Res. Lett., 27, 3989–3992, doi:10.1029/2000GL008510.
Lasserre, C., G. Peltzer, F. Crampé, Y. Klinger, J. Van der Woerd, andP. Tapponnier (2005), Coseismic deformation of the 2001 Mw = 7.8Kokoxili earthquake in Tibet, measured by synthetic aperture radar inter-ferometry, J. Geophys. Res., 110, B12408, doi:10.1029/2004JB003500.
Li, Z., W. Feng, Z. Xu, P. Cross, and J. Zhang (2008), 1998 Mw 5.7Zhangbei‐Shangyi (China) earthquake revisited: A buried thrust faultrevealed with interferometric synthetic aperture radar,Geochem. Geophys.Geosyst., 9, Q04026, doi:10.1029/2007GC001910.
Lohman, R. B., and M. Simons (2005), Locations of selected small earth-quakes in the Zagros mountains, Geochem. Geophys. Geosyst., 6,Q03001, doi:10.1029/2004GC000849.
Lohman, R. B., M. Simons, and B. Savage (2002), Location and mecha-nism of the Little Skull Mountain earthquake as constrained by satelliteradar interferometry and seismic waveform modeling, J. Geophys. Res.,107(B6), 2118, doi:10.1029/2001JB000627.
Mai, P. M., P. Spudich, and J. Boatwright (2005), Hypocenter locations infinite‐source rupture models, Bull. Seismol. Soc. Am., 95(3), 965–980,doi:10.1785/0120040111.
Marshall, G. A., R. S. Stein, and W. Thatcher (1991), Faulting geometryand slip from coseismic elevation changes: The 18 October 1989, LomaPrieta, California, earthquake, Bull. Seismol. Soc. Am., 81, 1660–1693.
Massonnet, D., and K. L. Feigl (1995), Satellite radar interferometric mapof the coseismic deformation field of theM= 6.1 Eureka Valley, Californiaearthquake of May 17, 1993, Geophys. Res. Lett., 22, 1541–1544,doi:10.1029/95GL01088.
Massonnet, D., K. L. Feigl, H. Vadon, and M. Rossi (1994), Radar inter-ferometric mapping of deformation in the year after the Landers earth-quake, Nature, 369, 227–230, doi:10.1038/369227a0.
Massonnet, D., K. L. Feigl, H. Vadon, and M. Rossi (1996), Coseismicdeformation field of the M = 6.7 Northridge California earthquake ofJanuary 17, 1994 recorded by two radar satellites using interferometry,Geophys. Res. Lett., 23, 969–972, doi:10.1029/96GL00729.
Meyer, B., R. Armijo, D. Massonnet, J.‐B. de Chabalier, C. Delacourt, J. C.Ruegg, J. Achache, P. Briole, and D. Papanastassiou (1996), The 1995Grevena (northern Greece) earthquake: Fault model constrained with tec-tonic observations and SAR interferometry, Geophys. Res. Lett., 23,2677–2680, doi:10.1029/96GL02389.
Motagh, M., J. Klotz, F. Tavakoli, Y. Djamour, S. Arabi, H.‐U. Wetzel,and J. Zschau (2006), Combination of precise leveling and InSAR datato constrain source parameters of the Mw = 6.5, 26 December 2003Bam, earthquake, Pure Appl. Geophys., 163, 1–18, doi:10.1007/s00024-005-0005-y.
Nishimura, S., S. Fujiwara, M. Murakami, H. Suito, M. Tobita, and H. Yarai(2006), Fault model of the 2005 Fukuoka‐ken Seiho‐oki earthquake esti-mated from coseismic deformation observed by GPS and InSAR, EarthPlanets Space, 58, 51–56.
Nishimura, T., S. Fujiwara, M. Murakami, M. Tobita, H. Nakagawa,T. Sagiya, and T. Tada (2001), TheM6.1 earthquake triggered by volcanic
inflation of Iwate volcano, northern Japan, observed by satellite radar inter-fe rometry , Geophys . Res . Let t . , 28 , 635–638, doi :10.1029/2000GL012022.
Nishimura, T., T. Imakiire, H. Yarai, T. Ozawa, M. Murakami, andM. Kaidzu (2003), A preliminary fault model of the 2003 July 26, M6.4northern Miyagi earthquake, northeastern Japan, estimated from jointinversion of GPS leveling and InSAR data, Earth Planets Space, 55,751–757.
Nissen, E., M. Ghorashi, J. Jackson, B. Parsons, and M. Talebian (2007),The 2005 Qeshm island earthquake (Iran)—A link between buriedreverse faulting and surface folding in the Zagros simply folded belt,Geophys. J. Int., 171, 326–338, doi:10.1111/j.1365-246X.2007.03514.x.
Ozawa, S., M.Murakami, S. Fujiwara, andM. Tobita (1997), Synthetic aper-ture radar interferogram of the 1995 Kobe earthquake and its geodeticinversion, Geophys. Res. Lett., 24, 2327–2330, doi:10.1029/97GL02318.
Ozawa, S., H. Yarai, M. Tobita, H. Une, and T. Nishimura (2008), Crustaldeformation associated with the Noto Hanto earthquake in 2007 in Japan,Earth Planets Space, 60, 95–98.
Ozawa, T., S. Nishimura, Y. Wada, and H. Ohkura (2005), Coseismicdeformation of the Mid Niigata prefecture earthquake in 2004 detectedby RADARSAT/InSAR, Earth Planets Space, 57, 423–428.
Pathier, E., E. J. Fielding, T. J. Wright, R. Walker, B. E. Parsons, andS. Hensley (2006), Displacement field and slip distribution of the 2005Kashmir earthquake from SAR imagery, Geophys. Res. Lett., 33,L20310, doi:10.1029/2006GL027193.
Pedersen, R., F. Sigmundsson, K. L. Feigl, and T. Arnadottir (2001),Coseismic interferograms of twoMs = 6.6 earthquakes in the south Icelandseismic zone, June 2000, Geophys. Res. Lett. , 28 , 3341–3344,doi:10.1029/2001GL013235.
Pedersen, R., S. Jonsson, T. Arnadottir, F. Sigmundsson, and K. L. Feigl(2003), Fault slip distribution of two June 2000 Mw6.5 earthquakes insouth Iceland estimated from joint inversion of InSAR and GPS measure-ments, Earth Planet. Sci. Lett., 213, 487–502, doi:10.1016/S0012-821X(03)00302-9.
Peltzer, G., and P. Rosen (1995), Surface displacement of the 17 May 1993Eureka Valley, California, earthquake observed by SAR interferometry,Science, 268, 1333–1336, doi:10.1126/science.268.5215.1333.
Peyrat, S., et al. (2006), Tarapaca intermediate‐depth earthquake (Mw 7.7,2005, northern Chile): A slab‐pull event with horizontal fault plane con-strained from seismologic and geodetic observations, Geophys. Res.Lett., 33, L22308, doi:10.1029/2006GL027710.
Peyret, M., J. Chery, Y. Djamour, A. Avallone, F. Sarti, P. Briole, andM. Sarpoulaki (2007), The source motion of 2003 Bam (Iran) earthquakeconstrained by satellite and ground‐based geodetic data, Geophys. J. Int.,169, 849–865, doi:10.1111/j.1365-246X.2007.03358.x.
Peyret, M., F. Rolandone, S. Dominguez, Y. Djamour, and B. Meyer(2008), Source model for the Mw 6.1, 31 March 2006, Chalan‐Chulanearthquake (Iran) from InSAR, Terra Nova, 20, 126–133, doi:10.1111/j.1365-3121.2008.00797.x.
Pritchard, M. E., and E. J. Fielding (2008), A study of the 2006 and 2007earthquake sequence of Pisco, Peru, with InSAR and teleseismic data,Geophys. Res. Lett., 35, L09308, doi:10.1029/2008GL033374.
Pritchard, M. E., M. Simons, P. A. Rosen, S. Hensley, and F. H. Webb(2002), Co‐seismic slip from the 1995 July 30 Mw = 8.1 Antofagasta,Chile, earthquake as constrained by InSAR and GPS observations, Geo-phys. J. Int., 150, 362–376, doi:10.1046/j.1365-246X.2002.01661.x.
Pritchard, M. E., C. Ji, and M. Simons (2006), Distribution of slip from11Mw ≥ 6 earthquakes in the northern Chile subduction zone, J. Geophys.Res., 111, B10302, doi:10.1029/2005JB004013.
Pritchard, M. E., E. O. Norabuena, C. Ji, R. Boroschek, D. Comte,M. Simons, T. H. Dixon, and P. Rosen (2007), Geodetic, teleseismic, andstrong motion constraints on slip from recent southern Peru subductionzone earthquakes, J. Geophys. Res., 112, B03307, doi:10.1029/2006JB004294.
Resor, P. G., D. D. Pollard, T. J. Wright, and G. C. Beroza (2005), Integrat-ing high‐precision aftershock locations and geodetic observations tomodel coseismic deformation associated with the 1995 Kozani‐Grevenaearthquake, Greece, J. Geophys. Res., 110, B09402, doi:10.1029/2004JB003263. (Correction to “Integrating high‐precision aftershocklocations and geodetic observations to model coseismic deformation asso-ciated with the 1995 Kozani‐Grevena earthquake, Greece,” J. Geophys.Res., 112, B11402, doi:10.1029/2007JB005389, 2007.)
Rigo, A., J.‐B. de Chabalier, B. Meyer, and R. Armijo (2004), The 1995Kozani‐Grevena (northern Greece) earthquake revisited: an improvedfaulting model from synthetic radar interferometry, Geophys. J. Int.,157, 727–736, doi:10.1111/j.1365-246X.2004.02220.x.
Ritzwoller, M. H., N. M. Shapiro, A. L. Levshin, E. A. Bergman, and E. R.Engdahl (2003), Ability of a global three‐dimensional model to locate
WESTON ET AL.: INSAR SOURCE PARAMETERS B08408B08408
19 of 20
regional events, J. Geophys. Res., 108(B7), 2353, doi:10.1029/2002JB002167.
Salichon, J., B. Delouis, P. Lundgren, D. Giardini, M. Costantini, andP. Rosen (2003), Joint inversion of broadband teleseismic and interfero-metric synthetic aperture radar (InSAR) data for the slip history of theMw=7.7,Nazca ridge (Peru) earthquake of 12November 1996, J.Geophys.Res., 108(B2), 2085, doi:10.1029/2001JB000913.
Salichon, J., P. Lundgren, B. Delouis, and D. Giardini (2004), Slip historyof the 16 October 1999 Mw 7.1 Hector Mine earthquake (California)from the inversion of InSAR, GPS, and teleseismic data, Bull. Seismol.Soc. Am., 94, 2015–2027, doi:10.1785/0120030038.
Salvi, S., et al. (2000), Modeling coseismic displacements resulting fromSAR interferometry and GPS measurements during the 1997 Umbria‐Marche seismic sequence, J. Seismol., 4, 479–499, doi:10.1023/A:1026502803579.
Satyabala, S. P. (2006), Coseismic ground deformation due to an intraplateearthquake using synthetic aperture radar interferometry: The Mw6.1Killari, India, earthquake of 29 September 1993, J. Geophys. Res.,111, B02302, doi:10.1029/2004JB003434.
Satyabala, S. P., and R. Bilham (2006), Surface deformation and subsurfaceslip of the 28 March 1999 Mw = 6.4 west Himalayan Chamoli earthquakefrom InSAR analysis, Geophys. Res. Lett., 33, L23305, doi:10.1029/2006GL027422.
Savage, J. C. (1987), Effect of crustal layering upon dislocation modeling,J. Geophys. Res., 92, 10,595–10,600, doi:10.1029/JB092iB10p10595.
Savage, J. C. (1998), Displacement field for an edge dislocation in a layeredhalf‐space, J. Geophys. Res., 103, 2439–2446, doi:10.1029/97JB02562.
Schmidt, D. A., and R. Burgmann (2006), InSAR constraints on the sourceparameters of the 2001 Bhuj earthquake, Geophys. Res. Lett., 33,L02315, doi:10.1029/2005GL025109.
Shamir, G., G. Baer, and A. Hofstetter (2003), Three‐dimensional elasticearthquake modelling based on integrated seismological and InSAR data:The Mw = 7.2 Nuweiba earthquake, Gulf of Elat/Aqaba 1995 November,Geophys. J. Int., 154, 731–744, doi:10.1046/j.1365-246X.2003.01978.x.
Simons, M., Y. Fialko, and L. Rivera (2002), Coseismic deformation fromthe 1999 Mw7.1 Hector Mine, California, earthquake as inferred fromInSAR and GPS observations, Bull. Seismol. Soc. Am., 92, 1390–1402,doi:10.1785/0120000933.
Smith, G., and G. Ekström (1996), Improving teleseismic event locationsusing a three‐dimensional earth model, Bull. Seismol. Soc. Am., 86,788–796.
Stich, D., F. de L. Mancilla, D. Baumont, and J. Morales (2005), Sourceanalysis of the Mw 6.3 2004 Al Hoceima earthquake (Morocco) usingregional apparent source time functions, J. Geophys. Res., 110,B06306, doi:10.1029/2004JB003366.
Stramondo, S., et al. (1999), The September 26, 1997 Colfiorito, Italy,earthquakes: Modelled coseismic surface displacement from SAR inter-ferometry and GPS, Geophys. Res. Lett., 26, 883–886, doi:10.1029/1999GL900141.
Syracuse, E. M., and G. A. Abers (2009), Systematic biases in subductionzone hypocenters, Geophys. Res. Lett., 36, L10303, doi:10.1029/2009GL037487.
Tahayt, A., et al. (2009), The Al Hoceima (Morocco) earthquake of 24 Feb-ruary 2004, analysis and interpretation of data from ENVISAT ASARand SPOT5 validated by ground‐based observations, Remote Sens. Envi-ron., 113, 306–316, doi:10.1016/j.rse.2008.09.015.
Talebian, M., et al. (2006), The Dahuiyeh (Zarand) earthquake of 2005February 22 in central Iran: reactivation of an intramountain reverse fault,Geophys. J. Int., 164, 137–148, doi:10.1111/j.1365-246X.2005.02839.x.
Tobita, M., S. Fujiwara, S. Ozawa, P. A. Rosen, E. J. Fielding, C. L. Werner,M. Murakami, H. Nakagawa, K. Nitta, and M. Murakami (1998), Defor-mation of the 1995 North Sakhalin earthquake detected by jERS‐1/SARinterferometry, Earth Planets Space, 50, 313–325.
Wald, D. J., and R. W. Graves (2001), Resolution analysis of finite faultsource inversion using one‐ and three‐dimensional Green’s functions:2. Combining seismic and geodetic data, J. Geophys. Res., 106, 8767–8788,doi:10.1029/2000JB900435.
Wang, H., C. Xu, and L. Ge (2007), Coseismic deformation and slip distri-bution of the 1997 Mw7.5 Manyi, Tibet, earthquake from InSAR mea-surements, J. Geodyn., 44, 200–212, doi:10.1016/j.jog.2007.03.003.
Wright, T. J. (2000), Crustal deformation in Turkey from synthetic apertureradar interferometry, Ph.D. thesis, Fac. of Phys. Sci., Univ. of Oxford,Oxford, U. K.
Wright, T. J., B. E. Parsons, J. A. Jackson, M. Haynes, E. J. Fielding, P. C.England, and P. J. Clarke (1999), Source parameters of the 1 October 1995Dinar (Turkey) earthquake from SAR interferometry and seismic body-wave modelling, Earth Planet. Sci. Lett., 172, 23–37, doi:10.1016/S0012-821X(99)00186-7.
Wright, T. J., Z. Lu, and C. Wicks (2003), Source model for the M w 6.7,23 October 2002, Nenana Mountain earthquake (Alaska) from InSAR,Geophys. Res. Lett., 30(18), 1974, doi:10.1029/2003GL018014.
Wright, T. J., Z. Lu, and C. Wicks (2004a), Constraining the slip distributionand fault geometry of the Mw 7.9, 3 November 2002, Denali fault earth-quake with interferometric synthetic aperture radar and global positioningsystem data, Bull. Seismol. Soc. Am., 94, S175–S189, doi:10.1785/0120040623.
Wright, T. J., B. E. Parsons, and Z. Lu (2004b), Toward mapping surfacedeformation in three dimensions using InSAR, Geophys. Res. Lett., 31,L01607, doi:10.1029/2003GL018827.
A. M. G. Ferreira and J. Weston, School of Environmental Sciences,University of East Anglia, Norwich NR4 7TJ, UK. ([email protected];[email protected])G. J. Funning, Department of Earth Sciences, University of California,
Riverside, CA 92521, USA. ([email protected])
WESTON ET AL.: INSAR SOURCE PARAMETERS B08408B08408
20 of 20