Embed Size (px)
Citation preview

1Copyright 2002 Global Insight, Inc.
Global CoalServices
Prepared by:Dan Watkins
1 February 2005

2Copyright 2002 Global Insight, Inc.
Build a Better Strategic Plan
Understand Coal Prices, Risks, and CompetitionPlan Future Freight RequirementsAnalyze the Impact of New Environmental PoliciesAnticipate Structural Changes within the IndustryReceive an Independent Value-at-Risk Benchmark

3Copyright 2002 Global Insight, Inc.
Drawing Upon our Strengths

4Copyright 2002 Global Insight, Inc.
Global Coal Services

5Copyright 2002 Global Insight, Inc.
Coal Trade Services
Global Coal Market QuarterlyA detailed quarterly assessment of coal market fundamentals, providing:
• An in-depth analysis of recent coal and freight spot price developments• A look at key factors driving short-term market dynamics and how they relate to
underlying long-term trends• Quarterly FOB, freight and CIF price forecasts out to 2007• Comparison of forecasts versus TFS and Global Coal forward curves

6Copyright 2002 Global Insight, Inc.
Coal Trade Services
Global Steam Coal Trade and Price ReviewA comprehensive long-term view of coal market fundamentals, including:
• 20-year forecasts of coal demand across 40 countries• Base case and alternative scenario forecasts• Projections of coal supply costs from all existing and potential major coal exporters• Detailed analysis of future risks to the forecasts and the impact of structural changes
on the industry

7Copyright 2002 Global Insight, Inc.
Coal Trade Services
Global Coal Monthly MonitorsThis email service tracks FOB and freight prices for South Africa, Colombia, and Australia covering a rolling two year period. Subscribers also receive Global Insight’s custom index which is comprised of a basket of coals made up of 60% South African, 30% Colombian, and 10% Australian.ConferencesEach year, Global Insight's Coal Industry Perspective conference provides an opportunity to hear our views of the market and to exchange view with a broad range of industry peers.
Custom PresentationsGlobal Insight's international team of coal experts are available to answer questions regarding the industry or deliver customized presentations on the industry.

8Copyright 2002 Global Insight, Inc.
Country Coverage

9Copyright 2002 Global Insight, Inc.
Building a Better Forecast
Coal Price Forecasting Methodology
Supply Chain Approach : We analyze each component of the supply chain separately in order to create a more robust top-line number
Netherlands Germany
Mine Cost Return + ProfitRail & Port Ocean FreightPort & Barge
Price
(indicative data)
Delivered price
CIF ARA price
FOB price

10Copyright 2002 Global Insight, Inc.

11Copyright 2002 Global Insight, Inc.
ARA CIF Coal Price
Real coal prices have been on the decline for some time due to productivity gains and exchange rate movements
. 0
10
20
30
40
50
60
70
1987
1989
1991
1993
1995
1997
1999
2001
2003
2005
2007
2009
2011
2013
2015
2017
2003 US$/tce
C&F ARA EU Historical Global Insight Forecast C&F ARALinear ( C&F ARA EU Historical )
Historical Trend Line
16 year average (1987 - 2002) = 52.58
Global Insight predicted a large market inflection point for 2004

12Copyright 2002 Global Insight, Inc.
Mine-mouth Cost Analysis
Geology, exchange rates, and productivity all contribute to relative cost differences. In China, people substitute for technology, making coal production more expensive.
0
5
10
15
20
25
30
35
40
0 10 20 30 40 50 60 70 80 90 100Production in Million tonnes
China
AustraliaIndonesia
Colombia South Africa
Poland
Russia
Coal Production Costs
Costs
We produce coal supply curves for all price setting countries

13Copyright 2002 Global Insight, Inc.
Mine Cost / Port & Rail CostProduction Costs in Australia
Productivity gains reduce the wage cost element
Other mine costs become a higher percentage of mine cost
Port and haulage account for almost 50% of total cost
Royalty assumed flat in nominal terms
0
10
20
30
40
2003
2004
2005
2006
2007
2008
2009
2010
2011
2012
2013
2014
2015
2016
2017
2018
Mine Wages Other Mine CostsR & R Charge HaulagePort & Rail Royalty
14Copyright 2002 Global Insight, Inc.
How the Market Works A Review of 2003
In this price setting international ocean sea freight rates play a significant role. In 2003 & into 2004 market failed to operate correctly due to high freight.
AtlanticDemand
205
26/10
45/8
66 512
1592
736
74
14
Pacific Demand 273
South Africa sets the price in the Atlantic in the first instant but price is capped by competition from the Pacific.
Australia is the price driver in the Pacific and so ultimately becomes the World price driver.
15Copyright 2002 Global Insight, Inc.
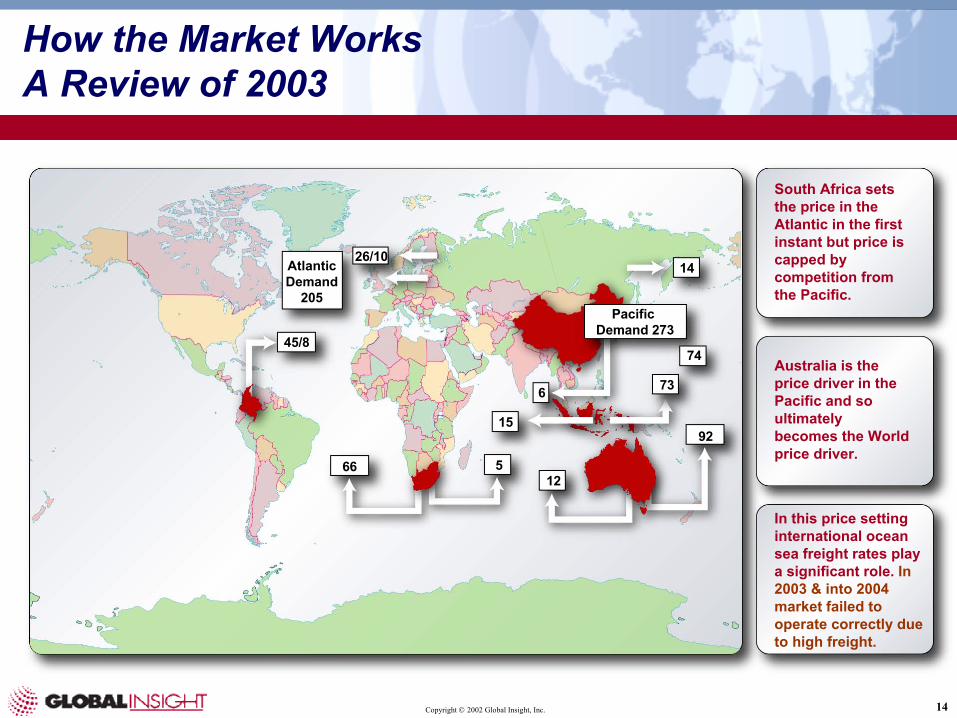
Producer Return and ProfitDemand for Coal in Power Generation - by type in 2002
Coal in the fuel mix for powergeneration varies from around 50% in the U.S.A. to less than 10% in France
0%10%20%30%40%50%60%70%80%90%
100%
USA JP DE UK FR IT SP NL
Nuclear Coal Lignite Gas Oil Renewables

16Copyright 2002 Global Insight, Inc.
Producer Return and ProfitMedium-term supply/demand balances

17Copyright 2002 Global Insight, Inc.
The 5 major producers do not have as high a share of production on a global basis as is often thought
Producer Power – Shares 2000 & 2003
0%
10%
20%
30%
40%
50%
60%
70%
80%
90%
100%
2000 2003 2000 2003 2000 2003 2000 2003 2000 2003South Africa Australia Colombia Venezuela Indonesia
Anglo Coal BHP Billiton Glencore Rio Tinto Xstrata

18Copyright 2002 Global Insight, Inc.
Producer Return and ProfitProducer Market Power in 2003
0
5
10
15
20
25
30
35
40
45
Fob Fob Fob Fob Fob Fob Fob Fob Fob Fob Fob FobAustralia South Africa Colombia
US$/tbasis6000nar
Fob Cash Cost Capital Cost Contract Prices 2003High Spot Price 2003 Low Spot Price 2003

19Copyright 2002 Global Insight, Inc.
Exceptional conditions in 2003-04 caused the freight market to break out of the long term US$ 7+/- 25% band
Freight trends – S. Africa to ARA
Average Annual voyage Rates - RBCT to ARA
0
5
10
15
20
25
30
1990 1991 1992 1993 1994 1995 1996 1997 1998 1999 2000 2001 2002 2003 2004
US$/t
RBCT- ARA 1990-2003 Average 1990-2003
Average 1990-2003 plus 25% Average 1990-2003 minus 25%
Average Jan-May 2004 High - January 2004

20Copyright 2002 Global Insight, Inc.
Ocean FreightChina’s Contribution to a Strong Market
China Bulk Imports/Exports
Coal Exp
Ore Imports
Steel Imp
0
20,000
40,000
60,000
80,000
100,000
120,000
140,000
160,000
180,000
200,000
220,000
240,000
260,000
280,000
300,0001
99
0
19
91
19
92
19
93
19
94
19
95
19
96
19
97
19
98
19
99
20
00
20
01
20
02
20
03
Mil
lio
n T
on
nes
Coal Exp Ore Imports Steel Imp Coal Import CSP

21Copyright 2002 Global Insight, Inc.
Freight Market – Fleet Additions
Bulk Carrier Scheduled Newbuildings
0.0
1.0
2.0
3.0
4.0
5.0
6.0
7.0
8.0
9.0
10.0
10-40 Handysize 40-60 Handymax 60-80 Panamax +80 Capesize
Mil
lio
n D
wt
For Delivery 2004 DwtFor Delivery 2005 DwtFor Delivery 2006 DwtFor Delivery 2007 DwtFor Delivery 2008+ Dwt

22Copyright 2002 Global Insight, Inc.
For Additional Information,
Dan WatkinsXXX-XXX-XXXX


![Draft Manual [XXX] - AER · DRAFT Manual [XXX]: Public Involvement 3 construct, operate, and close. As Alberta’s sole regulator of oil, natural gas, oil sands, and coal development,](https://img.dokumen.tips/doc/110x75/5e346cec7c9cca496d3084c5/draft-manual-xxx-aer-draft-manual-xxx-public-involvement-3-construct-operate.jpg)