Embed Size (px)
Citation preview
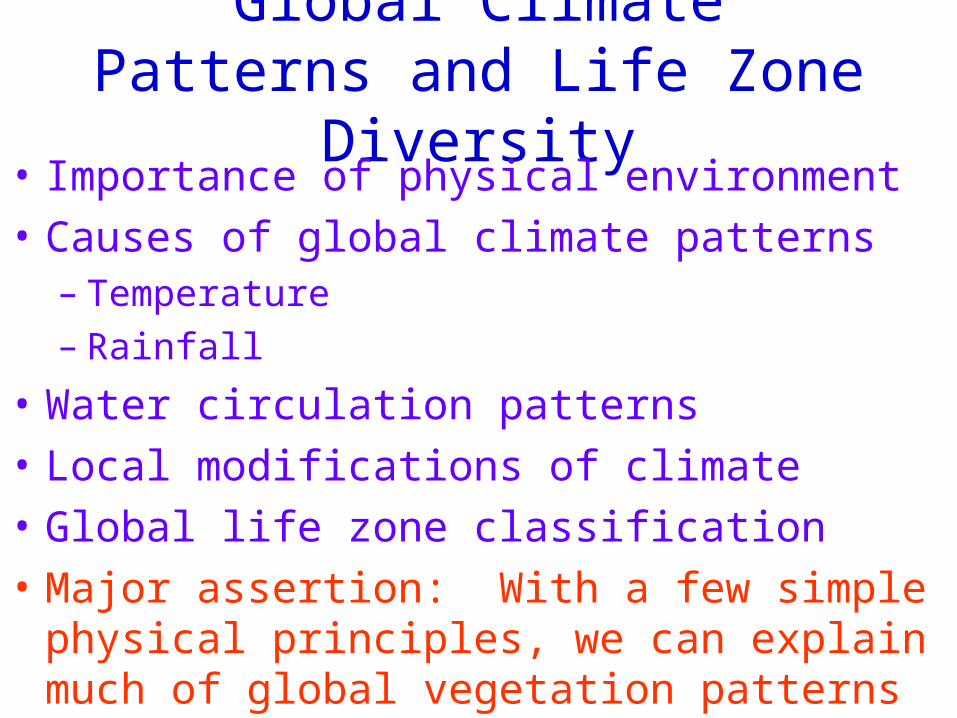
Global Climate Patterns and Life Zone Diversity
• Importance of physical environment
• Causes of global climate patterns– Temperature– Rainfall
• Water circulation patterns
• Local modifications of climate
• Global life zone classification
• Major assertion: With a few simple physical principles, we can explain much of global vegetation patterns
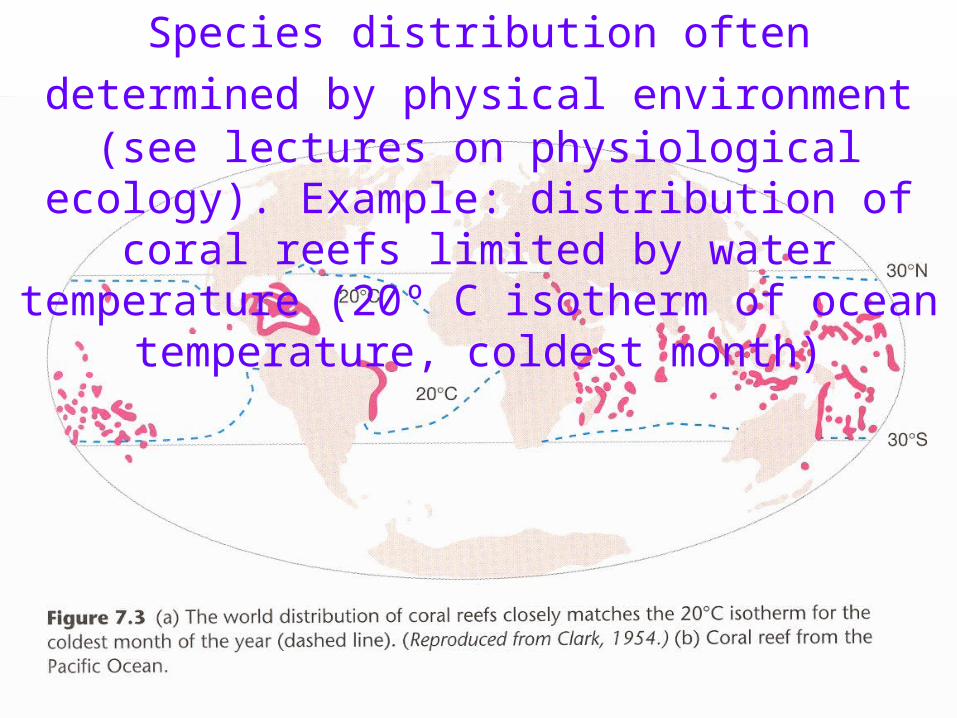
Species distribution often determined by physical
environment (see lectures on physiological ecology). Example: distribution of coral reefs limited by water temperature (20º C isotherm of ocean temperature,
coldest month)
The next question: What determines the characteristics of the physical environment,
particularly climate & air/water currents?
• Air & water temperatures?
• Seasonality?
• Rainfall patterns?
• Air & water circulation patterns?
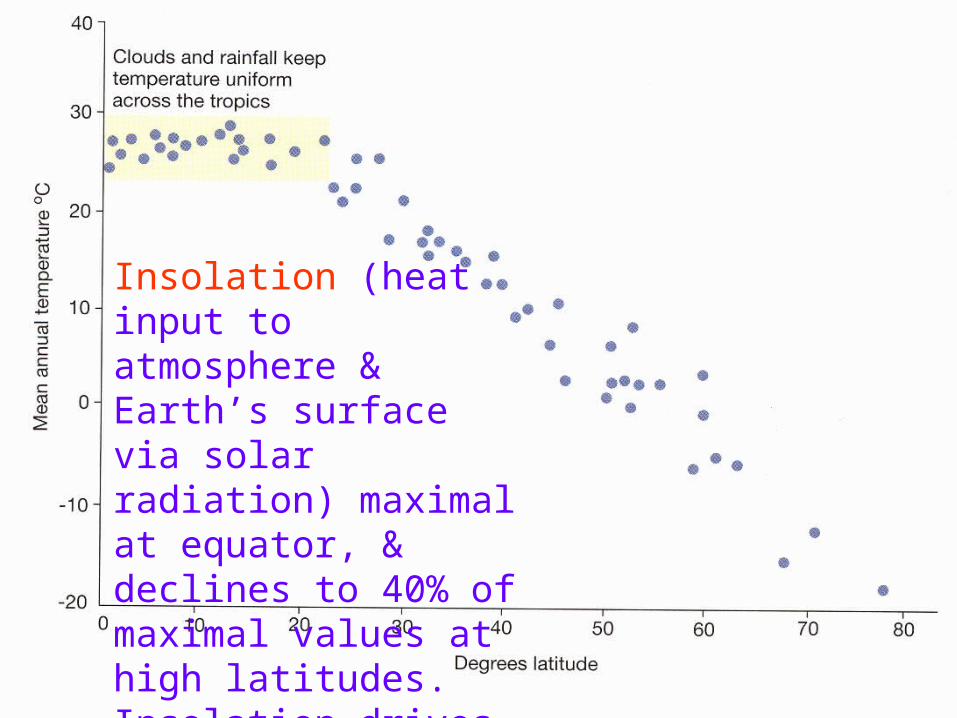
Insolation (heat input to atmosphere & Earth’s surface via solar radiation) maximal at equator, & declines to 40% of maximal values at high latitudes. Insolation drives mean annual temperatures
Two basic causes of greatest insolation at equator:
• Note: insolation is different from insulation • Solar radiation travels shorter distance through
atmosphere (less absorption, scatter, reflection) at equator than higher latitudes
• More direct (maximum = 90º angle of input) solar radiation (including visible light waves) hitting Earth at equator. Thus, Given amount of solar radiation illuminates less land (atmosphere) area at equator (see next 2 slides).
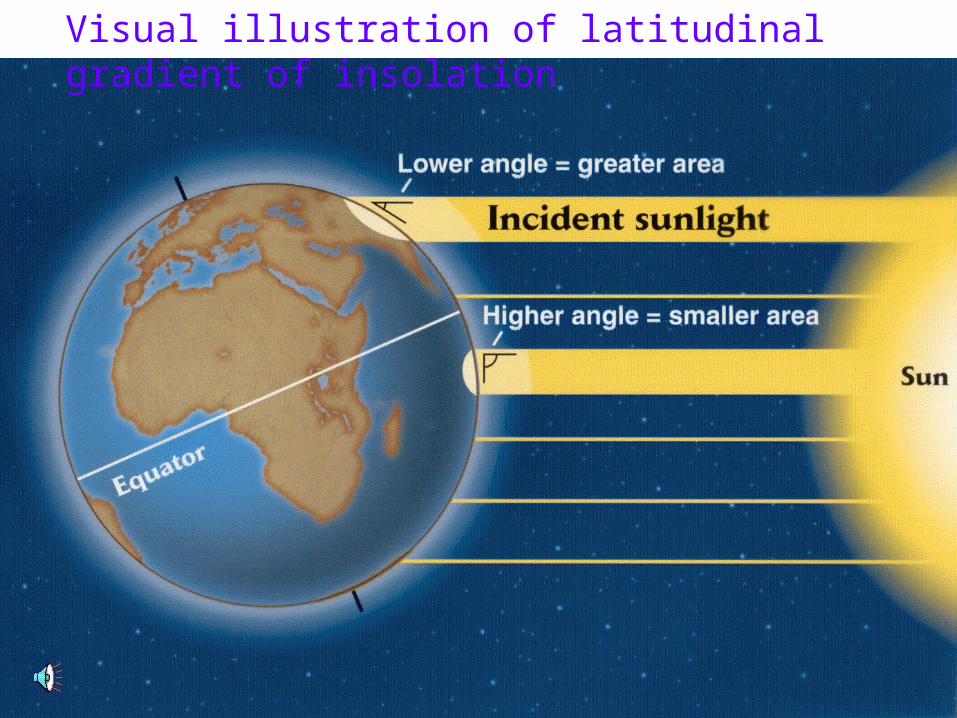
Visual illustration of latitudinal gradient of insolation
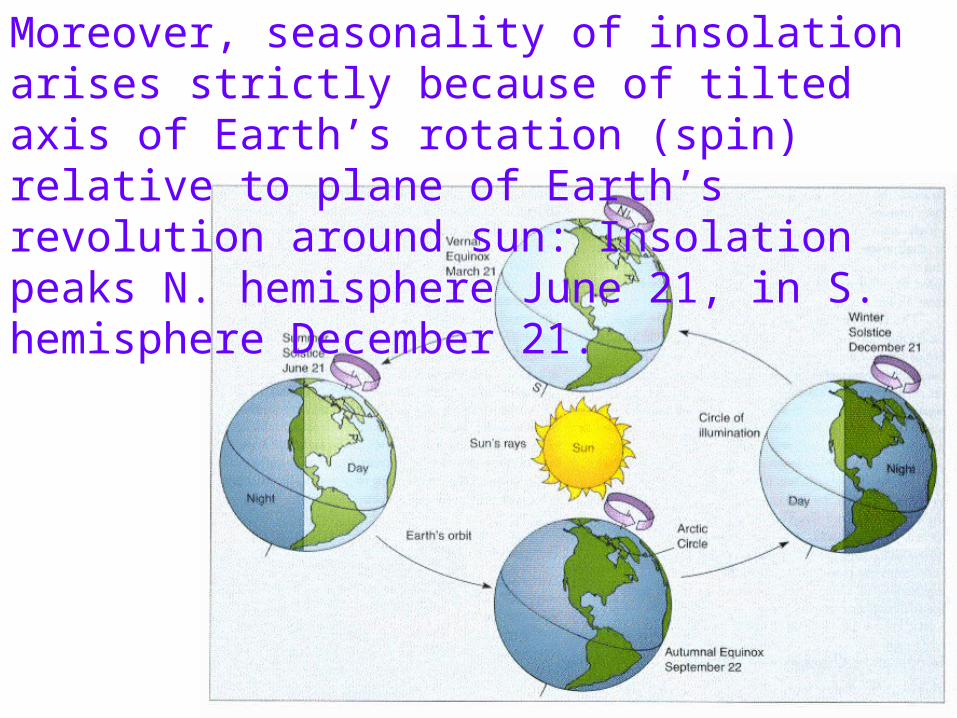
Moreover, seasonality of insolation arises strictly because of tilted axis of Earth’s rotation (spin) relative to plane of Earth’s revolution around sun: Insolation peaks N. hemisphere June 21, in S. hemisphere December 21.
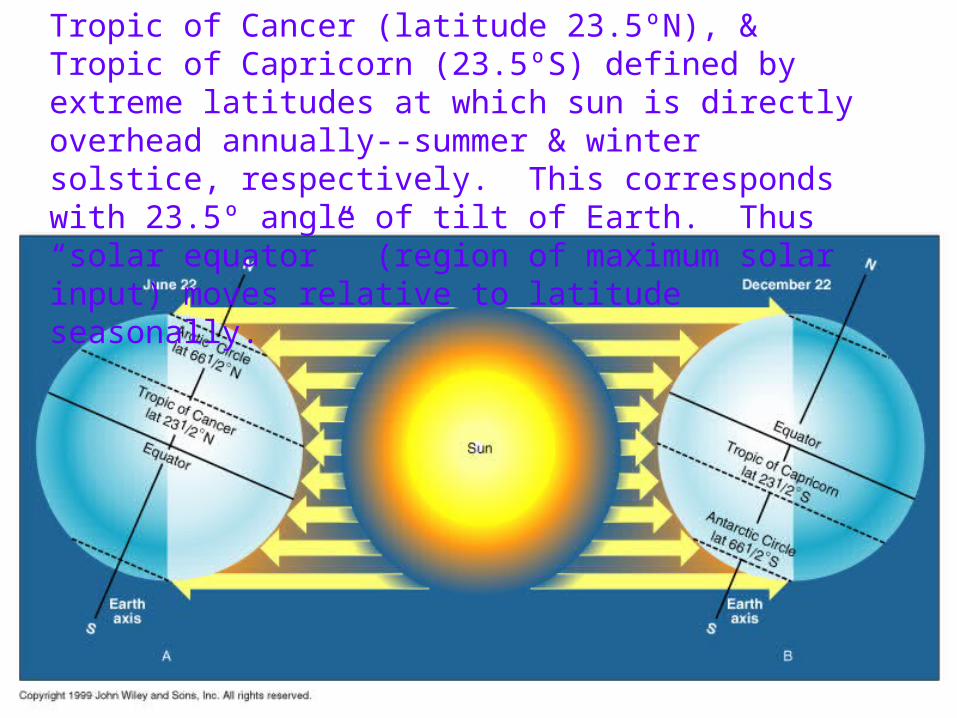
Tropic of Cancer (latitude 23.5ºN), & Tropic of Capricorn (23.5ºS) defined by extreme latitudes at which sun is directly overhead annually--summer & winter solstice, respectively. This corresponds with 23.5º angle of tilt of Earth. Thus “solar equator” (region of maximum solar input) moves relative to latitude seasonally.
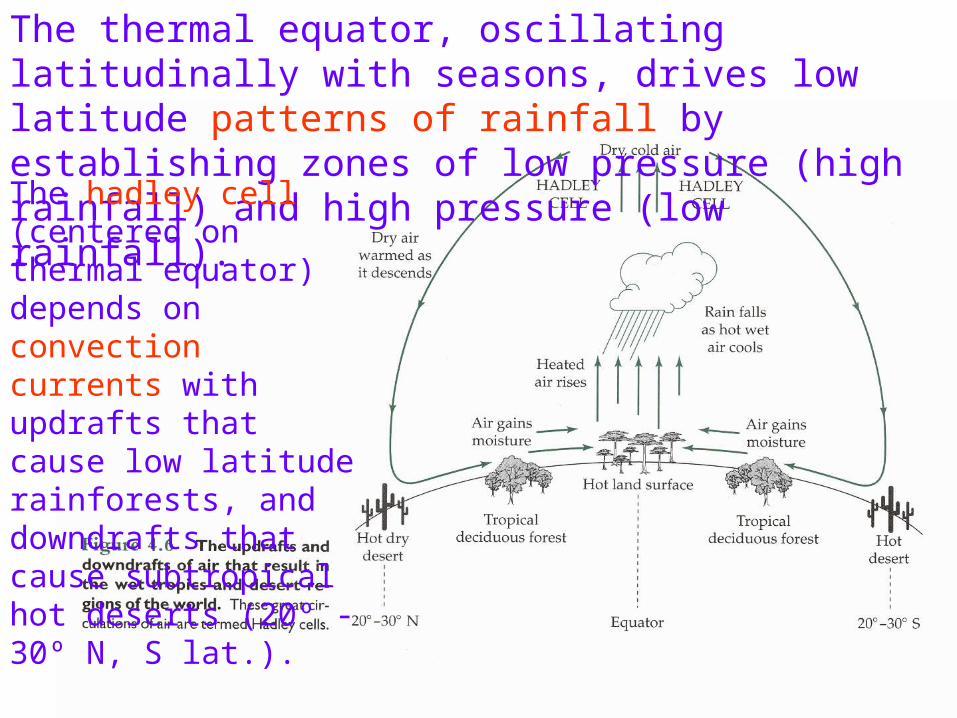
The thermal equator, oscillating latitudinally with seasons, drives low latitude patterns of rainfall by establishing zones of low pressure (high rainfall) and high pressure (low rainfall).
The hadley cell (centered on thermal equator) depends on convection currents with updrafts that cause low latitude rainforests, and downdrafts that cause subtropical hot deserts (20º - 30º N, S lat.).

Major latitudinal displacements of surface air currents: convection currents drive Hadley cells, pulling air at surface into Inter-Tropical Convergence Zone, ITCZ); Ferrel Cells driven by low pressure zone at 20º-30º lat.; Midlatitude westerlies converge into jet stream; polar cells driven by high pressure (cold) flows out of polar region along Earth’s surface towards south.
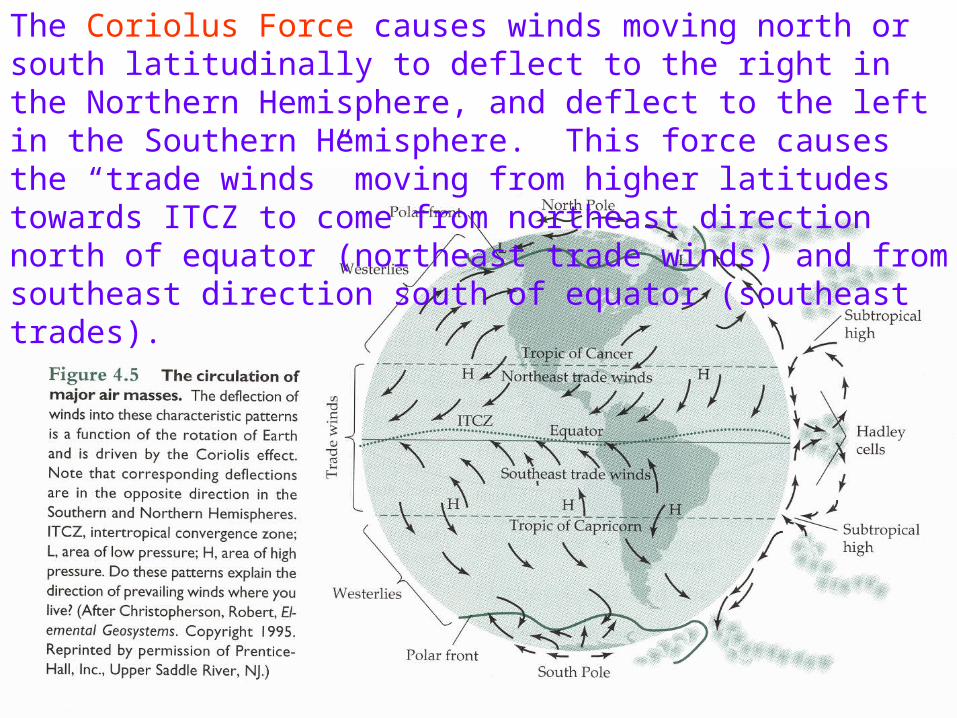
The Coriolus Force causes winds moving north or south latitudinally to deflect to the right in the Northern Hemisphere, and deflect to the left in the Southern Hemisphere. This force causes the “trade winds” moving from higher latitudes towards ITCZ to come from northeast direction north of equator (northeast trade winds) and from southeast direction south of equator (southeast trades).
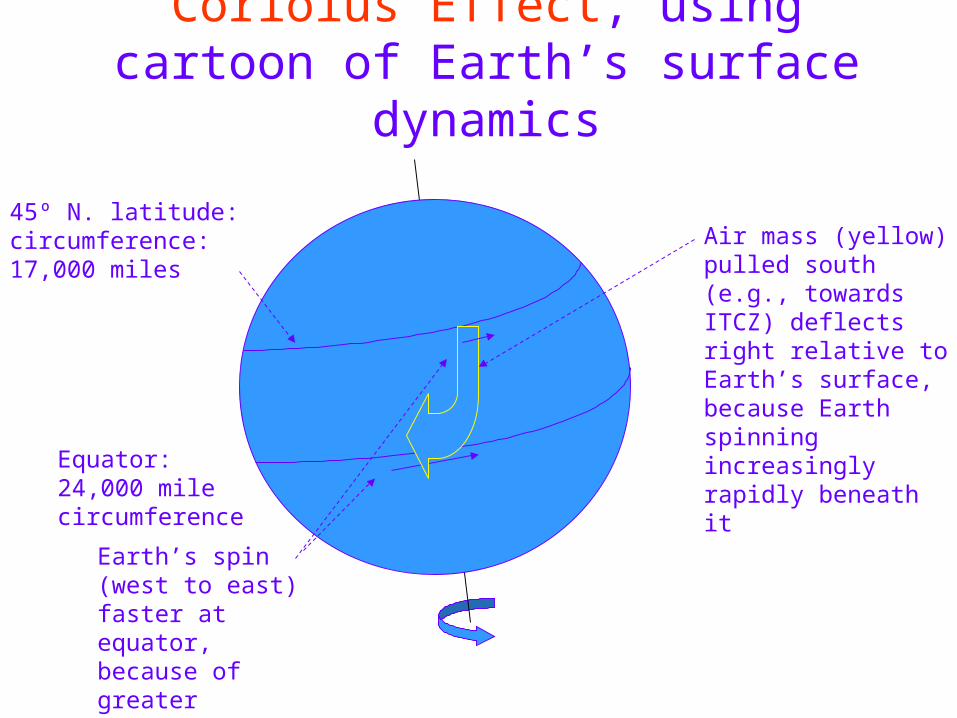
Coriolus Effect, using cartoon of Earth’s surface dynamics
Equator: 24,000 mile circumference
45º N. latitude: circumference: 17,000 miles
Earth’s spin (west to east) faster at equator, because of greater circumference traveled per 24 hour day
Air mass (yellow) pulled south (e.g., towards ITCZ) deflects right relative to Earth’s surface, because Earth spinning increasingly rapidly beneath it
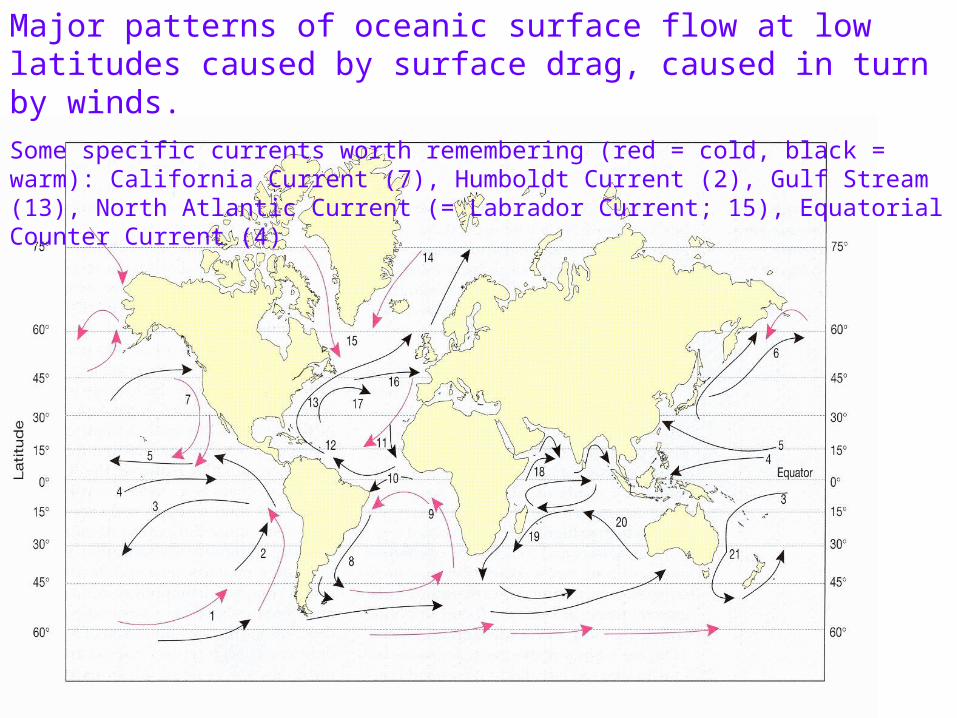
Major patterns of oceanic surface flow at low latitudes caused by surface drag, caused in turn by winds.
Some specific currents worth remembering (red = cold, black = warm): California Current (7), Humboldt Current (2), Gulf Stream (13), North Atlantic Current (= Labrador Current; 15), Equatorial Counter Current (4)
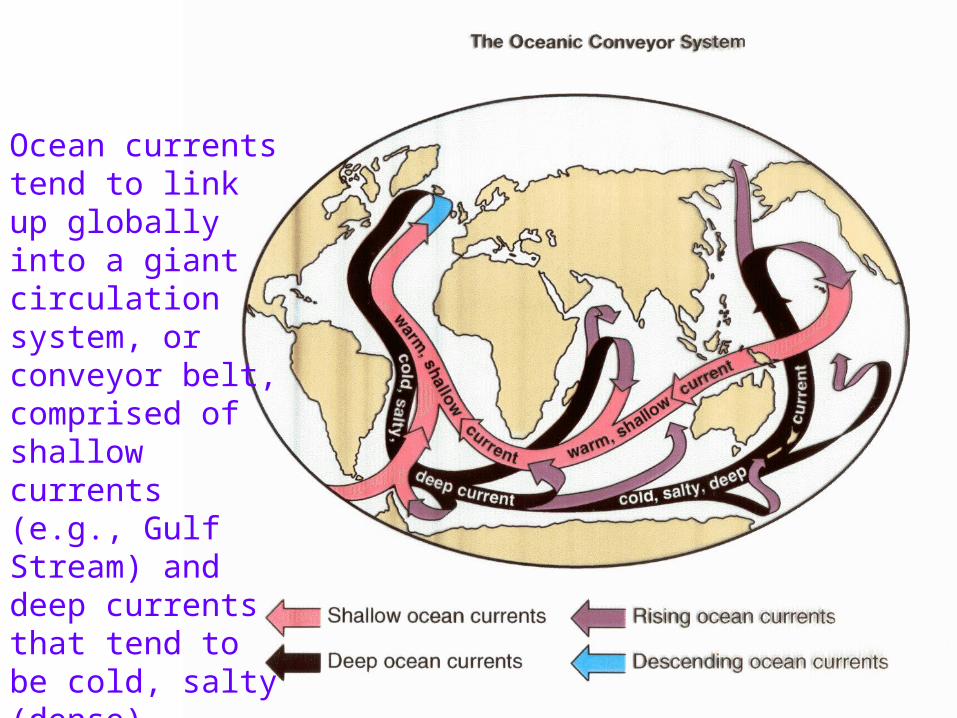
Ocean currents tend to link up globally into a giant circulation system, or conveyor belt, comprised of shallow currents (e.g., Gulf Stream) and deep currents that tend to be cold, salty (dense).

Oceanic Conveyor Belt Circulation• Gulf Stream pulls warm, surface water from across
Southern Africa, Asia• Where Gulf Stream meets North Atlantic (Labrador)
Current it is cooled and sinks (aided by its saltiness from evaporation of water at lower latitudes)
• This sinking current circulates back south and east at great depths
• One consequence: this current transports heat to high latitudes, greatly moderating climate of North Atlantic region (e.g., parts northwest Europe)
• Global warming could disrupt this current, climate
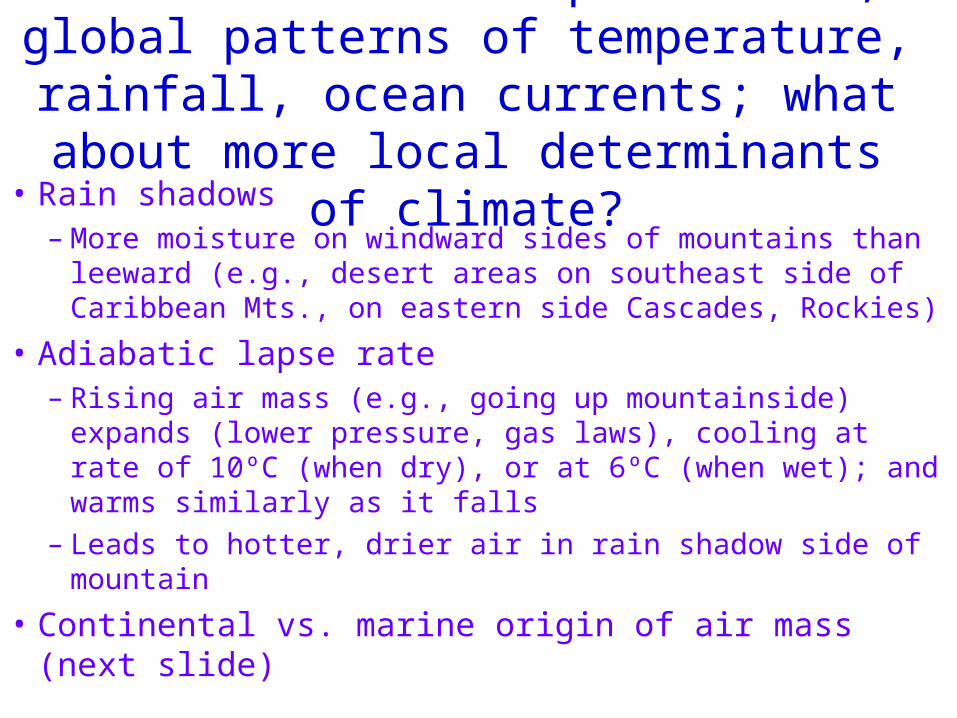
Previous slides depict broad, global patterns of temperature, rainfall, ocean currents; what about more local determinants of climate?
• Rain shadows– More moisture on windward sides of mountains than
leeward (e.g., desert areas on southeast side of Caribbean Mts., on eastern side Cascades, Rockies)
• Adiabatic lapse rate– Rising air mass (e.g., going up mountainside) expands
(lower pressure, gas laws), cooling at rate of 10ºC (when dry), or at 6ºC (when wet); and warms similarly as it falls
– Leads to hotter, drier air in rain shadow side of mountain
• Continental vs. marine origin of air mass (next slide)
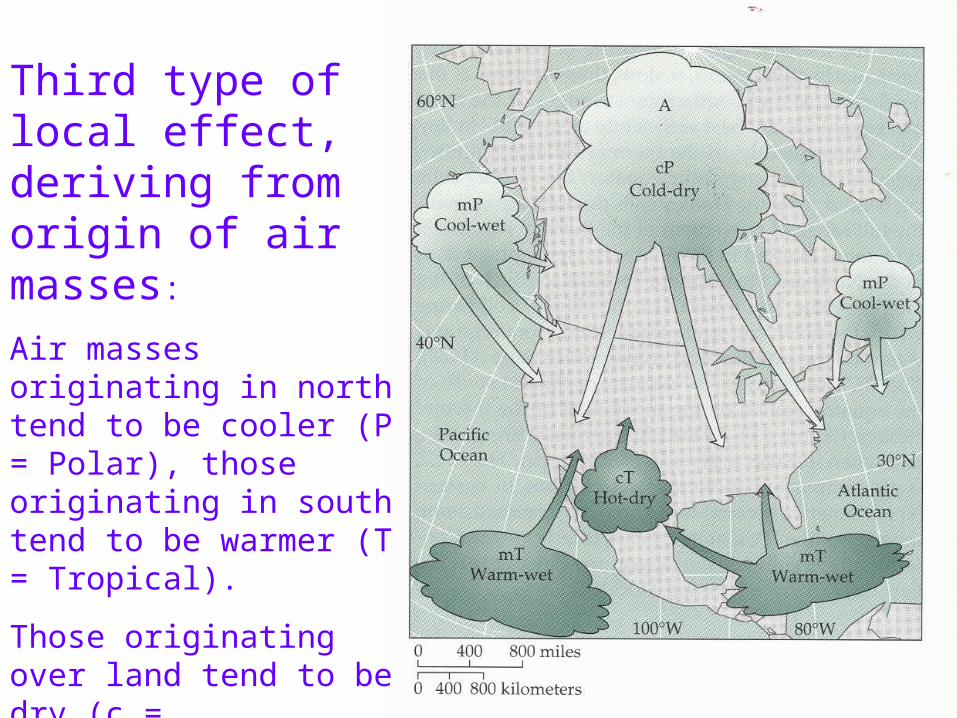
Third type of local effect, deriving from origin of air masses:
Air masses originating in north tend to be cooler (P = Polar), those originating in south tend to be warmer (T = Tropical).
Those originating over land tend to be dry (c = continental), those over water tend to be wet (m = marine).

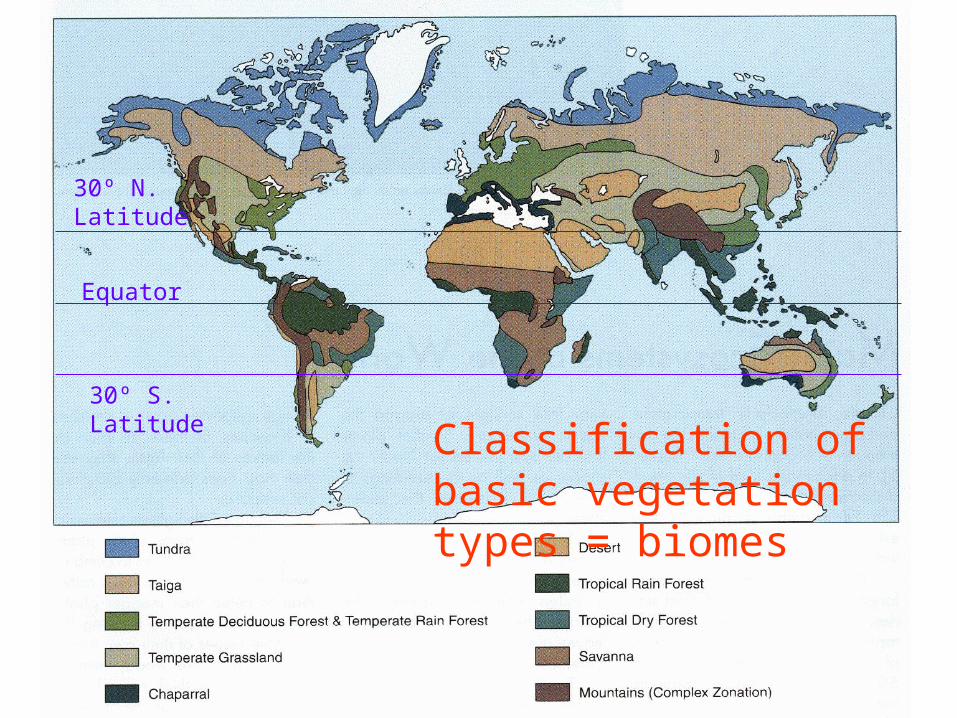
The foregoing principles and forces explain much of the global patterns in vegetation types (depending on temperature, moisture): Wetter vegetation (forests) green, drier (grassland, desert) tan to brown, cold (arctic, alpine) areas white.
Equator
30º N
30º S
Equator
30º S. Latitude
30º N. Latitude
Classification of basic vegetation types = biomes
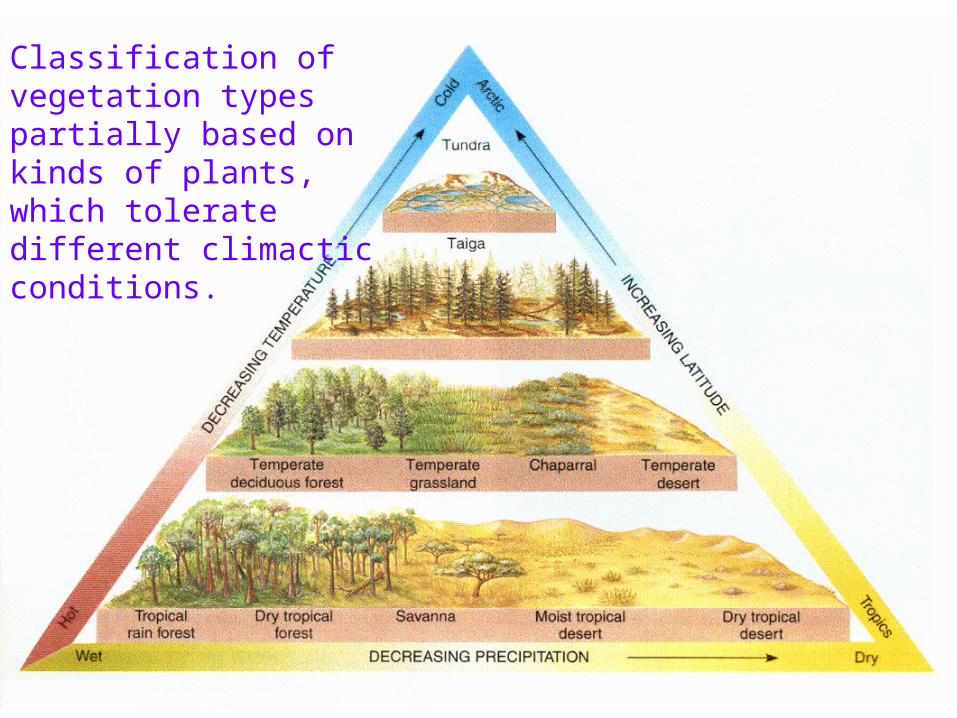
Classification of vegetation types partially based on kinds of plants, which tolerate different climactic conditions.
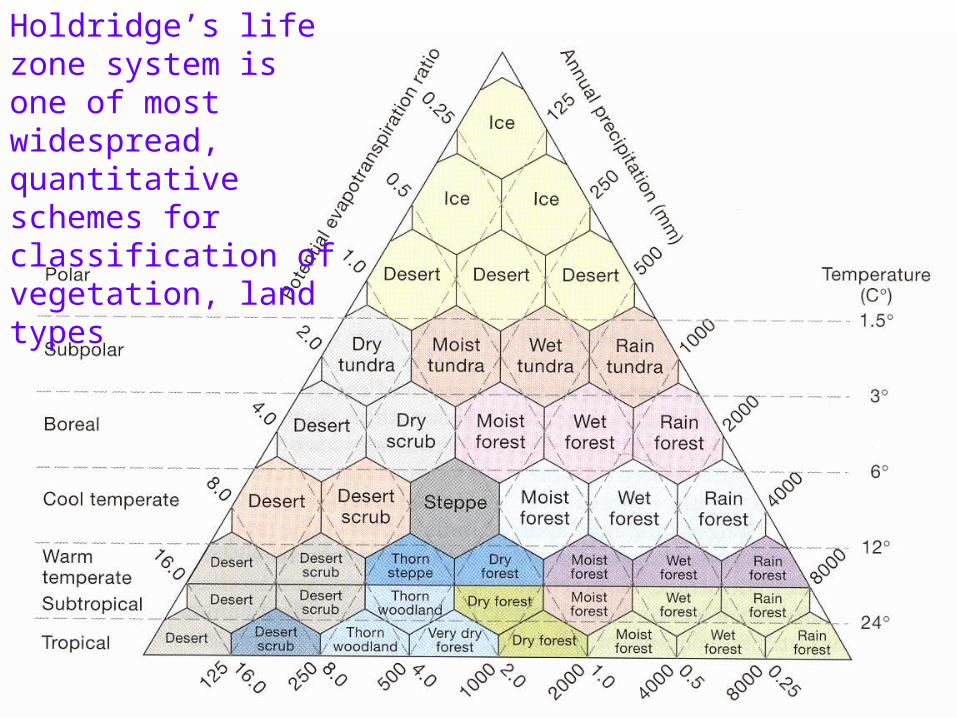
Holdridge’s life zone system is one of most widespread, quantitative schemes for classification of vegetation, land types
Holdridge’s Life Zone System• Assumptions
– Temperature, rainfall most important factors determining ecosystem types (biomes)
– Vegetation assumed to be independent of animals
• Three independent axes– Mean annual biotemperature = average monthly
temperature for all months with average > 0ºC– Annual precipitation (mm), including rain and snow– Potential evapotranspiration ratio = ratio of potential
evapotranspiration (= transpiration + evaporation) to actual evapotranspiration (which is limited by water availability)
Holdridge’s Life Zone System, cont.• Deductions/conclusions
– More types of vegetation found at warmer temperatures, because of zero biotemperatures at high latitudes
– Deserts occur over wide range of temperatures, latitudes– Rainforests also occur at different latitudes
• Criticisms of Holdridge’s scheme– Ignores species interactions (e.g. effects of browsers)– Ignores disturbance types, e.g. fire (prairie, longleaf pine)– Ignores effects of history on soils– Ignores salinity (salt marsh, mangroves), limiting nutrients
(serpentine soils), soil physical characteristics (pines on porous sandy soils)
Conclusions• With a few basic physical principles (convection
currents, radiant energy, gas laws) one can explain major patterns of temperature, rainfall, seasonality, ocean currents on Earth’s surface.
• No one ecosystem type dominates globe, but instead different types vegetation adapted to different climatic conditions
• Classification schemes for vegetation types have been developed, of which Holdridge’s Life Zone System is one of best used (particularly at low latitudes)