Embed Size (px)
Citation preview
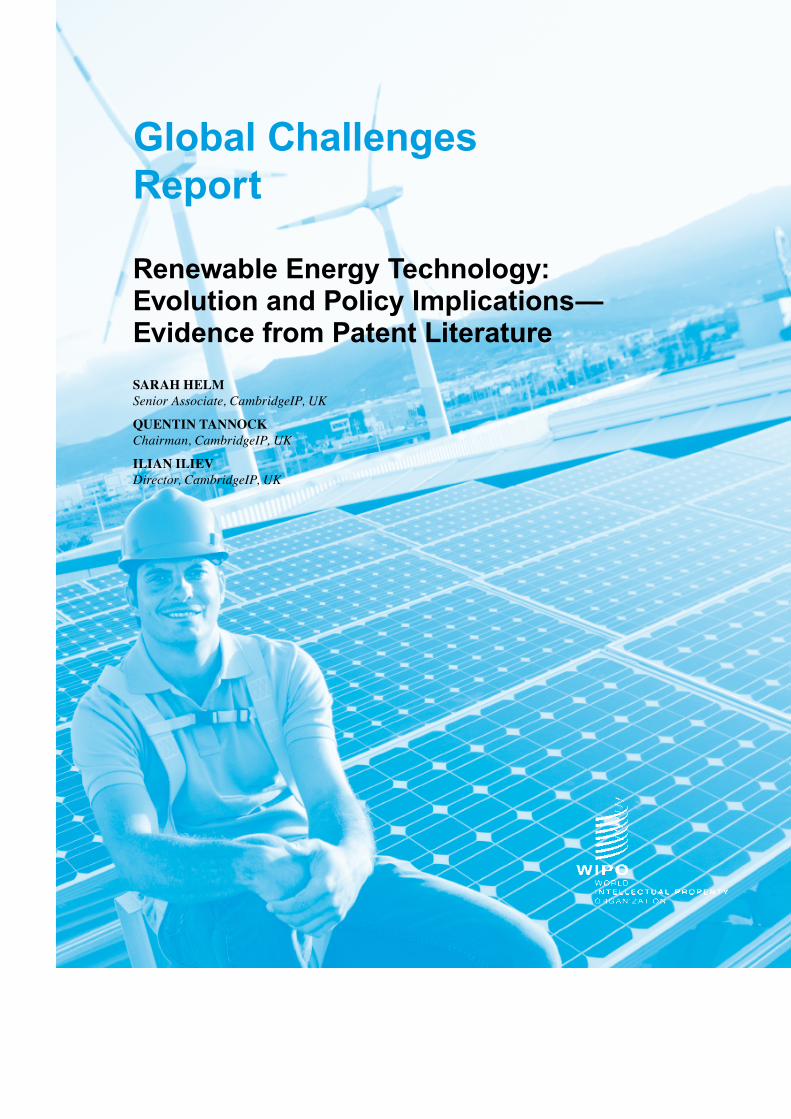
Global Challenges Report
Renewable Energy Technology: Evolution and Policy Implications—Evidence from Patent Literature SARAH HELM Senior Associate, CambridgeIP, UK
QUENTIN TANNOCK Chairman, CambridgeIP, UK
ILIAN ILIEV Director, CambridgeIP, UK

Abstract This Global Challenges Report analyzes the patent landscapes of four Climate Change Mitigation Technologies (CCMTs) to inform policy discussions by providing empirical evidence of innovation trends and technology ownership.
The four CCMTs are biofuels, solar thermal, solar photovoltaic (PV) and wind energy. A broad market analysis of renewables and their policy frameworks are discussed in Section 2, followed by the usual scope and methodology section. The individual patent landscape analysis for each of the CCMTs is given in Sections 4 to 7, identifying and analyzing the range of patent activity, patent filings trends, top technology owners, patent concentrations, and market trends. Each of these sections also includes anecdotal case studies to illustrate various features of the technology marketplaces and to situate the patent data into the context of market activity and business strategies.
The report includes data from 1975-2011 and compares the 1975-2005 period to the 2006-2011 period. In some respect, the present report is an extension of the 2009 Chatham House report, Who owns our low carbon future? Intellectual Property and Energy Technologies, which linked patent filing rates and ownership of technology with market deployment of CCMTs. That report essentially ends with 2006 data (hence the cutoff choice of the present report).
A companion Global Challenges Brief also discusses key implications and considerations for policy and policymakers.

Table of Contents p—3 Section 1 Executive Summary
p—9 Section 2 Introduction
p—12 Section 3 Scope and Methodology
p—15 Section 4 Biofuel Patent Landscape
p—21 Section 5 Solar Thermal Patent Landscape
p—25 Section 6 Solar PV Patent Landscape
p—29 Section 7 Wind Energy Patent Landscape
p—34 Section 8 Conclusions
p—36 Acknowledgements
p—37 Annex Background on Patent Intelligence


p—3
Section 1: Executive SummaryClimate change is one of the biggest global challenges of our time. In this study, the patent landscapes of four Climate Change Mitigation Technologies (CCMTs) are analyzed to inform policy discussions by providing evi-dence of innovation trends, technology ownership and other facts from the global patent literature. The follow-ing CCMTs are analyzed:
• Biofuels (technologies for the production of fuel of non-fossil origin1,2) are a relatively young family of technologies, with many universities participating in research.
• Solarthermal,known for high infrastructure costs with the consequence that major players are large companies.
• Solarphotovoltaic(PV), a field with relatively few established players but significant disruptive poten-tial from new players, and solid funding for research from both governmental and venture capital sources. Solar PV is also characterized by recent dramatic falls in the cost of PV modules (having fallen by 50% in 2011 alone).
• Wind energy is the most mature of the four areas.
To place the patent landscape report in context, investment in renewable energy and fuels in 2012 stood at $244 billion, which is nevertheless down 12% from the previous year’s record levels. Solar remains the dominant sector: when solar PV and solar thermal are aggregated, investment comes to $140 billion in 2012. Biofuels is the lowest with $5 billion investment.
Global patent activity in each of the CCMTs has been identified, analyzed and benchmarked against global patent activity in all technologies. The report considers the 1975-2005 period and the 2006-2011 period and analyzes recent industry and technology shifts during the latter period. In some respect, the present report is an extension of the 2009 Chatham House report, Who owns our low carbon future? Intellectual Property and Energy Technologies3, which links patent filing rates and ownership of technology with market deployment of CCMTs. That report ends with data from 2006-2007 (hence the cutoff choice of the present report).
1.1 SIgNIfICANT INCREASE IN PATENT ACTIVITy
Patent activity within biofuels, solar thermal, solar PV and wind energy have increased significantly in recent years. The volume of patents filed in these CCMTs over the last five to six years for which comprehensive data is available (2006–2011) exceeds the volume of patents filed in these areas in the previous 30 years.
Record numbers of patents have been filed globally in recent years. Indeed, 2011 marked the first time that patent applications filed through the Patent Cooperation Treaty (PCT) exceeded the 2 million mark4 with 182,000 filed in 2011 alone5 and over 200,000 in 20136. Patent filings around CCMTs are growing at an even faster rate than the global average, indicating the high pace of commercial innovation in CCMTs.
Rates of patent filings in the biofuels, solar thermal, so-lar PV and wind energy sectors began to rise in the late 1990s (Figure 1). Since 2006 this increase has been particularly striking across all four CCMT focus areas, especially solar PV. The average annual growth rate of patent filings in each of the focus CCMTs exceeds the global average for all inventions. Combined, this average growth rate in the period 2006-2011 stands at 24% while the global average for all technologies is 6% (Table 1). The growth in patenting rates in the respec-tive technology fields is likely a response to market conditions including increased levels of R&D invest-ment, shifts in policy incentives such as feed-in-tariffs, and technological advances, such as cost reductions in manufacturing.
Figure 2 compares the number of patent families filed in the four CCMT patent landscapes. The analysis is based on number of patent families for periods 1975-2005 and 2006-2011. Solar thermal energy saw the highest number of inventions filed in proportion to the three other areas from 1975-2005, while both solar PV and wind energy saw an increase in their share of the proportion of CCMTs filed from 2006-2011. Each patent family may be regarded as a proxy for an innovation, making solar PV the most commercially in-novative area of technology as measured by volume of patented innovations.
China accounts for the highest percentage of patent filings in three of the four CCMT patent areas for the period 2006-2011 (biofuels, solar thermal and solar PV). The contribution from China is particularly strong in solar thermal, with China accounting for around 55% of Office of First Filing (OFF) applications in that period.

p—4
Table 1:gLOBAL PATENT fILINg RATES fROM 1975-2011
Technology classification Average annual growth rate 1975-2005 2006-2011 Biofuels 9% 13%Solar thermal 3% 24%Solar PV 10% 22%Wind 9% 27%Global patent filings 3% 6%
Solar Thermal
38%
Solar PV31%
Wind17%
Biofuels14% Solar
Thermal25%
Solar PV41%
Wind23%
Biofuels11%
1975-2005 2006-2011
Figure 2: TECHNOLOgy LANdSCAPE COMPARISON: PATENT fAMILIES fILEd fROM 1975-2011
0
200000
400000
600000
800000
1000000
1200000
1400000
1600000
1800000
0
1000
2000
3000
4000
5000
6000
7000
8000
9000
10000
Paten
t fam
ilies
Biofuels Solar thermal energy Solar PV Wind Global patent filings
Patent filing year
Figure 1:gLOBAL PATENT fAMILy fILINg TRENdS fOR SELECTEd CCMTS fROM 1975-2011

p—5
1.2 gROWINg INTERNATIONALIZATON Of MARKETS
Analysis of trends in patent filing jurisdictions can pro-vide an indication of where innovation is occurring, as well as current and potential markets where a technol-ogy is likely to be marketed, licensed or produced.
Table 2 demonstrates the marked rise in the use of the PCT system across all four of the focus areas. This is possibly indicative of the increasingly global nature of markets for patented technologies in these focus areas. Since 2006, over 30% of the patents filed within the four CCMT areas continue to be filed through the PCT. This is nearly double the rate of PCT filings in the 1975-2005 period.
1.3 MANy NEW ENTRANTS IN THE LIST Of TOP 20 PATENT HOLdERS
Data on patent holdings by type of institution (public or private) and the evolution of patent filing activi-ties in a particular technological area provides useful information about industry structures and value and supply chains. Identification of technology owners and the emerging technological advances from the patent literature can highlight areas of industrial investment and innovation. Similarly, patent based institutional pro-files on technology owners can identify shifts in R&D focus, highlight collaborations and demonstrate market
strategy. Shifts in corporate strategy around various technology aspects can also be identified.
A combined ranking of key technology owners based on patent family filings is provided in Table 3 from the individual patent landscapes of each of the four CCMTs. Notably, solar PV accounts for a majority of the technology owners listed, although it is important to emphasize that IP and patent filing strategies differ significantly between companies and across industries. The number of patent families range from 1108 for LG to 185 for Suzlon Energy.
The report provides the ranking of the top 20 patent family holders for each of the four CCMTs. For bio-fuels, Mitsubishi has retained its position as top filer and continues to be an active player in engineering systems for the commercial markets of biodiesel and biomass-to-energy production. The majority of the other entities are recent entrants into the top 20 league table. Eleven institutions, all new top 20 entrants, are headquartered in China, compared to a total of eight from Japan, clearly showing that China is emerging as a major investor in biofuels innovation. Only one entrant is from France, the US, and the UK.
A quarter or 25% of the total biofuel patent filings be-tween 2006 and 2011 were filed in China. This is likely a reflection of the increasing importance of Chinese universities and research institutes in the development of biofuel technologies. It could also be an indication of
Table 2: PATENT fILINg TRENdS By TECHNOLOgy CLASSIfICATION, gLOBALLy ANd USINg THE PCT SySTEM fROM 1975-2011
Biofuels Solar Thermal Solar PV Wind 1975-2005Number of patent applications 24,820 45,707 49,332 25,755 Number of related PCT filings 5,578 4,024 8,866 6,208% of patent applications filed through PCT system 22 % 9% 18% 24%2006-2011 Patent applications 28,825 35,310 80,781 42,147Number of related PCT filings 13,387 7,849 28,074 12,885% of patent applications filed through the PCT system 46% 22% 35% 31%

p—6
the key role China plays in the manufacturing of estab-lished biofuel technologies for large corporate suppliers, such as Mitsubishi (Japan) and Sinopec (China). China is closely followed by the US (21%), which is likely a reflection of a number of national drivers including government subsidies, university research and existing production capacity.
The majority of the growth in patent filings of solar thermal has been around heat exchange systems and mounting/tracking systems. Together, they account for over 80% of the technology classifications applied to solar thermal patent filings in that period. Importantly, 16 of the top 20 technology owners are new entrants and half of these new entrants are from China. This demonstrates a clear relative shift in investment towards China. Five of the top 20 patent owners are headquartered in Germany which demonstrates that the country is still a major player in this technologi-cal space.
Japanese companies continue to play a prominent role in the solarPV patent landscape. Fourteen of the top
20 technology owners are Japanese based companies, and of those, a majority appear in the top 20 list in pe-riod 1975-2005. Major new entrants are from China and particularly the Republic of Korea as evidenced by the rise of number of patents held by LG and Samsung. It is the only CCMT technology area where all of the top 20 patent holders are based in Asia.
Eight of the top 20 companies in the wind energy space are from Europe. The other technology landscapes on average only feature 0-30% European based owner-ship. Of the European economies, Germany notably features prominently. From the emerging economies, the rapid rise of Suzlon and Sinovel as technology owners—ranked fifth and seventh, respectively—can be attributed in large part to their strategic pursuit of knowledge acquisition through a strategy of licensing and M&A. Of the top ten technology owners, these two companies are the only market players from emerg-ing economies. Of the four technology landscapes reviewed in this report, wind energy is the only space that does not contain any universities or public sec-tor research institutions among the top 20 technology
Table 3: RANKINg Of THE TOP 20 TECHNOLOgy OWNERS ACROSS THE fOUR CCMTS
Rank Technology Country/Region Technology 2006-2011 Owners of Company HQ Area 1 LG Republic of Korea SolarPV2 Mitsubishi Japan SolarPV3 General Electric USA Wind 4 Sharp KK Japan SolarPV5 Panasonic Japan SolarPV6 Samsung Republic of Korea SolarPV7 Siemens AG Germany Wind 8 Mitsubishi Japan Wind 9 Kyocera Corp Japan SolarPV 10 Konica Minolta Japan SolarPV11 Fujifilm Corp Japan SolarPV12 Hitachi Japan SolarPV13 Vestas Wind Sys As Denmark Wind14 Hyundai Republic of Korea SolarPV15 Sumitomo Japan SolarPV16 Toyota Japan SolarPV17 Industrial Technology Research Institute China SolarPV18 Sony Corp Japan SolarPV19 Dainippon Printing Co Ltd Japan SolarPV20 Suzlon Energy (REpower Systems) India (Germany) Wind
p—7
owners. A contributing factor could be the relative maturity and established technological systems already within this sector.
Over 30% of recent global wind energy patent filings come from China. Additionally, the multinational composition of the top technology owners suggests that a number of international corporations likely use China as a manufacturing base and therefore find it useful to file patents in China. The U.S., EPO, Republic of Korea and Japan filings account for another 40%. The strong representation of European and EPO patent filings reflect both the base of operations of the technology owners and the current markets in which wind technology is most heavily deployed and invested. For European patent first filings, the highest percentage is from Germany, accounting for 9% of the total recent filings. One notable difference in the wind energy area as compared to other CCMTs is the lower profile of Japan, a historical trend that has become increasingly marked in recent years.
Other studies observed that even within the same industry, corporate patenting rates can differ signifi-cantly for similar types of products. For instance, in the water technology space7 it was found that Japanese corporations tend to have a greater patenting intensity than their non-Japanese corporate competitors. At the same time, small and medium-sized entities (SMEs) tend to have smaller patent portfolios than larger corpo-rate competitors, possibly due to resource constraints around patent filing strategies, or younger technology families mirrored by smaller patent families.
1.4 dIVERSE INdUSTRy STRUCTURES ANd dRIVERS
Unsurprisingly, the patenting landscapes provide evidence that the four CCMTs are at different stages of maturity. Wind energy is a more mature and estab-lished renewable energy technology than biofuels, solar thermal and solar PV. That technological space also has the highest concentration of intellectual property (IP) ownership when measured by patents, and sees the largest volume of granted patents, mainly assigned to companies.
The biofuels patenting space, by contrast, is character-ized by a relatively low concentration of patent owner-ship, and the presence of numerous universities as as-signees. Compared to the other three CCMTs, biofuels is the least mature renewable energy technology.
As a consequence, the range of industry structures and technology and market drivers differ significantly be-tween the four technology areas. These are illustrated by way of anecdotal case studies that provide examples
of shifting ownership, investment, mergers and acqui-sition (M&A) activity and information on geographical markets for each of the four CCMTs. The case studies are intended to illustrate how market features and busi-ness strategies may impact commercial innovation and patent activities:
• In the biofuels sector, by its very nature, decentrali-zation and distributed power makes it challenging to establish large scale projects. The case study looks at broader business information around the biofuels patenting activities of three major biofuels patent owners, namely General Electric (GE; U.S.), Sinopec (China) and British Petroleum (UK).
• In solarthermal, two case studies are described. The first focuses on the emergence, and subse-quent retreat, of ABB (Switzerland) and Siemens (Germany), and how the market in several parts of the world has evolved recently. The second example illustrates how market features and business strate-gies impact commercial innovation and patent activi-ties on the basis of a case study around Abengoa Solar (Spain).
• For solarPV, the case study focuses around China which has emerged as more than a manufacturer of solar panels. Summary information around the solar PV activities of a number of major solar PV patent owners in China is presented, including Suntech (China) and Yingli Green Energy (China).
• The case study on wind energy provides evidence that players from emerging economies are making an increasingly large impact on the world stage. Cases around Suzlon (India) and Sinovel (China) are discussed.
1.5 INTELLECTUAL PROPERTy CONCENTRATIONS ARE SHIfTINg
IP concentrations assess the concentration of pat-ent ownership in a patent landscape. In this report, IP concentration is assessed by the proportion of patents held in each patent landscape by the 20 most patent active companies (by number of patent family filings). Concentration levels can be indicative of a range of features within technology markets. Figure 3 illustrates the differences in the level of IP concentration between the patent landscapes of the four CCMTs in periods 1975-2005 and 2006-2011.
In the first period, IP concentration decreased across all four patent landscapes, with the exception of wind. The wind energy area has the highest and most con-sistent IP concentration among the four focus areas across the two time periods. This is likely indicative of
p—8
the relative maturity of wind technologies compared to technologies in the other spaces. Market players in the wind energy field have remained relatively consistent. The relatively low IP concentration in biofuels, however, is striking. A low IP concentration can be indicative of a fragmented industry or one in which there is still a substantial amount of basic research and development required, or a relatively high level of technology system customization required.
Figure 3: INTELLECTUAL PROPERTy CONCENTRATIONS Of THE TOP 20 COMPANIES fROM 1975-2011
0%5%
10%15%20%25%30%35%40%45%
0 5,000 10,000 15,000 20,000 25,000 30,000 35,000 40,000
IP o
wne
rshi
p pe
rcen
tage
(Top
20)
Number of patent families (total)
Biofuels Solar thermal Solar PV Wind Biofuels Solar thermal Solar PV Wind
20061975-2005 - 2011
1 UNEP, EPO, ICTSD, 2010. Patents and clean energy: bridging the gap between evidence and policy. [Online] Available at: ow.ly/uQ9Ls
2 UNEP, EPO, 2013. Patents and clean energy technologies in Africa. [Online] Available at: ow.ly/wQb8E
3 Lee, B., Iliev, I. & Preston, F., 2009. Who Owns Our Low Carbon Future? Intellectual Property and Energy Technologies. [Online] Available at: ow.ly/xwO6k
4 WIPO, 2011. International Patent System Marks Two Millionth Filing – U.S. Mobile Technology Innovator, Qualcomm, files Landmark Application. [Online] Available at: ow.ly/wQb8E
5 PCT, 2013. Statistics of the PCT System. [Online] Available at: ow.ly/xqqOF
6 WIPO, 2014. US and China Drive International Patent Filing Growth in Record-Setting Year. [Online] Available at: ow.ly/uMVS9
7 van der Vegt, H., Lliev, I. & Tannock, Q., 2011. Patent Landscape Report on Desalination Technologies and the Use of Alternative Energies for Desalination. [Online] Available at: ow.ly/wQcRf

p—9
Section 2:Introduction
2.1 BACKgROUNd
Climate change is one of the biggest challenges of our time. Global greenhouse gas emissions, a main driver of climate change, continue to rise with observed carbon dioxide (CO2) concentration levels exceeding 400 parts per million as of May 2013, a record high in several hundred millennia.8
Since its inception, the United Nations Framework Convention on Climate Change (UNFCCC) has em-phasized the key role that technology development and transfer can play in stabilizing greenhouse gas concentrations. 9 This requires innovation in climate change mitigation and adaptation technologies, the global adoption of such technologies, and public poli-cies to support effective innovation, technology transfer, and technology diffusion. In order to facilitate these complementary objectives, all stakeholders, including policymakers, can benefit by knowing the current state of play of innovation in key climate change mitigation and adaption technologies (CCMTs) to guide evidence-based decision making.
Patent publications around the world represent an important source of structured and accurate information about technology, innovative activity, inventors, technology ownership and technology development globally. Analysis of patent data, aggregated around an industry or relative to a specific technology, can reveal important information about the origins of a technology, how a technology space is developing and the evolving composition of industry players, as well as help identify the most important (commercially or scientifically) patent documents in a technology or industry space. The analysis of patent data can provide reliable information to support decision-making in both the public and private sectors and such analysis forms the basis of this study. Further information about patent intelligence and patent landscapes is provided in the Annex.
2.2 CLIMATE CHANgE MITIgATION ANd AdAPTATION TECHNOLOgIES (CCMTS) IN CONTExT
In 2009, the Copenhagen Communiqué on Climate Change noted that ‘the problem of climate change is solvable–many of the technologies required are avail-able today, while others can be developed if the right incentives are in place.’10 Patent-based intelligence
can assist in accelerating technology innovation and diffusion by providing early information to policymak-ers and others on emerging technologies, key players and the evolving value chains associated with CCMTs.11 Innovative CCMTs will have to play a key role to achieve climate change adaptation and mitigation tar-gets within a reasonable timeframe. Over the past ten years or so, many CCMTs have undergone increased levels of innovation and cost reductions. A notable example is the cost reductions experienced in the solar PV market since 2009.12 When novel and improved CCMTs are combined with appropriate policy frame-works and financing, they have the potential to provide global and regional climate change benefits, including: reductions in the carbon intensity of growth in develop-ing economies; helping meet greenhouse gas reduction targets; and job creation.13
Indeed, since 2009, the technological field has evolved significantly. Also in 2009, Chatham House published a report14 where a strong link was made between pat-enting rates around technologies and market deploy-ment of technologies. This present report builds on CambridgeIP’s previous patent landscaping work for Chatham House. A number of complementary reports have been published since 2009 (when Chatham House published its report) to investigate and clarify various aspects of the climate change and mitigation technology landscape.15,16,17,18,19,20 Our view, and that of many of these reports, is that this fast-moving field re-quires constant research to ensure policy-making has a sufficiently solid evidence-base. We find that patenting rates around the focus CCMTs have expanded signifi-cantly in recent years and this has been accompanied by accelerated technology deployment.
In the five year period between 2007 and 2012 the global installed capacity of renewable energies in-creased significantly.21 Figure 4 shows the average annual growth rates in capacity and production of vari-ous renewable energy sectors. The blue lines depict the average over the five year period from the end of 2007 to 2012, and the gray lines depict the growth rate in 2012 alone. Solar PV has the highest average annual growth rate over the five year period (60%), and saw the second highest increase in 2012 (42%).
It is worth noting that in 2011 alone, the cost of solar PV modules fell by close to 50%,22 driving the annual growth rate for solar PV to 74% in 2011.23 Biodiesel and ethanol production, on the other hand, both related to the biofuels sector, have recorded much lower growth rates in installed capacity than other renewable energy sectors.
This trend is also apparent by analyzing the levels of financial investment. Their evolution over time can be an important market indicator. Similarly, a strong

p—10
relationship typically exists between rates of research and development (R&D) activities and rates of patent filings with levels of investment.
Investment in renewable energy and fuels was $244 billion in 2012 alone. This is a 12% decrease from the previous year’s record figure of $279 billion. However, 2012 still remains ranked the second-highest year in investment – up 8% from 2010 figures. Speculation into the drivers suggest that uncertainty in policy in devel-oped markets played a key role as well as the need for generating capacity in these markets.
According to a report published by UNEP and the Frankfurt School, in 2012 total investment in developing economies was up 19% from 2011 figures, accounting for $112 billion in investment, the highest ever. This indi-cates that developing economies accounted for 46% of all renewable investment in 2012, representing an 11% increase from 2011.
In 2012, the United States (US) and China were the countries with the highest level of investment in renewable energy. These countries also remain pri-mary patenting locations for renewable technologies. Other major growth markets that were among the top investors in 2012 included India, Brazil and South Africa.
Solar remained the dominant sector. When solar PV and solar thermal are aggregated, the investment comes to $140.4 billion in 2012, representing an 11% decrease from the previous year. However, decreased investment was common across renewable energy sec-tors. In 2012 wind energy saw a drop of 10%. Biofuels accounted for the largest 2012 year-on-year drop for new investment, with a 40% decrease to a low level of $5 billion.
While the figures show a recent decrease in invest-ment, it is important to note that in real terms the overall volume of investment remains high in the renewable sector, with developing markets playing an increasingly central role. The large scale of investment in renewa-bles is driving innovation in a number of areas includ-ing new materials, efficiencies and—as technologies become established—in process manufacturing and operations and maintenance (O&M) applications.
With this context in mind, this Global Challenges Report investigates to what extent increased financial invest-ment and market deployment in the four focus CCMTs have been accompanied by increased patenting rates.
Figure 4: TOTAL gLOBAL INSTALLEd CAPACITy: ANNUAL gLOBAL gROWTH RATES Of RENEWABLE ENERgy CAPACITy ANd BIOfUEL PROdUCTION fOR 2007-2012 (AdAPTEd fROM REN21 gRAPHIC)
25.0%
15.0%
60.0%
3.3%
4.0%
11.0%
17.0%
43.0%
19.0%
14.0%
42.0%
3.1%
2.6%
-1.3%
0.4%
61.0%
-10.0% 0.0% 10.0% 20.0% 30.0% 40.0% 50.0% 60.0% 70.0%
Wind
Solar water heating
Solar PV
Hydropower
Geothermal
Ethanol production
Biodiesal production
Concentrating solar thermal
Growth rate (percentage)
2012 End-2007 through 2012(Five year period)

p—11
2.3 fURTHER REAdINg
United National Framework Convention on Climate Change (UNFCCC). unfccc.int/key_documents/the_convention/items/2853.php
IISD. UNFCCC Expert Meeting on Technology Roadmaps Bulletin. (2013). www.iisd.ca/climate/tec/tr-tec5/
Climate Technology Centre and Network. www.unep.org/climatechange/ctcn/
UNFCCC. Report on activities and performance of the Technology Executive Committee for 2012. (2012). unfccc.int/resource/docs/2012/sb/eng/02.pdf
UNFCCC. Joint annual report of the Technology Executive Committee and the Climate Technology Centre and Network for 2013. (2013). unfccc.int/resource/docs/2013/sb/eng/01.pdf
8 UNEP News Centre, 2013. Observed Concentrations of CO2 Cross 400 parts per million Threshold at Several Global Atmosphere Watch Stations’ United Nations Environmental Programme. [Online] Available at: ow.ly/uMU6N
9 Article 4.5 of the UNFCCC calls on developed countries to “take all practicable steps to promote, facilitate and finance, as appropriate, the transfer of, or access to, environmentally sound technologies and know-how to other Parties, particu-larly developing country Parties, to enable them to implement the provisions of the Convention”, available at ow.ly/wQdWT
10 Anon., 2009. The Prince of Wales’ Corporate Leaders Group on Climate Change: University of Cambridge Programme for Sustainability Leadership. [Online] Available at: www.climatecommuniques.com
11 See supra note 3.
12 Natureo Finance, 2012. CIGS Thin-film Solar. [Online] Available at: ow.ly/uMVNP
13 UNEP, 2011. Towards a Green Economy: Pathways to Sustainable Development and Poverty Eradication. [Online] Available at: ow.ly/xeEns
14 See supra note 11.
15 UNEP, EPO, ICTSD, 2010. Patents and clean energy: bridging the gap between evidence and policy. [Online] Available at: ow.ly/uQ9Ls
16 Copenhagen Economics & The IPR Company , 2009. Are IPR a barrier to the transfer of climate change technology?. [Online] Available at: ow.ly/uQyvM
17 Cullen, S., 2009. Alternative energy powers up: staking out the patent landscape for energy from wind, sun and waves. [Online] Available at: ow.ly/uQyGU
18 Dechezlepretre A., et al., 2009. Invention and transfer of climate change mitiga-tion technologies on a global scale: a study drawing on patent data. [Online] Available at: ow.ly/uQyUq
19 UNEP, EPO, 2013. Patents and clean energy technologies in Africa. [Online] Available at: ow.ly/wQgLH
20 WIPO, 2014. A comprehensive list of patent landscape reports compiled by WIPO. [Online] Available at: ow.ly/uQz4k
21 REN21 Renewable Energy Policy Network for the 21st Century, 2013. Renewables Global Status Report 2013. [Online] Available at: ow.ly/uQzcv
22 rankfurt School-UNEP Centre, 2012. Global Trends in Renewable energy invest-ment 2012. [Online] Available at: ow.ly/u0WSI
23 The data cited in this and subsequent paragraphs largely comes from Op. cit., UNEP/Frankfurt School and Op. cit., REN21.

p—12
Section 3:Scope and Methodology
3.1 RESEARCH SCOPE
The analysis in this Global Challenges Report is derived from patent landscape evidence and provides important statistical metrics of technology ownership, geography and emerging technology trends. Selected case studies have been developed to situate the large volume of patent data into the context of market activity and to highlight key areas, players and trends. The case studies provide examples of technology ownership, investment, mergers and acquisition (M&A) activity and information on geographical markets in the four focus areas. Although these case studies offer il-lustrative insights, they do not represent the diversity in-herent in a fast changing environment. They are meant as illustrative anecdotes that nevertheless provide color and context to the patent information.
This report builds on CambridgeIP’s previous pat-ent landscaping work for Chatham House.24 A num-ber of complementary reports have been published since 2009 (when Chatham House published its report) to investigate and clarify various aspects of the climate change and mitigation technology landscape.25,26,27,28,29,30
The Chatham House report (which provided data on CCMTs of patents filed until 2006/2007) focused on wind, solar PV, biomass-to-electricity (biofuel), concen-trated solar power, cleaner coal and carbon capture. The four most patent intensive CCMTs from this list were selected for further analysis in the present Global Challenges Report, viz. biofuels, solar thermal, solar PV, and wind energy. The current report consequently focuses on patents published between 2006 and 2013 (or filed until year end 2011; see also below).
3.2 METHOdOLOgy
CambridgeIP uses a combination of interviews with industry experts, desktop research, and its in-house knowledge-base to develop patent analytics and inter-pretation of results. Results of the searches are ana-lyzed and refined using CambridgeIP’s internal patent database infrastructure, DiscoverIP® and its RedEyeTM workflow platform.
3.2.1 PATENT SEARCH QUERIES
Patent queries and analysis for this report were run using the October 2013 version of PATSTAT data on CambridgeIP’s RedEye workflow platform. Much of the subsequent analysis uses the EPO’s Y02/4 classifica-tion system (see Box). CambridgeIP undertook ad-ditional manual quality control review steps. These re-views were aimed at confirming complete and accurate coverage of the focus CCMTs in the patent literature.
3.2.2 ASSIgNEE NAMES
A well-known problem in patent landscaping is that of ensuring accurate and consistent assignee names. In addition to the use of the applicant table developed to normalize PATSTAT entries, CambridgeIP’s RedEye™ workflow and analytics system includes a name merge facility which can be automated to search for potential matches, which are then confirmed by an operator. It also integrates a library of previous matches from CambridgeIP’s 200+ patent landscaping projects, in-cluding past M&A information, company renaming and patent document spelling errors. However, there may be remaining mismatches due to recent M&A activity. Following an acquisition, patents are on occasion not reassigned. Up-to-date and accurate patent applicant and assignee name harmonization is ultimately an industry challenge. Initiatives underway that could lead to unique applicant (and inventor) identification codes could partially address this problem.
3.2.3 PATENT fAMILy
Throughout the report, two different metrics are used with which to measure the rate and number of patent filings:
• Patent families: CambridgeIP counts patent families by counting patent documents which list no prior patent applications. For purposes of the analysis in this report, CambridgeIP considers the geography of the initial or priority filing country as the geography of the entire patent family.
• Patents and patent applications: Analyses that consider the patents and patent applications count all published patent documents, in all jurisdictions. This is used, for example, to help assess information surrounding market protection.

p—13
3.2.4 PROjECT BOUNdARIES
Patent landscaping exercises are defined in terms of their objectives and boundaries of analysis.
• Technology system boundaries: Searching is based on the Y02/4 EPO classification scheme with subse-quent expert reviews. In order to maintain data con-sistency and repeatability of the exercise for readers wishing to query the data themselves, CambridgeIP limited steps to supplement or remove patents from the Y02/4 derived datasets.
• Patent analysis boundaries: This report provides an overview of patenting activity in the selected technology spaces. It is thus not a ‘freedom to oper-ate’ analysis and does not assess the validity of identified patents. Furthermore, the analysis does not include the legal status, fee payment status, or claim amendments for patent documents captured in the database.
3.2.5 OTHER CONSIdERATIONS
Patent Granting Pendency
The analysis does not include annual patent time trends of patent grant status. CambridgeIP’s prior analysis of the proportion of granted patents to patent applications for the period of 2006–2011 across sample CCMTs indicates that the rate of grant across all technolo-gies is relatively small with granted patents generally accounting for no more than 10% of patent documents filed annually. The relatively low rate of grants may be impacted by the acknowledged backlog in assessment of ‘green’ patent applications together with patent ap-plications in other areas.31
Patent Landscape Limitations and Data Sources
Various patent offices have different levels of publicly available patent data published electronically. Notably, the patent offices of some developing countries may not have electronic, indexed and searchable versions of their patent documents. The patent data used for this project was the PATSTAT database.32
THE EUROPEAN PATENT OffICE (EPO) CLASSIfICATION SCHEME y02/4
The EPO has a dedicated patent scheme for the identification and classification of CCMTs. The classification system was coordinated between the EPO, the United Nations Environmental Programme (UNEP) and the International Centre for Trade and Sustainable Development, with the aim of addressing the challenge of compiling CCMTs from a wide range of technical areas (such as chemistry, electronics and semiconductors) under which they are currently classified.
The classification scheme was launched in June 2010 with an initial release of two subclasses (Y02C and Y02E); there are now five dedicated Y02/4 classification systems which run in parallel to the IPC and Cooperative Patent Classification (CPC) systems already in place.
The Y02 scheme covers:
Y02B CCMTs related to Buildings
Y02C Greenhouse gas capture and storage
Y02E Energy generation, storage and distribution contributing to lower greenhouse gas emissions
Y02S CCMTs related to transport
Y04S Smart grids
According to a paper published by the EPO: “The system is […] based on the automatic identification of the documents and subsequent allocation of the codes based on an initial intellectual effort of the expert examiner in the field. Once this one-off effort is done, it can be used for regularly updating the tagging-classes by simply rerunning the search algorithms and additionally tagging the newly found documents. The experts are also responsible for keeping the algo-rithms up-to-date when any changes in classification occur.”33

p—14
Patent Publication Lag
There is the possibility for up to an 18-month lag in the publication of patent data by various patent offices. This analysis is based on the October 2013 release of PATSTAT. This report therefore shows analysis up to the filing year of 2011, based on the 18 month guidance.
Technology Definition
The definition of the technologies is based on the Y02/4 classification scheme (see Box). In selected fields, where there are new technologies under development that are not yet widely known, it is possible that such technologies are not included in the current classifica-tion. In addition, the technology classifications and boundaries of the technology spaces shift over time.
24 See supra note 3.
25 UNEP, EPO, ICTSD, 2010. Patents and clean energy: bridging the gap between evidence and policy. [Online] Available at: ow.ly/uQ9Ls
26 Copenhagen Economics & The IPR Company, 2009. Are IPRs a barrier to the transfer of climate change technology?. [Online] Available at: ow.ly/uQyvM
27 Cullen, S., 2009. Alternative energy powers up: staking out the patent landscape for energy from wind, sun and waves. [Online] Available at: ow.ly/uQyGU
28 Dechezlepretre, A., et al., 2009. Invention and transfer of climate change mitiga-tion technologies on a global scale: a study drawing on patent data. [Online] Available at: ow.ly/uQyUq
29 See supra note 19.
30 WIPO, 2014. A comprehensive list of patent landscape reports compiled by WIPO. [Online] Available at: ow.ly/uQz4k
31 A statement issued in March 2012 to the US House of Representatives Subcommittee on Commerce, Justice, Science, and Related Agencies by David Kappos, the then Director of the United States Patent and Trademark Office (USPTO) stated that at the end of FY2011, the backlog of utility patents was 670,000, and they expected to have it down to 622,000 by the end of FY2012. He also stated that the expected pendency – the time to grant or abandonment that an applicant expects to experience (on average) from the day of filing – was 33.9 months (see Kappos, DJ. 2012. USPTO FY 2013 Budget Request, Hearing, March 1, 2012, available at ow.ly/u0X5O). The USPTO has put in place an initia-tive, specifically related to renewable energy technologies, to address extended pendency periods. Launched in 2011, the ‘Green Technology Pilot Program’ ac-corded ‘green technology’ patents a special status and cited that in its pilot phase there were many instances in which the pendency period was reduced to one year. The combined influence of the patent backlog, as well as variable pendency of patent filings, should be taken into consideration when reviewing the relatively low level of grants versus applications.
32 Full PATSTAT guidance and limitations notes are available at ow.ly/u0XdG
33 Veefkind, Hurtado-Albir, Angelucci & Thumm, K. &., 2012. A new EPO clas-sification scheme for climate change mitigation technologies. World Patent Information, pp. 106-111.
p—15
Figure 5: TECHNOLOgy TRENdS IN BIOfUEL PATENT fAMILy fILINgS fROM 1975-2011
0
500
1000
1500
2000
2500
3000
Pate
nt fa
mili
es
Production by fermantationof organic by-products(Y02E 10/343)
Fuel from waste(Y02E 10/30)
Biofuels(Y02E 50/10)
Bio-diesel(Y02E 50/13)
Bio-pyrolysis(Y02E 50/14)
Other technologies
Patent filing year © 2012
Section 4:BiofuelPatentLandscapeThe biofuels space, and more broadly, technologies for the production of fuel from non-fossil biological origin (ie. fuels that contain energy from geologically recent carbon fixation), has seen numerous advances in bio-diesel, fuel from waste and production by fermentation or organic by-products by method of energy conver-sion. The area has seen recent interest and innovation in second-generation biofuels such as microalgae34,35 and agricultural waste crops. It is also noteworthy that as feedstock processing technologies have improved, there has been some convergence between biomass-to-fuel (for transport) and biomass-to-electricity appli-cations. As a result, the boundaries of analysis that the 2009 Chatham House report made between these two families of technologies has become less distinct.
4.1 TRENdS IN PATENT fILINgS
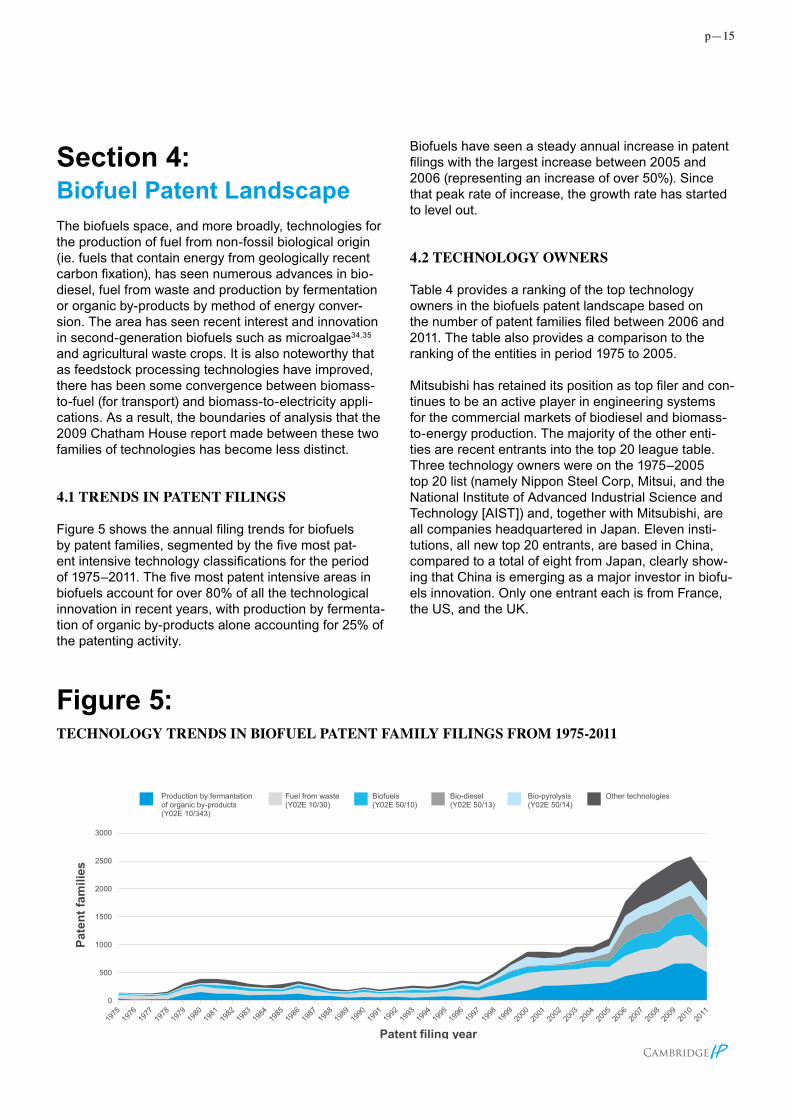
Figure 5 shows the annual filing trends for biofuels by patent families, segmented by the five most pat-ent intensive technology classifications for the period of 1975–2011. The five most patent intensive areas in biofuels account for over 80% of all the technological innovation in recent years, with production by fermenta-tion of organic by-products alone accounting for 25% of the patenting activity.
Biofuels have seen a steady annual increase in patent filings with the largest increase between 2005 and 2006 (representing an increase of over 50%). Since that peak rate of increase, the growth rate has started to level out.
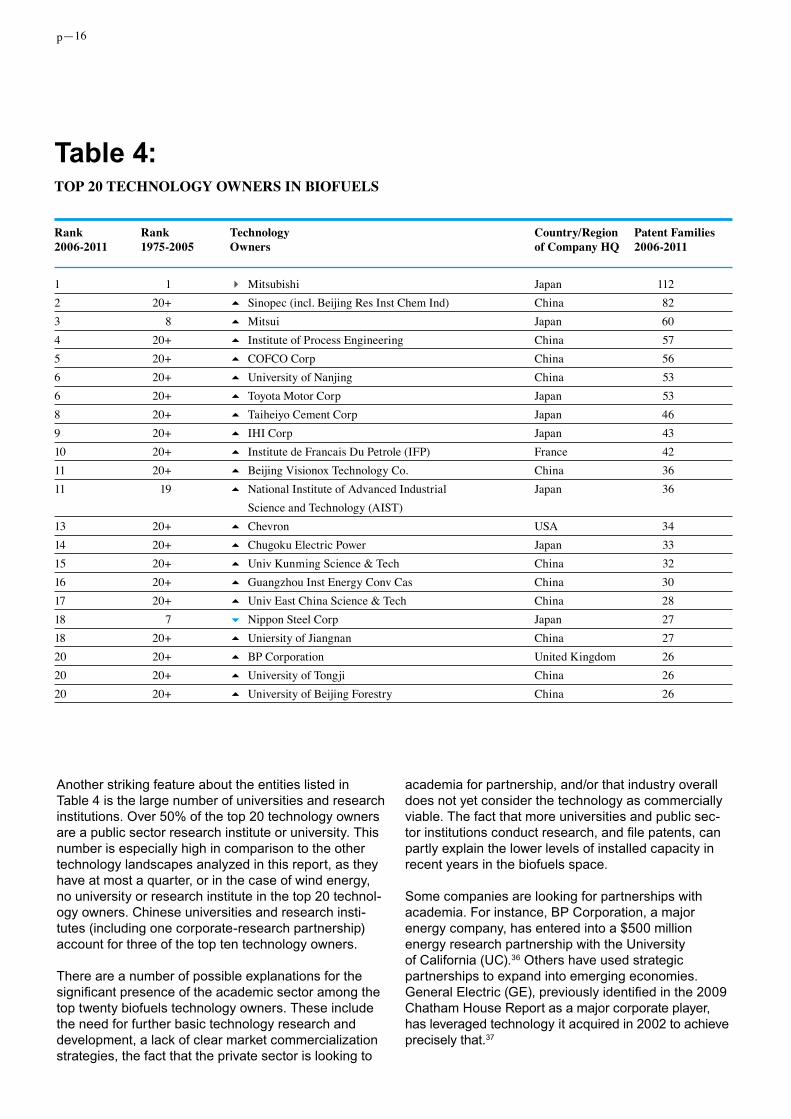
4.2 TECHNOLOgy OWNERS
Table 4 provides a ranking of the top technology owners in the biofuels patent landscape based on the number of patent families filed between 2006 and 2011. The table also provides a comparison to the ranking of the entities in period 1975 to 2005.
Mitsubishi has retained its position as top filer and con-tinues to be an active player in engineering systems for the commercial markets of biodiesel and biomass-to-energy production. The majority of the other enti-ties are recent entrants into the top 20 league table. Three technology owners were on the 1975–2005 top 20 list (namely Nippon Steel Corp, Mitsui, and the National Institute of Advanced Industrial Science and Technology [AIST]) and, together with Mitsubishi, are all companies headquartered in Japan. Eleven insti-tutions, all new top 20 entrants, are based in China, compared to a total of eight from Japan, clearly show-ing that China is emerging as a major investor in biofu-els innovation. Only one entrant each is from France, the US, and the UK.
p—16
Table 4: TOP 20 TECHNOLOgy OWNERS IN BIOfUELS
Another striking feature about the entities listed in Table 4 is the large number of universities and research institutions. Over 50% of the top 20 technology owners are a public sector research institute or university. This number is especially high in comparison to the other technology landscapes analyzed in this report, as they have at most a quarter, or in the case of wind energy, no university or research institute in the top 20 technol-ogy owners. Chinese universities and research insti-tutes (including one corporate-research partnership) account for three of the top ten technology owners.
There are a number of possible explanations for the significant presence of the academic sector among the top twenty biofuels technology owners. These include the need for further basic technology research and development, a lack of clear market commercialization strategies, the fact that the private sector is looking to
academia for partnership, and/or that industry overall does not yet consider the technology as commercially viable. The fact that more universities and public sec-tor institutions conduct research, and file patents, can partly explain the lower levels of installed capacity in recent years in the biofuels space.
Some companies are looking for partnerships with academia. For instance, BP Corporation, a major energy company, has entered into a $500 million energy research partnership with the University of California (UC).36 Others have used strategic partnerships to expand into emerging economies. General Electric (GE), previously identified in the 2009 Chatham House Report as a major corporate player, has leveraged technology it acquired in 2002 to achieve precisely that.37
Rank Rank Technology Country/Region Patent families 2006-2011 1975-2005 Owners of Company HQ 2006-2011 1 1 4 Mitsubishi Japan 1122 20+ 5 Sinopec (incl. Beijing Res Inst Chem Ind) China 823 8 5 Mitsui Japan 60 4 20+ 5 Institute of Process Engineering China 575 20+ 5 COFCO Corp China 566 20+ 5 University of Nanjing China 536 20+ 5 Toyota Motor Corp Japan 53 8 20+ 5 Taiheiyo Cement Corp Japan 469 20+ 5 IHI Corp Japan 4310 20+ 5 Institute de Francais Du Petrole (IFP) France 4211 20+ 5 Beijing Visionox Technology Co. China 3611 19 5 National Institute of Advanced Industrial Japan 36 Science and Technology (AIST) 13 20+ 5 Chevron USA 3414 20+ 5 Chugoku Electric Power Japan 3315 20+ 5 Univ Kunming Science & Tech China 3216 20+ 5 Guangzhou Inst Energy Conv Cas China 3017 20+ 5 Univ East China Science & Tech China 2818 7 6 Nippon Steel Corp Japan 2718 20+ 5 Uniersity of Jiangnan China 2720 20+ 5 BP Corporation United Kingdom 2620 20+ 5 University of Tongji China 2620 20+ 5 University of Beijing Forestry China 26

p—17
4.3 KEy MARKETS
The geographical filings of patents can inform where innovative R&D groups see market potential within a particular technology space. This is because applicants tend to file patents in markets in which they intend to invest, license or sell. The filing patterns also provide some indirect insight as to geographic locations that are seen to have a favorable IP regime or where future competition is anticipated.
A quarter or 25% of the total biofuel patent filings between 2006 and 2011 were filed in China (Figure 6). This is likely a reflection of the increasing importance of Chinese universities and research institutes in the development of biofuel technologies. It could also be an indication of the key role China plays in the manufacturing of established biofuel technologies for large corporate suppliers, such as Mitsubishi (Japan) and Sinopec (China).
China is closely followed by the US (21%), which is likely a reflection of a number of national drivers including government subsidies, university research and existing production capacity.
The Republic of Korea has increased its share of pat-ents filed, rising from 2% to 5% between 2006 and 2011. Numerically, this represents a tripling of the number of filings from the period 1975-2005 compared with period 2006-2011 (going from just under 500 filings to just over 1500).
The market that saw the largest decrease in filings is Japan. Whilst still a key market and the headquarter location of eight of the top 20 technology owners, it has become a less important location for filing, dropping from 25% patent filings for the period 1975-2005 to only 10% in 2006–2011.
The EPO has become a more popular filing location. Whereas historically filing at individual national patent offices was the norm, the globalization of markets has led to a marked shift in preference for the use of both the EPO and PCT. The noticeable decline of ‘other geographies’ as a patent filing location since 1975 is partly explained by this rise of multi-jurisdictional filing.
Patent filing data can also indicate geographical cent-ers of innovation, as the office of first filing (OFF) can be used as a proxy for the origin of the technological innovation. In biofuels there is a clear shift in the OFF to China from Japan, and there has also been a notice-able increase in the filings from the Republic of Korea (Figure 7).
4.4 CASE STUdy: BIOfUEL OPPORTUNITIES IN EMERgINg ECONOMIES
The biofuel patenting space is characterized by a rela-tively low patent concentration and by the presence of many universities and public sector research institutions as assignees. The strong presence of universities sig-nals a diverse range of basic research and development opportunities available in the technology chain.
Figure 6:BIOfUELS gEOgRAPHy Of ALL PATENT APPLICATION fILINgS fROM 1975-2011
Japan21%
United States10%
Germany18%
Republicof Korea
2%
Other39%
PR China9%
1975-2005
Japan7% United
States9%
Germany9%
Republicof Korea
10%
Other24%
PR China41%
2006-2011

p—18
By its very nature, decentralization and distributed power makes establishing large scale projects challenging.
This case study looks at broader business information around the biofuels patenting activities of three major biofuels patent owners, namely GeneralElectric(GE;US), Sinopec(China) and BritishPetroleum(UK). The case study is intended to illustrate how market fea-tures and business strategies may impact commercial innovation and patent activities.
One major corporation exploiting biomass opportuni-ties in emerging economies is GE, which filed its first patent in the biofuels space in the early 2000s, entering the field with research in the co-production of hydrogen and electrical power by using biomass as a feedstock. Its most recent biomass patent application was pub-lished in January 2011. GE has developed intellectual property around co-generation, synthetic gas and waste gas—areas that were previously under development by Jenbacher, an Austrian gas turbine manufacturer (ac-quired by GE in 2002). To establish its biomass-based technologies, GE has pursued a strategy of collabora-tion and strategic partnership with local governments and developers. To date, GE’s gas engines have been applied to power biomass-energy projects in numerous countries including India, Cambodia, Indonesia, Kenya and Japan.
In India, for example, GE signed a memorandum of understanding with AllGreen (a leading renewable energy developer) in 2009. AllGreen Energy adopted biomass integrated gasification combined cycle technology, in which GE’s Jenbacher gas engines
were customized for wood-based gas applications and integrated with biomass gasification technology developed by the Indian Institute of Science.38 In 2011, GE and Reliance Venture Asset Management (India) backed AllGreen during a series of investments. AllGreen announced the financing would be used to fund a 6.4MW Indian biomass project that will use GE gas turbine technology. This marks the first in a line of biomass projects—totaling 100MW—which AllGreen plans to roll out in India over the next decade.39 GE has introduced similar models of partnership building to implement the technology transfer and market access in both Indonesia and Cambodia.40
In addition to major corporations such as Mitsubishi (Japan), Toyota Motor Corp. (Japan) and IHI Corp. (Japan) in the biofuel space, a number of universities and public-private partnerships have climbed the rank-ing of technology owners (see Table 4).
Sinopec, the Number 2 ranked technology owner, has an established R&D collaboration center, the Beijing Research Institute of Chemical Industry (BRICI), which directly collaborates with and funds the Chinese Academy of Engineers. The academy houses large teams of professors and researchers and takes on post-graduate candidates. The majority of the research is fo-cused on the petrochemical industry, but also contains pilot plant sites and access to a variety of feedstocks for innovation in organic synthesis and environmental sustainable development.
Institutionally, BRICI has a clear focus on commerciali-zation. BRICI states that for all the technology fields in which it operates ‘by the end of 2011, BRICI has in total
Japan49%
United States
9%
Germany9%
Republicof Korea
3%
Other22%
PR China
8%
1975-2005
Japan15%
United States
8%Germany
7%
Republicof Korea
8%Other16%
2006-2011
PR China46%
Figure 7:OffICE Of fIRST fILINg (Off) fOR BIOfUELS fROM 1975-2011

p—19
filed 2140 patent applications in China with 736 granted and 469 applications overseas with 182 granted.’41 This metric also indicates that the primary commercial focus of BRICI is within China.
Another example of a private-public partnership is the BP-University of California (UC) collaboration. Given the rate at which the State of California produces biomass (around 100 million tons per year), it is unsur-prising that the university has a significant interest in biofuel generation.42 In 2007 BP selected UC Berkeley to lead a $500 million energy research consortium, partnering with Lawrence Berkeley National Lab (LBNL, US) and the University of Illinois.
The funding from BP was used to set up the Energy Bioscience Institute (EBI), with a mission to explore the application of advanced knowledge of biological pro-cesses, materials and mechanisms to the energy sec-tor.43 Since its inception in 2007, the EBI has published around 500 papers and applied for over 50 patents (many of which are not yet published), the first of which has already been granted.44
A key provision in the EBI contract gives BP both a non-exclusive, royalty-free right to practice discover-ies made at the EBI as well as an option to take up an exclusive, royalty-bearing license in the energy field45. However, even with an exclusive license in place, UC still has the right to license to companies, other than BP, outside the energy field. This arrangement, de-veloped by UC Berkeley’s Intellectual Property and Industry Research Alliances (IPIRA), is designed to en-courage commercialization of EBI inventions, while also providing BP with an incentive to make investments in research and development.
UC is now past the halfway point in its 10 year com-mitment to BP. It is clear that the deal has produced a significant amount of research and intellectual property. A number of collaborations with diverse institutions have also resulted from the initiative (Figure 8). As of 2012, some EBI-based innovations were in commercial development, but none were in commercial use. It is thus still too early to judge the commercial impact of discoveries at the EBI, but prospects seem good.
REGENTS AT THEUNIVERSITY OF CALIFORNIA
ZHANG, RUIHONG
NORBECK, JOSEPH, M.
THE BOARD OF TRUSTEESOF THE UNIVERSITY OF ILLINOIS
BP (BRITISH PETROLEUM)
BLANCH, HARVEY, W.
SANDIA CORPORATION
ASSIGNEE, SIZE INDICATESRELATIVE NO. OF PATENTS
COLLABORATIONS
PARK, CHAN, SEUNG
GLASS, N. LOUISE
CLARK, DOUGLAS, S.
Figure 8: NETWORK dIAgRAM fOR THE UNIVERSITy Of CALIfORNIA: PATENT CO-ASSIgNEES IN BIOMASS

p—20
4.5 fURTHER REAdINg
The Global Biomass Market Outlook; Current status, key players, growth potential, and the future outlook; Business Insights Ltd. (2011).
The Biofuels Market: Current Situation and Alternative Scenarios. United Nations Conference on Trade and Development (2009). ow.ly/wQiD5
Scaling up Renewable Energy in Africa; 12th Ordinary Session of Heads of State and Governments of the AFRICAN UNION, Addis Ababa, Ethiopia; United Nations Industrial Development Organization. (2009). ow.ly/u0WrB
34 Katz, L., Kinney, K., Choi, J. & Chen, E., 2012. Continuous flocculation defloc-culation process for efficient harvesting of microalgae from aqueous solutions. US, Patent No. WO2013059754A1.
35 Preiss, M. &. K. S., 2010. Algae and Biodiesel: Patenting energized as green goes commercial. Journal of Commercial Biotechnology, Volume 16, pp. 293-312.
36 “BP selects UC Berkeley to lead $500 million energy research consortium with partners Lawrence Berkeley National Lab, University of Illinois”, available at ow.ly/wQjiw
37 “GE to acquire Jenbacher”, Power Engineering, November 19, 2002, available at ow.ly/wQjLQ
38 Renewable Energy Focus, 2009. Allgreen Energy plans 10 biomass projects in India. [Online] Available at: ow.ly/u0SFY
39 newnet, 2011. Reliance Venture, GE back Indian biomass start-up AllGreen. [Online] Available at: ow.ly/u0SwE
40 GE, 2012. GE’s Waukesha Gas Engines to Power Cambodia Rice Husk Biomass-Energy Project. [Online] Available at: ow.ly/u0SPY
41 Sinopec, 2014. SINOPEC Beijing Research Institute of Chemical Industry. [Online] Available at: ow.ly/u0V9D
42 Anon., 2008. West Biofuels, U.C. partner to make ethanol Forest, yard, agri-cultural waste could help fuel future of California, say researchers. [Online] Available at: ow.ly/u0Vir
43 Anon., 2014. Energy Biosciences Institute. [Online] Available at: www.energybiosciencesinstitute.org
44 Glass, L., 2010. Methods and compositions for improving sugar transport, mixed sugar fermentation, and production of biofuels. US, Patent No. US8431360B2.
45 Sanders, R., 2008. EBI named tech-transfer “Deal of Distinction”. [Online] Available at: ow.ly/uQBtB

p—21
Section 5:Solar Thermal Patent LandscapeSolar thermal is a technology to harness solar energy through the generation of heat. Solar thermal collectors come in three varieties: those that operate at low temperatures and use flat plates; those used to heat water or air use medium temperature, usually also through the use of flat beds; and those that use high temperatures by concentrating sunlight using mirrors or lenses. The latter can also be used to generate electric power.
The growing interest in solar thermal technologies is driven, in part, by the capacity of solar thermal to store energy cheaply, thereby contributing to the smoothing of peak demand and other capacity issues faced by elec-tricity networks. A major focus of innovation has been around scaling the technology up to the utility level.
Solar thermal has seen innovative advances in the coating, manufacturing and resilience of glass mate-rial—especially as they relate to heat exchange sys-tems, the development of control systems relating to tracking46 and in the integration with energy storage technologies.47
5.1 TRENdS IN PATENT fILINgS
Similar to other CCMTs, annual solar thermal patent filings increased significantly at an average annual rate
of 24% from 2006 to 2011. Heat exchange systems and mounting/tracking systems drive the majority of this growth. Together, they account for over 80% of the technology classifications applied to solar thermal pat-ent filings in that period.
Solar thermal is unique in the comparative volume of patents filed during the 2006-2011 and 1975-2005 peri-ods. Despite a marked increase over the past 6 years, it is the only technology of the four considered in this report where fewer patents were filed in the 2006-2011 period than the 1975-2005 period (Figure 9). This is likely due to the early stage technology developments in the late 1970s that yielded significant advances, particularly around power generation using parabolic troughs and heat exchange systems.
5.2 TECHNOLOgy OWNERS
Table 5 provides a ranking of the top 20 technology owners in the solar thermal space based on patent ownership. Typically, the higher the number of patents, the higher the research investment in solar thermal technology. Between 2006 and 2011, 16 of the top 20 technology owners were new entrants, and half of these new entrants were from China. It demonstrates a clear relative shift in investment intensity towards China. With five of the top 20 intellectual property owners headquar-tered in Germany, the country is still a major player in this technological space.
Solar thermal is an industry, however, in which the top technology owners will not necessarily reflect the top operators of solar thermal power generation plants. This is due to the large-scale investment and resource
0
500
1000
1500
2000
2500
3000
3500
4000
4500
Pate
nt fa
mili
es
Patent filing year
Heat exchange systems(Y02E 10/44)
Mounting or tracking(Y02E 10/47)
Conversion intomechanical power(Y02E 10/46)
Trough concentrations(Y02E 10/45)
Dish collectors(Y02E 10/42)
Other technologies
© 2012
Figure 9: TECHNOLOgy TRENdS IN SOLAR THERMAL PATENT fAMILy fILINgS fROM 1975-2011

p—22
capacity necessary to own and operate a solar thermal plant. Often operators will be aggregators of technolo-gies and specialize in large scale O&M.
5.3 KEy MARKETS
China—with its capability for large scale projects and abundance of land—appears to be well-suited as a po-tential developer and user of solar thermal. Not surpris-ingly, therefore, patent filings in China have increased steadily and now account for around 40% of all filings globally (Figure 10). A similar increase is seen when analyzing the office of first filings. Whereas Japan dom-inated in the period 1975-2005 with 37% of all filings, it is now China that leads with a 57% share (Figure 11). Across the four CCMTs of this report, solar ther-mal shows the highest percentage of Chinese patent filings from 2006–2011. The Republic of Korea shows an increased share of global filings from 1%-6%; Japan decreased its share from 37% to 15%; and Germany decreased from 14% to 9%. Germany is still the second most popular office of first filing in recent years.
5.4 CASE STUdy: M&A ACTIVITy IN SOLAR THERMAL
In 2005, existing solar thermal capacity was just 0.4GW.48 By the end of 2012 installed capacity had grown significantly to 2.5GW.49 The highest increase took place in 2012 and was partly fuelled by M&A and industry consolidation. Indeed, from 2010 to 2011, the industry saw several acquisitions by major energy play-ers seeking to enter the solar thermal market. For exam-ple, ABB bought Novatec50 and Areva bought Ausra,51 whilst Alstrom entered into a joint venture with Bright Source.52 Also notable during this time is the strong entrance of Siemens (who bought Solel) in the solar thermal patent space. As a result, Siemens climbed to sixth place from the perspective of patent filings.
More recently, however, driven by huge reductions in solar PV costs, the interest of some major players in solar thermal appears to have once again abated. In October 2012, Siemens announced its intention to sell off its solar assets, including Solel.53 In December 2012, ABB also announced its retreat from solar thermal by
Rank Rank Technology Country/Region Patent families 2006-2011 1975-2005 Owners of Company HQ 2006-2011 1 20+ 5 Hikeen Tech Co Ltd HK, SAR China 1752 20+ 5 Beijing Inst Graphic Comm China 1413 20+ 5 Paradigma Germany 109 4 20+ 5 Univ Southeast China 945 20+ 5 Himin Co Ltd China 906 20+ 5 Siemens AG Germany 877 20+ 5 Bosch Gmbh Robert Germany 738 20+ 5 Yangzhou Sunleada Co Ltd China 659 3 6 Mitsubishi Japan 639 20+ 5 Beijing WiSword Science & Technology Dev Co Ltd China 6311 1 6 Panasonic Japan 6212 20+ 5 Univ Kunming Science & Tech China 59 13 20+ 5 Abengoa Solar Spain 5914 20+ 5 Univ Zhejiang China 4815 20+ 5 Korea Energy Research Inst Republic of Korea 4516 2 6 Hitachi Japan 4417 20+ 5 Badelite Solar Energy Technology Co Ltd China 4318 9 6 German Aerospace Centre Germany 4118 20+ 5 Zhejiang Bihuali Electronic Technology Co Ltd China 4120 20+ 5 Schueco Int KG Germany 37
Table 5: TOP 20 TECHNOLOgy OWNERS IN SOLAR THERMAL

p—23
announcing its intention to sell its stakes in Novatec in its quest to help “reposition the Power Systems division to drive higher returns.”54 Before divestment, patent fil-ings of ABB focused on the integration of solar thermal with energy storage through the use of thermal baths.55
Some recent projects have been scaled back, modi-fied/re-assigned to solar PV, or cancelled completely.56 California (US) showed promise as a location where so-lar thermal players would flourish following a large num-ber of venture capital investments between 2006 and
2009. However, by 2011 developers of more than half of the nine solar thermal solar farms approved for con-struction had declared that they would prefer to use so-lar PV panels instead.57 Whilst Spain and the US have traditionally dominated the market for solar thermal installations, the industry has more recently expanded its attention to Algeria, Australia, Egypt, Morocco, India, the United Arab Emirates (UAE) and China.58
One example of the expansion in market scope to India is given by Areva Solar. Almost immediately after
Figure 11: OffICE Of fIRST fILINg IN SOLAR THERMAL fROM 1975-2011
Figure 10: gEOgRAPHy Of ALL SOLAR THERMAL PATENT APPLICATION fILINgS fROM 1975-2011
0%
10%
20%
30%
40%
50%
60%
70%
80%
90%
100%
% p
aten
t app
licat
ions
PR China Japan United States European Patent Office (EPO) Republic of Korea Other geographies
Patent filing year © 2012
PR China57%
Japan37%
United States10%
Germany14%Republic
of Korea1%
Other20%
PR China18%
1975-2005Japan 15%
United States4%
Germany9% Republic
of Korea6%
Other19%
2006-2011

p—24
its inception, Areva Solar—formed through the Areva Group’s acquisition of Ausra (Australia) — focused its attention on India where the company is currently building one of Asia’s largest solar thermal plants. Purchase of the project’s technology, supplied by Areva Solar (California, US) was partly funded by a loan of $80.32 million from the Export-Import Bank of the US, to India-based project owner Reliance Power.59 However, it has not all been plain sailing for Areva Solar: delays due to water and equipment supply shortages have hampered construction of a number of Indian solar thermal plants.
A second example to further illustrate how market features and business strategies may impact commer-cial innovation and patent activities relates to Abengoa Solar. This is a subsidiary of Abengoa, a Spanish com-pany that began life in solar energy research construct-ing heliostats, facets and other components for power towers. In 2007, the world’s first commercial power tower solar thermal plant (PS10), owned and oper-ated by Abengoa, began operation in southern Spain. The same solar thermal complex now also houses the world’s most powerful solar power tower (PS20, opened in 2009) and several pilot concentrating solar power plants, including the world’s first commercial-scale plant to use molten salt heat storage with a central tower. Abengoa also has involvement in major commercial solar thermal plant projects in previously un-tapped regions, such as the UAE and South Africa. It also planned to begin operating the world’s largest (280 MW, parabolic trough-based) solar power plant, in Arizona, US, by 2013.
Abengoa has been particularly active in patenting around solar thermal in recent years (see Table 5) and was the number one Spanish company in the ranking of international patent applicants, issued by the Spanish Patent and Trademark Office (SPTO) in 2011.60 This patenting intensity can, in part, be attrib-uted to Abengoa’s investment in solar R&D+investment (R&D+i). Unlike many other large corporate play-ers within this space, Abengoa is directly involved in R&D. The company claims to operate the world’s most advanced solar R&D+i center at its base in southern Spain. Abengoa Solar’s growth may have also benefited from the geographic location of its base in southern Spain: the area’s high Direct Normal Irradiance (DNI)61 and the Spanish government’s strong support for solar power. These factors have contributed to Abengoa developing and testing novel solar thermal technology on a large scale—exactly what is required for achieving further cost reductions in this field.
5.5 fURTHER REAdINg
Global Cleantech 100: A Barometer of the Changing Face of Global Cleantech Innovation; Cleantech Group LLC. (2012).
Solar Thermal Electricity 2025 – Clean electricity on demand: attractive STE cost stabilize energy produc-tion; A.T. Kearney Inc. (2010).
Solar Thermal Energy – an Industry Report; Solar-Thermal. (2008).
US Solar Market Trends 2010; Interstate Renewable Energy Council; Larry Sherwood (2011).
46 Germann, G., Herzig, S. & Hübner, R., 2011. Method and control device for adjusting a plurality of adjustable functional elements of a solar installation. s.l. Patent No. WO2012022420A1.
47 Diebold, C. & Harter, K.-F., 2011. A polymer-based dynamic carrier system for flexible or rigid solar cells for self-sufficient and optimal power genera-tion, with compressed air technology and sensor technology. s.l. Patent No. WO2011113413A1.
48 REN21. ‘Renewables Global Status Report 2006’ REN21 Renewable Energy Policy Network for the 21st Century. (2006). Available at ow.ly/wQlG0
49 Op. cit., REN21 (2013).
50 ‘ABB Buys 35% of Germany’s Novatec Solar With Option to Buy All’ Bloomberg News (March 16, 2011)
51 Reuters News. ‘Nuclear giant Areva buys solar company Ausra’ (February 8, 2010).
52 CleanTech Magazine. ‘Alstom leads funding round in BrightSource Energy’ (Issue 3; 2011)
53 Greentech Solar, 2013. The Sunset of Solel, Siemens and Solar Trough CSP Technology. [Online] Available at: ow.ly/uQBQY
54 ABB, 2012. ABB repositions Power Systems division to drive higher returns. [Online] Available at: ow.ly/uQBV4
55 Hemrle, J., Kaufmann, L. & Mercangoez, M., 2010. Thermoelectric energy storage system having two thermal baths and method for storing thermoelectric energy. s.l. Patent No. WO2010118915A1.
56 Wang, Ucilia, 2013. The End of A Giant Solar Project in California. [Online] Available at: ow.ly/uQC9U
57 Wang, Ucilia, 2011. The fate of 9 giant solar farms in Cali. [Online] Available at: ow.ly/uQClU
58 REN21 Renewable Energy Policy Network for the 21st Century, 2013. Renewables Global Status Report 2013. [Online] Available at: ow.ly/uQzcv
59 Ex-Im Bank, 2012. Ex-Im Bank Approves $80 Million in Export Financing for Solar Project in India. [Online] Available at: ow.ly/uQxxu
60 Abengoa Solar, 2012. Abengoa Solar, the leading Spanish company in the inter-national patent applications ranking. [Online] Available at: ow.ly/ugvFl
61 DNI is a commonly used metric for solar thermal capacity. It is a measure of the solar irradiation striking a surface held normal to line of sight to the sun.

p—25
Section 6:SolarPVPatentLandscape
The dramatic reduction in solar PV prices has led to a reorganization of the industry’s value chain which has led to an increase of patenting activities in certain areas. Manufacturing innovations have accelerated, as have inventions around possible improved materi-als, including nanomaterials,62 and flexible and three-dimensional63 solar cells.
6.1 TRENdS IN PATENT fILINgS
Solar PV has the highest volume of patent filings of the four CCMTs presented in this report, with 34,849 pat-ent families filed and 80,781 patent applications filed in the 2006–2011 period. Solar PV also sees the highest annual average increase in patent filings with a rate of 33%. The period with the highest rate of increase was between 2008 and 2009, when patent filing rates increased by nearly 50% (Figure 12). Materials inno-vation accounts for 58% of innovation in the solar PV technology landscape for 2006–2011; the most patent intensive materials focus was in organic silicon PV cells and dye sensitized solar cells.
6.2 TECHNOLOgy OWNERS
Table 6 provides a ranking of the top technology own-ers in the solar PV space based on patent ownership.
Figure 12: TECHNOLOgy TRENdS IN SOLAR PV PATENT fAMILy fILINgS fROM 1975-2011
0
500
1000
1500
2000
2500
3000
3500
4000
4500
5000
Pate
nt fa
mili
es
PV systems and concentrators(Y02E 10/52)
Organic silicon PV cells(Y02E 10/549)
Dye sensitized solar cells(Y02E 10/542)
Monocrystalline silicon PV cells(Y02E 10/547)
For grid-connected applications(Y02E 10/563)
Other technologies
Patent filing year
Japanese companies continue to play a prominent role in the solar PV patent landscape. Seven out of the top ten technology owners are Japan-based companies, and of those, a majority appear in the top 10 patent ownership table for the period between 1975 and 2005. Of the four CCMTs reviewed in this report, solar PV retains the highest proportion of previously ranked technology owners. Major new entrants are from China and particularly the Republic of Korea as evidenced by the rise in number of patents held by LG and Samsung.
Solar PV differs from the other focus CCMTs in that all top 20 of the top technology owners are based in Asia. In stark contrast to the biomass landscape, there is only one research institute among solar PV innovators, with 95% being private entities.
6.3 KEy MARKETS
In terms of patent filing locations there is a fairly even distribution between China, Japan, and the US, each accounting for approximately 20% in the period of 2006–2011 (Figure 13). Filings in the Republic of Korea accounted for 13% of the solar PV technology landscape in 2006–2011. This is a significantly higher percentage than in any other CCMT technology space. The trend is not surprising considering the presence of three Korean companies in the top ten patent owners.
Japan is the most common office of first filing for solar PV, which is to be expected considering the prevalence of Japanese companies as top technology owners. However there has been a considerable reduction in the dominance of Japan as an office of first filing, with

p—26
Table 6:
TOP 20 TECHNOLOgy OWNERS IN SOLAR PV
Patent filing year
0%
10%
20%
30%
40%
50%
60%
70%
80%
90%
100%
% p
aten
t fam
ilies
PR China Japan United States European Patent Office (EPO) Republic of Korea Other geographies
© 2012
Figure 13: gEOgRAPHy Of ALL SOLAR PV PATENT APPLICATION fILINgS fROM 1975-2011
Rank Rank Technology Country/Region Patent families 2006-2011 1975-2005 Owners of Company HQ 2006-2011 1 20+ 5 LG Republic of Korea 11082 4 5 Mitsubishi Japan 7953 2 6 Sharp KK Japan 639 4 1 6 Panasonic Japan 6335 16 5 Samsung Republic of Korea 5726 5 6 Kyocera Corp Japan 3577 20+ 5 Kyocera Minolta Japan 2718 11 5 Fujifilm Corp Japan 2709 8 6 Hitachi Japan 26810 20+ 5 Hyundai Republic of Korea 20711 10 6 Sumitomo Japan 20612 12 4 Toyota Japan 201 13 20+ 5 Industrial Technology Research Institute China 19914 15 5 Sony Corp Japan 19515 20 5 Dainippon Printing Co Ltd Japan 18716 6 6 Fuji Electric Co Ltd Japan 18417 20+ 5 Toppan Printing Co Ltd Japan 17818 20+ 5 Trina Solar Co Ltd China 17419 20+ 5 Oceans King Lighting Science China 16120 7 6 Kaneka Corp Japan 149

p—27
Japan69%
United States11%
Germany9%
Republicof Korea
2% Other7%
PR China2%
1975-2005
Japan28%
United States
9%
Germany8%
Republicof Korea
19%
Other13% PR
China23%
2006-2011
Figure 14: OffICE Of fIRST fILINg IN SOLAR PV fROM 1975-2011
China and the Republic of Korea accounting for much higher proportions (Figure 14). An analysis of this shift and a discussion of possible reasons are presented in the next sub-section and case study.
6.4 CASE STUdy: CHINA, EMERgINg AS MORE THAN A MANUfACTURER
As previously described, the solar PV space exhibits particularly high volumes and rates of patenting activity when compared with the other CCMTs discussed in this report. Although nearly one third of all patent filings are currently made in China — representing a major increase since 2006— the proportion of Chinese first filings in solar PV is smaller in this patent landscape than in the wind, biofuels or solar thermal patent landscapes. In addition, of these four technology areas, solar PV is the only area in which a Chinese company does not feature within the top ten technology owners. Given China’s massive influence in the solar PV market, this appears somewhat contradictory.
In the early 2000s, solar PV panels were primarily manufactured in the US, Germany and Japan. By 2010, however, China manufactured over half the world’s annual panel supply. China’s National ‘863 High-Tech Research’, ‘973 Basic Research’ program, and ‘Golden Sun’ and ‘Solar Rooftops’ initiatives supplied R&D and installation support for solar PV. Additionally, by 2011,
China’s only confirmed solar feed-in tariff applied to photovoltaic plants alone.
The fall in solar panel manufacturing prices means that installation is now the largest cost component of solar PV systems. Improvement of solar-to-electric power conversion efficiency—reducing the number of panels that need to be installed—is now increasingly important for further reductions in the overall cost of solar PV. The drive toward conversion efficiency has, in turn, encouraged innovation and R&D, elements which are now listed as basic principles within China’s Five-Year Plan for the Solar Photovoltaic Industry. Chinese solar PV manufacturers thus appear to have begun shifting their focus from manufacturing to innovation.
In the remainder of this section we present summary information around the solar PV activities of a number of major solar PV patent owners in China including Suntech and Yingli Green Energy. We also discuss the China activity of AppliedMaterialsInc(US), another major solar PV patent owner. The information is presented to help illustrate how market features and business strategies may impact commercial innovation and patent activities.
Historically, Chinese players in the solar PV space have focused on the conventional manufacture of silicon-based panels. However, more recently China has used its experience in scaling-up conventional panel
p—28
production to innovate in the solar PV market. China has pioneered methods for translating unconventional technologies, with non-domestic origins, into mass pro-duction. One example of this trend is Suntech’s simpli-fication, scale-up and commercial use of novel thin-film cell technology, originally developed at the University of New South Wales (Australia). In 2010 this technol-ogy was noted, by the US Secretary of Energy, as ‘a type of solar cell with world-record efficiencies’. In 2011 the same type of cell was used by Suntech to produce around 2.5 million solar panels.
Suntech was founded in 2001 by Dr. Zhengrong Shi. Before founding Suntech, he was active in solar PV re-search at the University of New South Wales. Suntech developed an active corporate-university research part-nership with the university and has co-filed a number of patents since 2001. The majority of Suntech’s patent portfolio is related to the manufacturing and devel-opment of solar PV cells using thin film, mono- and multi- crystalline silicon technology. In recent years, the company has diversified their technology portfolio, adding the production of Passivated Emitter and Rear Locally diffused cell (PERL) technology.
In another example of Chinese innovation, Yingli Green Energy (China), partnering with the Energy Research Centre of the Netherlands (ECN), announced in 2010 their capacity for the large scale production of solar panels with a conversion efficiency of 17.6% (signifi-cantly above the industry average of just over 14%). The partnership involved Yingli scaling up production of technology originally developed by ECN.
Suntech, arguably one of the most innovative Chinese solar PV companies, was declared bankrupt in March 2013. As one of the first movers in the space (many of whom signed long-term fixed-price silicon purchase contracts), Suntech found itself at a disadvantage to other later-moving companies as global silicon prices fell substantially over the years. Suntech’s difficulties may have also been compounded by being an early investor and producer in the PV panel manufactur-ing space, losing out to the significant advances in PV technology made in other countries over the 5 years prior to 2013. The manufacturing facilities of early mov-ers in the Chinese PV space were the first to become outdated as newer technologies became available and required different manufacturing facilities.64
There is also evidence of western companies moving R&D to China. In 2009, Applied Materials Inc. (ranked 22nd based on patent family filings with 131 patents filed between 2006 and 2011) opened the world’s larg-est, self-declared ‘most advanced’ commercial solar R&D facility in Xi’an, China. Applied Materials, Inc.
is a US-based global provider of equipment services and software for the manufacture of solar PV products that first entered into the solar PV patenting space in 2002. Recent patents from Applied Materials demon-strate innovation in the manufacturing and layering design of solar PV cells. Their commercial R&D ‘Solar Technology Center’ houses facilities for R&D engineer-ing, as well as product demonstration and testing for crystalline silicon and thin film solar manufacturing equipment. It also serves as hub for research collabo-rations with over 40 universities.
Applied Materials’ activity may also portend a popular path for future solar PV innovation in China. The company’s Chinese R&D facility is primarily concerned with testing, machine construction and acting as a location for customers to see demonstrations and work on equipment before installing it at their own facilities. The Solar Technology Center is not a production facility; rather it provides a new approach to research and design of entire solar PV assembly lines, and is focused on innovative production scale-up.
Given the role of China in the solar PV space to-date, it seems likely that the country will play an increasingly important role in the solar PV patent landscape.
6.5 fURTHER REAdINg
Global Cleantech 100: A Barometer of the Changing Face of Global Cleantech Innovation; Cleantech Group LLC. (2012).
Cost-Efficient and Sustainable Deployment of Renewable Energy Sources towards the 20% Target by 2020, and beyond; Energy Research Centre of the Netherlands. (2012).
European & Global Solar PV 2012–2017 (EPIA Report); European Photovoltaic Industry Association. (2013).
The Role of Energy Storage in the PV Industry - World – 2013 Edition; IHS Inc. (2013).
US Solar Market Trends 2010; Interstate Renewable Energy Council; Larry Sherwood. (2011).
62 Li, X., Li, Y. & Novak, J. P., 2011. Nanoparticle inks for solar cells. China, US, Patent No. WO2012075394A1.
63 Dagli, M. N., 2011. Three dimensional solar power systems and methods of mak-ing same. China, Patent No. WO2012054436A1.
64 The Economist, 2013. Sunset for Suntech. [Online] Available at: ow.ly/uEPdC

p—29
Section 7:WindEnergyPatent LandscapeWind energy, as a relatively mature technology space, is seeing incremental innovation focused predominately on turbine based solutions, including areas such as software and control systems for turbine technolo-gies and integration with other energy sources. R&D in offshore wind is advancing innovation and primarily relates to scaling up the size of turbines and increasing their durability. Overall, however, wind is an area with relatively low patenting rates.
Micro-wind solutions for urban environments, however, are seeing a ‘second wave’ of innovations. Another innovative area in the wind technology space is floating and underwater wind turbines and both were covered in the Chatham House report of 2009. At the time, the technology was in the early concept phase and has now begun to develop into prototypes.
7.1 TRENdS IN PATENT fAMILy fILINgS
Wind energy technology for the period 2006–2011 accounts for the third highest volume of patent family filings of all four CCMTs, but the second highest aver-age annual growth at 27% when compared to the other CCMTs. Technology drivers are primarily related to turbines, gearboxes and generator efficiency,
Figure 15: TECHNOLOgy TRENdS IN WINd ENERgy PATENT fAMILy fILINgS fROM 1975-2011
0
1000
2000
3000
4000
5000
6000
7000
8000
Pate
nt fa
mili
es
Turbines withperpendicular rotation(Y02E 10/74)
Components or gearbox(Y02E 10/722)
Turbines with rotationaxis in wind direction(Y02E 10/72)
Generator or configuration(Y02E 10/725)
Control or turbine(Y02E 10/723)
Othertechnologies
Patent filing year © 2012
which make up two-thirds of the recent patent filings (Figure 15).
7.2 TECHNOLOgy OWNERS
Table 7 provides a ranking of the top technology own-ers in wind energy based on patent ownership. Of the four technology landscapes reviewed in this report, wind energy is the only space that does not contain any universities or public sector research institutions among the top 20 technology owners. A contributing factor could be the relative maturity and established technological systems within the technology space.
The top 20 entities account for 10% of the patent family filings in the technology landscape. This is the second highest concentration of ownership (following solar PV). Eight of the top 20 technology owners (or 40%) in the wind energy space are from European countries. The other technology landscapes on average only feature 0-30% European based owner-ship. Of the European economies, Germany notably features prominently.
From the emerging economies, the rapid rise of Suzlon and Sinovel as technology owners—ranked fifth and seventh, respectively—can be attributed in large part to their strategic pursuit of knowledge acquisition through a strategy of licensing and M&A. Of the top ten technology owners, these two com-panies are the only market players from emerging economies. A discussion of their activities and strate-gies is presented in the case study section below.

p—30
Table 7: TOP 20 TECHNOLOgy OWNERS IN WINd ENERgy
Rank Rank Technology Country/Region Patent families 2006-2011 1975-2005 Owners of Company HQ 2006-2011 1 2 5 General Electric USA 6742 11 5 Siemens AGi Germany 4893 1 6 Mitsubishi Japan 386 4 4 6 Vestas Wind Sys As Denmark 2375 8 5 Suzion Energy (REpower Systems) India (Germany) 1856 20+ 6 Samsung Republic of Korea 1367 20+ 5 Sinovel Wind Group Co Ltd China 1368 20 5 Nordex Energy Gmbh Germany 1349 14 6 Gamesa Innovation & Tech SI Spain 13410 20+ 5 Robert Bosch Gmbh Germany 11111 20+ 6 Guodian United Power Tech Co China 9812 20+ 4 Sany Electric Co Ltd China 96 13 20+ 5 G Obrazovatel Noe Uchrezhdenie Russia 7714 5 5 Hitachi Ltd Japan 7715 3 5 Enercon (Wobben Aloys) Germany 7316 20+ 6 Daewoo Republic of Korea 5717 10 5 LM Wind Power As Denmark 5618 20+ 5 Wuxi Tongchun New Energy Technology China 4919 20+ 5 Shenyang Ruixiang Wind Energy Equipment Ltd China 4720 20+ 6 Alsto Wind SLU France 45
7.3 KEy MARKETS
Over 30% of recent global wind energy patent filings were in China (Figure 16). This large percentage is not surprising given China’s patenting activity in the other CCMTs reviewed in this report. Additionally, the multinational composition of the top technology own-ers suggests that a number of international corpora-tions likely use China as a manufacturing base and therefore find it useful to file patents in China. The US, EPO, Republic of Korea and Japan filings account for the other 40%. The strong representation of European and EPO patent filings reflect both the base of opera-tions of the technology owners and the current mar-kets in which wind technology is most heavily de-ployed and invested. For European patent first filings, the highest percentage is from Germany, accounting for 9% of the total recent filings. One notable differ-ence in the wind energy area as compared to other
CCMTs is the lower profile of Japan, a historical trend that has become more visible in recent years.
The Republic of Korea shows an increasing share of filings. While this is a trend we see in the other CCMT landscapes, it is more prevalent here than in biofuels and solar PV, likely due to the emergence of Samsung and Daewoo as major technology players (Table 7).
China is the most common office of first filing for wind energy, which is somewhat surprising considering that only 25% of the top 20 patent filing companies are Chinese. There has again been a considerable reduction in the dominance of Japan and Germany as an office of first filing, with the Republic of Korea more than tripling its share (Figure 17). How the players from emerging economies are increasingly making an impact is discussed in the next sub-section and case study.
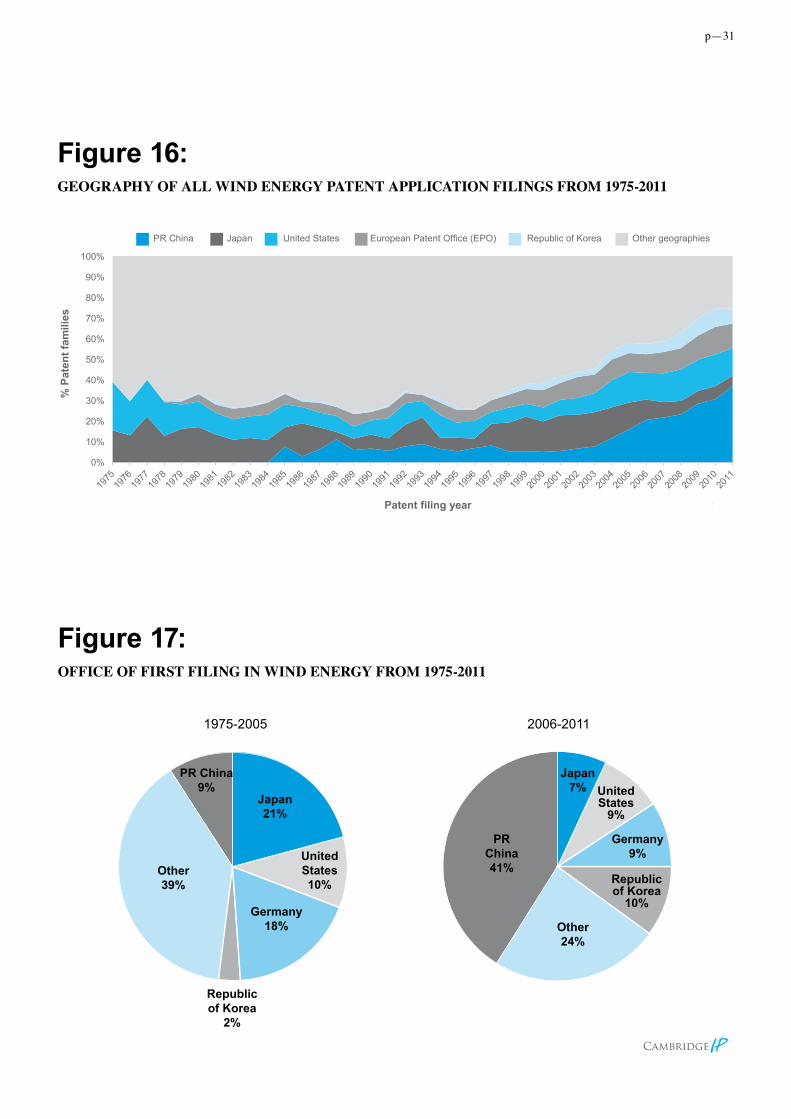
p—31
Figure 16: gEOgRAPHy Of ALL WINd ENERgy PATENT APPLICATION fILINgS fROM 1975-2011
Figure 17:OffICE Of fIRST fILINg IN WINd ENERgy fROM 1975-2011
0%
10%
20%
30%
40%
50%
60%
70%
80%
90%
100%
% P
aten
t fam
ilies
PR China Japan United States European Patent Office (EPO) Republic of Korea Other geographies
Patent filing year © 2012
Japan21%
United States10%
Germany18%
Republicof Korea
2%
Other39%
PR China9%
1975-2005
Japan7% United
States9%
Germany9%
Republicof Korea
10%
Other24%
PR China41%
2006-2011

p—32
7.4 CASE STUdy: PLAyERS fROM EMERgINg ECONOMIES MAKE AN IMPACT ON THE WORLd STAgE
Leading companies in the wind energy patenting space (see Table 7) include a number of global equipment manufacturers. However, also present are an increas-ing proportion of companies specializing in wind tech-nology and offering end-to-end solutions—a sign of the wind energy sector’s continuing evolution into a major, mainstream market. In contrast to the solar PV space, for example, where innovation step-changes are ob-served, the wind space is characterized by incremental developments in patented technology. Areas of note in recent years include continued improvements to turbine design, software and control systems.
The features described above are indicative of a space with an increasingly structured and concrete value chain (when compared with the other technology spac-es discussed in this report which still contain high rates of materials development, such as solar PV). Despite this, as discussed below, there is evidence that players from emerging economies are making an impact on the world stage in the wind energy sector. These issues are presented as summary information around the activities of a number of major wind technology patent owners in India (Suzlon) and China (Sinovel). The information is presented to help illustrate how market features and business strategies may impact commercial innovation and patent activities.
Suzlon, an end-to-end Indian wind turbine manufac-turer and supplier, began operations in the 1990s with a 3MW-capacity wind farm project in Gujarat. Today, the company has operations across 33 countries, including Brazil (since 2006), where Suzlon Energia Eólica do Brasil has grown to become a leading wind turbine sup-plier with over 388MW of installed capacity and more than 363MW currently under construction. At the end of 2011, Suzlon was 5th on a global ranking of cumulative installed wind turbine capacity. As shown previously (Table 7), Suzlon also continues to climb the ranks of top wind technology patent owners.
Since its creation, Suzlon has pursued a strategy of technology and company acquisition, and has achieved growth through knowledge diffusion (via licence acquisition), as well as M&A of companies with com-plementary strengths. The success of Suzlon may be attributed to its acquisition and customization-based business strategy. Suzlon’s current patent portofilo mainly focuses on construction65 and control systems66 for wind energy turbines.
After beginning its wind turbine manufacturing with a licence from Südwind (Germany), Suzlon later purchased Dutch rotor-blade designer AE-Rotor
Techniek (in 2000) to form Suzlon Blade Technology B.V. In 2006, Suzlon acquired Hansen Transmission International NV, one of the world’s largest wind energy gearbox manufacturers at the time (now sold). In 2009, Suzlon acquired the majority shareholding in REpower Systems (a German wind turbine company), for EUR 1.3 billion, and achieved full control of the company in 2011.
Suzlon’s acquisition strategy has placed a strong em-phasis on obtaining complementary product portfolios. The acquisition of blade technology (from AE-Rotor Techniek) and gearbox technology (from Hansen Transmission) filled fundamental gaps in Suzlon’s sup-ply chain and thereby established the company as a leading integrated wind turbine manufacturer.
Suzlon’s acquisition strategy has also been developed with an eye on customization.67 REpower Systems has a history of producing adaptable designs and power plant projects that integrate wind turbines into their environment. Suzlon also appears to have ambitions to become a significant player in as-yet untapped offshore wind energy markets: REpower Systems’ background in adaptable designs has allowed development of a 6.15MW offshore-model wind turbine, which ranks among the most powerful in the world.68
In a similar fashion to Suzlon, Chinese company Sinovel, a relative newcomer to the wind energy market, also benefitted at an early stage from licenses (acquired from Fuhrländer, Germany). Other Chinese companies to use this strategy include A-Power, CSIC, Beizhong, Windey and Zhuzhou (licensing from European/US companies Norwin, Aerodyn, DeWind, REPower, and Windtec, respectively).
Since its founding in 2004, Sinovel has experienced massive growth, becoming the largest wind turbine manufacturer in China in 2011. By 2012, Sinovel achieved a global ranking of 9th by installed capacity. Interestingly, Sinovel’s first filing as original assignee was not until 2010. Previously, Sinovel acquired intel-lectual property through many M&A’s and licensing deals that the company pursued as a method of market entry. This growth is also evidenced by Sinovel’s patenting activity (see Table 7), which reflects the company’s involvement in the development, engineer-ing and manufacturing of onshore, offshore and inter-tidal wind turbines.
The growth of Sinovel has been supported by strategic partnerships and co-development, in particular with the American Superconductor Corporation (AMSC; US). The relationship with AMSC, which began in 2005, was designed to provide Sinovel with AMSC’s core electri-cal components, as well as engineering support and power electronics for wind turbines co-developed by

p—33
the two companies. In 2009, Sinovel began export-ing 3MW wind turbines for the onshore and offshore markets, and their strategic partnership with AMSC was subsequently expanded in 2010 to include addi-tional turbine designs.69 More recently, in 2012, Sinovel and Mita-Teknik (a supplier of control systems for wind turbines) announced a large scale co-development project designed to produce next-generation custom-ized control systems to serve clients globally. Under the agreement, Sinovel owns the intellectual property rights to the modified and upgraded versions of the software and source code.70
7.5 fURTHER REAdINg
Building a National Wind Turbine Industry: Experiences from China, India and South Korea,” International Journal of Technology and Globalization 5, No. 3/4: 281-305. (2011).
Current and Future Trends in Wind Turbine Technology; Totaro & Associates. (2011).
Medium-Term Renewable Energy Market Report; International Energy Agency (IAEA). (2013).
Patent-based Technology Analysis Report—Alternative Energy Technology; World Intellectual Property Organization (WIPO). (2011).
65 Kuehlmeier, L., Mortensen, F. & Peterslund, 2012. Wind turbine blade construc-tion. s.l. Patent No. WO2012119778A1.
66 Willauschus, O., Vilbrandt, R., Schulz & Michael, 2011. Overvoltage-protected control unit for an adjusting system of wind turbine rotor blades. US, Patent No. WO2011104318A1.
67 The Economic Times, 2012. Featured content: Customization is key for Suzlon’s success, says CEO. [Online] Available at: ow.ly/uQuys
68 REpower Systems, 2014. The Next Step. [Online] Available at: ow.ly/uQsXa
69 AMSC, 2010. AMSC and Sinovel Expand Strategic Partnership. [Online] Available at: ow.ly/uQtui
70 Sinovel, 2012. Sinovel Wind Group and Mita-Teknik announces large-scale coop-eration at joint press conference on EWEA 2012 in Copenhagen. [Online Available at: ow.ly/uQtKi

p—34
Section 8:Conclusions Patenting activity levels are rising
The research presented in this Global Challenges Report shows significantly increased patenting activity in the biofuels, solar thermal, solar PV and wind energy sectors since 2006:
• The average annual growth rate of patent filings in each of the focus CCMTs exceeds the global aver-age increase for all technologies. The combined average growth rate for CCMTs in 2006–2011 was 24%. The global average for all technologies in the same period was 6%.
• Particularly striking is the fact that the volume of pat-ents filed in these CCMTs in the five years between 2006 and 2011 exceeds the total volume of patents filed in these areas in the preceding 30 years.
• Within the four CCMTs, solar PV has the highest number of patent filings, followed by solar thermal, wind energy and biofuels.
• The high growth rate in patent filings in the focus CCMTs is a clear indication of increased commercial interest and innovation in these renewable energy technology solutions. This could potentially compli-cate the navigation of relevant patent landscapes, which are increasingly international and crowded.
Markets and manufacturing locations are increasingly global
Around the four CCMTs, patenting activity aimed at protecting markets and manufacturing is becoming increasingly global. The participation of major emerging economies in the CCMT patent landscapes is increas-ingly significant:
• China and the Republic of Korea have contributed most in terms of number of patent applications across all four focus CCMTs in recent years.
• An increased use of both the EPO and PCT systems was observed. Since 2006, over 30% of the patents filed in the four CCMT areas are filed under the PCT. This is likely the result of an increasingly globalized market for CCMTs. There has been a noticeable shift from patents filed in a single European jurisdiction to the use of the EPO as a clearinghouse to file in multiple European jurisdictions.
• IPR concentrations have decreased across three of the four patent landscapes; wind is the exception. This shift in the biofuel, solar thermal and solar PV sectors could be an indicator of increased globaliza-tion and competition, with players from more coun-tries actively patenting.
The CCMT technological areas and players are diverse
The patenting activity observed is contributed by a highly diverse range of players, including multinational companies, SMEs, research institutes and universities:
• The composition of technology ownership varies between the four CCMTs. Notably, biofuels contains a high proportion (over 50%) of universities and research institutions in the top 20 technology owners assessed by volume of patents.
• The other technology landscapes have, at most, a quarter (solar thermal), or (in the case of wind energy) no university or research institutes in the top 20 technology owners.
• Solar PV differs from the other focus CCMTs in that all of the top 20 technology owners are based in Asia.
• Patenting activity in each of the focus CCMTs concerns a wide range of technologies at different stages of development and maturity. Recent areas of innovation within each of the CCMT patent land-scapes include:
- Biofuel: Advances in biodiesel, fuel from waste and production by fermentation or organic by-products by methods of energy conversion.
- Solar thermal: Advances in the coating, manufac-turing and resilience of glass material (especially as they relate to heat exchange systems), the de-velopment of control systems relating to tracking, and integration with energy storage technologies.
- Solar PV: Advances in manufacturing and design of PV systems, and improved materials. There is also recent emerging innovation in flexible, three-dimensional and nanomaterials.
- Wind energy: Advances in turbine based solu-tions, including areas such as software and control systems for turbine technologies and inte-gration with other energy sources. Offshore wind innovations are focused on increasing the size and durability of turbines.

p—35
Intellectual property concentrations are diverse and shifting
IP concentrations assess the concentration of pat-ent ownership in a patent landscape. In this report, IP concentration is assessed by the proportion of patents held in each patent landscape by the 20 most patent active companies (by number of patent family filings). Concentration levels can be indicative of a range of features within technology markets. Particular drivers range from the age or maturity of a technology space, capacity for technology crossover from other industries, prevalence of M&A activity, R&D investment, govern-ment policies (such as feed-in-tariffs) and barriers to entry for new players. Higher concentrations can also be indicative of the market establishment of a particular technological solution, which through the development of economies of scale, can decrease and de-incentivize investment in new and innovative technologies.
Figure 3 in the Executive Summary illustrates the dif-ferences in the level of IP concentration between the patent landscapes of the four CCMTs in the period 1975-2005 and 2006-2011. In the first period, IP con-centration decreased across all four patent landscapes, with the exception of wind. This shift is perhaps indica-tive of increased globalization and competition, with players from more countries around the world becom-ing patent active in the relevant technology areas.
The wind energy sector has the highest and most consistent IP concentration among the four focus areas
across the two time periods. This is likely indicative of the relative maturity of wind technologies compared to technologies in the other sectors. Market players in the wind energy field have remained relatively consistent, with recent entrants coming mostly from China (Table 7). Additionally, wind energy is a technology area that has benefited from ‘crossover’ technologies from other fields (for example the aerospace market, which pro-vides components such as blades, turbines and com-posite materials for wind turbines).
The relatively low IP concentration in biofuels is particu-larly striking. A low IP concentration can be indicative of a fragmented industry or one in which there is still a substantial amount of basic research and development required, or a relatively high level of technology system customization required.
Discourse around IP rights and technology transfer at the international level remains important
Technologies will continue to play an important role in solving the global challenge of climate change. This report provides evidence of increasing rates of global commercial innovation and interest in CCMTs from a range of players across developed and emerg-ing economies as per the patent landscapes that were analyzed. These findings underline the importance of efforts to facilitate continued discussions around intel-lectual property and technology transfer at the interna-tional level.

p—36
AcknowledgementsThe authors would like to thank Traci Wai, Philip Stevens, Anja von der Ropp, Lutz Mailänder, Anatole Krattiger, Konji Sebati, Christian Wichard and Hao Zhou (WIPO staff) and Ben Pellegrini and Harry Miller (CambridgeIP team members) who contributed significantly in addition to authors.

p—37
Annex:Backgroundon Patent IntelligenceThis report was developed to contribute to the evidence base of the role of renewable energy technologies in climate change mitigation. Patent data provides valuable empirical data about the investment into and evolution of renewable energy technologies. This evidence can be used in a business context in a variety of ways, such as to inform in the acquisition or licensing of a technology, building a business case for technology commercialization, or supporting R&D strategy development.
Patents registered around the world represent a global technology library that contains information on:
• technology concepts,
• the implementation of those concepts,
• details of who created and owns the concepts.
Patents are a useful indicator of commercially valuable inventions. Generally, individuals and companies are only prepared to invest in securing patents where they believe there is commercial advantage in doing so.
Patents are an important source of structured and accurate information about inventors, technology, innovation and technology organizations, globally. Aggregating patents around an industry or relative to a specific technology can reveal important trends and comparisons about the origins of a technology, the direction that a technology space is moving towards and the evolving composition of industry players. It also helps identify the most important (commer-cially or scientifically) patent documents in a space. Information based on the analysis of patent data can be a highly reliable source of information to support and accelerate decision-making in both the public and private sector.
A patent family71 may represent a specific technological innovation. Patent documents are geographically specific, while technologies can flow across countries. Consequently an inventor seeking patent protection of the same technology in more than one country will end up having multiple patents protecting the same technology or invention. This is broadly referred to in the patent literature as ‘patent families’. A product may be underpinned by multiple patent families, especially where a product is based on the integration of multiple technologies.
Hence, in patent landscaping, patent families can be used as a proxy for the number of innovations around a technology space.
Patent landscape reports integrate the results of expert analysis of patent datasets, which broadly repre-sent an industry or technology of interest. As the num-ber of patents within industries and technology areas increases, patent landscapes become an increasingly relevant framework of reference for technology, policy and business analyses and decision-making. Among its many uses, patent landscapes serve to:
• support the development of a company’s IP strat-egy (including freedom to operate, white space and patentability analysis),
• understand the competitive landscape in R&D-intensive fields,
• identify emerging technologies and technology trends within an industry,
• support improved targeting of innovation and indus-trial policies, and evaluation of their impact,
• identify networks of inventors and knowledge flows within industries and between countries.


2014For more information, contact WIPO at www.wipo.int
World Intellectual Property organization34, chemin des ColombettesP.O. Box 18CH-1211 Geneva 20Switzerland
Telephone: +4122 338 91 11email: [email protected]
This report was prepared by Sarah Helm, Senior Associate at CambridgeIP with responsibility for Energy and Clean Technology projects ([email protected]), Quentin Tannock, Chairman of CambridgeIP who leads CambridgeIP’s engagements with international organizations and major corporations, and Ilian Iliev, Director of CambridgeIP and a co-author of the 2009 Chatham House Report Who owns our low carbon future? Intellectual Property and Energy Technologies). www.cambridgeip.com
A companion Global Challenges Brief is published separately (visit www.wipo.int/globalchallenges) and provides an overview of issues, including key implications and considerations for policy and policymakers.
Citation: Helm, S., Q. Tannock and I. Iliev, 2014. Renewable Energy Technology: Evolution and Policy Implications—Evidence from Patent Literature. Global Challenges Report, WIPO: Geneva. www.wipo.int/globalchallenges
WIPO Global Challenges Reports provide in-depth analysis and discussions of issues relevant to debates about solutions to global challenges, such as climate change, public health and food security.
The views expressed in this work are those of the author and do not necessarily represent the positions or opinions of the Secretariat of WIPO or its Member States.