Embed Size (px)
Citation preview
Global BalancedQ2 2021
Global Balanced Q2 2021
WestEnd Advisors Overview
FIRM HIGHLIGHTS
• Employee-Owned Asset Management Firm
• Experienced Investment Team Focused on Macro-Based Process
• Investment Strategies for Brokerage Firms and Institutions
• Managing ETF-Only Strategies since 2005
• Headquartered in Charlotte, North Carolina
westendadvisors.com | [email protected] | 888.500.9025 1
The cornerstone of our investment process is that the macroeconomic environment is a key driver of financial market returns.
Global Balanced Q2 2021
Global Balanced Overview
STRATEGY HIGHLIGHTS
• Diversified ETFs from Leading U.S. Providers
• Long Only, Multi-Asset – Equity and Fixed Income
• Global Macro-Focused
• Typically 8 to 15 Holdings
• No Leverage, Derivatives, or Options
• Low-Turnover Strategy
• Inception January 2005
westendadvisors.com | [email protected] | 888.500.9025 2
WestEnd Advisors believes that investments in areas of global equity and fixed-income markets in their economic time will outperform the broader market.
Global Balanced Q2 2021
Global Balanced Investment Process
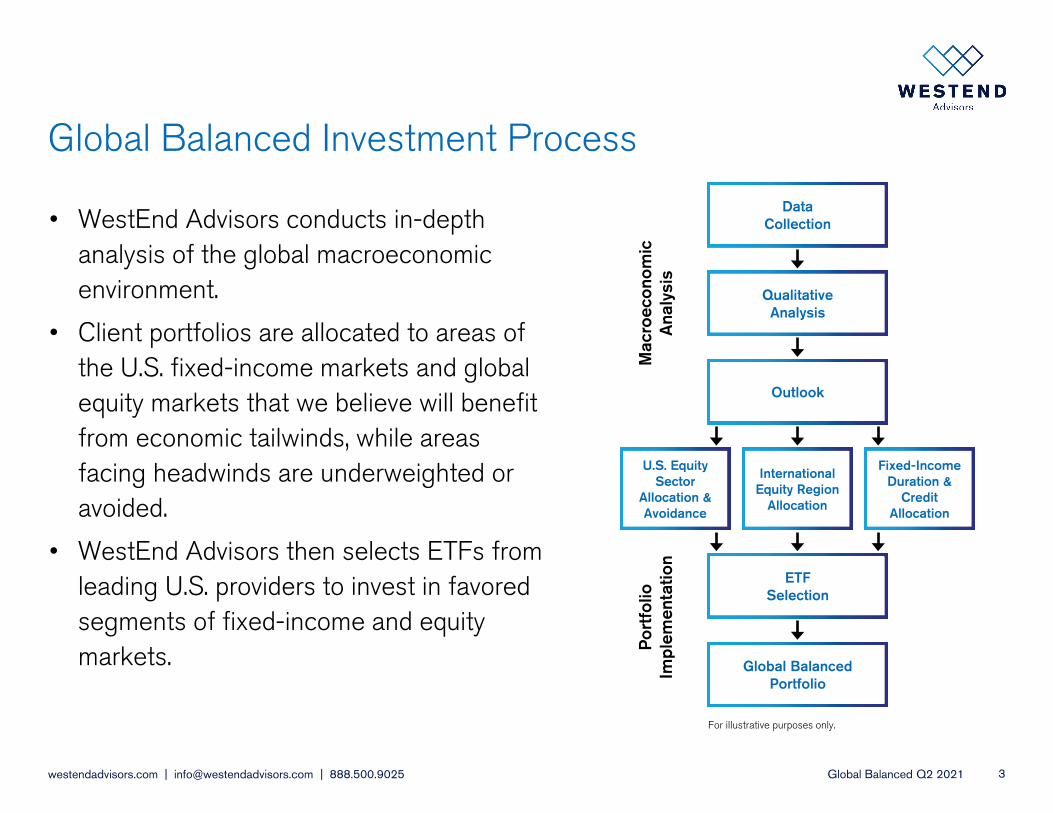
• WestEnd Advisors conducts in-depth analysis of the global macroeconomic environment.
• Client portfolios are allocated to areas of the U.S. fixed-income markets and global equity markets that we believe will benefit from economic tailwinds, while areas facing headwinds are underweighted or avoided.
• WestEnd Advisors then selects ETFs from leading U.S. providers to invest in favored segments of fixed-income and equity markets.
westendadvisors.com | [email protected] | 888.500.9025 3
Data Collection
QualitativeAnalysis
Outlook
Mac
roec
onom
icA
naly
sis
Por
tfol
ioIm
plem
enta
tion
ETFSelection
Global Balanced Portfolio
U.S. Equity Sector
Allocation & Avoidance
InternationalEquity Region
Allocation
Fixed-Income Duration &
CreditAllocation
For illustrative purposes only.
Global Balanced Q2 2021
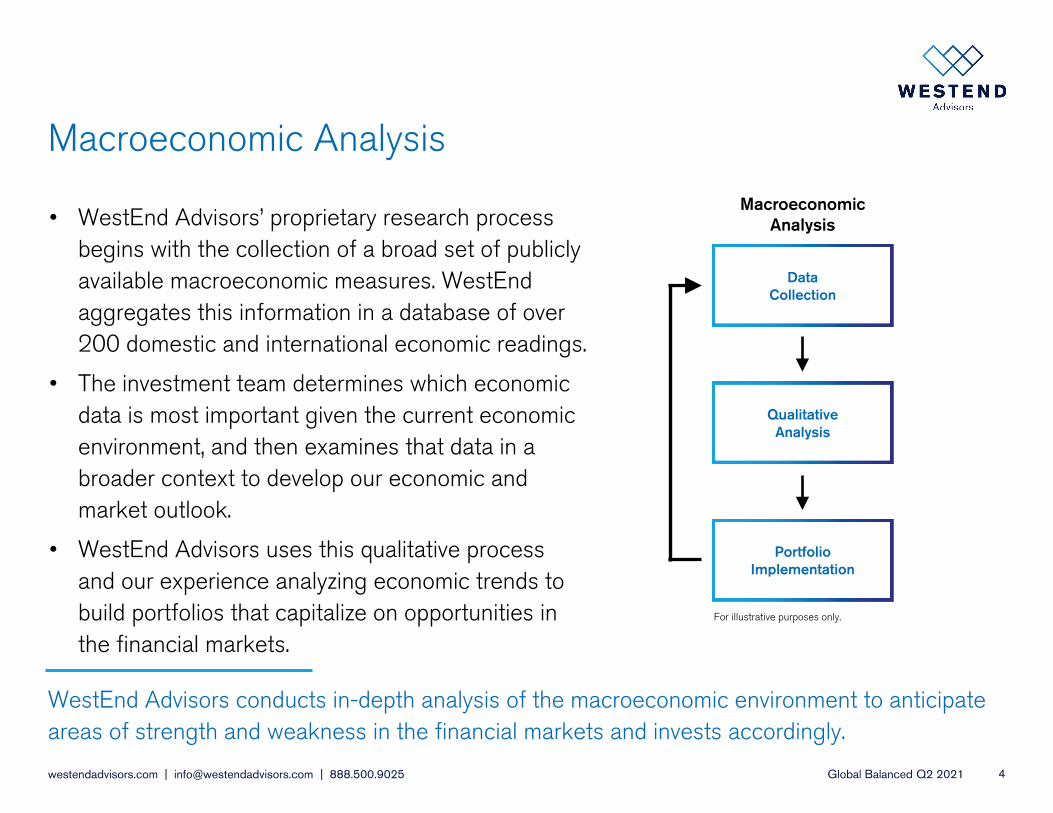
WestEnd Advisors conducts in-depth analysis of the macroeconomic environment to anticipate areas of strength and weakness in the financial markets and invests accordingly.
Macroeconomic Analysis
westendadvisors.com | [email protected] | 888.500.9025 4
• WestEnd Advisors’ proprietary research process begins with the collection of a broad set of publicly available macroeconomic measures. WestEndaggregates this information in a database of over 200 domestic and international economic readings.
• The investment team determines which economic data is most important given the current economic environment, and then examines that data in a broader context to develop our economic and market outlook.
• WestEnd Advisors uses this qualitative process and our experience analyzing economic trends to build portfolios that capitalize on opportunities in the financial markets.
Data Collection
QualitativeAnalysis
PortfolioImplementation
MacroeconomicAnalysis
For illustrative purposes only.

Global Balanced Q2 2021
Identify Areas of Economic Strength
westendadvisors.com | [email protected] | 888.500.9025 5
• WestEnd Advisors evaluates the relative strength of fixed-income and equity markets and positions portfolios accordingly.
• WestEnd targets U.S. fixed-income instruments we believe to be in their economic time.
• The investment team then determines areas of strength and weakness in global equity markets and overweights or underweights U.S. versus international equities.
• The U.S. large-cap equity allocation of the Global Balanced strategy is invested in large-cap sector ETFs, while the strategy may also have exposure to U.S. small/mid-cap equity ETFs based on our macroeconomic outlook.
• In the international equity allocation of the strategy, WestEnd overweights or underweights developed markets and emerging markets based on our assessment of the macroeconomic backdrop.
Equity & Fixed-Income Markets
U.S. Small/ Mid-Cap
U.S. Fixed Income
International Developed & Emerging
Interest Rate
Sensitivity
Global Equities
U.S. Large-Cap
Sectors
Credit Quality
ETF Selection
Global Balanced Portfolio
For illustrative purposes only.
Global Balanced Q2 2021
Areas of Strength: Fixed Income vs. Equity
westendadvisors.com | [email protected] | 888.500.9025 6
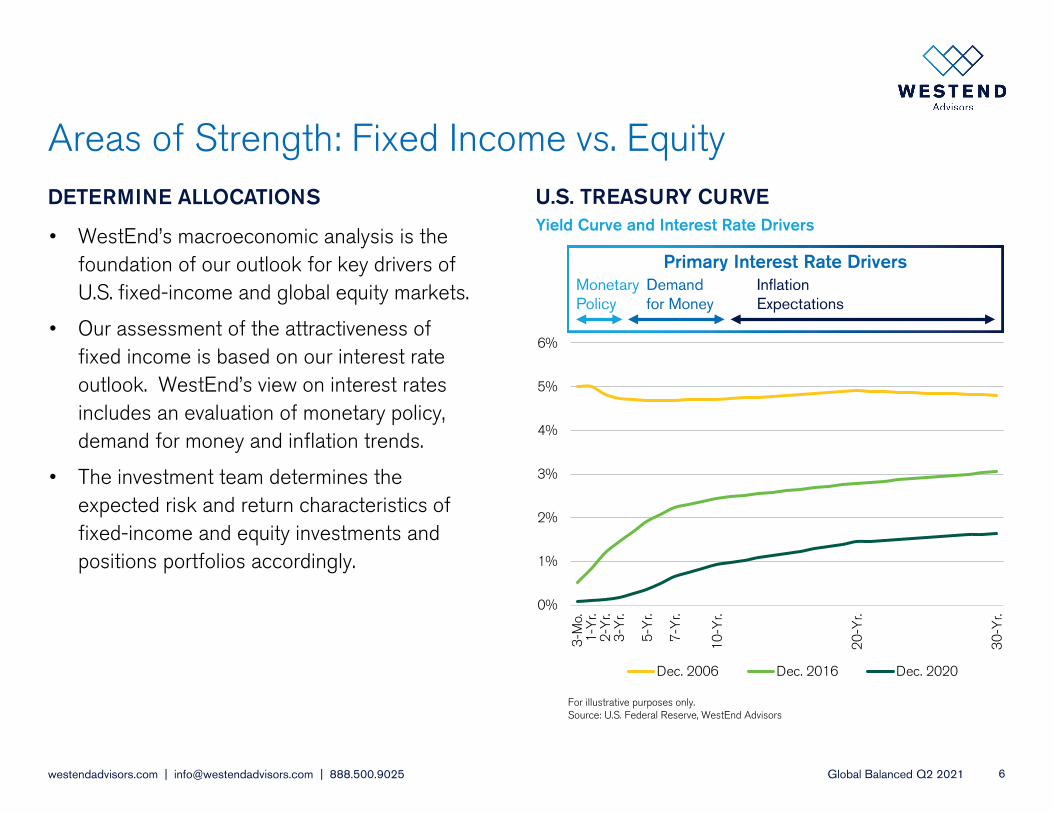
• WestEnd’s macroeconomic analysis is the foundation of our outlook for key drivers of U.S. fixed-income and global equity markets.
• Our assessment of the attractiveness of fixed income is based on our interest rate outlook. WestEnd’s view on interest rates includes an evaluation of monetary policy, demand for money and inflation trends.
• The investment team determines the expected risk and return characteristics of fixed-income and equity investments and positions portfolios accordingly.
Yield Curve and Interest Rate Drivers
For illustrative purposes only.Source: U.S. Federal Reserve, WestEnd Advisors
DETERMINE ALLOCATIONS U.S. TREASURY CURVE
0%
1%
2%
3%
4%
5%
6%
3-M
o.1-
Yr.
2-Y
r.3-
Yr.
5-Y
r.
7-Y
r.
10-Y
r.
20-Y
r.
30-Y
r.
Dec. 2006 Dec. 2016 Dec. 2020
MonetaryPolicy
Inflation Expectations
Primary Interest Rate DriversDemand for Money
Global Balanced Q2 2021
Areas of Strength: U.S. Fixed Income
westendadvisors.com | [email protected] | 888.500.9025 7
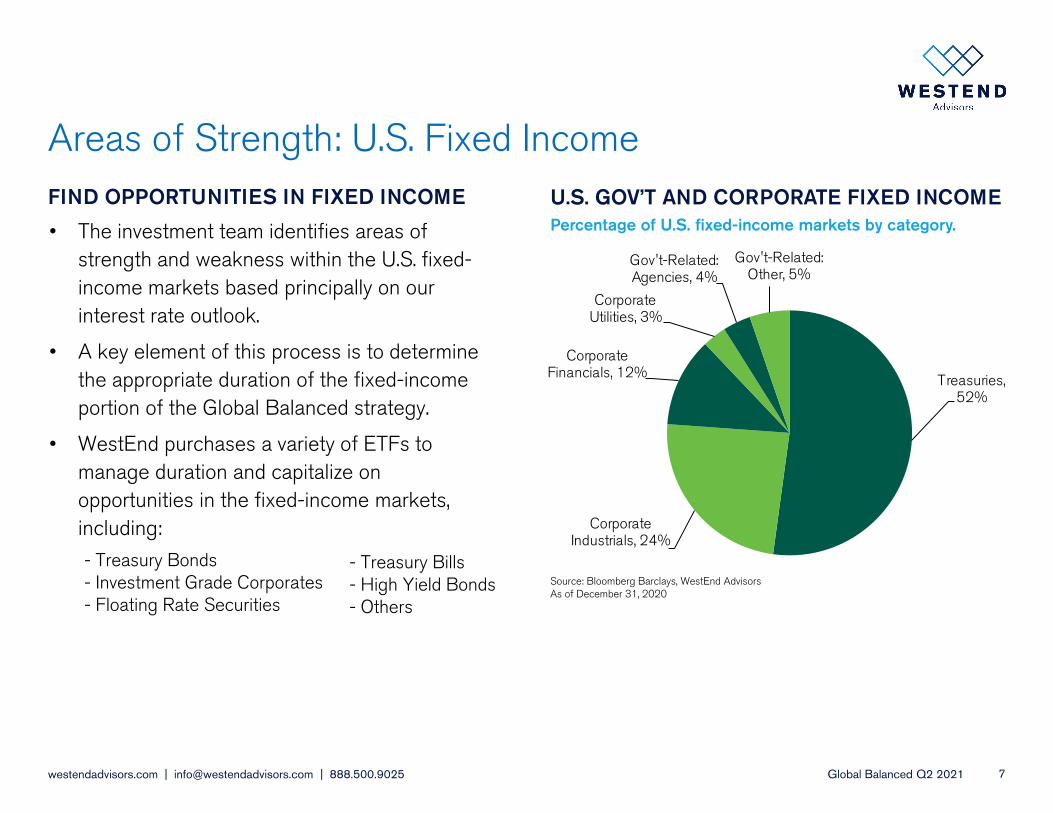
• The investment team identifies areas of strength and weakness within the U.S. fixed-income markets based principally on our interest rate outlook.
• A key element of this process is to determine the appropriate duration of the fixed-income portion of the Global Balanced strategy.
• WestEnd purchases a variety of ETFs to manage duration and capitalize on opportunities in the fixed-income markets, including:
- Treasury Bills- High Yield Bonds- Others
- Treasury Bonds - Investment Grade Corporates- Floating Rate Securities
Source: Bloomberg Barclays, WestEnd AdvisorsAs of December 31, 2020
FIND OPPORTUNITIES IN FIXED INCOME U.S. GOV’T AND CORPORATE FIXED INCOMEPercentage of U.S. fixed-income markets by category.
Treasuries, 52%
Corporate Industrials, 24%
Corporate Financials, 12%
Corporate Utilities, 3%
Gov't-Related: Agencies, 4%
Gov't-Related: Other, 5%

Global Balanced Q2 2021
Areas of Strength: U.S. vs. International Equities
westendadvisors.com | [email protected] | 888.500.9025 8
• WestEnd’s investment team analyzes key macroeconomic data from the U.S. as well as other major world economies to anticipate areas of economic and equity market strength in the environment ahead.
• WestEnd also gives consideration to other market factors as part of its analysis, including valuations, earnings growth, anticipated currency movements and liquidity.
• Decisions on allocations capitalize on our outlook for intermediate and long-term economic growth in the U.S. compared to the rest of the world.
Source: iShares, WestEnd AdvisorsAs of December 31, 2020
ANALYSIS OF MACRO ENVIRONMENT LEADING GLOBAL EQUITY MARKETSLargest equity markets as percent of global market capitalization.
United States, 57%
Japan, 7%
China, 5%
United Kingdom, 4%
France, 3%
Switzerland, 3%
Canada, 3%
Germany, 3%
Australia, 2%
Other, 14%
Global Balanced Q2 2021
Areas of Strength: U.S. Equities
westendadvisors.com | [email protected] | 888.500.9025 9
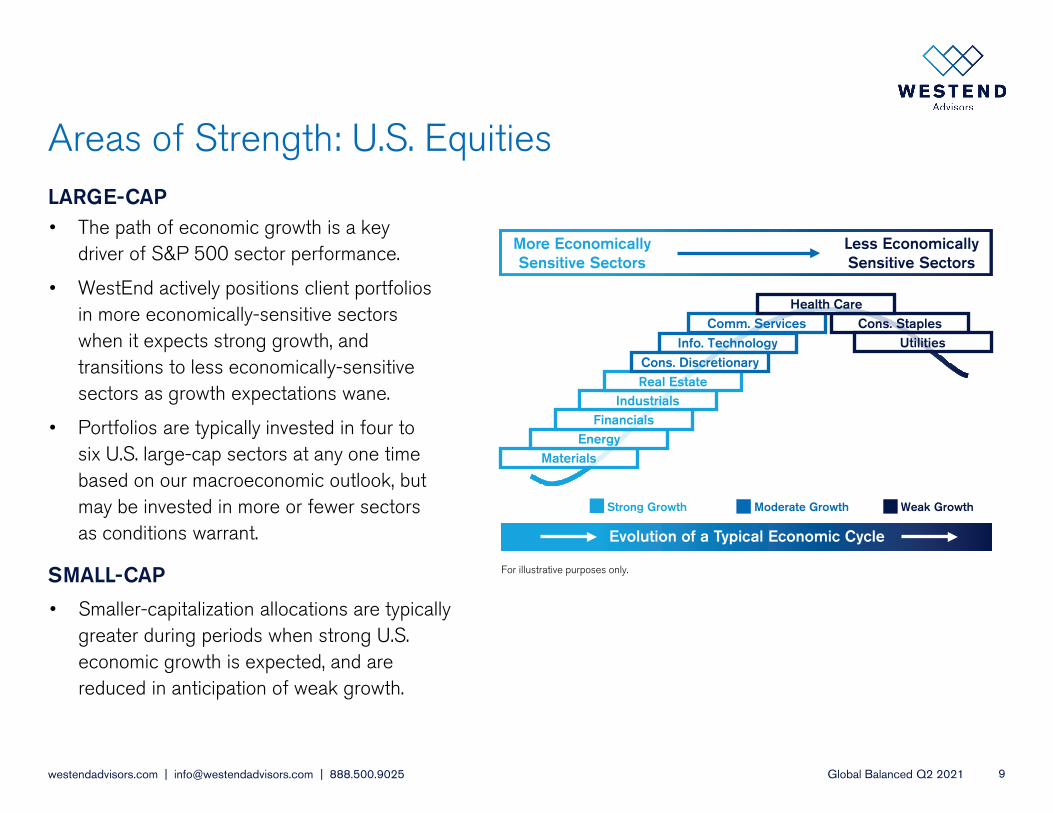
• The path of economic growth is a key driver of S&P 500 sector performance.
• WestEnd actively positions client portfolios in more economically-sensitive sectors when it expects strong growth, and transitions to less economically-sensitive sectors as growth expectations wane.
• Portfolios are typically invested in four to six U.S. large-cap sectors at any one time based on our macroeconomic outlook, but may be invested in more or fewer sectors as conditions warrant.
For illustrative purposes only.
LARGE-CAP
MaterialsEnergy
FinancialsIndustrials
Real Estate
Info. TechnologyComm. Services Cons. Staples
UtilitiesCons. Discretionary
Health Care
More EconomicallySensitive Sectors
Less EconomicallySensitive Sectors
Evolution of a Typical Economic Cycle
Strong Growth Moderate Growth Weak Growth
SMALL-CAP
• Smaller-capitalization allocations are typically greater during periods when strong U.S. economic growth is expected, and are reduced in anticipation of weak growth.
Global Balanced Q2 2021
Areas of Strength: International Equities
westendadvisors.com | [email protected] | 888.500.9025 10
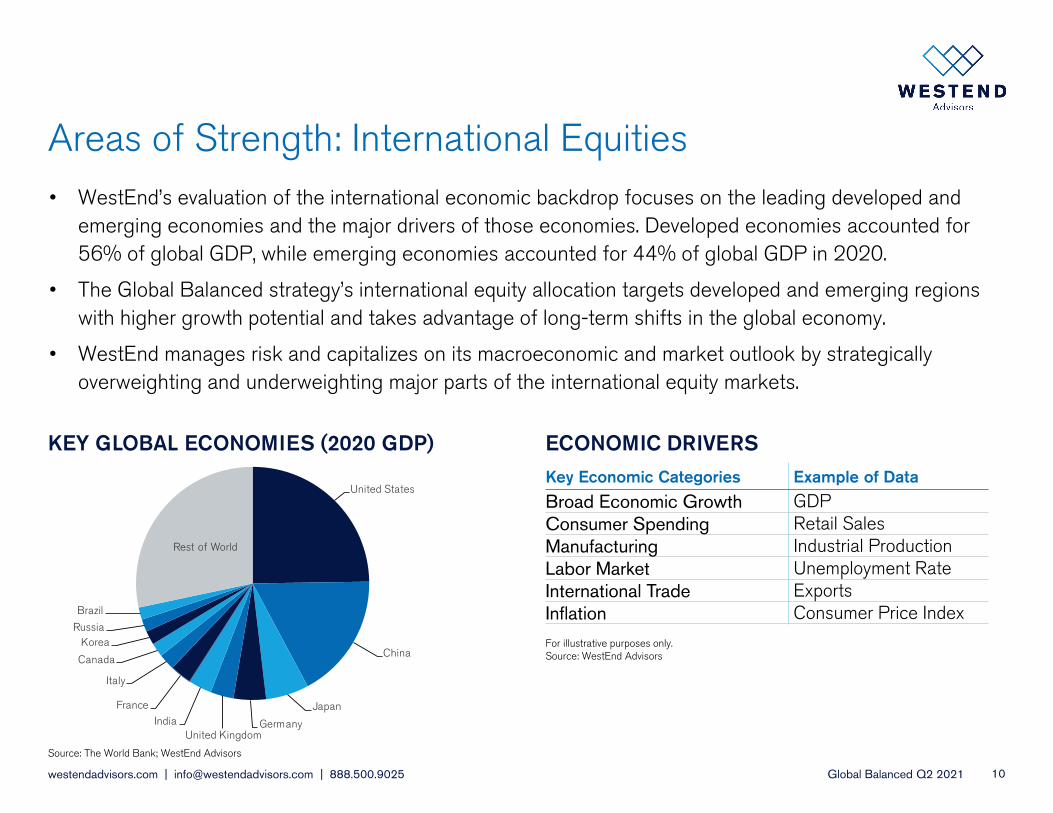
• WestEnd’s evaluation of the international economic backdrop focuses on the leading developed and emerging economies and the major drivers of those economies. Developed economies accounted for 56% of global GDP, while emerging economies accounted for 44% of global GDP in 2020.
• The Global Balanced strategy’s international equity allocation targets developed and emerging regions with higher growth potential and takes advantage of long-term shifts in the global economy.
• WestEnd manages risk and capitalizes on its macroeconomic and market outlook by strategically overweighting and underweighting major parts of the international equity markets.
For illustrative purposes only. Source: WestEnd Advisors
KEY GLOBAL ECONOMIES (2020 GDP) ECONOMIC DRIVERS
Key Economic Categories Example of Data
Broad Economic Growth GDPConsumer Spending Retail SalesManufacturing Industrial ProductionLabor Market Unemployment RateInternational Trade ExportsInflation Consumer Price Index
Source: The World Bank; WestEnd Advisors
United States
China
Japan
GermanyUnited Kingdom
IndiaFrance
Italy
Canada
KoreaRussia
Brazil
Rest of World
Global Balanced Q2 2021
ETF Selection
westendadvisors.com | [email protected] | 888.500.9025 11
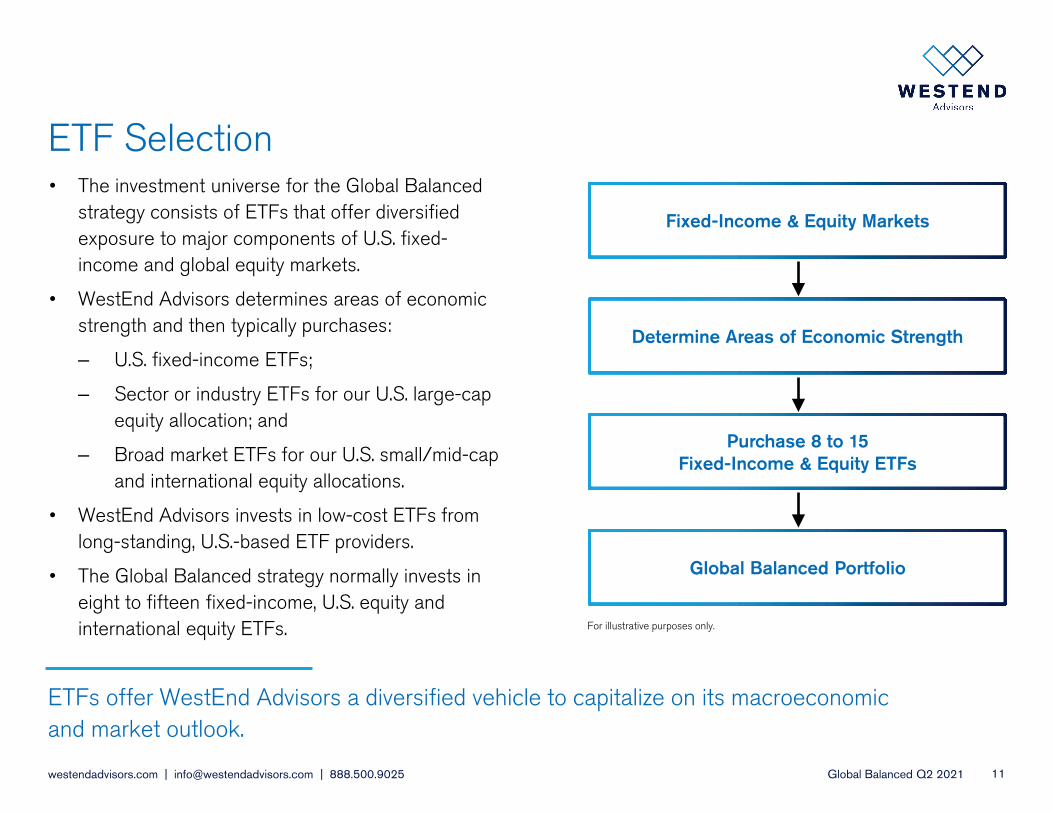
• The investment universe for the Global Balanced strategy consists of ETFs that offer diversified exposure to major components of U.S. fixed-income and global equity markets.
• WestEnd Advisors determines areas of economic strength and then typically purchases:
– U.S. fixed-income ETFs;
– Sector or industry ETFs for our U.S. large-cap equity allocation; and
– Broad market ETFs for our U.S. small/mid-cap and international equity allocations.
• WestEnd Advisors invests in low-cost ETFs from long-standing, U.S.-based ETF providers.
• The Global Balanced strategy normally invests in eight to fifteen fixed-income, U.S. equity and international equity ETFs.
Fixed-Income & Equity Markets
Determine Areas of Economic Strength
Purchase 8 to 15 Fixed-Income & Equity ETFs
Global Balanced Portfolio
ETFs offer WestEnd Advisors a diversified vehicle to capitalize on its macroeconomic and market outlook.
For illustrative purposes only.
Global Balanced Q2 2021
$0.50
$1.00
$1.50
$2.00
$2.50
$3.00
$3.50
$4.00
$4.50
Global Bal., Gross Benchmark
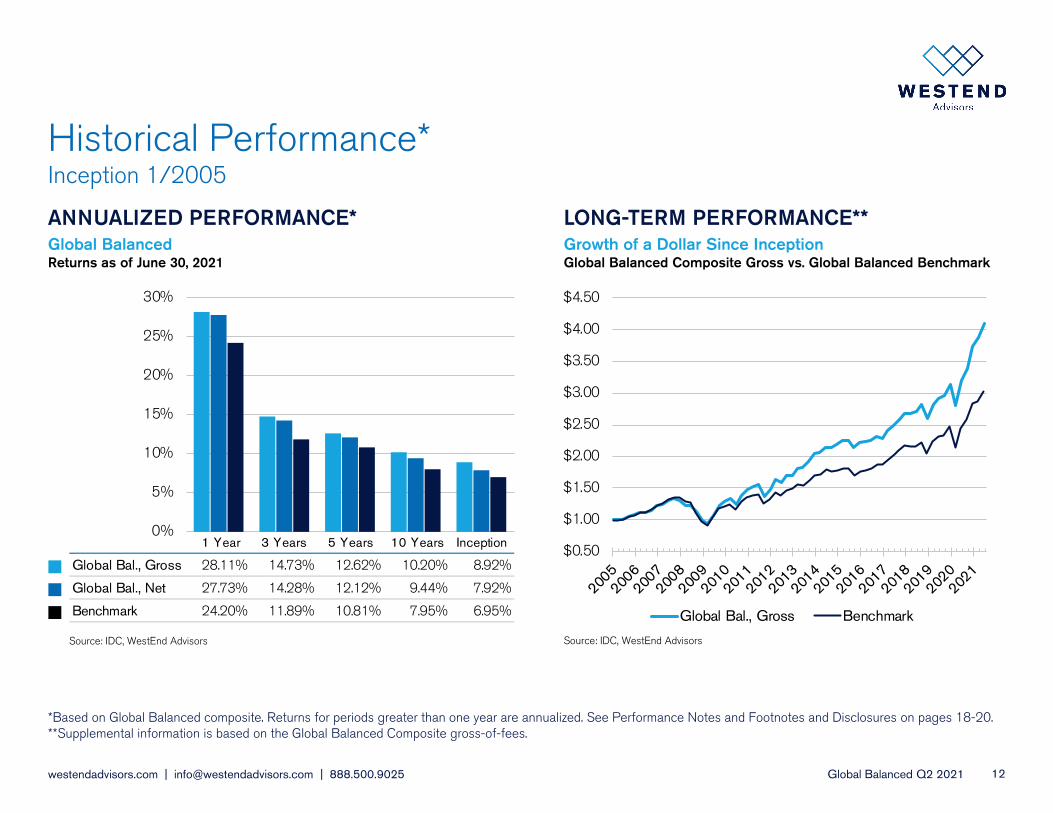
1 Year 3 Years 5 Years 10 Years Inception
Global Bal., Gross 28.11% 14.73% 12.62% 10.20% 8.92%
Global Bal., Net 27.73% 14.28% 12.12% 9.44% 7.92%
Benchmark 24.20% 11.89% 10.81% 7.95% 6.95%
0%
5%
10%
15%
20%
25%
30%
Historical Performance*
westendadvisors.com | [email protected] | 888.500.9025 12
*Based on Global Balanced composite. Returns for periods greater than one year are annualized. See Performance Notes and Footnotes and Disclosures on pages 18-20.**Supplemental information is based on the Global Balanced Composite gross-of-fees.
ANNUALIZED PERFORMANCE*Global BalancedReturns as of June 30, 2021
LONG-TERM PERFORMANCE**Growth of a Dollar Since InceptionGlobal Balanced Composite Gross vs. Global Balanced Benchmark
Inception 1/2005
Source: IDC, WestEnd Advisors Source: IDC, WestEnd Advisors
Global Balanced Q2 2021
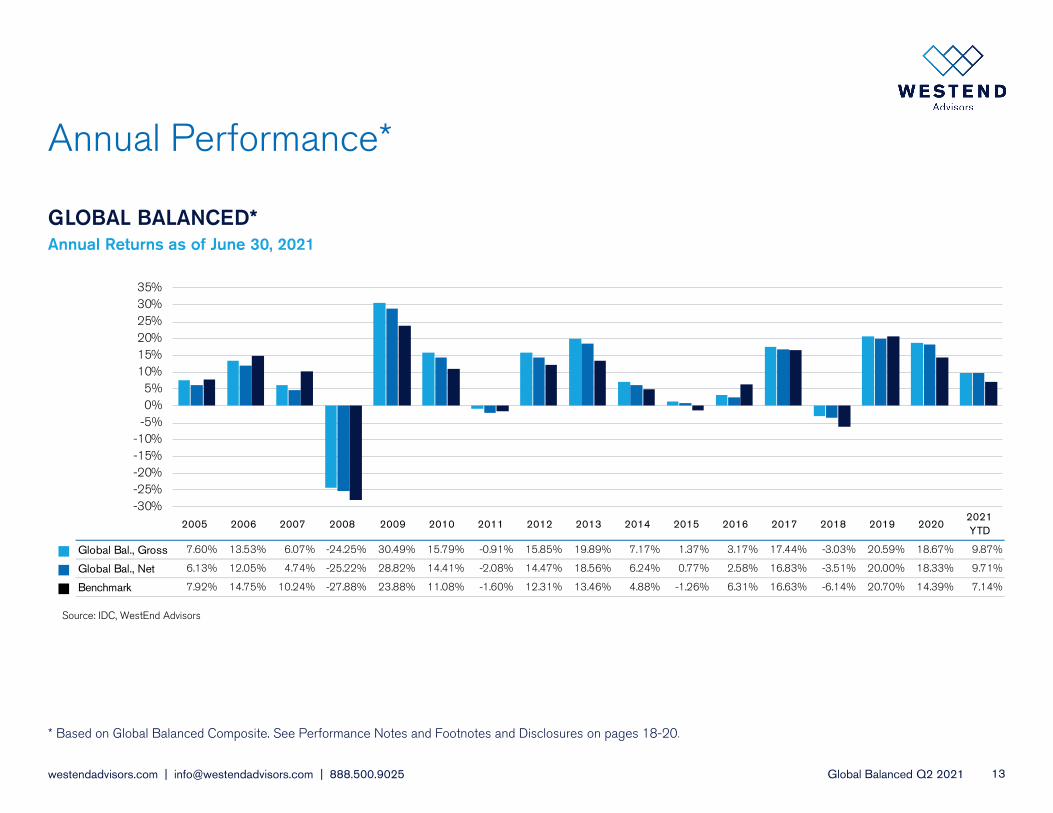
2005 2006 2007 2008 2009 2010 2011 2012 2013 2014 2015 2016 2017 2018 2019 2020
2021 YTD
Global Bal., Gross 7.60% 13.53% 6.07% -24.25% 30.49% 15.79% -0.91% 15.85% 19.89% 7.17% 1.37% 3.17% 17.44% -3.03% 20.59% 18.67% 9.87%
Global Bal., Net 6.13% 12.05% 4.74% -25.22% 28.82% 14.41% -2.08% 14.47% 18.56% 6.24% 0.77% 2.58% 16.83% -3.51% 20.00% 18.33% 9.71%
Benchmark 7.92% 14.75% 10.24% -27.88% 23.88% 11.08% -1.60% 12.31% 13.46% 4.88% -1.26% 6.31% 16.63% -6.14% 20.70% 14.39% 7.14%
-30%-25%-20%-15%-10%
-5%0%5%
10%15%20%25%30%35%
Annual Performance*
westendadvisors.com | [email protected] | 888.500.9025 13
* Based on Global Balanced Composite. See Performance Notes and Footnotes and Disclosures on pages 18-20.
GLOBAL BALANCED*Annual Returns as of June 30, 2021
Source: IDC, WestEnd Advisors
Global Balanced Q2 2021
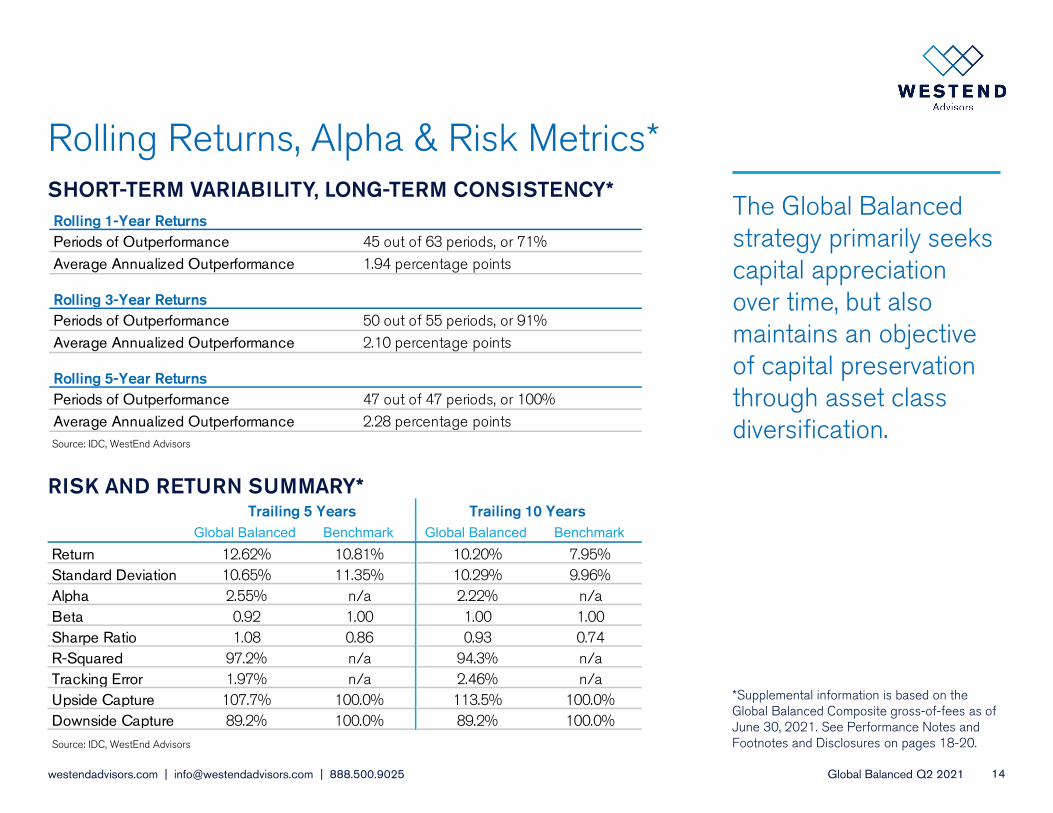
Rolling 1-Year ReturnsPeriods of Outperformance 45 out of 63 periods, or 71%
Average Annualized Outperformance 1.94 percentage points
Rolling 3-Year ReturnsPeriods of Outperformance 50 out of 55 periods, or 91%
Average Annualized Outperformance 2.10 percentage points
Rolling 5-Year ReturnsPeriods of Outperformance 47 out of 47 periods, or 100%
Average Annualized Outperformance 2.28 percentage points
Global Balanced Benchmark Global Balanced BenchmarkReturn 12.62% 10.81% 10.20% 7.95%Standard Deviation 10.65% 11.35% 10.29% 9.96%Alpha 2.55% n/a 2.22% n/aBeta 0.92 1.00 1.00 1.00Sharpe Ratio 1.08 0.86 0.93 0.74R-Squared 97.2% n/a 94.3% n/aTracking Error 1.97% n/a 2.46% n/aUpside Capture 107.7% 100.0% 113.5% 100.0%Downside Capture 89.2% 100.0% 89.2% 100.0%
Trailing 5 Years Trailing 10 Years
SHORT-TERM VARIABILITY, LONG-TERM CONSISTENCY*
Rolling Returns, Alpha & Risk Metrics*
westendadvisors.com | [email protected] | 888.500.9025 14
Source: IDC, WestEnd Advisors
*Supplemental information is based on the Global Balanced Composite gross-of-fees as of June 30, 2021. See Performance Notes and Footnotes and Disclosures on pages 18-20.
The Global Balanced strategy primarily seeks capital appreciation over time, but also maintains an objective of capital preservation through asset class diversification.
Source: IDC, WestEnd Advisors
RISK AND RETURN SUMMARY*
Global Balanced Q2 2021
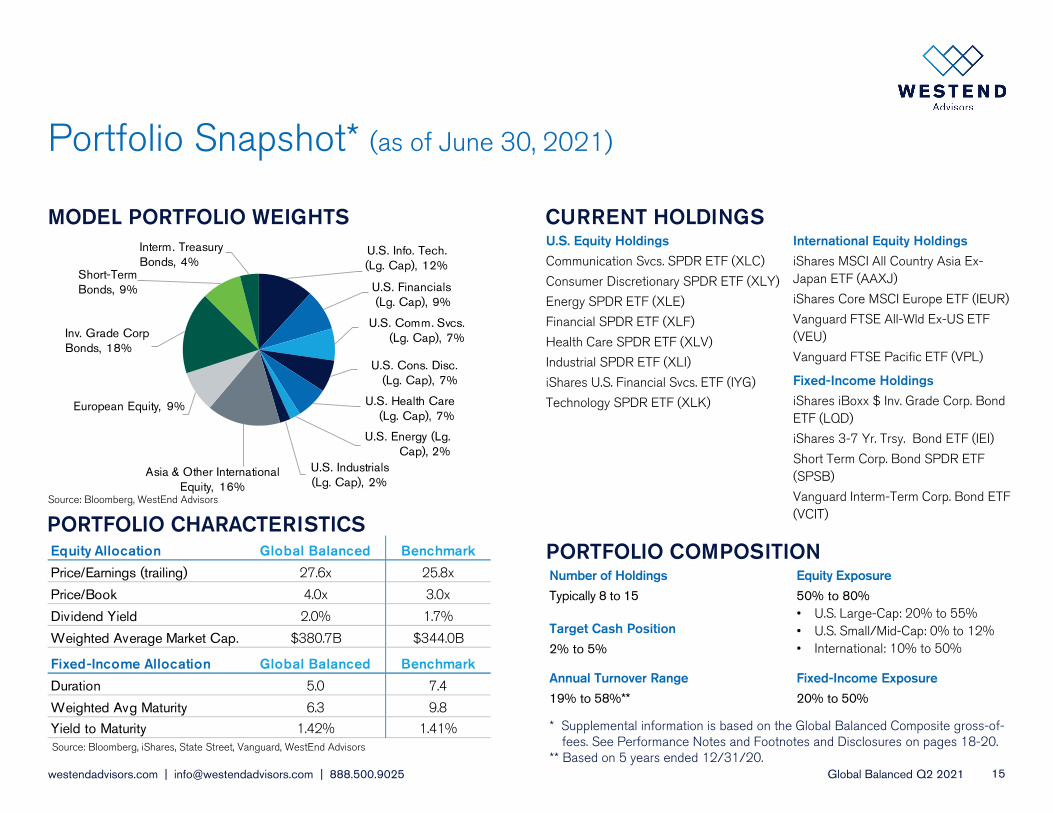
Equity Allocation Global Balanced Benchmark
Price/Earnings (trailing) 27.6x 25.8x
Price/Book 4.0x 3.0x
Dividend Yield 2.0% 1.7%
Weighted Average Market Cap. $380.7B $344.0B
Fixed-Income Allocation Global Balanced Benchmark
Duration 5.0 7.4
Weighted Avg Maturity 6.3 9.8
Yield to Maturity 1.42% 1.41%
Portfolio Snapshot* (as of June 30, 2021)
westendadvisors.com | [email protected] | 888.500.9025 15
Number of Holdings
Typically 8 to 15
Equity Exposure
50% to 80%• U.S. Large-Cap: 20% to 55%• U.S. Small/Mid-Cap: 0% to 12%• International: 10% to 50%
Target Cash Position
2% to 5%
Annual Turnover Range
19% to 58%**
Fixed-Income Exposure
20% to 50%
PORTFOLIO COMPOSITIONPORTFOLIO CHARACTERISTICS
CURRENT HOLDINGSMODEL PORTFOLIO WEIGHTSU.S. Equity Holdings
Communication Svcs. SPDR ETF (XLC)
Consumer Discretionary SPDR ETF (XLY)
Energy SPDR ETF (XLE)
Financial SPDR ETF (XLF)
Health Care SPDR ETF (XLV)
Industrial SPDR ETF (XLI)
iShares U.S. Financial Svcs. ETF (IYG)
Technology SPDR ETF (XLK)
International Equity Holdings
iShares MSCI All Country Asia Ex-Japan ETF (AAXJ)
iShares Core MSCI Europe ETF (IEUR)
Vanguard FTSE All-Wld Ex-US ETF (VEU)
Vanguard FTSE Pacific ETF (VPL)
Fixed-Income Holdings
iShares iBoxx $ Inv. Grade Corp. Bond ETF (LQD)
iShares 3-7 Yr. Trsy. Bond ETF (IEI)
Short Term Corp. Bond SPDR ETF (SPSB)
Vanguard Interm-Term Corp. Bond ETF (VCIT)
Source: Bloomberg, iShares, State Street, Vanguard, WestEnd Advisors
* Supplemental information is based on the Global Balanced Composite gross-of-fees. See Performance Notes and Footnotes and Disclosures on pages 18-20.
** Based on 5 years ended 12/31/20.
Source: Bloomberg, WestEnd Advisors
U.S. Info. Tech. (Lg. Cap), 12%
U.S. Financials (Lg. Cap), 9%
U.S. Comm. Svcs. (Lg. Cap), 7%
U.S. Cons. Disc. (Lg. Cap), 7%
U.S. Health Care (Lg. Cap), 7%
U.S. Energy (Lg. Cap), 2%
U.S. Industrials (Lg. Cap), 2%
Asia & Other International Equity, 16%
European Equity, 9%
Inv. Grade Corp Bonds, 18%
Short-Term Bonds, 9%
Interm. Treasury Bonds, 4%
Global Balanced Q2 2021
Ty Peebles is a Partner at WestEnd Advisors and a Portfolio Manager for the firm’s investment strategies. In addition to his portfolio management responsibilities, Ty conducts macro analysis on the U.S. and overseas economies as well as security research to support the management of all the firm’s investment strategies. Ty entered the financial services industry in 2010 and joined WestEnd Advisors in 2014. Prior to joining WestEnd, he worked at Global Endowment Management, an Outsourced Chief Investment Officer (OCIO) to endowments and foundations. Before that, he worked as a Certified Public Accountant (CPA) with Ernst & Young LLP. Ty holds the Chartered Financial Analyst (CFA) designation. He is a graduate of the University of North Carolina at Chapel Hill, where he received his B.A. in Economics, and he earned his Master of Accounting degree from UNC’s Kenan-Flagler Business School.
TY PEEBLES, CFA, CPAPartner, Portfolio Manager
Investment Team Biographies
Ned Durden is a Partner at WestEnd Advisors, Chief Investment Strategist (CIS), and a Portfolio Manager for the firm’s investment strategies. In addition to his portfolio management responsibilities, as CIS, Ned is responsible for distilling the Investment Team’s outlook and research to ensure clear, accurate, and effective communication of the firm’s investment views and portfolio positioning. He also conducts sector and security analysis along with macroeconomic research used to guide decisions across the firm’s investment strategies. Ned entered the financial services industry in 1997 and joined WestEnd Advisors in 2006. Before joining WestEnd, he was a founding member and Senior Analyst at Cambium Capital, a long/short equity hedge fund. Prior to that, Ned was a Director at the MONY Group, a diversified financial services firm. Ned is a graduate of the University of Virginia, where he received his B.A. degree. He also received his MBA from the University of Virginia, Darden School of Business and his law degree from the University of Virginia School of Law (JD/MBA).
westendadvisors.com | [email protected] | 888.500.9025 16
Fritz Porter is a Partner at WestEnd Advisors, Chief Investment Officer, and a Portfolio Manager for the firm’s investment strategies. In addition to his portfolio management responsibilities, Fritz leads the firm’s research meetings and conducts macroeconomic, sector and security analysis. Fritz entered the financial services industry in 1999 and joined WestEnd Advisors in 2008. Prior to joining WestEnd, he held asset management and investment banking positions at Wachovia Securities, U.S. Trust, and State Street Global Advisors. Fritz holds the Chartered Financial Analyst (CFA) designation. He is a graduate of Davidson College, where he received his B.A. degree, and he earned his MBA from Duke University’s Fuqua School of Business.
NED DURDENPartner, Chief Investment Strategist, Portfolio Manager
FRITZ PORTER, CFAPartner, Chief Investment Officer, Portfolio Manager
Global Balanced Q2 2021
Jacob Buchanan is an Investment Analyst and conducts research and analysis to support the management of the firm’s investment strategies. Jacob entered the financial services industry in 2016 and joined WestEnd Advisors in 2018. Prior to joining WestEnd, he worked at Credit Suisse supporting the CFO of the firm's securitized products division where he was responsible for internal financial analysis and forecasting. Prior to that role, he served as an analyst supporting Credit Suisse’s Global Markets trading division, conducting expense and cost savings analysis. Jacob is a graduate of the University of North Carolina at Chapel Hill, where he received his B.A. in Economics, and studied Statistics and Operations Research.
JACOB BUCHANANInvestment Analyst
Investment Team Biographies (cont.)
westendadvisors.com | [email protected] | 888.500.9025 17
Roger Regelbrugge is an Investment Analyst and conducts research and analysis to support the management of the firm’s investment strategies. Roger entered the financial services industry in 2014 and joined WestEnd Advisors in 2019. Prior to joining WestEnd, he worked as a credit risk analyst with UBS AG, where he was responsible for assessing hedge fund counterparty risk across a range of trading strategies and products. Prior to that role, he served as an equity research analyst for Avondale Partners, a boutique investment bank headquartered in Nashville, TN. Roger holds the Financial Risk Manager (FRM) and Chartered Market Technician (CMT) designations, and is a graduate of Belmont University in Nashville, TN, where he received his B.B.A. in Economics.
ROGER REGELBRUGGE, JR.Investment Analyst
Global Balanced Q2 2021
Performance Notes
westendadvisors.com | [email protected] | 888.500.9025 18
See the following pages for important Footnotes and Disclosures
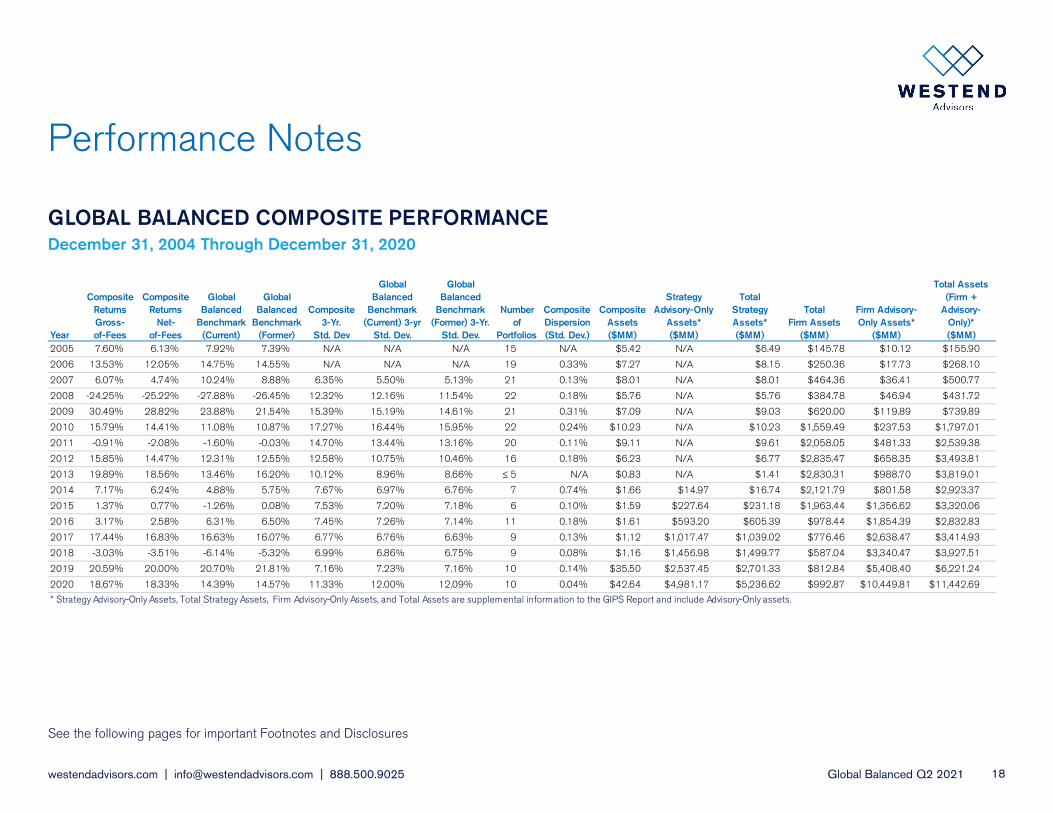
GLOBAL BALANCED COMPOSITE PERFORMANCE December 31, 2004 Through December 31, 2020
Year
CompositeReturns Gross-of-Fees
Composite Returns
Net-of-Fees
Global Balanced
Benchmark (Current)
Global Balanced
Benchmark (Former)
Composite 3-Yr.
Std. Dev
Global Balanced
Benchmark (Current) 3-yr
Std. Dev.
Global Balanced
Benchmark (Former) 3-Yr.
Std. Dev.
Number of
Portfolios
Composite Dispersion (Std. Dev.)
Composite Assets($MM)
Strategy Advisory-Only
Assets* ($MM)
Total Strategy Assets* ($MM)
TotalFirm Assets
($MM)
Firm Advisory-Only Assets*
($MM)
Total Assets (Firm +
Advisory-Only)* ($MM)
2005 7.60% 6.13% 7.92% 7.39% N/A N/A N/A 15 N/A $5.42 N/A $6.49 $145.78 $10.12 $155.90
2006 13.53% 12.05% 14.75% 14.55% N/A N/A N/A 19 0.33% $7.27 N/A $8.15 $250.36 $17.73 $268.10
2007 6.07% 4.74% 10.24% 8.88% 6.35% 5.50% 5.13% 21 0.13% $8.01 N/A $8.01 $464.36 $36.41 $500.77
2008 -24.25% -25.22% -27.88% -26.45% 12.32% 12.16% 11.54% 22 0.18% $5.76 N/A $5.76 $384.78 $46.94 $431.72
2009 30.49% 28.82% 23.88% 21.54% 15.39% 15.19% 14.61% 21 0.31% $7.09 N/A $9.03 $620.00 $119.89 $739.89
2010 15.79% 14.41% 11.08% 10.87% 17.27% 16.44% 15.95% 22 0.24% $10.23 N/A $10.23 $1,559.49 $237.53 $1,797.01
2011 -0.91% -2.08% -1.60% -0.03% 14.70% 13.44% 13.16% 20 0.11% $9.11 N/A $9.61 $2,058.05 $481.33 $2,539.38
2012 15.85% 14.47% 12.31% 12.55% 12.58% 10.75% 10.46% 16 0.18% $6.23 N/A $6.77 $2,835.47 $658.35 $3,493.81
2013 19.89% 18.56% 13.46% 16.20% 10.12% 8.96% 8.66% ≤ 5 N/A $0.83 N/A $1.41 $2,830.31 $988.70 $3,819.01
2014 7.17% 6.24% 4.88% 5.75% 7.67% 6.97% 6.76% 7 0.74% $1.66 $14.97 $16.74 $2,121.79 $801.58 $2,923.37
2015 1.37% 0.77% -1.26% 0.08% 7.53% 7.20% 7.18% 6 0.10% $1.59 $227.64 $231.18 $1,963.44 $1,356.62 $3,320.06
2016 3.17% 2.58% 6.31% 6.50% 7.45% 7.26% 7.14% 11 0.18% $1.61 $593.20 $605.39 $978.44 $1,854.39 $2,832.83
2017 17.44% 16.83% 16.63% 16.07% 6.77% 6.76% 6.63% 9 0.13% $1.12 $1,017.47 $1,039.02 $776.46 $2,638.47 $3,414.93
2018 -3.03% -3.51% -6.14% -5.32% 6.99% 6.86% 6.75% 9 0.08% $1.16 $1,456.98 $1,499.77 $587.04 $3,340.47 $3,927.51
2019 20.59% 20.00% 20.70% 21.81% 7.16% 7.23% 7.16% 10 0.14% $35.50 $2,537.45 $2,701.33 $812.84 $5,408.40 $6,221.24
2020 18.67% 18.33% 14.39% 14.57% 11.33% 12.00% 12.09% 10 0.04% $42.64 $4,981.17 $5,236.62 $992.87 $10,449.81 $11,442.69
* Strategy Advisory-Only Assets, Total Strategy Assets, Firm Advisory-Only Assets, and Total Assets are supplemental information to the GIPS Report and include Advisory-Only assets.
Global Balanced Q2 2021
Footnotes & DisclosuresWestEnd Advisors is an SEC-registered investment advisor. Registration of an investment adviser does not imply any level of skill or training. The firm is an independent investmentmanagement firm, 100% owned by its active principals. WestEnd manages equity securities for individual, institutional and wrap clients. Total firm assets include all discretionary assetsmanaged by WestEnd Advisors.
WestEnd Advisors’ Global Balanced Composite includes all discretionary accounts invested in the Global Balanced model except for portfolios managed by WestEnd Advisors in a wrap-feeprogram. The Global Balanced Composite creation and inception date is December 31, 2004. WestEnd Advisors’ Global Balanced Composite is invested in large-, mid-, and small-cap U.S.equities, international equities, U.S. fixed-income, and other assets, all through the use of exchange-traded funds, and/or high-grade money market instruments. Returns are achieved withoutthe use of options, derivatives, or leverage of any kind. Results are calculated daily using the aggregate method, use trade date valuations, and include cash as well as the reinvestment ofdividends, interest income, and other earnings, if applicable. Portfolio returns are weighted using beginning of period values plus weighted cash flows. Portfolios and composites are valueddaily and are denominated in U.S. dollars only.
The performance shown is based on WestEnd Advisors’ Global Balanced Composite which includes all fully discretionary accounts invested in the Global Balanced model except for Wrap-Fee(Wrap) and Unified Managed Account (UMA) accounts. While the accounts in the Global Balanced Composite are invested according to the same model as Wrap and UMA accounts,performance may differ between the Global Balanced Composite and Wrap and UMA accounts due to a variety of factors, including but not limited to: fees assessed by Wrap and UMAsponsors (e.g. wrap fees), Wrap and UMA sponsor- and client-imposed investment restrictions, and WestEnd Advisors’ lack of trading discretion over UMA accounts.
Net-of-fee performance results are presented after investment management fees paid to WestEnd Advisors, as well as after brokerage or other commissions actually paid by clients in themanagement of their investment advisory account, but exclude any deductions for custodial fees. The current management fee schedule, as described in WestEnd Advisors’ SEC Form ADVPart 2, is as follows: 1.00% for accounts valued at $100,000 to $4,999,999; 0.90% for accounts valued at $5,000,000 to $9,999,999; 0.75% for accounts valued at $10,000,000 to$24,999,999; 0.65% for accounts valued at $25,000,000 to $49,999,999; and 0.50% for accounts valued over $50,000,000. Fees are negotiable where circumstances warrant.
Past performance is not indicative of future results. It should not be assumed that recommendations made in the future will be profitable. The information contained herein is not intended tobe an offer to provide investment advisory services. Such an offer may only be made if accompanied by WestEnd Advisors’ SEC Form ADV Part 2.
Effective January 1, 2017, the equity portion of the Global Balanced benchmark was changed retroactive to December 31, 2004 from the MSCI World (Gross) Index to the MSCI ACWI (Net)Index. WestEnd Advisors believes that the MSCI ACWI (Net) more accurately reflects the emerging markets equity component of the Global Balanced investment strategy and betterrepresents the tax withholding on foreign dividends paid on the underlying holdings within the strategy’s ETFs. Portfolio management processes, including underlying security selection, areunchanged as the strategy has always had exposure to emerging market securities through ETFs. Further information about the change is available upon request.
The MSCI ACWI (Net) Index, Bloomberg Barclays U.S. Government/Credit Bond Index, and Global Balanced benchmark are used for comparative purposes only. The MSCI ACWI (Net) Indexis a free float-adjusted market capitalization-weighted index that is designed to measure the equity market performance of developed and emerging markets. The MSCI ACWI consists of 49country indexes comprising 23 developed and 26 emerging market country indexes. The total return of the MSCI ACWI (Net) Index is calculated using net dividends. Net total return reflectsthe reinvestment of dividends after the deduction of withholding taxes, using (for international indices) a tax rate applicable to non-resident institutional investors who do not benefit fromdouble taxation treaties.
westendadvisors.com | [email protected] | 888.500.9025 19
Global Balanced Q2 2021
Footnotes & DisclosuresThe Bloomberg Barclays U.S. Government/Credit Bond Index measures performance of U.S. dollar-denominated U.S. Treasuries, government-related, and investment-grade U.S. corporatesecurities that have a remaining maturity of greater than or equal to 1 year. In addition, the securities have $250 million or more of outstanding face value, must be fixed-rate, and non-convertible. The Global Balanced benchmark is composed of 65% of the MSCI ACWI (Net) Index and 35% of the Bloomberg Barclays U.S. Government/Credit Bond Index; is shown to reflectthe investments in equity and fixed-income securities; and is rebalanced monthly. Benchmark returns are not covered by the report of independent verifiers.
The dispersion of annual returns is measured by the standard deviation of the asset-weighted portfolio returns represented within the composite for the full year. Dispersion is calculatedbased on gross returns and is not shown when there are five or fewer portfolios, as the calculation is not statistically meaningful. The 3-year ex post standard deviation is calculated basedupon gross returns.
Strategy Advisory-Only assets include assets in Unified Managed Account (UMA) programs for which WestEnd provides Model Portfolios but has no discretion to effect trades, and nosupervisory responsibility over the assets in the program.
A complete list and description of all WestEnd Advisors’ composites, as well as a presentation that complies with the requirements of Global Investment Performance Standards (GIPS®), maybe obtained by phone (888-500-9025) or email ([email protected]). Policies for valuing investments, calculating performance, and preparing GIPS Reports is available upon request.
Any portfolio characteristics, including position sizes and sector allocations among others, are generally averages and are for illustrative purposes only and do not reflect the investments of anactual portfolio unless otherwise noted. The investment guidelines of an actual portfolio may permit or restrict investments that are materially different in size, nature, and risk from thoseshown. The investment processes, research processes, or risk processes shown herein are for informational purposes to demonstrate an overview of the process. Such processes may differ byproduct, client mandate, or market conditions. Portfolios that are concentrated in a specific sector or industry may be subject to a higher degree of market risk than a portfolio whoseinvestments are more diversified.
Holdings, Sector Weightings, and Portfolio Characteristics were current as of the date specified in this presentation. The listing of particular securities should not be considered arecommendation to purchase or sell these securities. While these securities were among WestEnd Advisors’ Global Balanced holdings at the time this material was assembled, holdings willchange over time. There can be no assurance that the securities remain in the portfolio or that other securities have not been purchased. It should not be assumed that recommendationsmade in the future will be profitable or will equal the performance of the securities presently in the portfolio. Individual clients’ portfolios may vary. Upon request, WestEnd Advisors will providea list of all recommendations for the prior year.
WestEnd Advisors claims compliance with the Global Investment Performance Standards (GIPS®) and has prepared and presented this report in compliance with the GIPS® standards.WestEnd Advisors has been independently verified for the periods December 31, 1995 through March 31, 2021.
A firm that claims compliance with the GIPS standards must establish policies and procedure for complying with all the applicable requirements of the GIPS standards. Verification providesassurance on whether the firm's policies and procedures related to composite and pooled fund maintenance, as well as the calculation, presentation, and distribution of performance, havebeen designed in compliance with the GIPS standards and have been implemented on a firm-wide basis. The Global Balanced Composite has had a performance examination from compositeinception through December 31, 2020. The verification and performance examination reports are available upon request.
GIPS® is a registered trademark of CFA Institute. CFA Institute does not endorse or promote this organization, nor does it warrant the accuracy or quality of the content contained herein.
June 2021
westendadvisors.com | [email protected] | 888.500.9025 20


![Simple, Balanced, Loaded Power Point Presentation[1]](https://img.dokumen.tips/doc/110x75/55a410951a28ab463d8b48aa/simple-balanced-loaded-power-point-presentation1.jpg)


