Embed Size (px)
Citation preview

Global Asset Management M&A Environment
Review of 2015 Activity and Trends
Securities offered through Burch & Company, Inc., 4151 N. Mulberry Drive, Suite 235, Kansas City, MO 64116 member FINRA (www.finra.org) / SIPC (www.sipc.org). Burch & Company, Inc. and MHB Advisers, LLC are not affiliated entities.

Global Asset Management M&A Environment Snapshot of Current Environment
2
Very active asset and wealth management
M&A market, particularly in the U.S., characterized by high
quality buyers and sellers and increasing
valuations
Transaction Volumes and AUM Transacted:
• Nearly 200 announced transactions globally in 2015, above long-term averages, including a record 127 announced deals in the U.S.
• More than $3 trillion of AUM transacted in 2015, well above historic norms
• Relative stability of the U.S. economy and equity markets fueling activity
Transaction Pricing and Structures:
• M&A multiples are approaching pre-crisis peaks for high quality managers with good growth prospects
• Buyers are being very selective, however, and price dispersion remains high
• Extensive use of earn-outs and other deferred payment mechanisms, as well as retention of equity by management, to align interests, mitigate risk and bridge valuation gaps
Sellers/Targets:
• Deal volume driven by independently-owned, mid-sized firms seeking liquidity
(for management or passive owners) and enhanced distribution; divestitures continue, though volumes more modest
than in recent years
• A “sellers’ market” given broad pool of high quality buyers and increasing
valuations
• Opportune market for founders to effect succession plans
Buyers:
• Deep and diverse buyer universe, including global asset managers, multi-
affiliate firms and serial wealth manager acquirers, diversified alternative
managers, foreign institutions (Canada, Japan, UK), and PE sponsors
• Buyers targeting managers of international/global strategies,
alternative strategies (including “liquid alts” and credit), and multi-asset strategies, as well as providers of
sophisticated wealth solutions

Global Asset Management M&A Environment 2015 Transaction Activity at a Glance
3
Record volume of transactions in the U.S.
Record volume of wealth management transactions
Source: MHB Advisers. Data as of December 24, 2015.
2015 2014
% Change vs
2014
Total # of Announced Transactions 0 196 177 11%
US Targets 0 127 100 27%
Non-US Targets 0 69 77 -10%
Targets with AUM >$2Bn 0 80 76 5%
Targets with AUM >$5Bn 0 57 53 8%
AUM Transacted ($Tr) $0.0 $3.1 $2.3 36%
Disclosed Deal Value ($Bn) $0.0 $40.1 $51.0 -21%
0% 24% 33% -25%
0% 68% 66% 4%
0% 13% 12% 8%
0% 25% 31% -20%
0%74 44 68%
0% 38% 25% 52%
Wealth Management Transactions
as % of Total
# of Wealth Management Transactions
Alternative Asset Manager Transactions
as % of Total
Independent Manager Transactions
as % of Total
Financial Sponsor and Management-Led Acquisitions
as % of Total
Cross-Border Transactions
as % of Total

• Record number of announced transactions in U.S. in 2015, fueled by:
Relatively strong U.S. economy and equity markets
Growing proportion of high quality independent asset and wealth managers seeking succession, liquidity, and/or distribution solutions and encouraged by strong valuations
Broad universe of experienced strategic buyers and financial investors around the world
• Global transaction volumes and amount of AUM transacted reach multi-year highs
Robust M&A activity will continue as buyers seek differentiated products and growing markets and sellers seek to realize their preferences from an increasing array of potential transaction partners
4
Global Asset Management M&A Environment Transaction Volumes
Source: MHB Advisers. Data as of December 24, 2015.
Global Transaction Activity

• Divestitures continue to play a prominent role as capital allocation and business strategies are honed
Largest IPO ever in the asset management sector as Société Générale and Crédit Agricole float Amundi
Major Japanese financial institutions are active acquirers seeking to expand their product set as their domestic markets evolve and they seek growth
• Private equity and other institutional capital providers occupy an increasing role
Established sponsors have been sellers and buyers, opportunistically leveraging experience and contacts
Permanent capital from specialist vehicles and family offices provides at-scale hedge fund and PE managers attractive liquidity options
5
Global Asset Management M&A Environment Notable Transactions in 2015
Notable Transactions in 2015
Source: MHB Advisers. Data as of December 24, 2015.
Date Target Country Parent / Seller Buyer Country AUM ($B) % Acquired
Dec-15 EnCap Investments US Dyal Capital Partners US 27.5 Minority
Dec-15 American Century Investments US Canadian Imperial Bank of Commerce Nomura Japan 149.3 Minority
Dec-15 RS Investments US Guardian Life Insurance Company Victory Capital US 18.9 100%
Dec-15 Aperio Group US Pacific Current Group Australia/US 13.2 Minority
Nov-15 Amundi Group France Société Générale and Crédit Agricole IPO 1,025.1 Minority
Oct-15 Warburg Pincus US Groupe Marc de Lacharrière France 35.0 Minority
Oct-15 Russell Investments US London Stock Exchange Group TA Associates and Reverence US 266.0 100%
Sep-15 Matthews International US Lovell Minnick Partners Mizuho Financial Group Japan 26.2 Minority
Sep-15 Marshall Wace UK KKR & Co. US 22.0 Minority
Jul-15 First Eagle Investment Management US TA Associates and management Blackstone Group and Corsair US 100.0 Majority
Jul-15 Vista Equity Partners US Dyal Capital Partners US 14.0 Minority
Jun-15 Bentall Kennedy Canada CalPERS Sun Life Financial Canada 27.0 100%
Apr-15 Pioneer Investments Italy Unicredito Santander AM / Warburg Pincus, GA Spain 243.0 100%
Apr-15 D.E. Shaw Group US Lehman Brothers Holdings Hillspire US 36.0 Minority
Mar-15 Jana Partners US Dyal Capital Partners US 11.0 Minority

Global Asset Management M&A Environment Pricing and Structure
6
• Transaction valuations for high quality businesses are approaching pre-financial crisis levels
Many company-specific factors impact valuations, including size, product range, management quality, investment performance, client diversity, operating margins and growth prospects, to name a few
As a result, price dispersion remains high
• Buyers remain selective and often cautious, seeking to structure transactions with appropriate risk controls
Earn-outs, escrows, revenue sharing structures and other deferred purchase mechanisms are common elements in transaction agreements; in many cases, a substantial proportion of total transaction consideration is delivered to sellers in such back-end payments
Buyers continue to favor leaving equity or equity-like incentives with management teams to align interests and provide comfort to clients and intermediaries that management has “skin in the game”
Deals are taking a considerable amount of time to get done as buyers conduct thorough due diligence

Global Asset Management M&A Environment Transaction Participants – Target Types
7
• Wealth manager transactions spiked to an all-time high in 2015, driven in large part by the aging of the advisor community
Banks seeking to increase fee income in a period of historically low interest rates, as well as larger RIAs and serial acquirers, continue to find opportunities in a very fragmented industry
• While the volume of alternative asset manager deals has declined during the course of the current bull market, such transactions continue to account for almost one-quarter of all M&A activity in the industry
Succession-driven minority stake transactions are now attractive to larger hedge fund and PE managers
“Liquid alternatives” continue to be on many diversified and retail-oriented managers’ wish lists
Targets by Type (by Deal Count) Targets by Type (by AUM)
Source: MHB Advisers. Data as of December 24, 2015.

Notable Institutional and Diversified Manager Transactions in 2015
Date Target Buyer AUM ($B)
Dec-15 American Century Investments Nomura 149.3
Dec-15 RS Investments Victory Capital 18.9
Dec-15 Aperio Group Pacific Current Group 13.2
Oct-15 Russell Investments TA Associates and Reverence 266.0
Jul-15 First Eagle Investment Management Blackstone Group and Corsair 100.0
Jul-15 Kapstream Capital Janus Capital Group 7.0
Jun-15 Prime Advisors Sun Life Financial 13.0
Jun-15 Perennial Fixed Interest / Growth Henderson Global Investors 8.3
Apr-15 Pioneer Investments Santander AM / Warburg Pincus 243.0
Feb-15 DNCA Finance Natixis Global Asset Management 16.5
Feb-15 Samson Capital Advisors Fiera Capital Corporation 7.2
Jan-15 Ryan Labs Asset Management Sun Life Financial 5.1 -
10
20
30
40
50
60
70
$-
$500
$1,000
$1,500
$2,000
$2,500
$3,000
2011 2012 2013 2014 2015
AUM Transacted ($B) # of Transactions
Global Asset Management M&A Environment Focus on Target Types: Institutional and Diversified Managers
8
• Activity among institutional and diversified managers maintained its brisk pace
Amundi successfully went public in a year with limited IPO activity and generally muted public valuations
Japanese buyers were evident in a number of notable situations reflecting improved financial conditions, comfort with strategic minority stakes and desire for broader product offerings and scale
A number of the largest transactions represented resales in whole or in part of previously made acquisitions by major financial institutions or of portfolio investments by PE sponsors
Notable transactions in 2015 saw continued product and geographic diversification by many participants including interesting cross-border linkages
Institutional and Diversified Manager Activity
Source: MHB Advisers. Data as of December 24, 2015.

Global Asset Management M&A Environment Focus on Target Types: Wealth Managers
9
• 2015 was a record year for transaction activity in the wealth management space
Transaction volumes in 2015 were nearly 50% higher than the previous peak year
Demographics continue to be the key driver of activity in a highly fragmented industry
Broad base of buyers including banks, large RIAs, serial acquirers and private equity firms; this last group executed many of the most prominent deals in the industry this year in a quest to identify high quality firms that can serve as growth platforms
Wealth Management Activity
Notable Wealth Manager Transactions in 2015
Date Target Buyer AUM ($B)
Nov-15 The Mutual Fund Store Financial Engines 9.8
Oct-15 IIFL Wealth Management General Atlantic 12.0
Oct-15 Edelman Financial Services Hellman & Friedman 14.4
Oct-15 Avalon Advisors The Cynosure Group 6.0
Sep-15 Federal Street Advisors Pathstone Family Office 8.0
Sep-15 WealthTrust Lee Equity Partners 7.2
Jul-15 myCIO Wealth Partners Affil iated Managers Group 7.0
Jun-15 Seven Investment Management Caledonia Investments 15.0
Jun-15 Constellation Wealth Advisors First Republic Bank 6.1
Apr-15 Wealth Enhancement Group Lightyear Capital 4.7
Mar-15 Mercer Global Advisors Genstar Capital 6.0
Jan-15 Baker Street Advisors Affil iated Managers Group 6.0 -
10
20
30
40
50
60
70
80
$-
$50
$100
$150
$200
$250
$300
$350
2011 2012 2013 2014 2015
AUM Transacted ($B) # of Transactions
Source: MHB Advisers. Data as of December 24, 2015.

Global Asset Management M&A Environment Focus on Target Types: Alternative Managers
10
• Transactions involving alternative asset managers, while declining, still account for just under 25% of all deal activity in the industry
Liquidity driven transactions involving established alternative managers have become increasingly popular occasioned by founder transitions, comfort with transactional norms, increased pricing and availability of capital from specialist funds and other institutional investors
Regulatory-related divestiture activity tapered across the board
Buyer demand across the alternative asset spectrum remains strong, though activity among managers of FOHFs and CDOs/CLOs has slowed following a period of considerable M&A/consolidation
2015 Alternative Manager Deal Count Historical Activity Levels
Source: MHB Advisers. Data as of December 24, 2015.
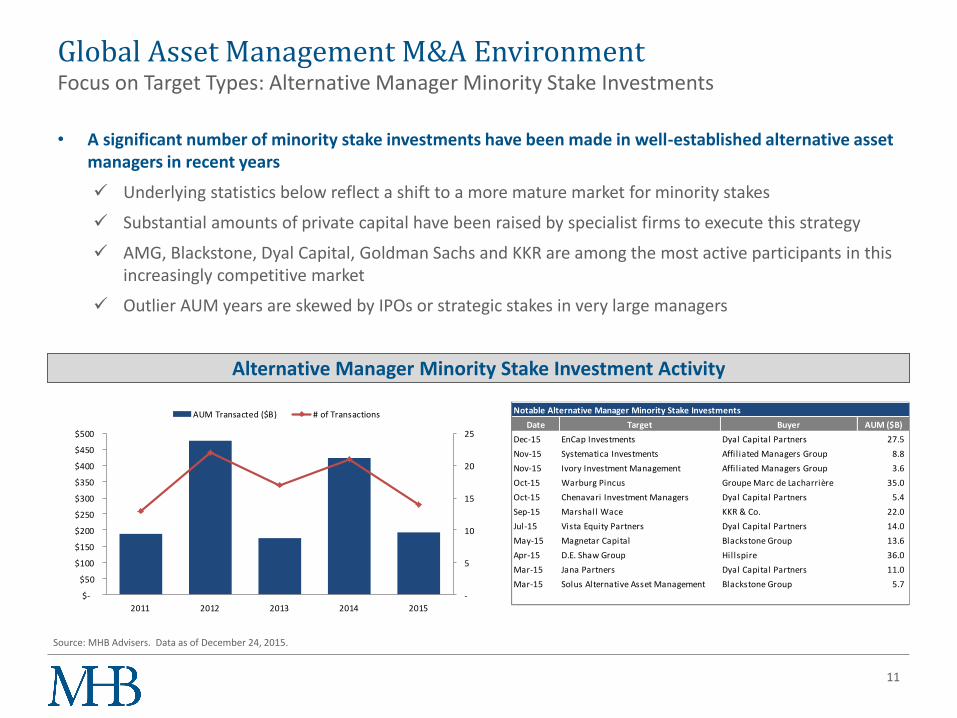
Global Asset Management M&A Environment Focus on Target Types: Alternative Manager Minority Stake Investments
11
• A significant number of minority stake investments have been made in well-established alternative asset managers in recent years
Underlying statistics below reflect a shift to a more mature market for minority stakes
Substantial amounts of private capital have been raised by specialist firms to execute this strategy
AMG, Blackstone, Dyal Capital, Goldman Sachs and KKR are among the most active participants in this increasingly competitive market
Outlier AUM years are skewed by IPOs or strategic stakes in very large managers
Alternative Manager Minority Stake Investment Activity
Source: MHB Advisers. Data as of December 24, 2015.
Notable Alternative Manager Minority Stake Investments
Date Target Buyer AUM ($B)
Dec-15 EnCap Investments Dyal Capital Partners 27.5
Nov-15 Systematica Investments Affil iated Managers Group 8.8
Nov-15 Ivory Investment Management Affil iated Managers Group 3.6
Oct-15 Warburg Pincus Groupe Marc de Lacharrière 35.0
Oct-15 Chenavari Investment Managers Dyal Capital Partners 5.4
Sep-15 Marshall Wace KKR & Co. 22.0
Jul-15 Vista Equity Partners Dyal Capital Partners 14.0
May-15 Magnetar Capital Blackstone Group 13.6
Apr-15 D.E. Shaw Group Hillspire 36.0
Mar-15 Jana Partners Dyal Capital Partners 11.0
Mar-15 Solus Alternative Asset Management Blackstone Group 5.7 -
5
10
15
20
25
$-
$50
$100
$150
$200
$250
$300
$350
$400
$450
$500
2011 2012 2013 2014 2015
AUM Transacted ($B) # of Transactions

Global Asset Management M&A Environment Transaction Participants – Buyers
12
• The buyer universe has evolved over the last several years, with money managers, particularly those with multi-affiliate models, being the most active acquirers in the sector
Managers are actively looking to diversify their businesses by acquiring new products, accessing new geographies, expanding distribution channels and upgrading investment talent
Meanwhile, banks, B-Ds and insurance companies, which had collectively accounted for more than 40% of transaction activity pre-financial crisis, have become significantly less prominent transaction participants
PE sponsor activity has continued apace, with firms actively exiting current portfolio positions and simultaneously deploying new capital
Buyers by Segment (by Deal Count) Buyers by Segment (by AUM Acquired)
Source: MHB Advisers. Data as of December 24, 2015.

Global Asset Management M&A Environment Focus on Buyers: Multi-Affiliate Asset Managers
13
• Multi-affiliate asset managers have been among the most active acquirers in recent years
The promise of significant operating and investment autonomy coupled with strategic value-adds have made multi-affiliate managers the partners of choice for many sellers
Their potential advantages as buyers include permanent capital, cultural sensitivity, long-term alignment of interests, client acceptance and execution experience
In addition, multi-affiliates have been competitive with both traditional strategic buyers and PE sponsors in terms of valuation and transaction structure
Most Active Acquirers, Last 5 Years Recent Acquisitions by Multi-Affiliate Firms
Source: MHB Advisers. Data as of December 24, 2015.
Notable Multi-Affiliate Manager Acquisition Activity
Date Target Buyer AUM ($B)
Dec-15 RS Investments Victory Capital 18.9
Nov-15 Systematica Investments Affil iated Managers Group 8.8
Nov-15 Ivory Investment Management Affil iated Managers Group 3.6
Nov-15 Abax Investments Affil iated Managers Group 5.4
Jul-15 RARE Infrastructure Legg Mason 6.8
Jul-15 Kapstream Capital Janus Capital Group 7.0
Feb-15 DNCA Finance Natixis Global Asset Management 16.5
Feb-15 Sampson Capital Advisors Fiera Capital Corporation 7.6
Dec-14 AQR Capital Management* Affil iated Managers Group 115.0
Dec-14 Index IQ New York Life IM 1.5
Dec-14 Compass Efficient Model Portfolios Victory Capital 1.0
* represents increased investment in existing affiliate
-
2
4
6
8
10
12
14
16
$-
$50
$100
$150
$200
$250
$300
AMG Fiera Principal NYLIM Natixis Legg Mason Victory
Aggregate AUM Acquired ($B) # of Transactions

Global Asset Management M&A Environment Focus on Buyers: Wealth Management Serial Acquirers
14
• As the wealth management space matures, credible serial acquirers have emerged
Several acquisition specialists have assembled national or regional platforms, each employing different approaches to autonomy, branding, growth strategies, incentive structures and back office synergies
Active acquirers include Fiduciary Network, Focus Financial, Mariner Holdings and United Capital; AMG Wealth Partners has also made several successful investments in sophisticated wealth management firms in recent years
Source: MHB Advisers. Data as of December 24, 2015.
Most Active Acquirers, Last 5 Years Recent Acquisitions by WM Serial Acquirers
Notable Wealth Manager Transactions by Serial Acquirers in 2015
Date Target Buyer AUM ($B)
Nov-15 Select Financial Group United Capital 0.3
Nov-15 PSA Insurance & Financial Services United Capital 0.2
Oct-15 PAM Focus Financial 0.5
Oct-15 Comprehensive Investment Solutions JFS Wealth (Focus Financial) 0.4
Sep-15 Federal Street Advisors* Pathstone FO (Fiduciary Network) 8.0
Aug-15 McDonald, Cox & Klugh United Capital 0.4
Jul-15 myCIO Wealth Partners Affil iated Managers Group 7.0
Jul-15 Relative Value Partners Focus Financial 1.0
Apr-15 Fiduciary Group Focus Financial 0.6
Feb-15 Capital Investment Counsel team United Capital 2.0
Jan-15 Vantage Investment Advisors Mariner Holdings 1.0
* merger of equals, AUM is for combined company
* does not capture all corporate development activity
-
5
10
15
20
25
30
$-
$5
$10
$15
$20
$25
$30
Focus Financial United Capital Mariner Holdings AMG FiduciaryNetwork
Aggregate AUM Acquired ($B) # of Transactions

Notable Financial Institution Acquisitions in 2015
Date Target Buyer AUM ($B)
Dec-15 The Killen Group TriState Capital Holdings 2.5
Oct-15 MSA Holdings MB Financial Bank 3.0
Oct-15 Reliance Capital Asset Management Nippon Life Insurance 36.9
Sep-15 Dai–ichi Life Insurance AM Operations Mizuho Financial Group 450.9
Sep-15 Matthews International Mizuho Financial Group 26.2
Aug-15 DB’s India AM business Prudential Financial 3.2
Aug-15 Cairn Capital Group Mediobanca 5.6
Jul-15 First Principles Capital Management American International Group 10.0
Jun-15 Prime Advisors Sun Life Financial 13.0
Jun-15 Bentall Kennedy Sun Life Financial 27.0
Jun-15 Constellation Wealth Advisors First Republic Bank 6.1
Mar-15 Cougar Global Investments Raymond James Financial 1.0
0
10
20
30
40
50
60
-
100
200
300
400
500
600
700
2011 2012 2013 2014 2015
AUM Acquired ($B) # of Financial Institution Acquisitions
Global Asset Management M&A Environment Focus on Buyers: Banks, Insurance Companies and Broker-Dealers
15
• Asset and wealth management acquisition activity by banks, insurance companies and broker-dealers has diminished considerably since the financial crisis, with a select few (mostly foreign) institutions actively pursuing acquisition strategies
These three categories of financial institutions were net sellers post-financial crisis
Transactions have transferred ownership from weak hands to strong
Volume has diminished, but notable scale transactions are still occurring
Strategies have been focused on extending global reach and adding global product, as well as bolstering asset and wealth management operations to increase non-interest income
Source: MHB Advisers. Data as of December 24, 2015.
Financial Institution Acquisition Activity

Notable PE Sponsor Purchases/Investments in 2015
Date Target Buyer AUM ($B)
Dec-15 Redwood Investments Estancia Capital Management 1.0
Oct-15 IIFL Wealth Management General Atlantic 12.0
Oct-15 Edelman Financial Hellman & Friedman 14.4
Oct-15 Russell Investments TA Associates / Reverence 266.0
Oct-15 Avalon Advisors The Cynosure Group 6.0
Sep-15 WealthTrust Lee Equity Partners 7.2
Sep-15 West Gate Horizons Advisors Rothschild Group 1.5
Aug-15 Keeley Asset Management TA Associates 4.0
Jul-15 First Eagle IM Blackstone / Corsair 100.0
Apr-15 Wealth Enhancement Group Lightyear Capital 4.7
Mar-15 Mercer Global Advisors Genstar Capital 6.0 -
5
10
15
20
25
30
35
40
45
50
$-
$100
$200
$300
$400
$500
$600
$700
2011 2012 2013 2014 2015
AUM Transacted ($B) # of Transactions
Global Asset Management M&A Environment Focus on Buyers: Private Equity Investors
16
• Private equity firms have demonstrated sustained interest in the asset and wealth management sectors, accounting for 20-25% of transaction activity each year
PE sponsors have substantial pools of uninvested capital to deploy and are being competitive with strategic buyers for attractive properties
Several financial investors are developing “permanent capital” alternatives that avoid the need for potentially disruptive exit transactions
• Many private equity sponsors also find the current conditions optimal for liquidating prior investments, especially those made prior to the financial crisis
Source: MHB Advisers. Data as of December 24, 2015.
Private Equity Investment Activity

Global Asset Management M&A Environment Cross-Border Transaction Activity
17
• The steady volume of cross-border deals reflects continued globalization of the industry in terms of both investment capabilities and distribution
Increasing appetite of buyers to expand outside of their home markets
In recent years activity has generally trended up as asset managers globalize seeking growth and scale
Activity levels tend to be skewed by the prevalence of divestiture activity, in particular by European financial institutions
2015 activity softened slightly, likely impacted by market volatility and significant currency movements
Cross-Border Transaction Activity
Source: MHB Advisers. Data as of December 24, 2015.

Cross Border 2011 - 2015: Domicile of Buyers Cross Border 2011 - 2015: Domicile of Targets
Rank Country AUM ($bn) % of Total Rank Country # of Deals % of Total Rank Country AUM ($bn) % of Total Rank Country # of Deals % of Total
1 U.S. 1,111$ 29% 1 U.S. 93 34% 1 U.S. 1,396$ 37% 1 U.S. 69 25%
2 Japan 820$ 22% 2 U.K. 53 19% 2 U.K. 516$ 14% 2 U.K. 60 22%
3 U.K. 466$ 12% 3 Switzerland 21 8% 3 Netherlands 405$ 11% 3 Australia 19 7%
4 Canada 389$ 10% 4 Canada 20 7% 4 Italy 249$ 7% 4 India 12 4%
5 Spain 243$ 6% 5 Japan 18 6% 5 Spain 198$ 5% 5 France 9 3%
6 Switzerland 231$ 6% 6 France 15 5% 6 Australia 179$ 5% 6 Switzerland 9 3%
7 Australia 103$ 3% 7 Australia 13 5% 7 France 124$ 3% 7 China 8 3%
8 France 84$ 2% 8 Italy 10 4% 8 India 123$ 3% 8 Germany 8 3%
9 Singapore 52$ 1% 9 Singapore 4 1% 9 China 115$ 3% 9 Hong Kong 8 3%
10 S. Africa 22$ 1% 10 S. Africa 2 1% 10 Germany 95$ 2% 10 Singapore 8 3%
Top Ten 3,522$ 92% Top Ten 249 90% Top Ten 3,399$ 89% Top Ten 210 76%
Total 3,811$ Total 277 Total 3,811$ Total 277
Global Asset Management M&A Environment Cross-Border Transaction Activity (continued)
18
• Established U.S. and U.K. firms continue to dominate cross-border deal activity as both buyers and targets
Markets with compelling long-term growth prospects have also been favored as targets including Australia, propelled by compulsory superannuation; Emerging Markets, such as China and India; and, gateway Asian markets such as Hong Kong and Singapore
• Experience counts: acquirers with demonstrable business rationales and deal credentials have won out
Among the most prominent have been serial M&A fixtures such as Aberdeen, AMG, Blackrock, Henderson, Man and Principal
Cross-Border Transaction Activity, Last 5 Years
Source: MHB Advisers. Data as of December 24, 2015.

Global Asset Management M&A Environment U.S. Publicly-Traded Asset Managers – Traditional Managers
19
• U.S.-listed asset managers as a group traded in long-term “normal” ranges during much of 2015: 3.0-3.5x revenue, 9-10x EBITDA and mid-teens forward P/E
The group, on average, sold off by ~15% over the last 4 ½ months of the year pushing multiples to the low end of this range
Modest organic growth weighed down many firms, but also stimulated significant M&A activity $ mill ions, except AUM in $ bill ions
Market Enterprise Price as a Multiple of: Enterprise Value as a Multiple of:
Traditional Asset Managers Ticker Value (1) Value (2) AUM LTM EPS FY1 EPS (3) FY2 EPS (3) AUM LTM Rev LTM EBITDA
Affil iated Managers Group, Inc. AMG $8,814 $10,767 $619 17.1x 13.0x 11.6x 1.7% 4.2x 11.2x
Artisan Partners Asset Management, Inc. APAM 2,677 2,659 103 19.3x 13.5x 13.6x 2.6% 3.2x 8.9x
BlackRock, Inc. BLK 55,330 54,706 4,506 17.3x 17.1x 16.1x 1.2% 4.8x 11.2x
Cohen & Steers, Inc. CNS 1,413 1,289 53 19.2x 18.2x 16.3x 2.4% 3.9x 9.6x
Eaton Vance Corp. EV 3,858 3,619 311 17.2x 14.1x 12.4x 1.2% 2.5x 7.7x
Federated Investors, Inc. FII 3,016 3,106 351 18.8x 18.1x 14.6x 0.9% 3.4x 10.8x
Franklin Resources, Inc. BEN 22,237 15,400 801 11.2x 12.2x 11.6x 1.9% 2.0x 5.0x
Invesco Ltd. IVZ 13,954 14,052 756 13.7x 13.3x 12.1x 1.9% 2.7x 9.4x
Janus Capital Group Inc. JNS 2,629 2,742 182 17.8x 15.6x 13.6x 1.5% 2.6x 7.8x
Legg Mason, Inc. LM 4,274 4,883 672 14.1x 13.9x 12.0x 0.7% 1.7x 8.7x
OM Asset Management plc OMAM 1,844 1,787 209 12.1x 12.2x 11.6x 0.9% 2.6x 7.9x
T. Rowe Price Group, Inc. TROW 18,192 17,027 726 15.6x 16.1x 15.2x 2.3% 4.1x 8.3x
Virtus Investment Partners, Inc. VRTS 1,052 975 52 23.3x 15.5x 14.9x 1.9% 2.4x 9.1x
Waddell & Reed Financial, Inc. WDR 2,446 2,023 106 9.4x 10.0x 10.2x 1.9% 1.3x 4.4x
WisdomTree Investments, Inc. WETF 2,237 2,028 59 32.3x 27.4x 22.8x 3.4% 7.5x 17.0x
Median 17.2x 14.1x 13.6x 1.9% 2.7x 8.9x
Mean 17.2x 15.4x 13.9x 1.8% 3.3x 9.1x
(1) Fully-diluted market capitalization as of December 24, 2015(2) Enterprise Value equal to Market Value, less cash & equivalents, plus debt, plus redeemable non-controlling interests(3) Earnings estimates per Yahoo Finance
Sources: Company filings, Bloomberg, Yahoo Finance

Global Asset Management M&A Environment U.S. Publicly-Traded Asset Managers – Alternative Managers
20
• U.S.-listed alternative asset managers as a group traded at a slight discount to traditional managers during 2015
Discounted multiples on performance fee income were partially offset by higher valuations ascribed to firms with long-term locked-up capital
Expectations of a more challenging investment environment in the year ahead (higher interest rates, tighter credit markets, thin IPO markets, increased equity market volatility) pressured stock prices, pushing the group’s shares down ~25% since mid-August
$ mill ions, except AUM in $ bill ions
Enterprise Value as a Multiple of:
Market Enterprise Price as a Multiple of: LTM LTM
Alternative Asset Managers Ticker Value (1) Value (2) AUM FY1 EPS (3) FY2 EPS (3) AUM Revenue EBITDA/DE (4)
Apollo Global Management LLC APO $6,197 $6,392 $162 11.9x 8.0x 3.9% 5.4x 7.4x
Ares Management LP ARES 2,760 3,408 92 12.6x 7.4x 3.7% 3.2x 13.9x
Blackstone Group LP BX 36,528 41,489 334 13.4x 9.1x 12.4% 7.2x 9.3x
Carlyle Group LP CG 5,208 5,054 188 10.9x 6.8x 2.7% 2.2x 4.3x
Fortress Investment Group LLC FIG 2,312 2,050 74 7.7x 5.8x 2.8% 1.8x 5.3x
KKR & Co LP KKR 13,650 17,583 99 9.3x 6.4x 17.8% 6.3x 9.2x
Oaktree Capital Group LLC OAK 7,506 7,278 100 26.2x 14.4x 7.3% 6.6x 14.3x
Och-Ziff Capital Management Group LLC OZM 3,229 3,367 45 11.3x 5.6x 7.5% 2.7x 4.8x
Median 11.6x 7.1x 5.6% 4.3x 8.3x
Mean 12.9x 7.9x 7.3% 4.4x 8.6x
(1) Fully-diluted market capitalization as of December 24, 2015(2) Enterprise Value equal to Market Value, less cash & equivalents, plus debt, plus redeemable non-controlling interests(3) Earnings estimates per Yahoo Finance(4) Distributable Earnings is used for some firms as a proxy for EBITDA
Sources: Company filings, Bloomberg, Yahoo Finance

Global Asset Management M&A Environment U.K. Publicly-Traded Asset Managers
21
• U.K.-listed asset managers are currently trading at a slight discount to their U.S. counterparts on an earnings and EBITDA basis
The comps are somewhat skewed, however, based on the importance of performance fees to Man and Emerging Markets concerns that have affected Aberdeen and Ashmore
£ mill ions, except AUM in £ bill ions
Market Enterprise Price as a Multiple of: Enterprise Value as a Multiple of:
Traditional Asset Managers Ticker Value (1) Value (2) AUM LTM EPS FY1 EPS (3) FY2 EPS (3) AUM LTM Rev LTM EBITDA
Aberdeen Asset Management PLC ADN £3,712 £3,144 £284 12.7x 11.3x 10.4x 1.1% 2.7x 5.0x
Ashmore Group PLC ASHM 1,802 1,421 34 13.2x 16.2x 14.7x 4.2% 5.3x 7.6x
Henderson Group PLC HGG 3,457 3,337 82 21.5x 15.5x 16.4x 4.1% 6.0x 16.1x
Man Group PLC EMG 2,943 2,657 77 7.5x 8.7x 9.1x 3.5% 2.1x 4.1x
Schroders PLC SDR 6,467 6,322 295 18.2x 17.1x 15.9x 2.1% 4.6x 11.7x
Median 13.2x 15.5x 14.7x 3.5% 4.6x 7.6x
Mean 14.6x 13.8x 13.3x 3.0% 4.1x 8.9x
(1) Fully-diluted market capitalization as of December 24, 2015(2) Enterprise Value equal to Market Value, less cash & equivalents, plus debt, plus redeemable non-controlling interests(3) Earnings estimates per Yahoo Finance
Sources: Company filings, Bloomberg, Yahoo Finance

Global Asset Management M&A Environment Australian Publicly-Traded Asset Managers
22
• Australian asset managers continue their historical trend of trading at premium valuations compared to their global peers
Across commonly used pricing metrics (revenue, EBITDA and forward P/E) multiples are 50-100% higher than in the U.S. or U.K.
We believe this reflects high growth expectations, favorable industry dynamics and a limited number of publicly traded companies in the sector
A$ millions, except AUM in A$ billions
Market Enterprise Latest Price as a Multiple of: Enterprise Value as a Multiple of:
Traditional Asset Managers Ticker Value (1) Value (2) AUM LTM EPS FY1 EPS (3) FY2 EPS (3) AUM LTM Rev LTM EBITDA
BT Investment Management BTT $3,288 $3,153 $78 26.1x 21.9x 20.2x 4.0% 7.2x 18.3x
Magellan Financial MFG 4,245 4,151 40 25.9x 24.5x 21.5x 10.4% 14.6x 18.0x
IOOF Holdings IFL 2,737 2,794 124 19.3x 15.0x 14.1x 2.3% 3.0x 11.7x
Perpetual Ltd PPT 2,096 1,893 28 17.1x 16.8x 15.5x 6.7% 3.7x 9.8x
Platinum Asset Mgmt PTM 4,564 4,437 27 21.2x 19.5x 18.1x 16.3% 12.3x 14.7x
Median 21.2x 19.5x 18.1x 6.7% 7.2x 14.7x
Mean 21.9x 19.5x 17.9x 7.9% 8.2x 14.5x
(1) Fully-diluted market capitalization as of December 24, 2015(2) Enterprise Value equal to Market Value, less cash & equivalents, plus debt, plus minority interest(3) Earnings estimates per Yahoo Finance
Sources: Company filings, Bloomberg, Yahoo Finance

Introduction to MHB
23

Introduction to MHB Our Firm
• MHB Advisers is an independent investment banking advisory firm based in the San Francisco Bay Area that is focused exclusively on the global investment management industry
Our principals have over 70 years of diverse financial services experience, and a combined 40 years of experience in advising on strategic transactions
Includes asset management operating experience, as well as being long-time investment bankers in the sector
Exclusive focus on advising asset and wealth managers and their owners on M&A and other corporate initiatives
We have served as trusted advisors to a wide range of traditional and alternative investment firms based in the US, Canada, Australia, Hong Kong, India, Singapore and several European countries
Committed to providing independent, unbiased, conflict-free advice
We design flexible, tailored engagements with our clients to help them achieve their strategic and financial objectives
Experience
Focus
Independence
24

Introduction to MHB
• Our principals have served our clients as trusted advisors in transactions involving firms spanning the spectrum of the asset management industry
Traditional managers: equity, fixed income and listed real estate securities;
Alternative managers: hedge funds, funds of hedge funds, private equity fund of funds, real estate, and structured products (CLOs, CDOs);
Managers with institutional, retail and high net worth client bases; and
Smaller and mid-sized independent specialists, as well as multi-affiliate investment firms and diversified global institutions
• We have skillfully guided our clients through each step of a wide range of successful transaction engagements
Majority and minority sales to both financial and strategic partners;
Acquisitions;
Management buyouts, advising both management teams and corporate parents;
Debt and equity recapitalizations and other ownership restructurings; and
Strategic advisory assignments, valuations and fairness opinions
Our Experience
25

Introduction to MHB Our Clients
• Our principals have been privileged to represent some of the most dynamic independent investment managers…
• …as well as some of the largest and most well-respected financial services firms in the world
26

Introduction to MHB Our Principals
27
Roger Hartley
Roger is a co-founder and Managing Member of MHB Advisers. Prior to founding MHB, he served as Chief Operating Officer of Coast Asset Management, a long-established alternative investment manager in Santa Monica, California. Prior to joining Coast in late 2007, Roger was a Managing Director with Putnam Lovell in San Francisco. Before launching his career as a strategic adviser to asset managers in 1997, he spent over fifteen years in the international banking industry with Union Bank and Standard Chartered Bank through roles in California, Hong Kong, the United Arab Emirates and the United Kingdom. Roger received a M.A. with Honours in Politics, Philosophy and Economics from the University of Oxford.
Jeff Bechtel
Jeff is a Managing Member of MHB Advisers. Prior to joining MHB, Jeff served as Senior Vice President in the Financial Institutions Group at Jefferies & Company. Prior to joining Jefferies, he was a senior asset management banker at Putnam Lovell which he joined in 2002. Jeff began his career in 1996 in the capital markets group of Bank One where he served in the M&A and Corporate Finance Advisory practices. He received his MBA from Northwestern University’s Kellogg School of Management and BBA in Finance and Marketing, with Honors, from the University of Wisconsin-Madison.
Robert Kennedy
Robert is a Managing Member of MHB Advisers. Prior to joining MHB, he served as an independent consultant in the Western United States and internationally. Robert’s experience also includes over a decade of M&A advisory work as a banker at Putnam Lovell. In this role, he worked on transactions involving asset managers, depository institutions and related service providers. He received his BS in Finance, with Honors, from the University of Colorado at Boulder. Prior to moving to the U.S., Robert served as a Commissioned Officer in the Royal Australian Regiment.

Introduction to MHB Contact Details
28
Roger Hartley
+1 (415) 464-4940
Jeff Bechtel
+1 (415) 464-4941
Robert Kennedy
+1 (415) 464-4943
www.mhb-advisers.com
MHB Advisers, LLC
1100 Larkspur Landing Circle, Suite 101
Larkspur, CA 94939


![,16758&7,216 21 +2: 72 &203/(7( 7+( &29(5 6+((7 · Judicial Review Asset forfeiture (05) [ ] 41 Asset forfeiture ... Claims involving mass tort (40) [ ] 78 Claims involving mass tort](https://img.dokumen.tips/doc/110x75/5f382857f7d991114d6bb10f/167587216-21-2-72-2037-7-295-67-judicial-review-asset.jpg)