Embed Size (px)
Citation preview

GLOBAL TRENDS ININDUSTRIAL PARKSGlobal Trends in Industrial Parks

King Sturge: Global Trends in Industrial Parks
List of Contents
PAGE
Executive Summary 1
Introduction 2
Part One - Overview 3
- The global economy 3
- Logistics and supply-chain management 3
- Global transport 5
- Industrial property markets 7
- Outlook 10
Part Two – Case Studies 13
EUROPEBelgium Delta Park, Weihoek 3, 1930
Zavenem, Brussels 13CzechRepublic D1 Logistics Park, Prague 15France Clesud Platform, Grans Miramar,
Bouches du Rhone, Marseille 17Parisud Senart, Seine et Marne, Paris, Ile de France 18
Germany ProLogis Park, Cologne 20Ireland Rosemount Business Park, Dublin 21Poland Diamond Business Park, Lodz 23
Ozarow Business Center, Warsaw 24Spain Coslada Logistics Park, Corredor
del Henares, Madrid 25UK Bicester Distribution Park, Oxfordshire 27
Western Approach Distribution Park, Bristol 29Premier Park, Park Royal, West London 31Trafford Park, Manchester 32Newhouse Farm Estate, Chepstow,Wales 34EuroCentral, Mossend,Lanarkshire, Glasgow 36
NORTH AMERICA 38Parma Commerce Center, Cleveland, Ohio 38Dominguez Technology Park, Los Angeles 40Centerpoint At 8A, South Brunswick & Monroe Township, New Jersey 42
ASIA-PACIFIC 44Australia 108-120 Silverwater Road,
Silverwater, Sydney 44China Baoshan Urban Industrial Park,
Baoshan, Shanghai 46HongKong Airport Freight Forwarding Centre,
Chek Lap Kok Airport 48Indonesia MM2100 Industrial Town, Bekasi,
Jakarta, West Java 50Malaysia Hicom Glemarie Industrial Park,
State of Selangor, Kuala Lumpur 52Singapore Singapore Science Park 53

King Sturge: Global Trends in Industrial Parks
1
Executive Summary
• The onward march of globalisation will not bereversed despite the tragic events of 11 September2001 which have increased the costs, time and risksassociated with cross-border trade.
• World merchandise exports increased by some7% per annum between 1990 and 2000 comparedwith world GDP growth of 2% per annum.
• World foreign direct investment quadrupledbetween 1993 and 1999 to reach around US$ 800bn.
• All the major economic regions of the world arebecoming more service-orientated, as illustratedby the changing pattern of employment. Since 1980service employment in the USA has increased from66% to over 73% of total employment. In CentralEurope it has risen from 37% to 54%.
• Developments in logistics and supply-chainmanagement are having a major impact onindustrial property markets. The centralisation ofproduction and inventory has generated increasingrequirements for very large facilities, and the use ofjust-in-time logistics often generates requirementsfor warehouses to be co-located on manufacturingsites, or situated adjacent to them.
• Logistics accounts for 20% of total product costs.To reduce costs, third party logistics serviceproviders will become a more important sourceof industrial property demand as outsourcingexpands.
• The globalisation of production and marketing hasraised the significance of freight transport andfuelled the development of major transport hubsthat are important commercial and industrialcentres.
• In the USA and much of western Europe, majorindustrial parks are dominated by warehousingand distribution users. By contrast, in parts of Asia- Pacific, manufacturing has a larger representationon industrial parks.
• Traditionally, companies with specialist propertyrequirements, or a desire to maintain maximumproduction flexibility, have developed their ownfacilities and owner-occupied them. Wherecompanies lease property, especially for warehouseand distribution purposes, they are increasinglylooking for more flexible tenure structures andterms to maximise the flexibility of their propertyassets, yet minimise the risk of any liabilities shouldthey need to restructure their property holdings.
• The cost of occupying leasehold property variessignificantly around the world. London is the mostexpensive industrial property location globally, withtotal occupation costs around seven times those ofoccupying equivalent property in Shanghai.
• The impact of the Asia crisis in the late 1990s,currency devaluation and slow economic growth hasresulted in rents falling. In US Dollar, inflationadjusted terms, industrial rents are more thanforty percent lower than in 1995, in all Asia –Pacific markets.
• Lower property costs in Asia-Pacific continue tore-enforce the role of this region as the principalcost-efficient manufacturing zone of the globaleconomy.
• The growth of the service economies of Europe andNorth America, in an era of low inflation, willencourage the greater consolidation ofdistribution companies, facilities and locations.
• Occupiers, developers and investors in industrialproperty need to become more aware ofenvironmental issues as sustainable developmentmoves up the political agenda.
• The short-term economic outlook suggests slowereconomic growth in the major developedeconomies, but medium-term forecasts point tomore benign economic conditions. Understandingthe shifting patterns of economic activities anddevelopments in logistics and supply-chainmanagement, is the key to identifying growthopportunities in industrial property markets world-wide.

King Sturge: Global Trends in Industrial Parks
Introduction
This is the first report to look at industrial parks at aglobal level. Using its global office network, KingSturge has compiled 24 case studies of industrial parksfrom around the world; three studies from the USA,fifteen from Europe and six from Asia-Pacific.
Over recent years, much has been written about“globalisation”. From an economic perspective,globalisation is a process whereby business decisions toproduce and market goods and services are taken on aglobal, rather than purely national basis. As a result,cross-border flows of goods and services, and relatedflows of capital and information, have increaseddramatically. The globalisation of industrial propertymarkets is part of this wider process.
Although the tragic events of 11 September 2001 seemlikely to increase the costs, time and risks associatedwith cross border transactions, the onward march ofglobalisation (especially of tangible goods) is notlikely to be reversed. World trade is projected to growfaster than world GDP and companies will increasinglymanage their supply chains on a global scale. Even theglobalisation of terrorism will not stop the globalisationof business.
This report takes a global look at industrial parks. It isdivided into two parts:
Part One provides an overview of macro trendsrelevant to industrial property markets worldwide. Thispart begins by examining global economic trends anddevelopments in logistics and supply-chainmanagement. It then considers trends in internationaltransport, before examining some of the key issues forindustrial property markets. It concludes with anassessment of the outlook for industrial propertymarkets.
Part Two provides a series of case studies fromaround the world. These studies highlight both thesimilarities and differences in industrial parks in thethree main global economic regions; Europe, NorthAmerica and the Asia-Pacific. For example, while thereare similarities in the specification of industrialbuildings, there are differences in the profile ofcompanies occupying industrial parks in different partsof the world.
The report is designed to be of interest to occupiers,developers and investors in the industrial propertymarket. Inevitably, it provides only an overview ofsome key themes and issues. Readers requiring morespecific information on the locations reviewed should,in the first instance, contact King Sturge or visit ourwebsite at www.kingsturge.com.
January 2002

King Sturge: Global Trends in Industrial Parks
2 3
Part One – Overview
The global economy
Globalisation Globalisation is a process whereby business decisionsto produce and market goods and services areincreasingly taken on a global rather than nationalbasis. As a result, cross-border flows of goods andservices, and related flows of capital and information,have increased dramatically. Although the tragic eventsof 11 September seem likely to increase the costs, timeand risks associated with cross-border transactions, theonward march of globalisation is not likely to bereversed.
World tradeBetween 1990 and 2000, the volume of worldmerchandise exports increased by an annual rate of 7%compared with a corresponding world GDP growth of2%. In value terms, the strongest growth in exports wasrecorded by China, which saw annual growth of around
15%. As a result, its share of world merchandiseexports doubled from 1.8% in 1990 to 3.6% in 1999,see Table 1.
Global foreign direct investmentForeign direct investment (FDI) is another indication ofglobalisation. According to the OECD, in 1980 thestock of FDI abroad accounted for 5% of world GDP,but by 1999 this contribution had almost tripled to 14%.In the six years, 1993 to 1999, world FDI flowsquadrupled from about US $200bn. to around $800bn.
The vast majority of FDI outflows originated from theOECD economies. In 1999 OECD countries accountedfor 92% of FDI outflows and 77% of inflows. In 1998,the top five recipients of OECD FDI outflows wereBrazil, Argentina, Malaysia, China and Singapore.Although China was placed fourth in terms of OECDoutflows, it is the largest recipient of worldwide FDIflows outside the OECD, due to large investments fromnon-OECD economies, such as Singapore.
Changing global employmentEvery major global economic region has seen a sharpincrease in employment in services over the past twodecades. In the US and EU economies, some 73% and66% respectively of all jobs are in service industries,see Table 2 .
Logistics and supply-chainmanagement
A key source of competitive advantageLogistics refers to how companies manage the flow ofmaterials, parts and finished goods, through theirorganisations and marketing channels to provide theright product at the right time at the right place and atthe right price. Supply-chain management is a widerconcept that embraces the management of these flowsalong the whole length of the supply chain, ie: from the“upstream” source to end consumer, “downstream”.
TABLE 1: WORLD MERCHANDISE EXPORTS
BY REGION
Region Share Share Value1990 (%) 1999 (%) 1999
(US$ bn)
EUROPE 51.4 46.9 2,567
Western Europe 48.3 43.0 2,353
Eastern Europe & CIS 3.1 3.9 214
NORTH AMERICA 15.4 17.1 934
United States 11.6 12.7 695
Canada 3.8 4.4 239
ASIA 21.8 25.5 1,394
Japan 8.5 7.7 419
China 1.8 3.6 195
Six East Asia traders 7.9 10.0 546
Other Asia 3.6 4.2 234
REST OF WORLD 11.4 10.5 579
Africa 3.1 2.0 112
Latin America 4.3 5.4 297
Middle East 4.0 3.1 170
Source: World Trade Organisation

King Sturge: Global Trends in Industrial Parks
Companies are increasingly seeking to squeeze costsout of their logistical operations and the whole supplychain, while at the same time improving service. Thistrend has been accelerated by the increase of B2B(business to business) Internet usage. As a result,logistics and supply chain management are increasinglyrecognised as a source of competitive advantage. Manyof the ways in which companies are restructuring theirlogistical and supply-chain operations have importantimplications for industrial property markets.
The concentration of production and warehousingfacilitiesCompanies are increasingly concentrating theirproduction facilities into a smaller number of largefactories. In some cases, global companies manufacturefrom only two or three production plants in the world,while many other companies continue to close downfactories in order to consolidate their production. Inmany cases, these production plants are located inrelatively low-cost locations in Asia-Pacific, LatinAmerica, or Eastern Europe.
Companies have also centralised their inventory intofewer locations. Around Europe, for example, manycompanies have shut down nationally-based regionaldistribution centres and restructured their warehousingon a pan-European basis, with either a single Europeandistribution centre or a handful of regional distributioncentres each serving several countries.
Some companies now organise their distributionfacilities on a global basis, with a single warehouse, ora handful of facilities, responsible for servicing theircustomers across a whole global region, such as NorthAmerica or Europe. Often these distribution centres arecombined with a network of satellite “stockless”depots, that may be used to break-bulk or serviceperipheral markets.
The centralisation of production and inventory hasgenerated increasing requirements for very largeindustrial properties. Major warehouse facilities inEurope and the USA are now quite often around46,450 m2 (500,000 sq ft) and may extend to 92,900 m2
(1m sq ft).
PostponementWhere companies have centralised their production andinventory on a global (or global region) scale, the use of“postponement” enables them to “customise” theirproduction for particular national markets.Postponement is based on the idea of designingproducts using common platforms, components ormodules and undertaking the final assembly, orcustomisation, at or near the final market destination.
Goods may be “mass produced” in, say, Asia-Pacificbut “customised” in an industrial facility or warehousein Europe. Postponement drives down costs and allowsthe “mass customisation” of production.
TABLE 2: EMPLOYMENT BY ECONOMIC ACTIVITY, PERCENTAGE OF TOTAL EMPLOYMENT
1980 1998
Agriculture Industry Services Agriculture Industry Services
United States of America 4 30 66 3 24 73
European Union 9 35 56 5 29 66
Czech/Hungary/Poland 19 44 37 10 36 54
China* 54 19 27 47 18 35
Japan 11 35 54 5 32 63
Australia 6 31 63 5 22 73
Indonesia/Malaysia/Thailand 54 16 30 37 23 40
*For China under 1980 the data is for 1990
Source: International Labour Organisation, World Bank

King Sturge: Global Trends in Industrial Parks
4 5
Just-in-time logisticsIn many markets, time is an increasing source ofcompetitive advantages. The use of just-in-timeproduction and logistics, which originated from Japan,is now widespread and has been adopted in a range ofindustries in various modifications. In essence, just-in-time is a “pull” concept in which demand (at thecustomer end of the supply-chain) pulls production tothe market. This contrasts with the traditional “push”system, where products are manufactured inanticipation of forecast demand and then positioned asinventory (within warehouses) in the supply-chain.
The use of just-in-time production and logistics maygenerate significant demand for warehouses close to amajor manufacturing plant or generate requirements bysuppliers to be co-located with their customers on thesame site.
The growth in outsourcingAs companies have sought to concentrate theirresources on their core business, logistical operations,such as transport and warehousing, have increasinglybeen out-sourced to third party logistic companies.These third party logistics companies may providededicated services tailored to a specific client’s needs,or shared user and multi-user services. Increasingly,leading third party logistics companies are providingintegrated supply-chain management solutions tocompanies.
As globalisation proceeds apace, and new markets areopened up, companies are increasingly looking for thirdparty logistics providers that are capable of offering aninternational, or even global, service. This demand isstimulating consolidation among third party providers,as illustrated by the merger of Exel and the OceanGroup in 2000. This consolidation looks set tocontinue. At the same time, a number of leadinglogistics companies are seeking to position themselvesas “fourth party logistics providers” by effectivelyacting as integrators of a range of different logisticalservices across the whole supply chain.
Global transport
Transport modal choiceGlobalisation has greatly increased the significance offreight transport. Materials and finished goods are nowtransported over much longer distances and the choiceof available transport options, and where to break bulk,is more complicated. Good information systems arealso required to track and trace the movement ofmaterial and goods along the global supply chain.
It is estimated that transport accounts for around aquarter of total logistics costs in OECD countries, andthat logistics costs may account for up to 20% of totalproduction costs.
A company’s choice of freight transport mode isdetermined by the product’s characteristics, cost andservice requirements. Sea freight is considerablycheaper than air freight, but air freight may producesavings elsewhere in the supply-chain that more thanoutweigh the increase in transport costs. This might bethe case, for example, where air freight enablesinventory to be significantly reduced due to just-in-timesupply.
Global sea portsTotal world port traffic reached 6.064bn tons in 1998,reflecting growth of 3% per annum since 1990. In 1998,45% of world port traffic consisted of liquid bulks, 23%of dry bulks and 32% general cargo. Containerisationof general cargo traffic has increased steadily over thepast decade; between 1990 and1998 world containertraffic doubled. The Asia-Pacific region accounts forsome 45% of container traffic, Europe for 23% andNorth America for 16%.
The concentration of traffic on large intermodalplatforms and shipping alliances, such as the GrandAlliance or New World Alliance, has led to aconcentration of traffic at fewer ports. As a result, thetop 10 container ports now handle around 40% of worldtraffic, compared with around 30% in 1980.

King Sturge: Global Trends in Industrial Parks
As a result of this concentration, the major seaports,such as Hong Kong and Singapore, are now much morethan mere sea/land interfaces. As indicated in our casestudies, they have developed into major commercialand industrial centres and inter-modal hubs withininternational supply chains.
Global cargo airportsOver the 10 years between 1991 and 2000, worldwideairfreight volumes have grown by around 7% perannum, according to the International Air TransportAssociation (IATA). The growth in airfreight is beingdriven by a range of factors including the generalgrowth in world trade, the reduction in airfreight tariffs,
the movement to just-in-time logistics, and thecentralisation of warehousing on a pan-European andglobal level. In addition, increasing value densities invarious industrial sectors, such as electronics,healthcare and medical products, have also stimulatedair freight. Four of the 10 largest cargo airports in theworld are in North America, see Table 4.
The significance of Asia-Pacific as a manufacturingbase in the global economy is confirmed by HongKong, Tokyo and Seoul all being in the top 10 worldcargo airports. Long-term growth in this sector oftransport is unlikely to be affected by terrorist eventssuch as 11th September 2001.
TABLE 3: TEN LARGEST CONTAINER PORTS IN THE WORLD
Rank Port Country (CONTINENT) Throughput in TEU
1 Hong Kong China (ASIA) 16,100,000
2 Singapore Singapore (ASIA) 15,900,000
3 Kaohsiung Taiwan (ASIA) 6,985,361
4 Pusan South Korea (ASIA) 6,439,589
5 Rotterdam Holland (EUROPE) 6,400,000
6 Long Beach USA (AMERICA) 4,408,480
7 Shanghai China (ASIA) 4,210,000
8 Los Angeles USA (AMERICA) 3,828,851
9 Hamburg Germany (EUROPE) 3,750,000
10 Antwerp Belgium (EUROPE) 3,614,264
TEU is twenty-foot-equivalent units
Source: Containerisation International, 1999
TABLE 4: TEN LARGEST CARGO AIRPORTS IN THE WORLD
Rank Airport Country (CONTINENT) Throughput in TONS
1 Memphis USA (AMERICA) 2,489,070
2 Hong Kong China (ASIA) 2,267,175
3 Los Angeles USA (AMERICA) 2,054,212
4 Tokyo Japan (ASIA) 1,932,694
5 Anchorage USA (AMERICA) 1,883,825
6 Seoul South Korea (ASIA) 1,874,228
7 New York USA (AMERICA) 1,825,906
8 Frankfurt Germany (EUROPE) 1,710,144
9 Singapore Singapore (ASIA) 1,705,410
10 Miami USA (AMERICA) 1,642,484
Source: Airports Council International, 2000
King Sturge: Global Trends in Industrial Parks
6 7
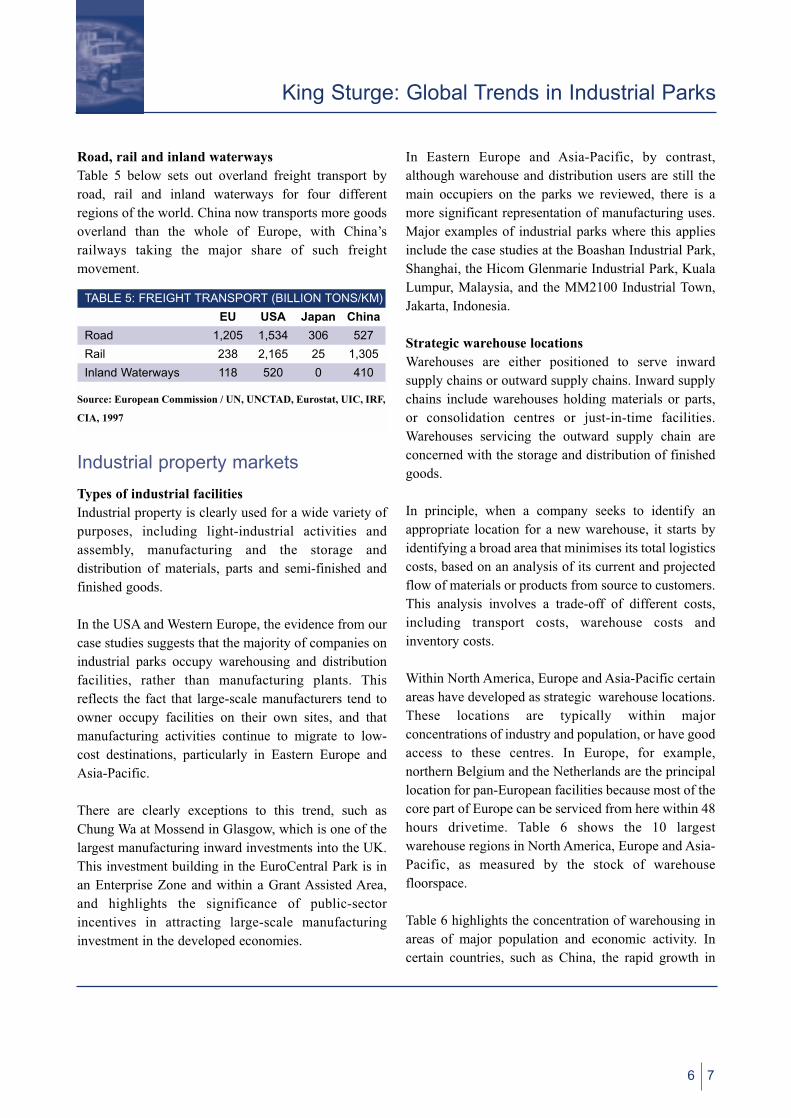
Road, rail and inland waterways Table 5 below sets out overland freight transport byroad, rail and inland waterways for four differentregions of the world. China now transports more goodsoverland than the whole of Europe, with China’srailways taking the major share of such freightmovement.
Industrial property markets
Types of industrial facilitiesIndustrial property is clearly used for a wide variety ofpurposes, including light-industrial activities andassembly, manufacturing and the storage anddistribution of materials, parts and semi-finished andfinished goods.
In the USA and Western Europe, the evidence from ourcase studies suggests that the majority of companies onindustrial parks occupy warehousing and distributionfacilities, rather than manufacturing plants. Thisreflects the fact that large-scale manufacturers tend toowner occupy facilities on their own sites, and thatmanufacturing activities continue to migrate to low-cost destinations, particularly in Eastern Europe andAsia-Pacific.
There are clearly exceptions to this trend, such asChung Wa at Mossend in Glasgow, which is one of thelargest manufacturing inward investments into the UK.This investment building in the EuroCentral Park is inan Enterprise Zone and within a Grant Assisted Area,and highlights the significance of public-sectorincentives in attracting large-scale manufacturinginvestment in the developed economies.
In Eastern Europe and Asia-Pacific, by contrast,although warehouse and distribution users are still themain occupiers on the parks we reviewed, there is amore significant representation of manufacturing uses.Major examples of industrial parks where this appliesinclude the case studies at the Boashan Industrial Park,Shanghai, the Hicom Glenmarie Industrial Park, KualaLumpur, Malaysia, and the MM2100 Industrial Town,Jakarta, Indonesia.
Strategic warehouse locationsWarehouses are either positioned to serve inwardsupply chains or outward supply chains. Inward supplychains include warehouses holding materials or parts,or consolidation centres or just-in-time facilities.Warehouses servicing the outward supply chain areconcerned with the storage and distribution of finishedgoods.
In principle, when a company seeks to identify anappropriate location for a new warehouse, it starts byidentifying a broad area that minimises its total logisticscosts, based on an analysis of its current and projectedflow of materials or products from source to customers.This analysis involves a trade-off of different costs,including transport costs, warehouse costs andinventory costs.
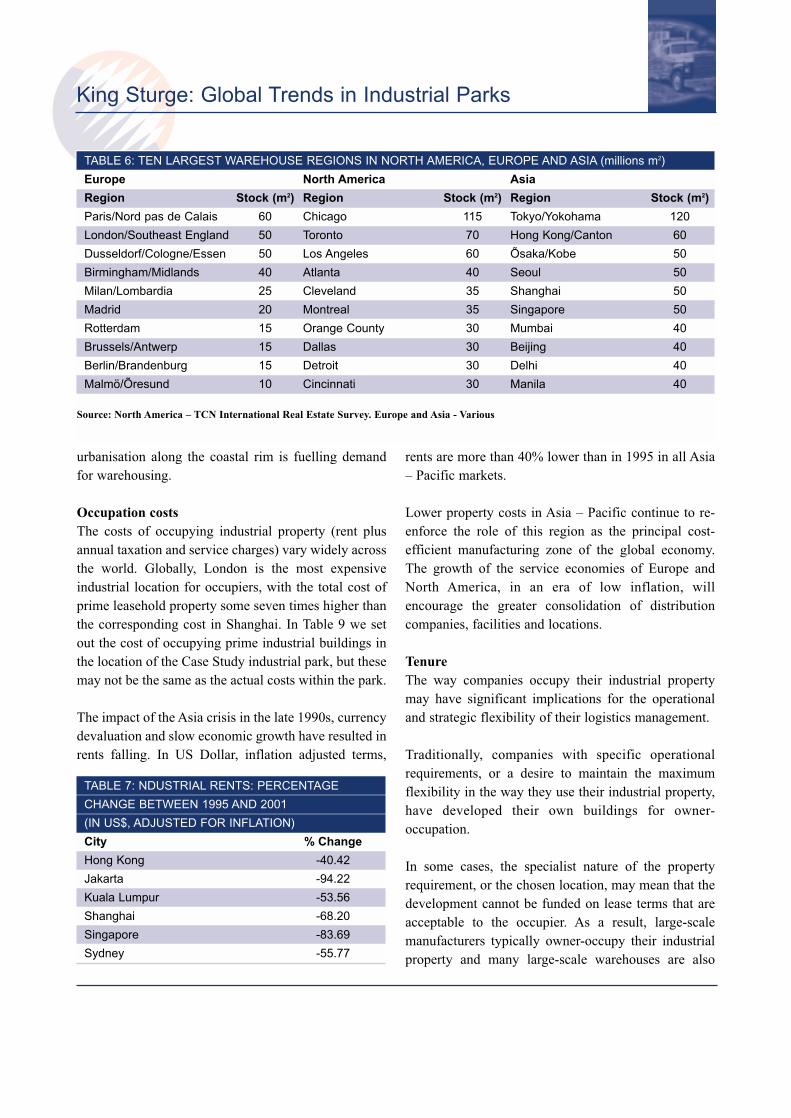
Within North America, Europe and Asia-Pacific certainareas have developed as strategic warehouse locations.These locations are typically within majorconcentrations of industry and population, or have goodaccess to these centres. In Europe, for example,northern Belgium and the Netherlands are the principallocation for pan-European facilities because most of thecore part of Europe can be serviced from here within 48hours drivetime. Table 6 shows the 10 largestwarehouse regions in North America, Europe and Asia-Pacific, as measured by the stock of warehousefloorspace.
Table 6 highlights the concentration of warehousing inareas of major population and economic activity. Incertain countries, such as China, the rapid growth in
TABLE 5: FREIGHT TRANSPORT (BILLION TONS/KM)
EU USA Japan China
Road 1,205 1,534 306 527
Rail 238 2,165 25 1,305
Inland Waterways 118 520 0 410
Source: European Commission / UN, UNCTAD, Eurostat, UIC, IRF,
CIA, 1997
King Sturge: Global Trends in Industrial Parks
urbanisation along the coastal rim is fuelling demandfor warehousing.
Occupation costsThe costs of occupying industrial property (rent plusannual taxation and service charges) vary widely acrossthe world. Globally, London is the most expensiveindustrial location for occupiers, with the total cost ofprime leasehold property some seven times higher thanthe corresponding cost in Shanghai. In Table 9 we setout the cost of occupying prime industrial buildings inthe location of the Case Study industrial park, but thesemay not be the same as the actual costs within the park.
The impact of the Asia crisis in the late 1990s, currencydevaluation and slow economic growth have resulted inrents falling. In US Dollar, inflation adjusted terms,
rents are more than 40% lower than in 1995 in all Asia– Pacific markets.
Lower property costs in Asia – Pacific continue to re-enforce the role of this region as the principal cost-efficient manufacturing zone of the global economy.The growth of the service economies of Europe andNorth America, in an era of low inflation, willencourage the greater consolidation of distributioncompanies, facilities and locations.
TenureThe way companies occupy their industrial propertymay have significant implications for the operationaland strategic flexibility of their logistics management.
Traditionally, companies with specific operationalrequirements, or a desire to maintain the maximumflexibility in the way they use their industrial property,have developed their own buildings for owner-occupation.
In some cases, the specialist nature of the propertyrequirement, or the chosen location, may mean that thedevelopment cannot be funded on lease terms that areacceptable to the occupier. As a result, large-scalemanufacturers typically owner-occupy their industrialproperty and many large-scale warehouses are also
TABLE 6: TEN LARGEST WAREHOUSE REGIONS IN NORTH AMERICA, EUROPE AND ASIA (millions m2)
Europe North America Asia
Region Stock (m2) Region Stock (m2) Region Stock (m2)
Paris/Nord pas de Calais 60 Chicago 115 Tokyo/Yokohama 120
London/Southeast England 50 Toronto 70 Hong Kong/Canton 60
Dusseldorf/Cologne/Essen 50 Los Angeles 60 Õsaka/Kobe 50
Birmingham/Midlands 40 Atlanta 40 Seoul 50
Milan/Lombardia 25 Cleveland 35 Shanghai 50
Madrid 20 Montreal 35 Singapore 50
Rotterdam 15 Orange County 30 Mumbai 40
Brussels/Antwerp 15 Dallas 30 Beijing 40
Berlin/Brandenburg 15 Detroit 30 Delhi 40
Malmö/Õresund 10 Cincinnati 30 Manila 40
Source: North America – TCN International Real Estate Survey. Europe and Asia - Various
TABLE 7: NDUSTRIAL RENTS: PERCENTAGE
CHANGE BETWEEN 1995 AND 2001
(IN US$, ADJUSTED FOR INFLATION)
City % Change
Hong Kong -40.42
Jakarta -94.22
Kuala Lumpur -53.56
Shanghai -68.20
Singapore -83.69
Sydney -55.77

King Sturge: Global Trends in Industrial Parks
8 9
owner-occupied, especially where these are builtaround specialist high-bay automated storage andretrieval systems.
In general however, the majority of companies that donot have specialist requirements prefer to leaseproperty, because this releases finance for investment intheir core activities. In addition, by leasing propertyrather than owning it, companies reduce their fixedassets, which may have significant effects on keyfinancial ratios.
Over recent years, occupiers of industrial property haveincreasingly sought more flexible lease commitmentsfrom property owners, in order to enhance the
flexibility of their property assets and minimise the riskof residual property liabilities, should changingbusiness needs promote a rationalisation of theirproperty.
The major logistics service providers have been at theforefront in terms of requiring more flexible leaseterms, because their contracts are often only for three tofive years. As more logistics expenditure is out-sourced, the logistics service providers will become amore important source of industrial property demandand hence the demand for more flexible lease structureswill continue. These companies are providing a majorsource of demand for the warehousing developed forinstance by ProLogis and others.
TABLE 8: TOTAL PRIME COSTS OF OCCUPATION - IN THE REGION OF EACH INDUSTRIAL PARK
Rank City, Country & Continent Industrial Park US$ ft2 pa € m2 pa
1 London, UK Premier Park, Park Royal 22.79 273.97
2 Dublin, Ireland Rosemount Business Park 16.65 200.04
3 Hong Kong, China AFFC, Chek Lap Kok Airport 14.46 173.80
4 Glasgow, UK EuroCentral, Mossend 12.32 148.00
5 Bicester, UK Bicester Distribution Park 11.98 144.00
6 Bristol, UK Western Approach Distribution Park 11.82 142.00
7 Chepstow, UK Newhouse Farm Estate 11.82 142.00
8 Singapore Science Park 11.81 141.92
9 Manchester, UK Trafford Park 11.40 137.00
10 Madrid, Spain Coslada Logistics Park 9.61 115.42
11 New Jersey, USA CenterPoint at 8A 9.25 111.15
12 Paris, France Parisud Sénart Business Park, Sénart 8.94 107.47
13 Lodz, Poland, Diamond Business Park 8.92 107.16
14 Cologne, Germany Prologis Park Cologne 8.00 98.00
15 Sydney, AUSTRALIA 108-120 Silverwater Road 8.13 97.77
16 Prague, Czech Republic D1 Logistics Park 7.54 90.60
17 Cleveland, Ohio, USA Parma Commerce Center 7.35 88.32
18 Los Angeles, USA Dominguez Technology Park 6.96 83.63
19 Marseille, France Clésud Platform Park, Grans Miramas 6.79 81.55
20 Jakarta, Indonesia MM2100 Industrial Town, Bekasi 6.51 78.20
21 Brussels, Belgium Delta Park, Weihoek 3, Zaventem 5.98 71.90
22 Kuala Lumpur, Malaysia Hicom Glenmarie Industrial Park 5.21 62.61
23 Shanghai, China Baoshan Urban Industrial Park 3.32 39.92
Total occupation costs are derived by: accumulating the net rent, service charges (occupational costs), and local taxes. Exchange rates are fixed as atDecember 2001. Rents refer to headline rents for prime units circa 2,500 m2. Office content is assumed to be no more than 10%
Source: King Sturge CORFAC International Network of Offices and Associates / Q2 2001

King Sturge: Global Trends in Industrial Parks
Environmental issues Environmental issues are becoming a more importantconsideration for occupiers, developers and investors,as the concept of sustainable development moves up theinternational political agenda. Issues such as landcontamination, waste management and energyconservation have potentially significant implicationsfor the operations of end-users, property values andinvestment returns.
Outlook
With the USA economy in or almost in recession in H22001 and early 2002, the Japanese economy stagnatingand European economic growth slowing down, theworld economy in 2002 is likely to grow by its slowestrate since the early 1980s.
World economic growth is likely to pick-up in late2002, according to forecasts in early 2002 from OxfordEconomic Forecasting and others. Growth in thesubsequent three years, between 2003 and 2005, couldaverage over 3% per annum, as the outlook in each ofthe major economic “blocks”, the USA, Europe andJapan improves. Certain countries, notably China, arepredicted to see growth over 7% per annum over thisperiod.
It is important to distinguish between short-termcyclical economic change and longer-term structuralchange. Although in the short-term, occupier activity inmajor industrial markets seems likely to moderate inthe USA and much of Western Europe, over themedium-term the overall global economic growthoutlook should be relatively supportive of occupierdemand for industrial property. This is especially thecase in parts of Asia-Pacific, including China wheregrowth will be stimulated by membership of the WorldTrade Organisation in 2002.
As always with property markets, there is a need forusers and investors to be aware of the varying prospectsboth within and between countries, and of thedynamics, both cyclical and structural, that drivegrowth. It is hoped that this report will make a modestcontribution to this understanding.

King Sturge: Global Trends in Industrial Parks
10 11
Developers / Investors Industrial Park City Country / Continent
(AIG) American International Group Diamond Business Park Lodz, Poland, EUROPE
(AIG) American International Group D1 Logistics Park Prague, Czech, EUROPE
Amec Developments EuroCentral, Mossend Glasgow, UK, EUROPE
AMP Asset Management Premier Park,Park Royal London, UK, EUROPE
Argent Bicester Distribution Park Bicester, UK, EUROPE
Argo Manunggal Group MM2100 Industrial Town Bekasi, Indonesia, ASIA
Bachrock Associates CenterPoint at 8A New Jersey, USA
Bank of Scotland Bicester Distribution Park Bicester, UK, EUROPE
BICC Pension Fund Bicester Distribution Park Bicester, UK, EUROPE
Bicester Park Development Co Ltd Bicester Distribution Park Bicester, UK, EUROPE
Brixton Estate Premier Park, Park Royal London, UK, EUROPE
Cabot Industrial Reit CenterPoint at 8A New Jersey, USA
Caisse des Depots et Consignations Clesud Platform Park Marseille, France, EUROPE
Caisse Nationale de Prevoyance Clesud Platfor Park Marseille, France, EUROPE
Caja de Ahorros de Madrid (CajaMadrid) Coslada Logistics Park Madrid, Spain, EUROPE
Carson Companies Dominguez Technology Park Los Angeles, California, USA
CEIDCO Ozarow Business Centre Warsaw, Poland, EUROPE
Centurian Investments 108-120 Silverwater Rd Sydney, Australia, ASIA
Cheshire Development Corp Trafford Park Manchester, UK, EUROPE
Corporate Office Properties Trust CenterPoint at 8A New Jersey, USA
Coslada Council Coslada Logistics Park Madrid, Spain, EUROPE
DRB Hicom Berhad Hicom Glenmarie I/Park Kuala Lumpur, Malaysia, ASIA
East Mon Industrial Holdings Ltd Newhouse Farm Estate Chepstow, UK, EUROPE
EON Bank Berhad Hicom Glenmarie I/Park Kuala Lumpur, Malaysia, ASIA
Epareb public organisation Clesud Platform Park Marseille, France, EUROPE
Etablissement Public d’Amenagement (EPA Senart) Parisud Senart B/P Paris, France, EUROPE
EuroCentral Partnership Limited EuroCentral, Mossend Glasgow, UK, EUROPE
Gazeley Properties Trafford Park Manchester, UK, EUROPE
GE Capital CenterPoint at 8A New Jersey, USA
Geis Companies Parma Commerce Center Cleveland, Ohio, USA
Green Property Trafford Park Manchester, UK, EUROPE
Heitman Financial Ozarow Business Centre Warsow, Poland, EUROPE
Henderson Global Investors Premier Park, Park Royal London, UK, EUROPE
Hermes Bicester Distribution Park Bicester, UK, EUROPE
HOB Realty CenterPoint at 8A New Jersey, USA
Horsedale Development Berhad Hicom Glenmarie I/Park Kuala Lumpur, Malaysia, ASIA
HypoVereinsbank D1 Logistics Park Prague, Czech, EUROPE
ICI Western Approach D/Park Bristol, UK, EUROPE
John Laing Property Bicester Distribution Park Bicester, UK, EUROPE
Kai Shing Management Services Ltd AFFC, Chek Lap Kok Hong Kong, China, ASIA
Kingspark Development Premier Park, Park Royal London, UK, EUROPE
Developers / Investors mentioned in the Case Studies

King Sturge: Global Trends in Industrial Parks
Developers / Investors Industrial Park City / Country / Continent
Lanarkshire Development Agency EuroCentral, Mossend Glasgow, UK, EUROPE
Lincoln Property Company Diamond Business Park Lodz, Poland, EUROPE
Lincoln Property Company D1 Logistics Park Prague, Czech, EUROPE
London & Metropolitan Bicester Distribution Park Bicester, UK, EUROPE
Marubeni Corporation MM2100 Industrial Town Bekasi, Indonesia, ASIA
Matrix Development Group CenterPoint at 8A New Jersey, USA
Monde Developments Trafford Park Manchester, UK, EUROPE
Oceanic Life 108-120 Silverwater Rd Sydney, Australia, ASIA
PRD (Percier Realisation et Developpement) Clesud Platform Park Marseille, France, EUROPE
Predica Clesud Platform Park Marseille, France, EUROPE
Premier Greenford Premier Park, Park Royal London, UK, EUROPE
ProLogis Prologis Park Cologne Cologne, Germany, EUROPE
ProLogis Premier Park, Park Royal London, UK, EUROPE
ProLogis Clesud Platform Park Marseille, France, EUROPE
PT Bekasi Fajar Industrial Estate MM2100 Industrial Town Bekasi, Indonesia, ASIA
Redrow Western Approach D/Park Bristol, UK, EUROPE
Royal & Sun Alliance Equities Ltd 108-120 Silverwater Rd Sydney, Australia, ASIA
Royal Bank of Scotland EuroCentral, Mossend Glasgow, UK, EUROPE
Schenkman & Kushner CenterPoint at 8A New Jersey, USA
Security Capital Prologis Park Cologne Cologne, Germany, EUROPE
Shanghai Baoshan District Government Baoshan Urban I/Park Shanghai, China, ASIA
Sun Hung Kai Properties Ltd (SHK) AFFC, Chek Lap Kok Hong Kong, China, ASIA
TKG International Ozarow Business Centre Warsaw, Poland, EUROPE
Trafford Park Estates Trafford Park Manchester, UK, EUROPE
Tyndall Life Insurance Company 108-120 Silverwater Rd Sydney, Australia, ASIA
Tyndall Meridian Trust 108-120 Silverwater Rd Sydney, Australia, ASIA
Volkswagen CenterPoint at 8A New Jersey, USA
W W Grainger CenterPoint at 8A New Jersey, USA
Watson Land Company Dominguez Technology Park Los Angeles, California, USA

King Sturge: Global Trends in Industrial Parks
12 13
Belgium
DELTA PARK, WEIHOEK 3, 1930ZAVENTEM, BRUSSELS
Output for the EconomyThe Belgium economy in 2001 slowed along with othereconomies in the European Union. Increasing inflation,due to the conversion to the euro at the beginning of2002, along with slower economic activity are allfactors that may be negative in the short-term for thereal estate market.
Changes in the Property Market StructureApart from Delta Park, there have been no newindustrial park developments of any significance in andaround the Brussels region since 1992.
There are two reasons for this. Firstly, demand forindustrial property in the Brussels region has beendiminishing. Secondly, there is little land available fordevelopment and when land is released by theauthorities strong public protest makes it difficult todevelop schemes.
Reduction of company and registration tax in the nearfuture could be positive for the industrial market. Thecurrent rate is one of the highest in Europe.
Transport & InfrastructureThe logistic map of Belgium shows that most of thenew sites are in the eastern part and with easyconnections with the Port of Antwerp. Zaventembenefits from a good location providing easy access tothe Zaventem Airport (next door) and the motorwaysE19 (Antwerp - Charleroi), E40 (Liège) and E411(Namur). Brussels Centre is 10-minute drive from theDelta Park.
Description of Delta Park, Weihoek 3Delta Park, Weihoek 3 consists of 9 units comprisingwarehouses and offices of different sizes. The first unitof the park was built in 1987.
The warehouse accommodation comprises free heightsof 6 metres. This is except for units 6 and 7, where thefree heights are 9 metres. Access doors for lorries are4m x 4.25m. Floors are of polyconcrete with loadingcapacity of 3,000 kg/m2. The roof is metallic withrockwool insulation (6 cm thick). Gas-fired hot airconvectors are installed to provide temperatures ofbetween - 10 ° and + 18° C.
The office accommodation is finished to a highstandard with the entrance and stairs in granite. Thereare glass doors, fitted carpets and the windows havedouble-glazed aluminium frames. The central heating isby hot-water circuit radiators controlled by thermostaticvalves. Acoustical and ornamental suspended ceilingswith flush lights are incorporated.
There is a large green area and car parking.
The Developer/InvestorsA Scandinavian group of private investors have heldthis property since the development stage. They alsoown a logistical building next door, currently occupiedby Black & Decker.

King Sturge: Global Trends in Industrial Parks
The OccupiersPrime rents currently stand at 2,500 BEF/m2/year forwarehouse accommodation and 4,300 BEF/m2/year foroffice accommodation. Smaller units normally obtainhigher rents. Rents have remained stable over the lastfew years.
OutlookDemand for office space in the city is at such a highlevel, that companies are looking outside Brussels foroffice space. As a consequence, the developer of theDelta Park has created extra offices in 1992 in order toraise its yield.
The new economy is having less impact on thewarehouse market than was first anticipated but themarket may be contracting; for example, E-toysoccupied space but have since moved out.
Units and Size Occupier
Units 1 and 2, 1475 m2 Gemplus N.V.
Unit 3, 1,260 m2 Grundig Belux N.V.
Unit 4, 911 m2 Henran N.V.
Unit 5, 876 m2 Controlware
Northern Europe
Unit 6, 1,956 m2 Nipro Europe N.V.
Unit 7, 1,842 m2 Black & Decker
Belgium
Unit 8BI, 275 m2 Sixt Rent A Car
Unit 9, 876 m2 Cirsa Belgium N.V.
Units Availability
Unit 4 Henral N.V.
Unit 8, 272 m2 Brink’s – Ziegler N.V.

King Sturge: Global Trends in Industrial Parks
14 15
Czech Republic
D1 LOGISTICS PARK,PRAGUE
Output for the EconomyThe real GDP of the Czech Republic grew by 3.1 % in2000 and slightly slower in 2001.
Foreign Direct Investment has been relatively high inrecent years at US$4.8bn in 1999 and US$4.6bn in2000. Recent foreign investors include Phillips,Volkswagen and Baumax Vetriebs. Sectors benefitingfrom foreign investment include motor vehiclemanufacture.
Changes in the Property Market StructureIn the Czech Republic most modern office, retail andwarehouse commercial property is located in thePrague region.
Modern manufacturing facilities have been built acrossthe country since the “Velvet Revolution” of 1989.
Transport & InfrastructureThe “D1 Logistics Park” is located on the D1 highway,11km to the southeast of the centre of Prague. The parkis situated in the Rícany – Jesenice area.
The D1 Logistics Park is well located to serve thewhole of the Czech Republic. The D1 highwayprovides access to the main cities and towns of thecountry. The centre of Prague is a ten-minute drivefrom the park, while the second city of the country,Brno, is approximately a ninety-minute drive. The D1road goes to Bratislava and provides a route to Viennaand Budapest.
D1 Logistics Park will in time also link up with the newPrague outer ring road. There is to be a junctionadjacent to the site, which via the ring road will providedirect access to the D5 and Ruzyne Airport.
Description of D1 Logistics ParkThe D1 Logistics Park is considered, along with RudnáLogistic Park, to offer the best warehousing product inthe Czech Republic.
The D1 Logistics Park has been developed in two mainphases. The first phase, D1 Logistics Park West, is tothe west, and the second phase, D1 Logistics Park East,is to the east of the D1 highway.
D1 Logistics Park West comprises a total of 40,000 m2
of warehouse/distribution space split between threebuildings. It was completed in early 2000 and is now100% leased.
D1 Logistics Park East once completed will comprise35,000 m2 of warehouse/distribution space, also splitbetween three buildings. The first tenants entered thescheme in early 2001 and the second building wascompleted in the second quarter 2001. Construction isdue to begin on the third building in the second quarter2002.

King Sturge: Global Trends in Industrial Parks
The Developer/InvestorsAIG Lincoln financed the development of D1 LogisticsPark. AIG Lincoln is active across Central Europehaving financed office and warehouse projects inPrague, Warsaw and Budapest.
The German bank, HypoVereinsbank, provided debtfunding.
The Occupiers Phase 1 – D1 Logistics Park WestThe first phase of the development consists of buildingsA and C, which have been occupied by Danzas a.s.since September 1999. Building A is 20,803 m2 in sizeand building C is 6,927 m2 in size. The lease on thesebuildings is for an indefinite term, with mutual breaksat year ten and thereafter every five years. The rentaluplift over the period is based upon the German CPIIndex.
Building B has been occupied by Bruhn Transport CRs.r.o. since October 1999. The building is leased for anindefinite period, although the tenant has the right tobreak, although with penalties, at year 5,6,7,8 and 9 andthereafter each year without penalties. Rental uplift willnot happen until 2002, from when it will be subject to aminimum 1.75% per annum increase.
Phase 2 – D1 Logistics Park East Building 100, 5,571 m2 in size, has been partlyoccupied by Rossmann s.r.o. and R&R Oost EuropaB.V. since December 2000. The leases are for anindefinite period, while there is an option to break afterevery five years. Rental uplift is due to take place on 1stFebruary each year from 2002 and is based on GermanCPI, subject to a 1.75% pa minimum.
Building 101, sized 5,393 m2, is partly let to L’OrealCeská Republiká s.r.o. The lease is for an indefiniteperiod from February 2001. Rental uplift is annual fromOctober 2002 and subject to a minimum of 1.75% pa.
Building 102, sized 6,458m2, is partially occupied bySchneidersohne Papier Praha s.r.o. The lease is fromJuly 2001 and is for an indefinite period. Rental upliftis due to take place every February and is linked toGerman RPI, subject to a minimum increase of 1.5%pa.

King Sturge: Global Trends in Industrial Parks
16 17
France
Output for the EconomyEconomic growth in France slowed to less than 2.0% in2001, following strong growth of 3.1% in 2000. Slowereconomic growth is in large part due to the globalslowdown in economic activity.
Changes in the Property Market StructureDemand has been strong for modern logisticwarehouses due to the strength of the economy and agrowing trend towards the outsourcing of logisticactivities.
The transformation in the logistics industry hasincreased the requirement for modern warehouse spacethat meets the needs of logistics companies.
CLESUD PLATFORM PARK, GRANS MIRAMAR, BOUCHES DURHONE, MARSEILLE REGION
Transport & InfrastructureClésud is at the economic heart of southern France; aregion with a population of over 2 million.
Road access to Clésud is good. It is located 3km fromthe Salon-Ouest exit of the A54 highway that runsbetween Spain and Italy. From 2004, roadcommunications will be further improved with thecompletion of the A56 highway.
Rail access is provided through the Miramas terminal, aSNCF hub for goods traffic for the Provence-Alpes-Côte d’Azur region. The railway network is linked tothe road network at Clésud.
The rail-road transport infrastructure at Clésud mayhandle in time 210,000 goods trucks per year. Initially,it will be equipped to handle 60,000 goods trucks peryear (some 800,000 tons of freight).
The Marseille-Provence International Airport isFrance’s leading airport for freight traffic after thoseairports located in Paris Ile-de-France.
Sea access is provided by the Distriport maritimelogistics platform at the Port of Marseille. Clésud isdirectly linked with the container port by rail.
The river ports of Arles and Port-Saint-Louis-du-Rhôneare located 20 minutes from Clésud. The inland waterwaynetwork is linked to the road and railway networks.
Description of Clésud Distribution ParkThe Clésud project was agreed in April 1997 as part ofFrance’s national multi-modal development scheme.
Clésud covers an area of 278 hectares, of which 219hectares is dedicated to warehousing and the facilitiescentre. The other 59 hectares are dedicated to mixed-technology use, for catering purposes and for thecombined road-rail transport infrastructure.
Proposed development includes 600,000 m2 ofwarehousing.

King Sturge: Global Trends in Industrial Parks
The Developer/InvestorsThe Eparéb public organisation is responsible for issuesrelating to planning, marketing and development. Todate, 52 hectares have been marketed for warehousedevelopment.
Prologis has acquired a 15-hectare site on which itrecently built a 22,000 m2 distribution facility.
The company owns a further 100 hectares. The secondphase of the Prologis development will include theconstruction of two further buildings of approximately20,000 m2 each.
The Developer, Percier Réalisation et Développement,with the investors Caisse des Dépôts et Consignations /Caisse Nationale de Prévoyance / Prédica aredeveloping the Distripôle Clésud scheme.
The Distripôle Clésud scheme is on a 26 hectare site.The first phase consists of 22,700 m2 of warehousingbuilt speculatively and launched in July 2001. Thesecond phase consists of 22,000 m2 of warehousing andis due to be delivered in November 2001. Over fiveyears the plan for the scheme is a developmentcomprising 120,000 m2 of warehousing accommodationdivided into 4 units.
The OccupiersNortene Jardin, a garden furniture company, occupies11,700 m2 of warehousing. The scheme was completedin January 2001 and a 22,000 m2 extension isscheduled.
Rexel GEI, an electronics materials distributor,occupies 17,000 m2 of warehousing. The warehousewas completed in May 2001 and a 21,000 m2 extensionis scheduled.
Giraud Logistique is due to occupy a 22,000 m2 unit.
Rents are circa FFr270 m2 per year (exclusive of tax)for the warehouse accommodation and FFr450 m2 peryear for the office accommodation.
PARISUD SENART BUSINESSPARK, SENART NEW TOWN,SEINE ET MARNE
Transport & InfrastructureSénart is a new town located 30kms southeast of Paris.
Sénart is well served with road communications. It hasgood connections with in the Ile de France by way ofthe Francilienne (N 104) ring road and the A5motorway. It also has good motorway connections tothe rest of France via the A1, A4, A6 and A10motorways.
Parisud Sénart Business Park is located close to theFrancilienne ring road at the intersection with the A5motorway. It is served by two-traffic interchanges (exits24 and 25).
The airports of Paris Orly and Roissy Charles de Gaullehandle 1,360,000 metric tons of cargo per annum. Orlyairport is a 20-minute drive from Sénart via the A6 orRN7, and Roissy Charles de Gaulle airport is a 40-minute drive via the Francilienne ring road.
The SNCF rail freight network has a terminal at Sénart.This terminal is on the Paris-Lyon-Marseille line.
Description of Parisud Sénart Business ParkParisud Sénart Business Park is located in the districtsof Combs-la-Ville, Tigery and Lieusaint.

King Sturge: Global Trends in Industrial Parks
18 19
It covers 180 hectares; of which 127 hectares have beendeveloped or are under development.
There have been six phases to Parisud Sénart BusinessPark.
There are a number of legal and tax advantages forcompanies locating to Sénart. These include:dispensation from planning approval; exemption from anumber of taxes such as those on office buildings,water/ sanitation infrastructure and TLE (Local FacilityTax); a local business tax rate of less than 24 %.
The Developer/InvestorsEtablissement Public d’Aménagement (EPA Sénart) isresponsible for planning and marketing issues atParisud Sénart Business Park. EPA Sénart is a publicinstitution.
Developers behind schemes include Slough Estates,G.A, Distripole Development and Percier Réalisation etDéveloppement. There is currently some developmenton a speculative basis.
Investors backing schemes include: Cargill, ALS,UIS/General Electric, Caisse des Dépôts etConsignations, Caisse Nationale de Prévoyance,Prédica and Bail Investissement.
The Occupiers Most of the occupiers at Parisud Sénart Business Parkare logistic companies. Examples of occupiers are asfollows.
NMPP, a paper distribution company, occupies 40,000m2 of warehousing in Parisud 4.
TAT Express occupies 20,000 m2 of warehousing inParisud 1.
Giraud occupies 16,000 m2 of warehousing in Parisud4. The rent is circa FFr330 m2 per year (exclusive oftax) on a 6-year lease.
Geodis occupies 20,000 m2 of warehousing in Parisud2. The rent is circa FFr330 m2 per year (exclusive oftax) for the warehouse accommodation and FFr550 m2
per year for the office accommodation on a 6-yearlease.
Mercedes, the auto company, occupies 21,826 m2 ofwarehouse space and 600 m2 of office space in Parisud4. The rent is FFr330 m2 per year (exclusive of tax) ona 9-year lease.
Barlatier and UTL occupy 20,000 m2 of warehousing.The rent is FFr320 m2 per year (exclusive of tax).
CHS Metrologie occupies 40,000 m2 of warehousing.The rent is FFr325 m2 per year (exclusive of tax) on a6-year lease.
A speculative warehouse development of 47,200 m2
was completed at the end of 2001.
OutlookOver the last four years, Sénart has become animportant location for modern logistic companies.
Further development opportunities exist in Sénart.
Phase Hectares available Date authorised
for development for development
Parisud 1 64 ha April 1997
Parisud 2 4.7 ha June 1990
Parisud 3 19.5 ha October 1997
Parisud 4 51.4 ha October 1996
Parisud 5 5.2 ha October 1996
Parisud 6 31.5 ha December 1999

King Sturge: Global Trends in Industrial Parks
Germany
PROLOGIS PARK,COLOGNE
Output for the EconomyGermany is the largest economy in Europe and thesecond largest exporting nation in the world (with adominance in the automotive, machinery and chemicalindustries). The country is the most populated nation inEurope with 80 million inhabitants.
Changes in the Property Market StructureGermany has a geo-strategic location in the centre ofEurope. Germany borders nine European countries:France, Belgium Netherlands, Luxembourg, Denmark,Poland, Czech Republic, Austria and Switzerland.
The importance of Germany’s location at the centre ofEurope will increase, as countries to the east such asPoland, Czech Republic and Hungary, are admitted tothe European Union.
The logistics market in Germany is highlydecentralised.
The highest concentration of industrial parks inGermany is in North-Rhine Westphalia. This stateforms the Ruhr (the industrial powerhouse of Germany)and is the most populous German State. Cologne issituated in North-Rhine Westphalia.
Transport & InfrastructureProLogis Park Cologne is located approximately 7kmsouth of Cologne City Centre with in easy access to allmetropolitan areas via the nearby ring road.
The site itself offers excellent access to the A4/E40Highway. There is excellent access to Cologne-BonnAirport.
Other cities close to Cologne in the Ruhr includeDüsseldorf, Essen, Duisburg and Dortmund. Frankfurtis to the southeast and Aachen is to the southwest.
Germany has a very highly developed traffic andcommunications infrastructure.
Description ProLogis Park, CologneProLogis Park Cologne is a new logistics warehousedevelopment. The scheme comprises a 25 hectare siteconsisting of two phases providing units from 2,310 m2
up to 18,849 m2 for industrial / warehouse use.
Phase 1 is complete and consists of two 18,849 m2
warehouses. Work has not begun on Phase 2. Thisphase, once built, will consist of four warehouses sized:9,394 m2, 12,672 m2, 14,872 m2 and 18,700 m2.
King Sturge: Global Trends in Industrial Parks
20 21
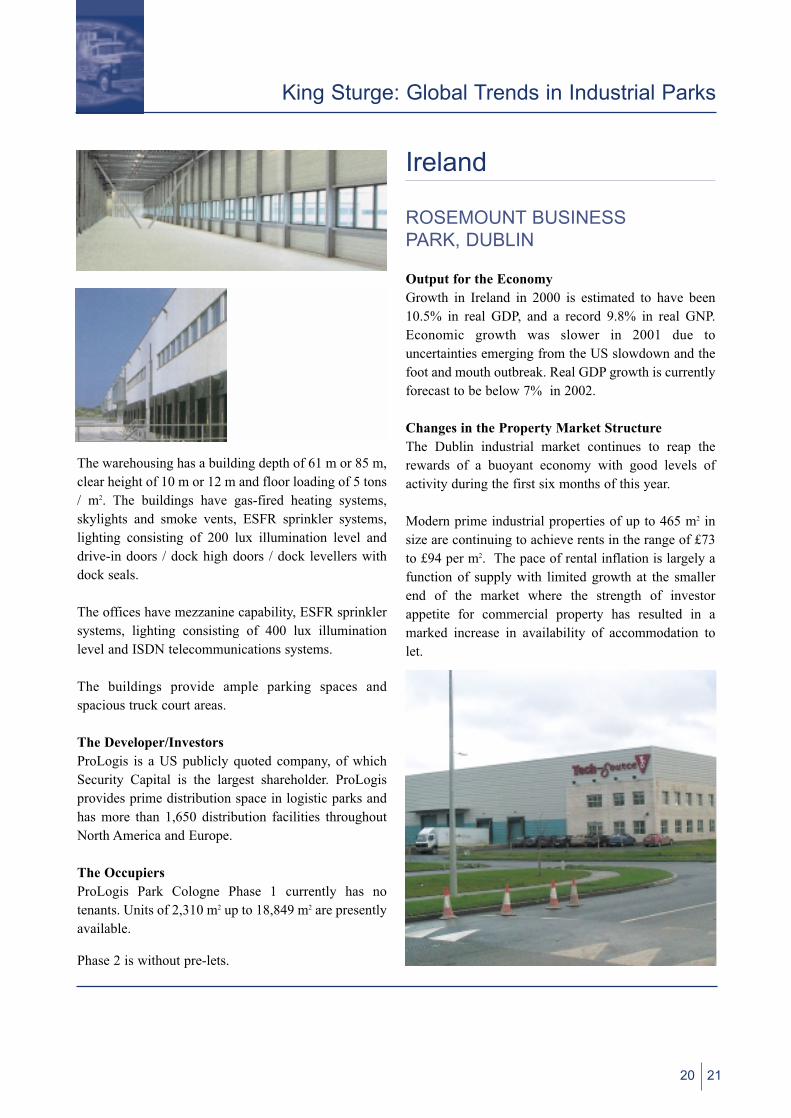
The warehousing has a building depth of 61 m or 85 m,clear height of 10 m or 12 m and floor loading of 5 tons/ m2. The buildings have gas-fired heating systems,skylights and smoke vents, ESFR sprinkler systems,lighting consisting of 200 lux illumination level anddrive-in doors / dock high doors / dock levellers withdock seals.
The offices have mezzanine capability, ESFR sprinklersystems, lighting consisting of 400 lux illuminationlevel and ISDN telecommunications systems.
The buildings provide ample parking spaces andspacious truck court areas.
The Developer/InvestorsProLogis is a US publicly quoted company, of whichSecurity Capital is the largest shareholder. ProLogisprovides prime distribution space in logistic parks andhas more than 1,650 distribution facilities throughoutNorth America and Europe.
The Occupiers ProLogis Park Cologne Phase 1 currently has notenants. Units of 2,310 m2 up to 18,849 m2 are presentlyavailable.
Phase 2 is without pre-lets.
Ireland
ROSEMOUNT BUSINESS PARK, DUBLIN
Output for the EconomyGrowth in Ireland in 2000 is estimated to have been10.5% in real GDP, and a record 9.8% in real GNP.Economic growth was slower in 2001 due touncertainties emerging from the US slowdown and thefoot and mouth outbreak. Real GDP growth is currentlyforecast to be below 7% in 2002.
Changes in the Property Market StructureThe Dublin industrial market continues to reap therewards of a buoyant economy with good levels ofactivity during the first six months of this year.
Modern prime industrial properties of up to 465 m2 insize are continuing to achieve rents in the range of £73to £94 per m2. The pace of rental inflation is largely afunction of supply with limited growth at the smallerend of the market where the strength of investorappetite for commercial property has resulted in amarked increase in availability of accommodation tolet.

King Sturge: Global Trends in Industrial Parks
Prime industrial buildings, which are in excess of 1,900m2 in size, are currently achieving rental levels in therange of £65 to £83 per m2. Capital values in the rangeof £861 to £1,184 per m2 are being achieved dependingon the location and specification of the individualproperties.
Infrastructure issues, labour shortages and wageinflation have traditionally had more of an effect on theindustrial market than other property sectors. A positivebudget and government strategy to ensure economicgrowth should sustain further growth in the industrialproperty market.
Transport & InfrastructureRosemount Business Park is located close toMulhuddart and 7 km from Dublin city centre. It isclose to the N3 motorway and approximately 2km fromthe M50 motorway.
The infrastructure in the area surrounding RosemountBusiness Park has improved significantly in recentyears. The completion of the slip roads on to the N3motorway has improved accessibility to nearby arterialroutes.
The airport is located approximately 5 km. to the north.
Description of Rosemount Business Park Rosemount Business Park comprises a modernindustrial development located in a newly developedcommercial area on the outskirts of greater Dublin.
Description of BuildingThe buildings comprise modern high bay facilitiessuitable for a variety of uses including warehousing /transport and storage. All buildings are finished withdouble skin metal deck roofs, eaves in excess of 6metres and concrete floors. Most of the unitsincorporate approximately twenty per cent officecontent, but this can vary – depending on individualrequirements.
The Occupiers Irish Express Cargo, House of Denmark, Canon andVariety Foods are just some of the forty currentoccupiers.
Units sizes range from 400 m2 and there are unitsavailable for immediate occupation.
Outlook Despite high, but falling, economic growth and stricterlending criteria, the industrial sector of the propertymarket is expected to grow in the forseeable future.However, the current market preference to purchasemay change and there may be a desire from occupiersto lease if interest rates rise.

King Sturge: Global Trends in Industrial Parks
22 23
Poland
Output for the EconomyPoland’s annualised GDP growth has been 5.4% paover the last seven years. Despite the global economicslowdown, GDP growth in Poland is forecast to grow atover 2.5% pa for the next few years. This economicperformance is creating increased demand for goodsand in turn greater demand for modern warehousing fordistribution purposes.
Changes in the Property Market StructureMost warehousing in Poland is of reinforced concreteand dates back to the 1960s and 1970s.
The first modern warehouse was constructed in 1994,but it was not until 1998 that there was significantconstruction activity. For this reason the volume ofmodern warehouse space is less than the amount onemight expect on a GDP per capita basis.
Most modern warehouses in Poland are in the WarsawRegion and serve the requirements of the city and thenational economy. They also serve the requirements ofinternational logistics operators as the Warsaw regionhas becomes a distribution centre for “east-west” traffic
between Germany and Russia and the countries of theformer Soviet Union.
Modern warehouse rents are stabilising, after falling forthe last few years, and are now at similar levels to theaverage prevailing in Western Europe.
Transport & InfrastructureMost distribution in Poland is by road, although thecountry’s road and motorway infrastructure is poor. Therailway infrastructure is extensive, but little used.
DIAMOND BUSINESS PARKLÓDZ
Lódz is located at the geographic centre of Polandabout 100km from Warsaw. The city, which has apopulation of 1 million, is at the crossroads of the mainnorth-south, east-west highway transit routes.
The Polish government has plans to build a number ofnew highways. The A-1, A-2 and A-8 are due to runthrough the city.
Lódz is also an important railway centre. There is aproposal to build a super-express train to Warsaw.

King Sturge: Global Trends in Industrial Parks
Description of Diamond Business Park LLódzz
Diamond Business Park Lódz has zoning for lightindustrial and storage purposes. It is situatedapproximately 6km east of the city centre and isconnected by Puszkina Street. The park is convenientlysituated for access to public transportation.
When completed Diamond Business Park Lódz willamount to 51,000 m2 of modern warehousing. The firsttwo phases comprise 20,000 m2 of space. Constructionof the next phase is due to start in 2002.
The warehouse units have minimum clear height of 8m.Floors are built to withstand 6 ton/m2 and have dustresistant finish. Bay depth is 96m and internal columngrid is 12m x 24m. The units can be configured depending on therequirement of tenants. For example, the number ofloading docks can be chosen by the tenant, as can thesize and layout of offices and cloakrooms. Some officesare located at the mezzanine level.
Warehouses and office accommodation is heated withgas fired boilers. Temperatures can be a minimum of6˚C in the warehouse accommodation and 18˚C in theoffice accommodation. Air conditioning in offices isoptional
The Developer/InvestorsAmerican International Group (AIG) and LincolnProperty Company (Lincoln) have partnered to developand invest in the real estate markets of Central andEastern Europe. AIG is a large US insurance companyand Lincoln is a leading international real estatecompany.
AIG/Lincoln purchased 117,630 m2 of land. The landwas acquired on a 99-year lease from the localauthorities at open public tender in 1998.
The Occupiers Phase 1 – was completed in 1999 and is a high baybuilding with total ground area of 9,368 m2. The logisticcompany Cargoline occupies 5,088 m2 of warehouse
and 393 m2 of office space. Pillsbury occupies 4,516 m2
of warehouse/light industrial and 361 m2 of officespace. Both companies have signed ten year leaseagreements from 1999.
Phase 2 – was completed in 2000 and is a high baybuilding with 9,216 m2 of ground area. 6,900 m2 hasbeen let to Polifarb Becker Debica.
Phase 3 – will comprise 10,000 m2 of space and isscheduled to be completed during 2002.
OZARÓW BUSINESS CENTRE,WARSAW
Ozarów Business Centre (OBC) is a warehouse parkdesigned to the highest international standards. It issituated 16 km to the west of Warsaw close to the mainE30 highway to Poznan and Berlin and twenty minutesto Warsaw International Airport.
The recently completed development comprises a totalof 36,220 m2 in four buildings. The clear height rangesfrom 8m to 10m allowing for storage with modernracking systems and fork lift trucks. Column spacing is

King Sturge: Global Trends in Industrial Parks
24 25
12m x 18m with base bay units of 650 m2. Otherfeatures include dust resistant floor finishes, loadingdocks with levelers and water protectors, and anautomatic water sprinkler system throughout.
Ozarów Business Centre was specifically designed tooffer customised class A offices adjacent to thewarehouse operation.
The Developer/InvestorsThis a development by CEIDCO a joint venturebetween leading Silicon Valley industrial developerTKG International and Heitman Financial Ltd. OBC isCEIDCO’s second warehouse park development in theWarsaw region. The company is regarded as a peioneerin the warehouse development market in Poland havingearlier completed the highly successful WarsawDistribution Centre, close to Warsaw InternationalAirport.
The OccupiersOver one third of OBC has already been let tocompanies including Pharmag, Bemis/MACtac,Cryovac, Lognet. The remaining space is expected to befully leased by the end of 2002.
Spain
COSLADA LOGISTIC PARK,CORREDOR DEL HENARES,MADRID
Output for the EconomyBetween 1995 and 2000, economic growth was onaverage 4.2% pa in Spain and 4.3% pa in Madrid,compared with 3.5% pa in the EU.
The economy of the Madrid region has been growing ata faster rate than most city regions in the EU.
Changes in the Property Market Structure Industrial Property in the Madrid Region is locatedaround the city. The south has historically been thelocation for heavy industry. The north and west havesome light industry, but have traditionally been non-industrial areas. The east has grown to become the mainlocation for transport, storage, distribution and logisticcompanies.
Around 70% of industrial property in the MadridRegion is located to the south and east of the city.

King Sturge: Global Trends in Industrial Parks
Transport & InfrastructureMadrid has the best road communications of any city inSpain This is because Madrid is located at thegeographic centre of the country. Highways radiatefrom the city in six directions. The N-I is the route toBurgos and Irún, while the N-II is the highway toBarcelona and La Junquera. The N-III is the road toValencia and the N-IV the way to Sevilla and Cádiz.The N-V is the direction to Badajoz and Lisboa and theN-VI goes to La Coruña. The city of Madrid has tworing roads. The M-30 circles the urban area and the M-40 runs around the limits of the municipal area.
Two further peripheral highways once completed willenable traffic to avoid going into Madrid. The M-45ring road will link the industrial areas of the MadridRegion and link the N-II with the N-V. The M-50, in ahorseshoe shape, will link these highways some 20kmto 30km from Madrid. Both highways will avoid theprotected area of El Monte del Pardo.
New toll-paying motorways, the R-2, R-3, R-4 and R-5are to be built. These toll-roads will run parallel to theN-II, N-III, N-IV and N-V highways.
Barajas International Airport is the fifth largest airportin Europe by passenger volume and the airport is thegateway to Europe from South America.
Madrid has a modern underground network, which hasbeen expanded over the last five years. It is to be furtherexpanded in order to reach many municipal areas to thesouth. Madrid has an extensive suburban train network.
There is a high-speed train from Madrid to Seville thathas been in operation since 1992. The distance betweenthe cities of 550km is covered in two hours fifteenminutes and the trains are punctual. The high-speedtrain network is to be extended with a line under-construction between Madrid and Barcelona. The linesfrom Madrid to Valencia and to Alicante are at thedesign phase. Lines to Lisboa, Bilbao and Galicia areunder study.
Description of Coslada Logistic ParkThe Coslada Logistic Park is located in El Corredor delHenares close to the N-II highway to Barcelona. It ishighly regarded due to its transportation links, itscloseness to Barajas international airport and thelocation of TIR customs in the area.
Coslada Logistic Park covers 1,000,000 m2 and hasexcellent infrastructure and services. The park isequipped for all activities relating to the transportationand distribution of goods.
The Park provides a number of services. There are tworepair shops for vehicles. Heavy vehicle parking coversan area of 34,000 m2 and petrol stations forecourtscover 12,000 m2. Retail buildings provide 47,000 m2 forshopping, other miscellaneous buildings provide250,000 m2 of space and there is a green area covering180,000 m2.
The Developer/InvestorsCoslada Logistic Pak was created as a result of acommercial union between the regional government ofthe Madrid Region, the Coslada Council and the Cajade Ahorros de Madrid (CajaMadrid).
Land was expropriated and the logistic park designed inthe 1990’s.
The 1990’s economic crisis delayed the development ofthe Coslada Logistic Park and it was not until 1998 and1999 that much of the development got under-way.

King Sturge: Global Trends in Industrial Parks
26 27
The Coslada Logistic Park is divided into two areas:Parque de Actividades Logísticas (PAL) and Centro deTransportes de Coslada. The first area arose from landsales and the second area grew from the granting ofland rights over a 49-year period.
The main developers at the Coslada Logistic Park areGrupo Riofica, JC 47 and Constructora Barral.
The Occupiers The most important companies located at CosladaLogistic Park are distribution and transportationcompanies. Occupiers include Danzas, Decoexa,Hamann, Azkar, Boyaca, ABX, Logiscic, UPS,Caterpillar and Geodis.
Coslada Logistic Park has full occupation at present.
United Kingdom
Output for the EconomyFollowing 3% economic growth in 2000, the UKeconomy continued to grow at 2-2.5% p.a. in 2001 butis dominated by the service sector, especially financialand business services which are growing faster than thenational average.
Changes in the Property Market StructureThe manufacturing economy now represents only 22%of the UK economy, while the service sector (66%) isprimarily creating demand for industrial space. Theconsolidation of logistics and locations is creatingstrong demand in South East England, the fastestgrowing area of the UK.
BICESTER DISTRIBUTION PARK,BICESTER, OXFORDSHIRE, UK
Transport & InfrastructureBicester is an expanding Oxfordshire town almostequidistant between London (50 miles) and

King Sturge: Global Trends in Industrial Parks
Birmingham (60 miles) in the M40 motorway corridor,completed around 1990. The motorway is accessiblevia junctions 9 and 10; the A34 at J.9 links with Oxfordand beyond to the M4 at J.13, and the A43 at J.10 linksto the M1 at J.16 to Northampton.
The Eastern Perimeter Road provides access to BicesterDistribution Park connecting with the A41 to J.9 of theM40 (3 miles).
The town has two rail links. The London (Marylebone)to Birmingham (Snow Hill) railway line was run-downin British Rail days before privatisation in the mid-1990s. However, Chiltern Trains, which has recentlybeen awarded a government longer-term franchise, hastransformed the quality and frequency of services fromBicester North station.
The second is the Oxford to Bletchley line, which iscurrently little used. There is an irregular ThamesTrains’ passenger services to Oxford from BicesterTown station. However, the route is being revitalised asa cross-country passenger and freight route betweenEast Anglia, Cambridge, Milton Keynes, Oxford andDidcot, including the “high-technology crescent” fromOxford to Cambridge.
This ambitious scheme by the East West Railconsortium includes Local Governments, Railtrack,Regional Development Agencies and the relevantGovernment Offices.
Skanska Construction is the preferred bidder to developthe £200 million, 15-mile “missing link” betweenBedford and Cambridge. Between Bedford and Oxford,the existing track will need up-grading.
The scheme aims to provide a quality, rapid direct inter-urban passenger link, avoiding changing stations andtrains in London, from 2006.
Freight services, especially from the East Coast portsand Southampton on the South Coast, will also bepromoted to avoid wasted mileage via the existing
congested routes through London. BicesterDistribution Park is adjacent to this line and hasplanning consent for a rail freight connection.
Description of Bicester Distribution ParkPreviously farmland free of contamination, it waspurchased for around £750,000 per hectare in 1989 withoutline planning consent for about 65,000 m2 of ClassB1/2 (industrial) and B8 (storage/warehouse) planninguses.
The Developer/InvestorsThe scheme was initially developed by The BicesterPark Development Company Ltd. The shareholderswere London & Metropolitan plc and Bank of Scotland.
Individual phases were subsequently sold freehold,subject to lettings of Phase 1, to Argent (now Hermes)and Phase 3 to the BICC Pension Fund. The balance ofthe Park was then sold to Laing Property who recentlyintroduced speculative construction.
The Occupiers Phase 1 – is occupied by Tibbett & Britten for MarsUK. It is a High Bay Distribution Centre – 220,000 ft2
(20,440 m2). The site of 4.45 hectares was bought for apurpose-built centre in 1994 for completion in 1995.
Argent then bought a sale-and-leaseback at a figureclose to £14 million. The current rent is about £52 perm2 on a 25 year lease with 5 year reviews, but no breakclauses. Argent then sold the development to BritishTelecom Pension Scheme (Hermes) in 1997.

King Sturge: Global Trends in Industrial Parks
28 29
Phase 2 – is occupied by Bibby Distribution forBudweiser as a Chilled High Bay Distribution Centreof 92,000 ft2 (8,547 m2), prelet in 1997 and forward-funded at about £7 million by London & Metropolitanplc.
Phase 3 – is occupied by Aura Books as a High BayDistribution Centre of 67,800 ft2 (6,299 m2) on 4.6 acres(1.9 hectares). It was pre-leased at £60 per m2 for 15years with 5 year rent reviews. Prudential AssuranceCo. Ltd. forward-funded the development at the end of1998 at a price of £4.4 million with a yield of 9.5%.
Phase 4 – In early 2002 there was available for designand build occupier with planning uses Class B1, B2 andB8 from 10,000 ft2 (929 m2) to 160,000 ft2 (14,864 m2).Leasehold or freehold packages will be considered.
Phase 5 – is the only speculative development. Unitsrange from 12,500 ft2 (1,161 m2) to 37,775 ft2
(3,509 m2), offer immediate occupation. AtlasHydraulic Loaders Ltd pre-leased the adjacent 15,000 ft2 (1,394 m2) at a base rent of £71 per m2, withcompletion November 2000.
A bespoke warehouse has been let to Fresh Direct UKof 31,657 ft2 (2,914 m2) on 0.8 of a hectare, withcompletion in May 2001. The rent equals £80 per m2.The remaining site available can provide a bespoke unitof 30,000 ft2 (2,787 m2) approximately.
The outlook suggests that economic growth in S.EEngland will cause rental values to increase further.
WESTERN APPROACHDISTRIBUTION PARK, BRISTOL, UK
Transport & InfrastructureWestern Approach is situated in a prime Severnsidelocation offering land and sea links. The area benefitsfrom the substantial investment in the transportinfrastructure in recent years.
Prominently situated alongside the M49, the short spurmotorway linking the M4 (east/west route) and M5(north/south route). Access is provided via A403 tojunctions on the M5 and M48. A junction on the M49 isproposed at a later date.
The opening of the M49 and the Second SevernCrossing to Wales (M4) in 1996 has vastly improvedthe road accessibility between the South West andWales.
The overall complex has a rail connection off theSevern Beach branch line. Further south, the existingfreight railway line between Avonmouth and the mainline at Bristol Parkway has already been upgraded inanticipation of traffic growth.
This improved link serves the developing Cabot ParkInternational Rail Freight Terminal, which is a shortdistance away, adjoining Avonmouth Docks.

King Sturge: Global Trends in Industrial Parks
The Terminal is a joint venture between the developersof the adjoining Cabot Park, another majordevelopment scheme, and the Bristol Port Company.The multi-modal, open access facility offers bothnational and international destinations.
The Severn Beach line provides a local passenger railservice to Avonmouth and the City Centre.
Plans for a light transit system in the Bristol area havecaused much discussion. A comprehensive schemeincluded the conversion of this local line, though a lessambitious provision to Bradley Stoke and Almondsburyis being progressed.
The Avonmouth and adjoining Royal Portbury Docksoffer a range of marine operations from traditionalloading to roll-on/roll-off facilities. The latter dockshave seen much development in recent years.
Bristol International Airport is south of the city centre.
Description of Western ApproachPreviously part of the ICI complex at Severnsidetotalling 1,500 acres (610 ha), originally earmarked fora manufacturing facility.
The Distribution Park on 216 acres (87.4 ha) wasgranted outline planning consent for class B8distribution floorspace of 2.35 million ft2 (218,315 m2).
The Developer/InvestorsThe Estates Company of ICI undertook the initialdevelopment including planning and infrastructurework in the mid/late 1990’s. Construction of a numberof substantial bespoke distribution centres then tookplace as described in Phases 1 to 4.
Subsequently, the site was sold to the Welsh-basedresidential and commercial property developers,Redrow. The next phase offers a number of servicedplots aimed at users of large buildings.
The current owners are contemplating construction of
speculative units, which will be a first for this scheme.To date, all units have been on a design and build basisproviding over 850,000 ft2 (about 79,000 m2) of high-bay accommodation.
The Occupiers Phase 1 - Great Mills – (now Focus)246,696 ft2 (22,919 m2) - national Distribution Centrefor the DIY specialist. First building on site, completedin summer 1997, leased to RMC Retail & MerchantingLtd., for 25 years with 5 year rent reviews at £4.96 perft2 (£53.39 per m2).
General Accident bought the investment for over £16million representing a yield of 7.5%.
Phase 2 - Matthew Clark Plc – national distributioncentre of 312,000 ft2 (28,985 m2) on 17.5 acres (7.08 ha)for this drinks manufacturer. Completed in 1998 and letat £4.96 per ft2 (£53.39 m2) on a 25 year lease with 5year reviews and a 20 year break provision.
Sale and leaseback deal with Great Portland Estates forover £20 million representing a yield of 7.5%.Investment subsequently sold on to Reif.
Phase 3 – MFI – regional delivery centre of 64,000 ft2
(5,945 m2) on 4.15 acres (1.6 ha) completed in 1999.
Topland Group then completed a sale and leaseback ata figure close to £5 million representing a yield of7.5%. A 25 year lease with 5 year rent reviews wasgranted at a rent of £5.85 per ft2 (£62.97 per m2.

King Sturge: Global Trends in Industrial Parks
30 31
Phase 4 - Royal Mail Streamline – purchased a site of11.2 acres (4.53 ha) for a bespoke distribution centre of160,000 ft2 (14.864 m2), which was completed in 1999.
Phase 5 – the latest phase is with high street clothingretailer, Next Plc. The regional distribution centre willprovide 70,000 ft2 (6,503 m2) on 5 acres (2.02 ha) withcompletion in 2002.
Forward-funded on a 25 year lease with 5 year rentreviews at an undisclosed rent.
PREMIER PARK , PARK ROYALGREATER LONDON UK
Transport & InfrastructurePremier Park is strategically located just inside theNorth Circular Road (A406) off Abbey Road in NorthWest London. Dual-carriageway access is available toCentral London (7 miles) via the A40 Western Avenue.
Prior to the opening of the short extension of AbbeyRoad to the North Circular Road, the site suffered fromrestricted access.
The new section has radically improved roadaccessibility and transformed the desirability of thisPark.
The A406 also links with the start of the M1 at StaplesCorner. The A40 Western Avenue becomes the M40near its junction with the M25 orbital motorway on thewestern fringe of Greater London.
The site is bounded by the Grand Union Canal on itssouthern flank with Railtrack’s West Coast main line tothe north. Neither mode of transport is directly used bythe occupiers on the Park.
For intermodal traffic, the nearby Euroterminal atWillesden offers direct rail freight services via theChannel Tunnel to the mainland.
Rail passenger services, principally LondonUnderground tube services (Central, Piccadilly andBakerloo lines), are available at a number of stations,mainly just outside the Park Royal area.
A network of local bus routes however links Park Royalwith these stations and neighbouring commercial andresidential areas.
Description of Premier ParkCreated by the phased redevelopment of the productionfacility of H J Heinz, one of the first major companiesto establish themselves in the Park Royal area in the1920’s.
Park Royal is one of the largest industrial areas inEurope. The name derives from earlier abortiveattempts to use the area as a permanent site for theRoyal Agricultural Show.
The Developer/InvestorsKingspark Developments were the initial developers,subsequently joined by AMP Asset Management. Theyprovided Heinz with a bespoke warehouse, pre-let unitsto Exel and Cearns & Brown and built high-bayspeculative warehouses.

King Sturge: Global Trends in Industrial Parks
The Park is now owned by a partnership betweenBrixton plc and Henderson Global Investors on behalfof Pearl Assurance.
The Occupiers
Phase One Heinz warehouse – the first and largest building to dateamounts to 170,000 ft2 (15,793 m2) providing high-baywarehousing. When constructed, these premises werealongside the remaining section of the company’sproduction plant.
UNIT A – 40,000 ft2 (3,716 m2) - Let to Exel Ltd. andoccupied by Exel Logistics and Pickfords.
UNIT B – 55,000 ft2 (5,110 m2) – Let to Deluxe VideoServices.
UNIT C – 60,000 ft2 (5,574 m2) – Let to SurridgeDawson (magazine and newspaper wholesalers).
UNIT D – 110,000 ft2 (10,219 m2) – the second largestbuilding, let to Cearns & Brown (part of Brake Bros. –catering suppliers).
UNIT E – 45,000 ft2 (4,181 m2) – Let to Ted Baker(fashion retailers and wholesalers).
Note: All floor areas are rounded and approximate.
Terms – All Phase One leases date from the late 1990’sfor between 15 years and 25 years with five year rentreviews. Rents range from just under £5.50 per ft2
(£59.20 per m2) to just over £8.00 per sq.ft (86.11 per m2).
Phase Two - The redevelopment of the last section ofthe Heinz production complex, now a cleared site,offers design and build opportunities on 16.9 acres(6.64 hectares).
Either a single ultra-large building of 380,000 ft2
(35,310 m2) can be provided (an unusual opportunity so
close to the heart of the Capital) or two buildingstotalling 395,000 ft2 (36,696 m2) capable of sub-division into a maximum of five units ranging in sizefrom 75,000 ft2 (6,968 m2) to 230,000 ft2 (21,367 m2).
TRAFFORD PARK, MANCHESTER, UK
Transport & InfrastructureAlmost 50 miles inland, the catalyst for thisdevelopment was the construction of the ManchesterShip Canal. Opened in 1895 to accommodate ocean-going ships to/from the River Mersey estuary, itavoided use of Liverpool Docks with its high charges.
Within the Park is the principal intermodal EuropeanRailfreight terminal for the North West region offeringdirect services, via the Channel Tunnel, to mainlandEurope. There are also private sidings.
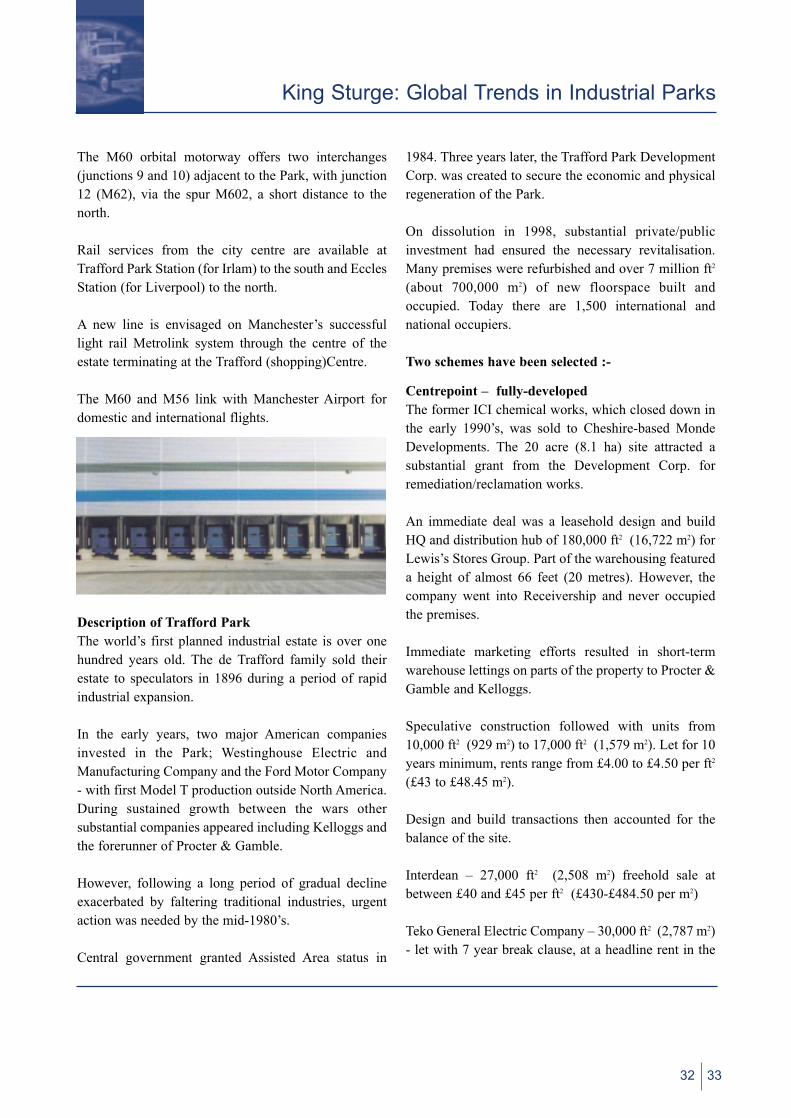
King Sturge: Global Trends in Industrial Parks
32 33
The M60 orbital motorway offers two interchanges(junctions 9 and 10) adjacent to the Park, with junction12 (M62), via the spur M602, a short distance to thenorth.
Rail services from the city centre are available atTrafford Park Station (for Irlam) to the south and EcclesStation (for Liverpool) to the north.
A new line is envisaged on Manchester’s successfullight rail Metrolink system through the centre of theestate terminating at the Trafford (shopping)Centre.
The M60 and M56 link with Manchester Airport fordomestic and international flights.
Description of Trafford Park The world’s first planned industrial estate is over onehundred years old. The de Trafford family sold theirestate to speculators in 1896 during a period of rapidindustrial expansion.
In the early years, two major American companiesinvested in the Park; Westinghouse Electric andManufacturing Company and the Ford Motor Company- with first Model T production outside North America.During sustained growth between the wars othersubstantial companies appeared including Kelloggs andthe forerunner of Procter & Gamble.
However, following a long period of gradual declineexacerbated by faltering traditional industries, urgentaction was needed by the mid-1980’s.
Central government granted Assisted Area status in
1984. Three years later, the Trafford Park DevelopmentCorp. was created to secure the economic and physicalregeneration of the Park.
On dissolution in 1998, substantial private/publicinvestment had ensured the necessary revitalisation.Many premises were refurbished and over 7 million ft2
(about 700,000 m2) of new floorspace built andoccupied. Today there are 1,500 international andnational occupiers.
Two schemes have been selected :-
Centrepoint – fully-developed The former ICI chemical works, which closed down inthe early 1990’s, was sold to Cheshire-based MondeDevelopments. The 20 acre (8.1 ha) site attracted asubstantial grant from the Development Corp. forremediation/reclamation works.
An immediate deal was a leasehold design and buildHQ and distribution hub of 180,000 ft2 (16,722 m2) forLewis’s Stores Group. Part of the warehousing featureda height of almost 66 feet (20 metres). However, thecompany went into Receivership and never occupiedthe premises.
Immediate marketing efforts resulted in short-termwarehouse lettings on parts of the property to Procter &Gamble and Kelloggs.
Speculative construction followed with units from10,000 ft2 (929 m2) to 17,000 ft2 (1,579 m2). Let for 10years minimum, rents range from £4.00 to £4.50 per ft2
(£43 to £48.45 m2).
Design and build transactions then accounted for thebalance of the site.
Interdean – 27,000 ft2 (2,508 m2) freehold sale atbetween £40 and £45 per ft2 (£430-£484.50 per m2)
Teko General Electric Company – 30,000 ft2 (2,787 m2)- let with 7 year break clause, at a headline rent in the

King Sturge: Global Trends in Industrial Parks
range noted above. The first Taiwanese company tolocate on Trafford Park , the ability to expand by 100%was an immediate stipulation and typical of inwardinvestors.
Belamy’s Bakers – 40,000 ft2 (3,716 m2) - let at about£4.50 per ft2 (£48.45 m2).
The last unit, reflecting the typical size range on thescheme, of 25,000 ft2 (2,323 m2) was another leaseholddesign and build property constructed in 1997 forBridisco.
Electric Park – new developmentWestinghouse RoadSituated alongside the World Freight Centre (the largestroad/rail freight terminal outside London), the 46 acre(18.6 ha) site, with the semi-derelict GEC factory, wasbought by Gazeley Properties and Trafford Park Estatesin 1997.
In late 1998, Green Property acquired Trafford ParkEstates and bought out Gazeley’s interest in the site.
The following year investment in site remediation andinfrastructure created a masterplan able to accommodateboth purpose-built and speculative premises.
With outline planning consent, bespoke industrial anddistribution units are offered from 75,000 ft2 (6,968 m2)in the overall total of 875,000 ft2 (81,288 m2).
In 2000, construction works got underway on Unit E, aspeculative high-bay building of 93,911 ft2 (8,724 m2),including offices of 5,776 ft2 (537 m2).
Immediate occupation is available on a 15-year lease at£4.75 per ft2 (£51.13 m2).
Four other large buildings are planned as the developerseeks to accommodate users with substantial floorspacerequirements. A major occupier is currently seriouslylooking at a high-bay distribution depot in excess of300,000 ft2 (27,870 m2)).
As evidenced by these and other schemes, TraffordPark has re-established itself as a prime industrial/warehouse location. Headline rents for medium-sizedunits are now about £5.25 per ft2 (£56.51 per m2).
NEWHOUSE FARM ESTATE,CHEPSTOW, WALES, UK
Transport & InfrastructureThis prominent development is located a short distancefrom the bridge over the River Severn, accessed by themotorway junction for Chepstow. Originally junction22 of the M4, with the opening of the privately fundedSecond Severn Crossing in 1996, it became junction 2of the M48.
The major interchange between the M4 (east/west axis)and M5 (north/south axis) is 6 miles to the east (via theM48/M4) on the English side of the crossing.
Though the estate can no longer claim to be alongsidethe principal traffic flow in and out of South Wales, theadditional crossing of the Severn estuary has relievedcongestion on the original bridge.
The estate remains the only sizeable scheme by theWest Bank of the river, with other estates being furtherinto South Wales.
The Severn Crossings are two of the few that aresubject to toll charges in Great Britain. Payment ismade by westbound traffic only entering Wales. Formost goods vehicles, the charge is currently £13.30.

King Sturge: Global Trends in Industrial Parks
34 35
There are no existing rail freight facilities on the estate.However, the cross-country South Wales to WestMidlands railway line is alongside the southernboundary offering a possible rail link for someoccupiers of adjacent buildings.
Two railfreight terminals are within easy reach. Acrossthe Severn, Cabot Park Rail International FreightTerminal in Avonmouth and Wentloog, east of Cardiff.The latter adjoins Railtrack’s London-South Walesmain line and is now the principal Welsh road/railintermodal facility.
An irregular passenger service between Cardiff andGloucester/Birmingham is available at Chepstow RailStation about 2.5 miles to the north.
Sea links are available at Newport, Cardiff and BristolDocks.
At Cardiff, Associated British Ports opened a new £2.5million Distribution Terminal in 2001. A similar sum isdedicated to expanding the cold store facilities.Newport Docks is set to receive £2 million ofinvestment.
The nearest commercial airports are CardiffInternational, to the west of the Welsh Capital, andBristol International to the south of the City.
Description of Newhouse Farm Estate
This well-established estate, which is a familiarlandmark by the Severn Bridge, has been developedover the last two decades. Over 1,000,000 ft2
(92,900 m2 plus) having been built, excluding the Phase2 floorspace.
The estate includes multi-unit speculative schemes,Severn Link Distribution Centre and Severn CrossDistribution Park, and major bespoke distributioncentres.
Apart from the latest Asda transaction, most of therecent activity centres on transactions in the second-hand market, principally due to the demands in the fast-moving world of distribution logistics.
The Developer/InvestorsEast Mon Industrial Holdings Ltd was the principalowner with various plots of land sold off fordevelopment. Today the developed area is in variousownerships, including financial and other institutions.
The company has invested substantial expenditure inproviding the infrastructure for the Phase 2 land, calledNewhouse Park, including a new section of roadcreating a circular route around the estate.

King Sturge: Global Trends in Industrial Parks
Three freehold serviced plots are available for theconstruction of bespoke buildings:-
Plot 1 - 7.49 acres (3.03 ha)Plot 2 - 8.75 acres (3.54 ha)Plot 3 - 9.04 acres (3.66 ha)
OccupiersRetailers and third-party logistic operators featurestrongly in the larger buildings.
In 1998, supermarket chain, Asda, leased “WesternLinks” Nestle’s former depot of 205,183 ft2 (19,062 m2)at the entrance to the estate. A new ten-year term fromPDFM, with break clauses, was taken at a rent of £3.75per ft2 (£40.41 m2).
In the same year, Sheddick Transport, a subsidiary ofthe French group, Norbert Dentressangle, took fourunits totalling 95,000 ft2 (8,825 m2) on the Severn CrossDistribution Park. The facility was needed for adistribution contract with Newport-based manufacturer,AES. This substantial transaction concluded the lettingof this scheme totalling 140,000 ft2 (13,006 m2).
Due to reorganisation of their distribution network,retailers, Littlewoods relocated from the estate to alarger purpose-built central hub at Burton-on-Trent inthe West Midlands. Sheddick Transport subsequentlyleased this building of 151,500 ft2 (14,074 m2).
Asda significantly expanded its presence on the estatein 1999 by purchasing land on Phase 2, opposite itsexisting facility, and constructing a distribution centreof 308,000 ft2 (28,613 m2).
Asda is represented by over half million ft2
(46,450 m2 plus), while Tesco also has a substantialinvolvement. Their Chepstow Distribution Centre of290,000 ft2 (26,941 m2) is complemented by a separatefacility of Christian Salvesen.
Their 73,000 ft2 (6,782 m2) bespoke unit, which isleased from Shell Pensions Trust, provides the UK’sleading retailer with recycling and traywash services.
The largest available second-hand unit is the 151,500 ft2
(14,074 m2) building at the entrance to the estate.Sheddick Transport has vacated the premises.
EUROCENTRAL, MOSSEND,LANARKSHIRE, SCOTLAND, UK
Transport & InfrastructureEuroCentral at Mossend is situated east of Glasgow,adjacent to the A8/M8 with a dedicated interchange.This is Scotland’s principal east/west artery serving theCentral Belt between Glasgow (15 miles) andEdinburgh (30 miles).
It is about three miles east of junction 8 of the M8 linkwith the M73, which connects with the north/southM74. This motorway forms part of the principal Anglo-Scottish route joining the English motorway system atCarlisle (M6).
Bellshill Rail Station is about 2.5 miles offering regularlocal cross-Glasgow services and stopping trains toEdinburgh.
Both Glasgow and Edinburgh Airports are within 30minutes drive. The principal air freight terminal atPrestwick is within a hour’s drive.
The Park features Scotland’s only European intermodalrail freight terminal with domestic and direct services

King Sturge: Global Trends in Industrial Parks
36 37
via the Channel Tunnel, provided by the largest railfreight operator, English Welsh & Scottish Railway.
Safeway Supermarkets uses EWS intermodal servicesto distribute products to stores in the North of Scotland.Its regional distribution centre of 535,000 ft2
(49,702 m2) is situated at adjoining Bellshill.
Providing efficiency and environmental benefits, theoperation avoids trucks using the A9 road, with itssummer tourist traffic and poor winter weatherconditions.
Description of EuroCentralOne of Scotland’s largest developments, this schemetotals 650 acres (263 hectares) offering fast track designand build facilities. Serviced sites from 10 acres (4.05ha) are also offered. In addition, substantial speculativedevelopment has been undertaken recently wideningthe appeal of the Park.
To date, about 1,600,000 ft2 (148,640 m2) has beenaccommodated comprising warehousing/distribution,manufacturing and call centre uses.
The Developer/InvestorsOriginally a joint venture between Amec Developmentsand Lanarkshire Development Agency, the Royal Bankof Scotland subsequently also became involved. It isnow known as Eurocentral Partnership Limited.
Much of the Park is within the Lanarkshire EnterpriseZone offering various benefits including exemptionfrom local authority business rates for up to ten years,100% capital tax allowances and simplified planningprocedures.
This central government initiative has a lifespan of tenyears which, in this case, will expire in early 2003.
The Occupiers Auto Trax – a joint venture between RailfeightDistribution and logistics specialists, Tibbet & Britten -22 acres (8.9 ha) – for a rail-connected terminal for
transporting new cars to the mainland via the ChannelTunnel.
TDG Logistics – 300,000 ft2 (27,870 m2) – rail-connected warehouse.
Securior Omega Express – 81,500 ft2 (7,571 m2) highsecurity warehouse for airfreight forwarding taken on a25 year lease in 1996. In addition, workshop facilitiesare provided for Securior Group vehicles.
In 1997, Headlam plc, floorcovering distributors tooka high-bay warehouse of 40,000 ft2 (3,716 m2) toreplace their fire-damaged Scottish HQ.
Scottish Power has a distribution depot of 138,000 ft2
(12,820 m2) at a rent of about £4.50 per ft2
(£48.44 per m2). Relocated from Moodiesburn to benearer to Glasgow, it supplies their retail networkthroughout Scotland and home deliveries within theCentral Belt. A call centre provides support for theservicing and repair operation.
Chungwa Picture Tubes (UK) Ltd – 625,000 ft2
(58,063 m2) facility is a major overseas investmentwhich became operational in August 1997.
Lite-On Technology’s production facility of 130,702 ft2 (12,143 m2) was completed in 1998, thoughclosed two years later, due to the downturn in the FarEast economy, when production reverted to Taiwan.The building was then let to National Cash Registersfor ten years at a rent of £5.50 per ft2 (£59.20 m2).
In the same year, APC - Allied Precision Co. took alarger facility of 204,000 ft2 (18,952 m2).
TDG expanded its operation in 2000 with an additional70,000 ft2 of warehousing.
The first speculative building was also constructed in2000. “Colossus”, a 94,000 ft2 (8,733 m2) facility waslet, prior to completion, for 15 years at about £5 per ft2
(£46.45 per m2).

King Sturge: Global Trends in Industrial Parks
The tenant, P & O Trans European, are third partylogistics operators for the supermarket chain,Sainsbury’s.
Further speculative construction will provide 165,000 ft2 (15,329 m2) in high-bay buildings of 94,000 ft2 (8,733 m2) “Colossus II” and 71,000 ft2
(6,596 m2) “Artemis”. The latter will have scope for50% expansion.
To let or for sale, the scheme has EZ benefits, and thelarger building has been completed. Artemis will becompleted in 2002.
A range of sites is available for bespoke developmentsfrom 30,000 ft2 (2,787 m2) to 500,000 ft2 (46,450 m2).
North America
PARMA COMMERCE CENTER,CLEVELAND, OHIO
Output for the EconomyEconomic growth, as measured by growth in real GDPfor 1999 and 2000 was 4.2% and 5.0%, respectfully.Although the GDP accelerated to 2% in the first quarterof 2001, it then experienced a rapid deceleration of theeconomy. This is a direct result of financial marketsdeclining, deteriorating corporate profits and a severefall-out in the technology sector. Although a rebound isexpected, growth in 2001 was not as high as in the lasttwo previous years, especially after September 11th.
Changes in the Property Market StructureThe Greater Cleveland Industrial Market hashistorically been known as a diversified and durablegoods manufacturing area. At this time, following thenational trend, this market has restructured from heavymanufacturing towards distribution and services.Distribution and service enterprises now play asubstantial role in the absorption of new space,although the manufacturing sector continues to beimportant.
Greater Cleveland employs nearly one million people.The service sector represents circa 47% of the total,

King Sturge: Global Trends in Industrial Parks
38 39
which is an increase of approximately 12% over thepast ten years. This trend is likely to continue as morethan half of all new jobs created are within the servicesector.
Transport & InfrastructureCleveland is located along the south shores of LakeErie and accessibility has been one of its greateststrengths. Nearly half of the nations households,business establishments, and manufacturing plants arewithin 500 miles from Cleveland.
Cleveland is the northern hub of an extensive system ofinterstate highways and freeways. This system makesoverland trucking both efficient and affordable. ParmaCommerce Center is located within one mile of I-480, amajor East – West artery, allowing easy access to fourother major interstates (I-71, I-77, I-80 & I-90).
The nation’s two leading railroads, Norfolk andSouthern, as well as CSX Corporation, link the regionand move both raw materials and finished goodsthroughout the country’s largest concentration ofindustrial and consumer markets. Parma CommerceCenter is adjacent to and serviced by a CSX railroadspur.
Cleveland Hopkins International Airport is the focalpoint of air traffic in this region. This airport is serviced
by Continental Airlines (primary hub) as well asSouthwest, American, United and Delta. Plans havebeen announced to extend the airport’s runways to aninternational – service length. This expansion willsignificantly impact Cleveland’s ability to serviceglobal markets. Parma Commerce Center is locatedwithin five miles of Cleveland Hopkins InternationalAirport.
The Port of Cleveland, continues to play an importantrole in Cleveland’s economic growth. The Port’sprimary mission is sending and receiving cargo, mostlysteel and heavy machinery. The Port of Cleveland isutilised by more than 50 nations worldwide and itsannual tonnage has recently surpassed the one millionmark. Recent development has been focused towardstourism and entertainment. These developments includethe creation of North Coast Harbor, Rock-n-Roll Hallof Fame, Science Center and the new ClevelandBrowns football stadium.
Description of Parma Commerce CenterIn February of 1997, the community of Parma initiatedthe development of Parma Commerce Center, in aneffort to grow as well as diversify its tax base. Theentire 88 acres site was a wood. In August of 1999, theGeis Companies purchased the land for US$1,694,000.The zoning is industrial, primarily light manufacturingand distribution. The subject property is bordered byGeneral Motors Corporation, Shiloh Industries, TriadMetal Products and Ucar, formerly Union Carbide.
The Developer/InvestorsThe Geis Companies are the sole owner / developer ofParma Commerce Center. They are a premier developerand builder of industrial product throughout NorthernOhio. They successfully completed a 21⁄2 year duediligence process in order to obtain the appropriateapprovals and permits to break ground. This processincluded resolving EPA issues relating to Wetlands,Indiana Bat and Salamander studies / preservation aswell as archaeological concerns relating to Indian burialgrounds and artefacts. In late 1999, permits weregranted and the creation of new road and utilities

King Sturge: Global Trends in Industrial Parks
commenced. Their master plan included bothspeculative and build-to-suit construction.
The Occupiers Phase 1 – in late 1999, the Geis Companies erected twospeculative multi-tenant industrial buildings of 130,000and 120,000 ft2. Standard amenities include all standardmasonry construction, ESFR sprinkler system, 28 ftclear ceilings plus above standard truck docks andaccess. At this time, both buildings are 100% leased,achieving an average lease rate of US$5 ft2 forwarehouse and $10ft2 for office build-out, on a netbasis. Tenants are as follows:
Building I – 130,000 ft2
• Grabel Corporation – 54,000 ft2
• Cort Furniture – 42,000 ft2
• Universal Group – 14,000 ft2
• RHI Refactories – 20,000 ft2
Building II – 120,000 ft2
• Tyco – 25,000 ft2
• Cutler Hammer Division of Eaton Corporation –25,000 ft2
• Melon Tool – 25,000 ft2
• BF Goodrich – 45,000 ft2
Phase 2 – is occupied by FDC Machine. It is a 32,500ft2 “built-to-suit” industrial complex. The buildingfeatures 40 ft ceiling clearance and a 100-ton overheadcrane. FDC Machine repairs heavy equipment and
distributes large production presses. Phase 3 – is anapproximately 7,000 ft2 Daycare center and Montessorischool presently under construction. It is located at theentrance of the park and will be ready for occupancy byfall of 2001.Phase 4 – is a planned approximately 75,000 ft2
distribution center on 7.5 acres, which is a built-to-suitfor Albums, Inc. The physical structure shall be readyfor occupancy on or before March 1, 2002. Albums,Inc. committed to a fifteen-year initial lease term at acommencing lease rate of $6.75 per ft2, on a net basis.Phase 5 – is a planned 70,000 ft2 speculativedistribution complex by Geis Construction. Thephysical structure shall be divisible to units of 20,000ft2 and will be ready for occupancy by March of 2002.Phase 6 – there are approximately 37 acres currentlyavailable for development. This available land rangesfrom 2 acre to 20 acre sites. These sites are fullyimproved and have an asking price of $125,000 peracre, including assessments. The Geis Companieswould structure a transaction on either a leasehold orfreehold basis.
Current market conditions suggest that ParmaCommerce Center should be fully developed within thenext 12/18 months.
DOMINGUEZ TECHNOLOGY PARK,LOS ANGELES
Output for the EconomyThe economy of the greater Los Angeles area isgrowing slowly after seven years of astonishingexpansion. Although at the Federal level there arediscussions of tax reduction, they will have little impacton the industrial property market. State revenuesurpluses will be greatly reduced this year as the hightech sector slows and the cost of energy increases.Energy shortages are the crisis de jour, although in thelong term, the impact should be minimal. The slowingeconomy in California is being caused by problems inthe high tech sector.

King Sturge: Global Trends in Industrial Parks
40 41
Changes in the Property Market StructureThe estate companies continue to be the largestdevelopers of new speculative industrial space.
Boeing and other major corporate manufacturers’disposition of excess space have been the greatestsource of new industrial land available for purchase byoccupiers.
The prime source of leasing and sales has been logisticsand warehouse activities generated through both LosAngeles International Airport’s expansive airfreightactivities and the combined ports of Los Angeles andLong Beach ocean freight activities. As these freightservice companies consolidate their ocean and air
service units, larger, strategically located facilities arerequired.
Transport & InfrastructureThe transport infrastructure includes the combined LosAngeles/Long Beach Port Complex and Los AngelesInternational Airport’s huge airfreight hub. There is asignificant major highway / freeway system for accessto all of Southern California.
There are numerous fibre optic providers and thiscomplex has Foreign Trade Zone status.
Description of Dominguez Technology CenterDominguez Technology Center is a new 438-acredevelopment in a market area that has 200 million ft2 ofexisting industrial space.
The Developer/InvestorsThe two owners in this project are Watson LandCompany and The Carson Companies. They arehistorically dated to the original Spanish land grantfamily Dominguez. This is the last major landdevelopment site in the market area. The land has beenowned for approximately 225-years.
The Occupiers Major occupiers include the following companies.
Nakamichi USA Corporation occupies 93,850 ft2. Theunit is Nakamichi’s USA/Western Regional OfficeService and Distribution Headquarters. Triple net rentis US$0.47 ft2 per month.
New Age Electronics occupies 185,629 ft2. Thewarehouse and distribution facility utilises the Portfacility proximity. Triple net rent is US$0.60 ft2 permonth.
Hellman Worldwide Logistics occupies 110,567 ft2. Thecompany is a third party logistics provider. This facilityis dedicated primarily to the warehouse and distributionof Red Bull Energy Drink. Triple net rent is US$0.65ft2 per month.

King Sturge: Global Trends in Industrial Parks
USF Seiko Worldwide occupies 109,040 ft2. Thecompany is a third party logistics provider. Triple netrent is US$0.44 ft2 per month.
Circle International occupies 160,742 ft2. the companyis a third party logistics provider. Triple net rent isUS$0.51 ft2 per month.
Current new speculative inventory of major industrial /distribution facilities available in the broad marketplaceinclude the following sizes:
Size Owner670,292 ft2 ProLogis431,282 ft2 IDI254,560 ft2 Watson Land Company182,196 ft2 Watson Land Company177,372 ft2 ProLogis157,070 ft2 The Carson Companies145,000 ft2 Hewson Company101,076 ft2 ProLogis100,079 ft2 The Carson Companies
CENTERPOINT AT 8ASOUTH BRUNSWICK & MONROETOWNSHIP, NEW JERSEY
Output for the EconomyAfter nine years of economic expansion the USeconomy began to slow in 2000. While GDP growthwas 4.4% in 1998 and 4.2% in 1999, it was 2.2% in2000.
Unemployment in the US has begun to rise with anincrease in the rate in every month since January 2001which accelerrated after September 11th 2001.
Changes in the Property Market StructureThe New Jersey economy no longer relies on industrialmanufacturing and construction. Only 10% of thestate’s employment is in these two sectors. The majorityof employment, two-thirds in total is in the serviceindustry. Core industries within this sector aretechnology, healthcare and financial services.
New Jersey benefits from a concentration of corporate

King Sturge: Global Trends in Industrial Parks
42 43
headquarters, extensive transportation network, strongbusiness and labour demographics.
The New Jersey Industrial Market is one of the largestin the country with over one billion square feet ofspace.
The product type located within this area ranges from1,000,000 ft2 manufacturing and distribution facilitiesto small high-technology facilities with high ratios ofoffice finish.
Although there is a variation in product type in thismarket, much of the space is utilised for thewarehousing and distribution of goods throughout theNew York Metropolitan area as well as the EasternSeaboard. Recently, growth in the services sector hasresulted in greater requirement for light assembly, high-tech and flex space.
The Exit 8A industrial market began to flourish in themid-1980s, and by the end of 2000 possessedapproximately 37 million ft2 of industrial space. Thegrowth in this market can be attributed primarily to twofactors: the rise in land prices in Northern New Jersey,and the United States’ increasing dependence on theimportation of goods.
Exit 8A of the New Jersey Turnpike arose as an ideallocation for warehouse, distribution and lightmanufacturing operations due to its accessibility andflat, dry plots of land.
There is overnight highway access to one-third of thenation’s population and tenants benefit from thetremendous pool of labour residing within commutingdistance of exit 8A.
Transport & InfrastructureMuch of the industrial development in Northern andCentral New Jersey has occurred along the State’smajor transportation arteries, namely Interstate 80 andthe New Jersey Turnpike.
Exit 8A, primarily comprises of South Brunswick andMonroe Township, geographically resides in betweenPhiladelphia and New York City, as well as WashingtonD.C. and Boston. This market is also ideal because ofits close proximity to the international seaports of PortNewark and Port Elizabeth. These seaports are justthirty minutes away and the Philadelphia and SouthJersey docks are less than one hour away.
Newark International Airport is thirty minutes away.
Description of CenterPoint at 8ACenterPoint at 8A is a 500-acre master plannedbusiness park.
It is located within 5 miles of Exit 8A of the New JerseyTurnpike. Routes 1 and 130, I-195, 1-295 and I-287 arenearby.
CenterPoint at 8A consists of nineteen propertiestotalling 3,519,855 ft2. The properties range in size from65,277 ft2 to 323,282 ft2.
The buildings are mostly for warehousing, althoughsome are also for light industrial activities. The firstbuilding was constructed in 1978 and building hascontinued to the present day.
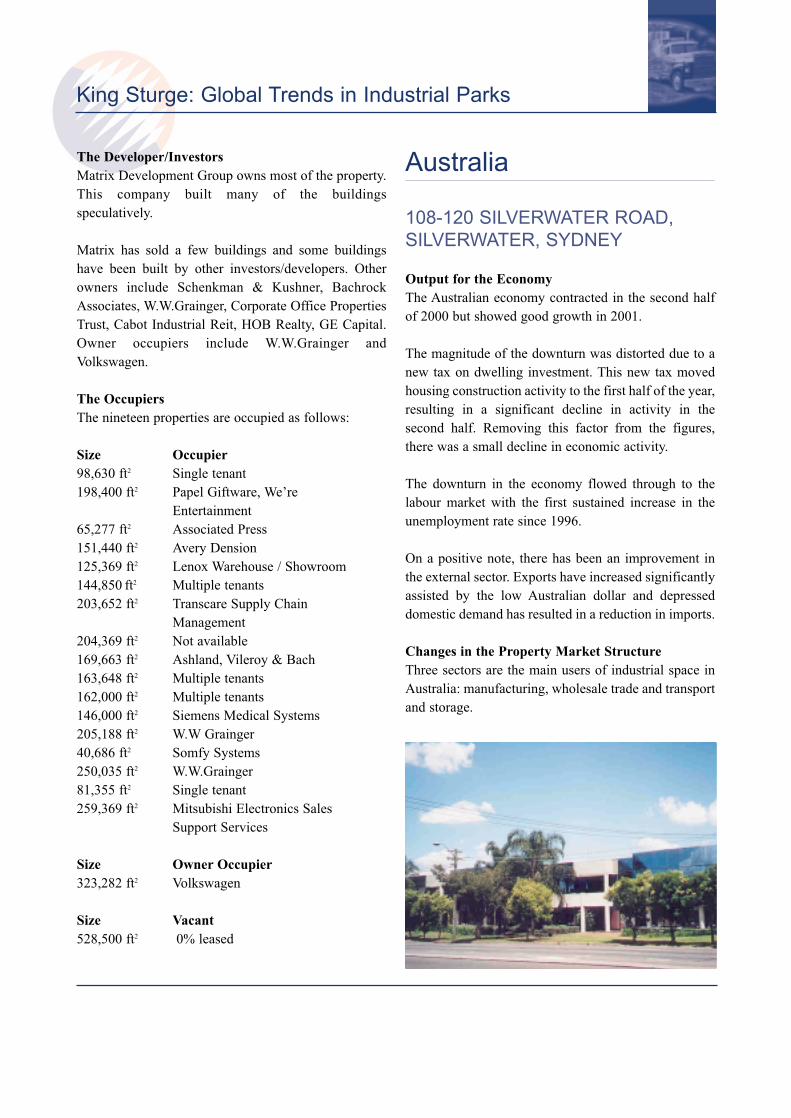
King Sturge: Global Trends in Industrial Parks
The Developer/InvestorsMatrix Development Group owns most of the property.This company built many of the buildingsspeculatively.
Matrix has sold a few buildings and some buildingshave been built by other investors/developers. Otherowners include Schenkman & Kushner, BachrockAssociates, W.W.Grainger, Corporate Office PropertiesTrust, Cabot Industrial Reit, HOB Realty, GE Capital.Owner occupiers include W.W.Grainger andVolkswagen.
The Occupiers The nineteen properties are occupied as follows:
Size Occupier98,630 ft2 Single tenant198,400 ft2 Papel Giftware, We’re
Entertainment65,277 ft2 Associated Press151,440 ft2 Avery Dension125,369 ft2 Lenox Warehouse / Showroom144,850 ft2 Multiple tenants203,652 ft2 Transcare Supply Chain
Management204,369 ft2 Not available169,663 ft2 Ashland, Vileroy & Bach163,648 ft2 Multiple tenants162,000 ft2 Multiple tenants146,000 ft2 Siemens Medical Systems205,188 ft2 W.W Grainger40,686 ft2 Somfy Systems250,035 ft2 W.W.Grainger81,355 ft2 Single tenant259,369 ft2 Mitsubishi Electronics Sales
Support Services
Size Owner Occupier323,282 ft2 Volkswagen
Size Vacant528,500 ft2 0% leased
Australia
108-120 SILVERWATER ROAD,SILVERWATER, SYDNEY
Output for the EconomyThe Australian economy contracted in the second halfof 2000 but showed good growth in 2001.
The magnitude of the downturn was distorted due to anew tax on dwelling investment. This new tax movedhousing construction activity to the first half of the year,resulting in a significant decline in activity in thesecond half. Removing this factor from the figures,there was a small decline in economic activity.
The downturn in the economy flowed through to thelabour market with the first sustained increase in theunemployment rate since 1996.
On a positive note, there has been an improvement inthe external sector. Exports have increased significantlyassisted by the low Australian dollar and depresseddomestic demand has resulted in a reduction in imports.
Changes in the Property Market StructureThree sectors are the main users of industrial space inAustralia: manufacturing, wholesale trade and transportand storage.

King Sturge: Global Trends in Industrial Parks
44 45
Manufacturing, while posting an improvedperformance during the 1990’s, has lagged behind thegeneral economy. There has been considerablerestructuring over the last 20 years following areduction of tariff barriers that have opened Australia’smarkets to greater competition. Those manufacturingcompanies that contain a high proportion of valueadded activities or have sourced new export marketshave fared best in the new environment.
In contrast, the wholesale trade and the transport andstorage sectors have achieved growth rates greater thanthe average. These sectors are more closely correlatedto the general economy and have benefited from aconsumer boom throughout the second half of the1990’s. Also, manufacturing companies areincreasingly outsourcing distribution and storageactivities.
Transport & InfrastructureGood access to the major transport routes both withinand out of the city are important factors for the locationof warehouses.
The introduction in Sydney of regulations regarding B-double articulated trucks (a prime mover towing twosemi-trailers) whereby these vehicles may only operateon routes gazetted for their use has advantaged someindustrial locations. These vehicles can be up to 25metres in length and can carry 50% more thanconventional semi-trailers with only a slight increase infuel costs.
Description of 108-120 Silverwater Road 108-120 Silverwater Road is serviced by SilverwaterRoad, a six-lane highway and the M4 WesternMotorway, a four-lane freeway.
The warehouses have nine metre wall heights thatgenerate sufficient internal space to allow multi-levelpalleting and stacking systems, plus internal firesprinkler systems. There is access and on sitemanoeuvring room for double articulated vehicles.
The Developer/Investors108-120 Silverwater Road was originally developed in1983. In March 2000, it was purchased for A$22m bythe current owner, Tyndall Meridian Trust.
Tyndall Meridian Trust is listed on the stock exchange.Major investors in the trust include: Royal & SunAlliance Equities Ltd, Centurian Investments P/L,Tyndall Life Insurance Company and Oceanic Life Ltd.
The Occupiers Unit 1 & 2 totalling 2,026 m2 of lettable area is let to theplastics distributor Cadillac Plastics Pacific Group P/L.
Unit 3 totalling 1,011 m2 is let to an importer /distributor of disabled equipment.
Unit 4, 1,010 m2, is vacant.
Unit 5 totalling 761 m2 is let to Sterling DiagnosticImaging with a sublease to the engineering company,Transfield.
Unit 6 & 7 totalling 3,210 m2 is let to the food andbeverage company, Liquorland (Australia) P/L.
Unit 7A totalling 1,304 m2 is let to the furniturewholesaler, Myers Warehouse Sales P/L.
Units 8 & 9, totalling 3,595 m2, is let to Chubb FireServices.

King Sturge: Global Trends in Industrial Parks
Units 10 & 11, 3,905 m2, is let to the engineer,Transfield P/L.
Unit 12, 1,289 m2, is let to the importer/ distributor ofmedical equipment, Edward Keller.
OutlookThere has been a rise in demand from thecommunications sector. This sector comprises postal,courier and telecommunication services.
Deregulation of Government utilities, such as Telstra,and the increased usage of computing andtelecommunications technology has increased demandfor buildings located out of the high-rent CBD for telcohotels and co-location facilities.
New technologies are also changing the way existingbusinesses undertake their activities.
China
BAOSHAN URBAN INDUSTRIALPARK, BAOSHAN, SHANGHAI
Output for the EconomyChina, the seventh largest economy in the world, sawGDP grow by 8.1% in the first quarter of 2001, butslowed later in the year. Important contributors to theperformance are production of PCs, mobilecommunication equipment, chemicals, coal,construction materials and automobiles.
Changes in the Property Market StructureChina’s real estate market is growing rapidly. In thefirst four months of 2001 investment in commercialproperty was US$12.7 billion, of which US$10 billionwas in China’s richer eastern regions.
Transport & InfrastructureBaoshan District is located at the northern end ofShanghai and is the largest district adjoining the city,covering an area of 415 km2.
North of Baoshan District lies the Yangtze River andnorth-east the Huang Pu River (that joins the YangtzeRiver). West is Jiading District, east is Yangpu District,north-east Pudong District and south Putuo, Zhabei andHongkou Districts.

King Sturge: Global Trends in Industrial Parks
46 47
Baoshan has traditionally been an area dedicated to theshipping industry, warehousing and distribution, andheavy industry including steel and chemicalsproduction.
Baoshan Urban Industrial Park lies to the south-west ofBaoshan District close to downtown Shanghai. Theindustrial park is close to the intersection of the OuterRing Road and the Hu Jia Expressway. The industrialpark is near to Hu-Ning, Hu-Jia, Hu-Hand expresswaysand 318, 312 national ways, which connect the mainroads of Shanghai and the neighbouring provinces.
Shanghai Hong Qiao International Airport is 9-minutesdrive away and Pu Dong International Airport is 30-minutes away. The area is becoming increasinglypopular for foreign investors.
Baoshan Urban Industrial Park is 10 km from ShanghaiRailway Station, 6 km from Shanghai West RailwayStation, 3 km from Taopu Freight Railway Station, and6 km from Shanghai North-Suburb Freight RailwayStation. Shanghai Wu Song Port is 15 km, andShanghai Express Passenger Transport Center Terminal(under-construction) is 14 km from the industrial park.
Completion of the Outer Ring Road, at the end of 2001,will greatly enhance the location, improving access toShanghai Port facilities, Pudong and to the westNanjing and Suzhou.
Description of Baoshan Urban Industrial ParkBaoshan Urban Industrial Park has a planned area of4.35 km2 and was approved by Shanghai MunicipalGovernment in November 1995 as the only municipallevel industrial park in Baoshan District.
The Park became operational in October 1998 withPhase 1 occupying 1.5 km2 and providing fullinfrastructure including optical cabling. Land UseRights are held on a 50-year term and are available forimmediate purchase at US$35 per m2.
The Developer/InvestorsThe Park is developed and administered by ShanghaiBaoshan District Government whose planning policyobjective is to push heavier industry beyond the OuterRing Road.
Government policy is to promote foreign investmentand concentrate it in certain industrial real estatemarkets in China. The government offers fast-trackbusiness registration and licensing procedures as wellas preferential tax policies in a number of developmentzones to make it easier and more beneficial for foreigncompanies to invest in China.
Most facilities within development zones are a “build tosuit” or a “design / build”. These facilities are builtspecifically to meet the requirements of the occupiersand are sold or rented to the occupier for a longer term.Most development zones offer acceptable quality“build to suit” programmes, but occupiers do have theoption of having a third party project management orconstruction team develop their facilities for them.Occupiers with high quality or hi-tech specificationsoften take this option.
Zones do not hold a large stock of buildings. Those theydo hold are usually for smaller requirements. Theygenerally build one or two speculative buildings at atime for smaller occupiers or as temporary facilities forcompanies who are having a factory built in the zone.These buildings are often multiple-storey and havevarious sized floorplates. Once a building is close tofull occupancy, a new one is erected to meet futuredemand.
The Occupiers Occupiers within the Park are manufacturingcompanies from Europe, East Asia, and mainlandChina.
Shanghai Welding Alloy Co., Ltd. – a UKmanufacturer invested US$6.06m in 2000 purchasing a6,600 m2 site and building a single-storey light steelstructure.
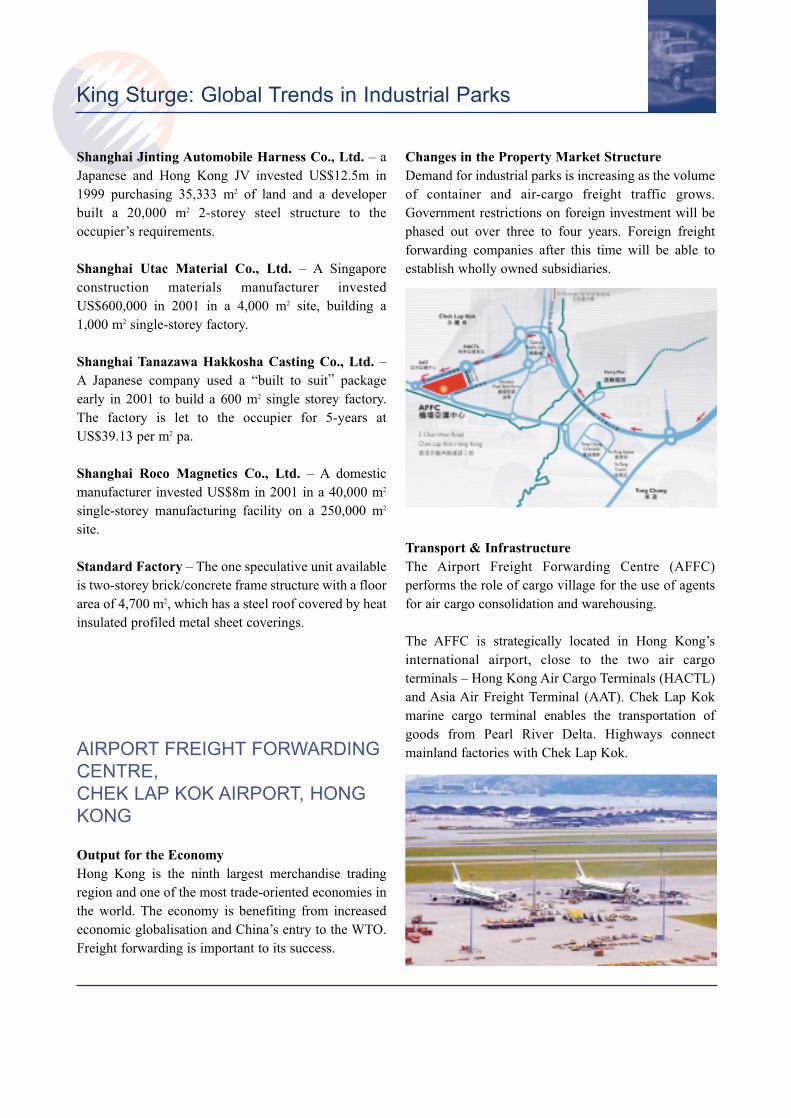
King Sturge: Global Trends in Industrial Parks
Shanghai Jinting Automobile Harness Co., Ltd. – aJapanese and Hong Kong JV invested US$12.5m in1999 purchasing 35,333 m2 of land and a developerbuilt a 20,000 m2 2-storey steel structure to theoccupier’s requirements.
Shanghai Utac Material Co., Ltd. – A Singaporeconstruction materials manufacturer investedUS$600,000 in 2001 in a 4,000 m2 site, building a 1,000 m2 single-storey factory.
Shanghai Tanazawa Hakkosha Casting Co., Ltd. –A Japanese company used a “built to suit” packageearly in 2001 to build a 600 m2 single storey factory.The factory is let to the occupier for 5-years atUS$39.13 per m2 pa.
Shanghai Roco Magnetics Co., Ltd. – A domesticmanufacturer invested US$8m in 2001 in a 40,000 m2
single-storey manufacturing facility on a 250,000 m2
site.
Standard Factory – The one speculative unit availableis two-storey brick/concrete frame structure with a floorarea of 4,700 m2, which has a steel roof covered by heatinsulated profiled metal sheet coverings.
AIRPORT FREIGHT FORWARDINGCENTRE, CHEK LAP KOK AIRPORT, HONGKONG
Output for the EconomyHong Kong is the ninth largest merchandise tradingregion and one of the most trade-oriented economies inthe world. The economy is benefiting from increasedeconomic globalisation and China’s entry to the WTO.Freight forwarding is important to its success.
Changes in the Property Market StructureDemand for industrial parks is increasing as the volumeof container and air-cargo freight traffic grows.Government restrictions on foreign investment will bephased out over three to four years. Foreign freightforwarding companies after this time will be able toestablish wholly owned subsidiaries.
Transport & InfrastructureThe Airport Freight Forwarding Centre (AFFC)performs the role of cargo village for the use of agentsfor air cargo consolidation and warehousing.
The AFFC is strategically located in Hong Kong’sinternational airport, close to the two air cargoterminals – Hong Kong Air Cargo Terminals (HACTL)and Asia Air Freight Terminal (AAT). Chek Lap Kokmarine cargo terminal enables the transportation ofgoods from Pearl River Delta. Highways connectmainland factories with Chek Lap Kok.

King Sturge: Global Trends in Industrial Parks
48 49
Description of Airport Freight Forwarding Centre(AFFC)AFFC opened in April 1998 and comprises 1.3m ft2
(125,000 m2) of cargo handling space and 175,000 ft2
(17,000 m2) of office space, and can satisfy all kinds ofair cargo consolidation and warehousing needs.
AFFC comprises a 3-storey warehouse, with 53independent freight stations on each floor, ranging from5,725 ft2 (550 m2) to 12,489 ft2 (1,200 m2). Warehouseceilings are 8m and units provide spacious loading baysequipped with sufficient lighting, power points, coatedfloors and built-in washrooms. At the top there are ninestoreys of grade “A” office space.
All floors are served by 3-lane ramps with ramp-sideemergency bays. The lanes are extra-wide, enabling 45-foot container trucks to directly access the variousfloors. The top floor provides adequate parking,including 273 spaces for cars, 25 spaces for containertrucks and 181 spaces for lorries. The Centre is well supported by a range of servicesincluding a bank, a convenience store and canteens forthe essential needs of tenants.
The AFFC provides an upgraded IT infrastructure andlogistics services to its tenants, in order to improve theire-business capability. Tenants are provided with value-added integrated supply-chain solutions to support theirsupply chain management requirements. Thissupplements other value-added services available, suchas cargo logistics services and consulting services.
The Developer/InvestorsAFFC was built for the Airport Authority at a cost ofHK$1.9 billion.
A consortium of companies owns AFFC, of which SunHung Kai Properties Ltd (SHK) owns 65%. SHKfinanced, designed, built and now operates the centre.The management company is Kai Shing ManagementServices Ltd.
The price of prime industrial properties range from
HK$750 to HK$1,700 per ft2. The price of ordinaryindustrial buildings is HK$500 per ft2 and forindustrial/office properties HK$1,250 per ft2. Primeindustrial yields range from 7% to 11%, while yields forsecondary properties are over 10%.
The OccupiersLease terms are flexible and rents are on a daily orweekly basis. Average prime industrial rents areHK$7.20 per ft2 per month, whilst rents for top tierindustrial/offices range from HK$14 to HK$17 per ft2
per month. Occupiers are:
· A Class CFS Centre Ltd · AGI Logistics (HK) Ltd· Air Sea Worldwide Logistics Ltd · Supreme Airfreight Co. Ltd· Fondair Express (HK) Ltd· BAX Global Ltd · Charter Victory Logistics Ltd · Combined Logistics (Hong Kong) Ltd · UTi (HK) Ltd· Danzas AEI (HK) Limited · Emery Air Freight Corporation · Exel Hong Kong Limited · Expeditors (HK) Ltd · Fairate Express Ltd · Fritz Air Freight (HK) Limited · GeoLogistics Ltd · Hong Kong Aircraft Engineering Co. Ltd· IEC Express (HK) Ltd · Jet Air (HK) Ltd · Jupiter Air (HK) Ltd · “K” Line Air Service (HK) Ltd · Kintetsu World Express (HK) Ltd · Morrison Express Co., Ltd · Multi-gold Air & Sea Express Ltd · Newport Express (HK) Ltd · Nippon Express (HK) Co Ltd · Nissin Transportation & Warehousing (HK) · NNR Aircargo Service (HK) Ltd· Republic Cargo Systems Ltd · Rical Warehouse · Sankyu Air (HK) Ltd · Scanwell Freight Express (HK) Ltd · Seino Air Goal Transportation Co. Ltd · Soonest Express (HK) Co. Ltd· Speedmark Transportation Ltd · Straight Air Service Ltd · TNT Express Worldwide (HK) Ltd · Trans-Am Air Freight (HK) Ltd · United Air Service (HK) Ltd · Yamato Transport (HK) Ltd · Yusen Air & Sea Service (HK) Ltd

King Sturge: Global Trends in Industrial Parks
TrendsGlobal trends are affecting the freight forwardingindustry. These trends include globalisation of thesupply-chain, mass customisation, shortening ofproduct lifecycles, low inventory, and quick responserequirements.
With these challenges, the trend for manufacturers is touse third-party logistic operations (3PLs) that providetransport, warehouse management, order fulfilment andinventory management services.
In February 2001, the Airport Authority of Hong Kongcommissioned the international consortium TradeportHong Kong Ltd to build and operate a logistic centre atthe airport next to AFFC. Tradeport HK is expected tobe completed in early 2003 and will be a purpose-built,dedicated, self-operated 3PL (third party logistics)Centre.
Indonesia
MM 2100 INDUSTRIAL TOWN,BEKASI, JAKARTA, WEST JAVA
Output for the EconomyThe Government of Indonesia agreed an economicrestructuring with the IMF in the summer of 2001.Economic growth for the year was over 2% sustainedby growth in exports and the stimulus from theprivatisation of state owned companies. Inflation iscirca 10%.
Indonesia’s main competitor for trade and inwardforeign investment is China.
Changes in the Property Market StructureThe supply of industrial property is expected to growless quickly over the next few years. The National LandOfficer (NLO) has issued fewer location permits,following the removal of national land right grants,subsequent to the abolishment of NLO regulation no.3/1999. The issuance of location permits by the NLOfell by 67% between 1997 and 1999.
Transport & InfrastructureMM 2100 Industrial Town is located in the province ofWest Java.
MM 2100 Industrial Town is approximately 32km from

King Sturge: Global Trends in Industrial Parks
50 51
Jakarta CBD. Tanjung Priok seaport is approximately30km and Soekarno-Hatta International Airport isapproximately 50km. The industrial town is easilyaccessed from the Jakarta-Cikampek toll road atCibitung gate.
The Jakarta Metropolitan Area includes the counties ofBekasi, DKI Jakarta, Tangerang, Karawang and Bogor,and the county neighbouring Bekasi is Purwakarta.Total available land with planning for industrial use inthese counties is 14,000 hectares. Of this, 7,222hectares have been developed.
In Bekasi county there is 3,631 hectares of availableland with planning for industrial use. Of this 2,479hectares have been developed. Bekasi is the secondmost industrialised county in the Jakarta MetropolitanArea after Karawang.
MM 2100 Industrial Town is located in the districts ofGandasari and Kecamatan Cibitung. These districtshave a high density of manufacturing industry andmiddle to low class housing.
Description of MM 2100 Industrial Town MM 2100 Industrial Town is situated on what waspreviously farmland and is therefore free ofcontamination.
Phase I of the industrial town comprises thedevelopment of 805 hectares. Of this area, 60% hasbeen allocated for industrial use and the balance forinfrastructure and facilities.
Work on Phase II began in early 2001 and this phasewill comprise a 200-hectare development.
Infrastructure consists of roads, electricity with totalcapacity of 350 MW, telephones with 8,000 lines, cleanwater with daily capacity of 72,000 m3, waste watertreatment with daily capacity of 64,800 m3 and a supplyof natural gas.
The Developer/InvestorsMM 2100 Industrial Town was originally developed byPT Bekasi Fajar Industrial Estate. The mainshareholders in this enterprise are Argo ManunggalGroup and Marubeni Corporation. Argo ManunggalGroup is one of the largest companies in Indonesia,with interests in manufacturing, agriculture and realestate. Marubeni Corporation is a large Japaneseinvestment company, which has operated in Indonesiafor many years.
PT Bekasi Fajar Industrial Estate acquired land for theindustrial town between 1990 and 1994 at pricesranging from Rp5,000 per m2 to Rp30,000 per m2. Thecompany developed the infrastructure and plots of landhave since been sold for between Rp550,000 per m2 andRp800,000 per m2 (exclusive of transaction costs andmaintenance charges).
The plots of land sold range in size from 10,000 m2 to100,000 m2. The plots have been acquired by industrialusers for owner occupation on 30-year terms(extendable for a further 40-years) with NLOpermission to build industrial property.
Occupiers pay maintenance fees of around US$0.06 perm2 per month of total land area. Wastewater treatmentfees are around US$0.55 per m3 and clean water fees arearound US$0.4 per m3.
Phase II will involve the selling of land for theconstruction of industrial property for owneroccupation and rental.
The Occupiers The largest occupier is LG Electronics. Other occupiersare AT&T, Asahi, Denso, Lucent Technology, Yamaha,Sony, Tancho and Marubeni Steel.

King Sturge: Global Trends in Industrial Parks
Malaysia
HICOM GLENMARIEINDUSTRIAL PARK, STATE OFSELANGOR, KUALA LUMPUR
Output for the EconomyWith the global economy slowing, the main impetus forgrowth in Malaysia is domestic demand. Demand hasbeen slowing for the export-oriented sectors of theeconomy, such as electronics.
Real output in the domestic economy grew by less than1% in 2001, compared with 8.5% in 2000. Despite thisslowdown, a high level of foreign investmentdemonstrates confidence in the political stability of thecountry.
Changes in the Property Market StructureThere are no legal restrictions on foreign investment inindustrial property and recently the government liftedrestrictions on foreign ownership of residential andcommercial property.
The government has reduced capital gains taxation ondisposal of property by foreigners. The maximum rateis 30%, declining to 20% after two years, to 15% afterthree years, to 10% after four years and falling to 5% ifthe property is sold after five years.
Transport & InfrastructureHicom Glenmarie Industrial Park is located in the Stateof Selangor, which is the most industrialised state ofMalaysia.
The industrial park is situated between the North-SouthHighway and the Federal Highway. The park is 6kilometres from Subang Airport and within easy accessof KL International Airport, North and West Seaportsand Kuala Lumpur City centre.
The industrial park is serviced with good publictransport, telecommunications and utilities (electricityand water). Recreational facilities in close proximityinclude Hicom Glenmarie Golf and Country Resort andthe Saujana Golf and Country Resort.
Description of Hicom Glenmarie Industrial ParkHicom Glenmarie Industrial Park is for non-pollutingmanufacturing, distribution and warehouse companies.
The industrial park covers 96 Hectares (237 acres) andis in a well-landscaped setting, where there is ampleparking, amenities and security.
The industrial park dates from 1995. Much of the parkcomprises built-to-suit units that are owner-occupied.The park has semi-detached and terraced factories.
The Developer/InvestorsThe developer is Horsedale Development Berhad,which is part of DRB Hicom Berhad.
DRB Hicom Berhad owns the company thatmanufactures the Proton car, the national automanufacturer. DRB Hicom Berhad also owns EONBank Berhad, the lead bank in the consortium of local

King Sturge: Global Trends in Industrial Parks
52 53
commercial banks that provided funding for theindustrial park.
The developer originally marketed land at pricesranging from RM330 per m2 to RM370 per m2. Averageland lots sold ranged in size from 8,000 m2 to 24,000 m2.
All land has now been sold. However, there have beensecondhand transactions at prices of between RM600per m2 and RM800 per m2.
The Occupiers Techni-Tone, a manufacturer of toners, occupies 8,000 m2, at a rent of RM180 m2 year.
HSL occupies 16,000 m2 for warehousing, at a rent ofRM150 m2 year.
Proton, an auto manufacturer, occupies 80,000 m2.
JVC, an electronics company, occupies 20,000 m2.
Lease terms are generally for two to three years.
Rents are typically between RM155 per m2 and RM180per m2 per annum. This compares with prime rents ofbetween RM130 per m2 and RM155 per m2 in JohoreBahru and Penang. Rents have changed little in the pastfew years.
Singapore
THE SINGAPORE SCIENCE PARK
Output for the EconomyThe economy enjoyed growth rates of between 5% and10% for most of the 1990s. Even during the 1997 Asiancrisis, when regional economies suffered a severedownturn, the economy did not go into recession(+0.1% for 1998, the worst year during the crisis).
Before September 11th 2001 terrorist incident, theeconomy had begun to trend down due to structural andother reasons. 2001 was a year of negative growth – theeconomy’s worst figure in 30 years. A stimulus packageof S$11B was put in place to ameliorate the worsteffects of the recession. Positive growth rates are notexpected until 2003.
The USA is Singapore’s largest trading partner, with ITproducts being the largest trade item. With the USA’scurrent difficulties in both the IT sector and the largereconomy, the hoped-for recovery, so evident during the1997 Asian crisis from the USA, is going to be absentfor sometime. At the same time, the strong growth ofChina’s economy, relatively unaffected by the Asiancrisis, is posing a challenge to Singapore in the form oflower production costs. Even when the US economy

King Sturge: Global Trends in Industrial Parks
recovers, particularly in the IT sector, the Singaporeeconomy may well be very different structurallybecause of the “China factor”.
Changes in the Property Market StructureThe property market has been in slow recovery sincethe worst days of the 1997 Asian crisis, but has beeninfluenced by oversupply even as late as 2000. With thelocal economy in its worst recession in 30 years,demand across all sectors is at a low point, even in theresidential market as home-owners face threats to theirjob security.
Because Singapore is basically a city-state, functioningas a business hub, it is convenient to use an overview topresent its industrial and warehousing activities, and totrack how sub-markets have evolved over time.
Industrial & Warehouse Sub-MarketsThe industrial and warehouse sub-markets were equallyaffected during 2001 by the poor global economy, aswell as by the structural factors arising from the “Chinafactor”. Rents and values fell steadily, with landlordstaking up to 25% rent drops, voluntarily in many cases.
As the recession, begun in 2001, begins to bite intoindustrial firms’ profits, the likelihood of more fallsduring 2002 increase. We do not expect to see anyturnround in these sub-markets until 2004.
Traditional industrial and warehousing space continuesto lose favour, as modern business park and sciencepark type space comes on stream, particularly over thelast two to three years. This is a trend that will continueas Singapore becomes less of a manufacturing centreand morphs into a design, marketing and distribution
centre, conceding the low-end manufacturing to China.Current vacancy levels average 10% in each of the twosub-marktes, with more vacancy up to 15% during2002.
The Main PlayersThe largest single supplier of industrial andwarehousing space in Singapore is the Government –through the JTC (Jurong Town Corporation) and thePSA (Port of Singapore Authority), as well as othergovernment bodies. The Government supplies andmanages 6.2 million m2 of industrial and 0.3 million m2
of warehousing space. The private-sector developersand investors together supply and manage another 18.4million m2 of industrial and 5.0 million m2 ofwarehousing space, bringing the total island-wide to24.6 million m2 of industrial and 5.3 million m2 ofwarehousing space.
Because of the scarcity of land, it is common forindustrial and warehousing space to be “high-rise”, ie,built up to eight storeys high. The bulk of this spacewas built over the last three decades, with current newspace taking the form of business and science parkdesigns.
Main OccupiersMost Fortune 500 companies are represented inSingapore, as are many European and other world-classfirms. Manufacturers and distributors find Singaporeconvenient and cost-effective.
This is despite high nominal salary and rent levels, asthey can cover the South East Asian and Asia-Pacificregions stretching from China, Taiwan, Korea, andJapan in the north, down to New Zealand in the south;and from the Middle East in the west to the Pacificislands in the east. By way of example, Australian icecream is shipped to Japan via Singapore because it isseen as the most efficient route.

King Sturge: Global Trends in Industrial Parks
54 55
Current Rent LevelsModern, well-located, prime industrial space on 5,000 m2 floor plates are letting for S$1.60 per ft2 intotal occupational costs (nett rent, service charges and3% goods and services tax) on typical 3-year leases.The projected rent level for most of 2002 and 2003 willbe lower by some 15% to 20%, to reflect expectedslowdown in the global and local economies.
The Singapore Science ParkThis is an industrial park targeted at the electronics,engineering, IT, R&D and technology sectors. It is setin 50 hectares of lushly landscaped grounds andfeatures high-quality facilities and services.
Acknowledged as the most successful in Asia forattracting multinational corporations, the Park’scampus-like setting provides an ideal workenvironment for an exclusive community of over 8,000staff working for more than 300 multi-nationalcompanies, local companies and research organisations.
Tenants include: AT&T, Lucent, Citibank, Motorola,Schering Plough, Sony, Segate, Exxon Mobil, Shell,Pacific Internet, Johns Hopkins, NSTB, PSB, theInstitute of High Performance Computing, and theCentre for Wireless Communications.
Typical floor areas of tenant-units are between 100 and1,600 m2. All space is tenanted, with occupancy hitting95%. Facilities and amenities include a 245-seatauditorium, fitness centre, with conference and functionrooms.
Offering a “work-play” concept, the Singapore SciencePark is spread over two locations; the 30-hectare
Science Park I is along Ayer Rajah Expressway and the20-hectare Science Park II is along Pasir Panjang Road.Development of a new 15-hectare Science Park IIIalong Pasir Panjang Road is in Progress.The location at Buona Vista, in the West of SingaporeIsland, means that it enjoys quick and easy access to theCBD, seaport, airport, industrial areas, tourist/shoppingbelt, universities, polytechnics and other cityamenities/facilities. All these locations can be reachedin under half an hour by road.
The prime location within Singapore Island is matchedby its equally significant location on Singapore Island,the economic and business hub serving much of Asia-Pacific.

King Sturge: Global Trends in Industrial Parks


+44 20 7493 4933
www.kingsturge.com
LOCATIONS
UK
London • Bath • Belfast • Birmingham • Bristol • Cardiff • Edinburgh
Exeter • Glasgow • Leeds • Liverpool • Manchester • Newcastle
Southampton • Swindon
WORLDWIDE
Austria • Australia • Belgium • China • Czech Republic • Estonia
France • Indonesia • Ireland • Israel • Luxembourg • Malaysia
The Netherlands • Poland • Singapore • Spain • Switzerland
A Member of
USA • Canada
¤
INTERNATIONAL
King Sturge