Embed Size (px)
Citation preview

TunaSeafood Industry Report
Glitnir Seafood Team
August 2007

2
Glitnir Seafood Industry Report – Tuna
Contents
• Foreword and Report’s Main Findings .............................................. 3 – 4
• Tuna Overview ............................................................................. 5
• The Tuna Industry
1) Global Tuna Supply ........................................................... 6 - 26
2) Tuna Processing ................................................................ 27 – 30
3) Tuna Market – Trade and Prices .......................................... 31 - 39
4) Tuna Consumption ............................................................ 40 - 44
• Case Study: Tuna Farming ……........................................................ 45 - 50
• Glitnir Seafood Stockwatch ............................................................ 51 - 53
• Glitnir – General Information ......................................................... 54 - 59

3
Glitnir Seafood Industry Report – Tuna
Foreword
Dear Reader,
It is our pleasure to present this new issue of Glitnir’s Seafood Industry Report. In this report we change our viewpoint of focusing on the seafood industry of different countries and instead focus on the global tuna industry. We are now in our fourth year of publication and are grateful for the good feedback we have received from our industry partners. This is the fourth Seafood Industry Report issued this year and we will issue 3 other reports during the year.
In terms of international trade, tuna is one of the most important fisheries species. Total export value of fisheries products amounted to USD 72 billion in 2004, whereof tuna accounted for USD 5.5 billion (7.6%). The three bluefin species are most valuable in terms of value per kilogram harvested, supply of these species is also the least or about 60,000 MT annually. This report gives an analytical overview over the global tuna value chain, its current situation and our evaluation of likely developments and future trends. At the end is a case study which focuses on tuna farming.
We trust you find this report of benefit. We at Glitnir are proud of our strong team of seafood industry expertsand look forward to working with you in our quest to make the seafood industry even more dynamic, efficient and profitable.
You can contact the seafood team via [email protected] and www.glitnir.is/seafood.
Best regards,
Glitnir Seafood Team

4
Glitnir Seafood Industry Report – Tuna
Main Findings
• Tuna is the fourth largest fisheries product in terms international trade
• The bluefin tunas are the most valuable tuna species in terms of value per kilo harvested
• Yellowfin and skipjack accounted for 84% of the total 4.3 million MT caught tuna supply in 2005
• The global caught tuna supply is stagnant and an increase in catches is not foreseeable
• Concerns regarding stock condition of albacore, Atlantic bluefin and bigeye exists in the Atlantic and the
Pacific ocean, in general tuna stocks are considered to be fully exploited
• Tuna farming in Spain, Australia, Mexico and Croatia is emerging and currently around 0.5% of the total
global supply comes from aquaculture
• Development of the larval technology is crucial for tuna farming to be able to grow and to become truly
sustainable
• Atlantic, Pacific and Southern bluefin are the main species utilized for farming
• Demand for fresh tuna has increased while demand for canned tuna is falling
• The US, Europe and Japan are the main tuna markets
• World tuna consumption has stagnated and is currently estimated to be 0.45 kg/year/capita
• Spain is the single largest country in tuna consumption with 3.3 kg/year/capita

5
Glitnir Seafood Industry Report – Tuna
Tuna Overview
• Tuna are several species from the family of Scombridaes, mostly in the genus Thunnus
• Tunas are very fast swimmers and are considered to be able to reach up to 75km/h (46mph)
• The main species of tuna can migrate great distances within and between the world’s oceans
• Tuna is one of the most economically important group of fish species
• Approximately forty tuna species are known in the Atlantic, Indian and Pacific Oceans and in the Mediterranean Sea
• Seven principal market tuna species are identified: albacore, Atlantic bluefin, bigeye, Pacific bluefin, southern bluefin, yellowfin and skipjack
• The principal market tuna species are most important from catch-weight and economical view points
• Among the principal market tuna species skipjack and yellowfin represent the largest share of total catch, 84.4%
• Main fishing methods are pole and line, long-line fishing, trolling, and some purse seining
Source: FAO FIGIS online; Globefish
100%Total
0.1Pacific Bluefin
0.4Southern Bluefin
0.8Atlantic Bluefin
4.9Albacore
9.4Bigeye
30.4Yellowfin
54.0Skipjack
% of total catch (volume)
Principal Market Tunas

6
Glitnir Seafood Industry Report – Tuna
1) Global Tuna Supply
Global SupplyCatch / Aquaculture
ProcessingPrimary / Secondary
Tuna MarketTrade / Price
ConsumptionTrends / Species

7
Glitnir Seafood Industry Report – Tuna
Tuna catch in comparison with other species
0
2,000
4,000
6,000
8,000
10,000
12,000
P eruvianancho vy
A laskapo llo ck
Skipjacktuna
C apelin A t lant icherring
B lue whit ing A t lant icco d
Yello wf inT una
2000 2001 2002 2003 2004 2005Source: FAO FIGIS online 2007, Statistics Iceland
Catch – Tuna in comparison with other species 2000–2005
• Peruvian anchovy is the single most caught fish species in the world and in 2005 the catch was 10.2 million metric tones (MT)
• Skipjack tuna and the yellowfin tuna are the most caught tuna species and in 2005 the catch was 2.3 and 1.3 million MT, respectively
• In the North Atlantic, the single most caught species in 2005 was Atlantic herring (2.3 million MT) followed by blue whiting (2.1 million MT)
Skipjacktuna
Yellowfintuna
MT ‘0
00

8
Glitnir Seafood Industry Report – Tuna
Tuna catch remains high
• Industrial tuna fisheries started as a result of increased demand during the 1940s and 1950s
• In 2005 the total catch of the seven principal market tuna species, was 4.3 million MT, 2.6% higher than the year before
• Concerns of a drop in catches in coming years due to a drop in spawning stocks and over-fishing prevail
• Skipjack tuna represented 54% of total tuna catch in 2005, followed by yellowfin tuna (30%) and bigeye tuna (9%)
• Around 65% of the global tuna catch is caught in the Pacific ocean, 23% in Indian waters and 12% in the Atlantic Ocean
• Tuna farming in 2005 was almost 23,000 MT, which accounted for 0.5% of total supply
Source: FAO FIGIS online 2007
Global Tuna Catch 1950-2005
0
1
2
3
4
5
1950
1970
1981
1983
1985
1987
1989
1991
1993
1995
1997
1999
2001
2003
2005
MT m
illio
n

9
Glitnir Seafood Industry Report – Tuna
Tuna stock exploitation by fishing area
FM-FF---FIndian Ocean
---D---Southern Ocean
OMF----Pacific: east
OMF-O----Pacific: west
------FPacific: north
------MPacific: south
----F--Pacific
-N---D-Atlantic: west
-N-----Atlantic: east
-----ONAtlantic Med.
------OAtlantic: north
------MAtlantic: south
F-F----Atlantic
BigeyeSkipjackYellowfinSouthernBluefin
PacificBluefin
AtlanticBluefin
Albacore
Principal Market Tuna Species – State of Stocks
N M F O DNot known Moderately exploited Fully exploited Overexploited DepletedSource: FAO
• According to FAO, Atlantic bluefin and Southern Bluefin are in a depleting condition in the West Atlantic Ocean and in the Southern Ocean, respectively

10
Glitnir Seafood Industry Report – Tuna
Uncertain stock condition
• In general, the state of global exploitation of world marine fish stocks has remained relatively stable over the past 10–15 years
• In 2005 around 23% of the fish stocks monitored by the Food and Agriculture Organization of the United Nations (FAO) was underexploited or moderately exploited, 52% was fully exploited and 25% was overexploited or depleted
• Two of the three main tuna species; yellowfin and bigeye are moderately, fully or overexploited
• Further increases in catch of the seven principal tuna market species are not expected and in some cases catches might be limited to current levels in order to maintain stock size that gives maximum sustainable yield (MSY)
• Skipjack in the Indian Ocean and the Pacific Ocean, and Albacore in the South Pacific Ocean are the only tuna stocks with potential for an increase in catches
• Bigeye and yellowfin are prevalent by catch in skipjack fisheries, and, therefore, increased fishing effort for skipjack is not preferable
• Difficulties are associated with the assessment of tuna stocks (especially Pacific bluefin and Southern bluefin) because of wide geographical distribution and the fact that the stocks are exploited by many nations
• Current information regarding the stock size and conditions of the principal tuna market species is considered to be insufficient; collection of additional data and improved measurement methods are there for essential
Source: FAO

11
Glitnir Seafood Industry Report – Tuna
1.1) Principal market tuna species

12
Glitnir Seafood Industry Report – Tuna
Skipjack tuna
• In 2005, catches of skipjack (Katsuwonus pelamis) were 2,306,000 MT, a 10.5% increase from the year before
• Catches have been trending upwards since 1995 and the average catch for the period is 1,912,000 MT
• Two stocks are assumed to exist in the Atlantic Ocean and one in the Indian Ocean. In the Pacific Ocean either a single stock with isolated subgroups or two or more separate stocks exist
• Skipjack is an important tuna species both commercially and as game fish
• The average weight and length of skipjack is 3kg and 35cm, although they can weigh up to 18kg
Global Catch - Skipjack Tuna 1995-2005
1,645 1,570 1,6011,894 1,965 1,957 1,824
2,023 2,161 2,0872,306
0
500
1,000
1,500
2,000
2,500
1995 1996 1997 1998 1999 2000 2001 2002 2003 2004 2005
MT '0
00
Source: FAO FIGIS online 2007 (latest data for 2005), FAO, www.atuna.com

13
Glitnir Seafood Industry Report – Tuna
Japan main fishing nation of skipjack tuna
Leading fishing countries - Skipjack 2004-2005
0
50,000
100,000
150,000
200,000
250,000
300,000
350,000
Japa
n
Indo
n.
Taiw
an
Korea
Spai
n
Ecua
dor
Seyc
helle
s
Chin
a
Pana
ma
Mex
ico
MT
Skipjack tuna 2004 Skipjack tuna 2005
Source: FAO FIGIS online 2007 (latest data for 2005)
• Japan, Indonesia, Korea and Taiwan are the main fishing nations with 293,087 MT, 235,140 MT, 171,641 MT and 170,320 MT respectively, in 2005
• The main markets for skipjack tuna are Japan (sashimi), Western-Europe and the US

14
Glitnir Seafood Industry Report – Tuna
Yellowfin tuna
• In 2005, total catches of Yellowfin (Thunnus albacares) were 1,296,000 MT, 2.1% lower than the year before
• Catches have been slightly upward trending since 1995 and the average catch for the period 1995–2005 is 1,241,000 MT
• Yellowfin is found in open waters of the Atlantic, Indian and the Pacific Oceans, yellowfin does not exist in the Mediterranean Sea
• Yellowfin can reach a length of 240cm and weigh up to 200kg
Global Catch - Yellowfin tuna 1995-2005
1,072 1,064 1,165 1,210 1,211 1,1861,336 1,349 1,437
1,324 1,296
0
200
400
600
800
1,000
1,200
1,400
1,600
1995 1996 1997 1998 1999 2000 2001 2002 2003 2004 2005
MT '0
00
Source: FAO FIGIS online 2007 (latest data for 2005), FAO

15
Glitnir Seafood Industry Report – Tuna
Mexico main fishing nation of yellowfin
Leading fishing countries - Yellowfin Tuna 2005-2004
0
20,000
40,000
60,000
80,000
100,000
120,000
140,000
160,000
Mexico
Taiwan
Philippin
es
SpainIn
donesia
Japan
Seych
elles
Korea
Ecuad
orPan
ama
China
MT
Yellowfin tuna 2004 Yellowfin tuna 2005
• Mexico, Taiwan, the Philippines and Spain are the main fishing nations with 143,184 MT, 122,001 MT, 95,596 MT, and 92,279 MT respectively in 2005
• The main markets for yellowfin are Japan, Western Europe and the US
Source: FAO FIGIS online 2007 (latest data for 2005), FAO
16
Glitnir Seafood Industry Report – Tuna
• In 2005, catches of bigeye tuna (Thunnus obesus) were 403,000 MT, 8.8% lower than the year before
• Catches peaked in 1999 at 449,000 MT but have been coming down since that time, the average catch for the period 1995–2005 is 425,000 MT
• One single stock of bigeye is assumed to exist in the Atlantic Ocean and another one in the Indian Ocean, two stocks are assumed to exist in the Pacific Ocean
• Bigeye has high fat content and is therefore preferred by discriminating sashimi buyers
• The average weight and length of bigeye is 15-20kg and 90cm, respectively
Global Catch - Bigeye Tuna 1995-2005
394 392 423 434 449 447 424 456412 442
403
0
100
200
300
400
500
1995 1996 1997 1998 1999 2000 2001 2002 2003 2004 2005
MT '0
00
Bigeye tuna
Source: FAO FIGIS online 2007 (latest data for 2005), FAO, www.atuna.com

17
Glitnir Seafood Industry Report – Tuna
Taiwan main fishing nation of bigeye tuna
Leading fishing countries - Bigeye Tuna 2004-2005
0
20,000
40,000
60,000
80,000
100,000
120,000
140,000
Taiw
an
Japa
nIn
done
sia
Spai
n
Chin
a
Korea
Ecua
dor
Panam
a
USASe
yche
lles
MT
Bigeye Tuna 2004 Bigeye Tuna 2005
• Japan, Taiwan and Indonesia are the leading fishing nations of bigeye with 76,961 MT, 73,737 MT and 35,905 MT respectively, in 2005
• Japan is the main market for bigeye tuna
Source: FAO FIGIS online 2007 (latest data for 2005), FAO

18
Glitnir Seafood Industry Report – Tuna
Albacore tuna
• In 2005, total catches of albacore (Thunnus alalunga) were 209,000 MT, 15% lower than the year before, the average catch for the period 1995–2005 is 224,000 MT
• In general three stocks of albacore are assumed to exist in the Atlantic Ocean; the northern and southern stocks (seperated at °5 N) and a Mediterranean stock
• Two seperate albacore stocks live in the Pacfic Ocean, one in the north and one in the south. One single stock is also assumed to exist in the Indian Ocean
• Around 40% of total catches comes from the Northern Pacific, 27% from the Southern Pacific, 25% from the Atlantic Ocean and 8% from the Indian Ocean
• The lengthe of albacore can measure up to 140cm and their weight extend to 60kg
Global Catch - Albacore tuna 1995-2005
195 201 219 229253
215 232 240 222246
209
0
50
100
150
200
250
300
1995 1996 1997 1998 1999 2000 2001 2002 2003 2004 2005
MT '000
Source: FAO FIGIS online 2007 (latest data for 2005), FAO, www.atuna.com

19
Glitnir Seafood Industry Report – Tuna
Japan the leading fishing nation of albacore tuna
Leading - Albacore fishing countries 2004-2005
0
10,000
20,000
30,000
40,000
50,000
60,000
70,000
Japa
nTa
iwan
The
USSp
ain
Canad
aIn
dones
iaPol
ynes
iaChi
naFr
ance
Korea
MT
2004 2005
• Japan, Taiwan and the US are the leading fishing nations of Albacore and in 2005 catches of these nations accounted for 46% of the total catch
• The three main fishing nations reduced their catches in 2005 compared to the year before. Spain, France and Korea were the only nations that increased catches
• Most of the catch is used for producing “white meat” canned tuna
Source: FAO FIGIS online 2007 (latest data for 2005), FAO

20
Glitnir Seafood Industry Report – Tuna
Atlantic bluefin tuna
• In 2005, total catches of Atlantic bluefin (Thunnus thynnus) were 35,740 MT, 8.5% lower than the year before, the average catch for the period 1995–2005 is 40,500 MT
• Atlantic bluefin is the slowest growing tuna species and it can live for up to 25 years
• Atlantic bluefin is know for its widespread migrations, its habitats are in the Atlantic and Pacific Oceans
• Around 40% of the total catches come from the North-West Pacific, 60% from the Atlantic Ocean (including 35% from the Mediterranean)
• Improved research on the Atlantic bluefin stock is considered to be necessary to improve fisheries control
• The Atlantic bluefin stock is under threat from overexploitation
• Avereage catch weight is about 7kg
Global Catch - Bluefin tuna 1995-2005
49.2 52.7 49.442.4
35.6 36.3 36.4 35.6 32.839.1 35.7
0
10
20
30
40
50
60
1995 1996 1997 1998 1999 2000 2001 2002 2003 2004 2005
MT '0
00
Source: FAO FIGIS online 2007 (latest data for 2005), FAO, www.atuna.com

21
Glitnir Seafood Industry Report – Tuna
Atlantic Bluefin - Aquaculture (volume)
0
2,000
4,000
6,000
8,000
10,000
Spain Croatia Tunisia Cyprus Italy
MT
2005 2004 2003 2002
Atlantic Bluefin - Aquaculture (value)
0
25,000
50,000
75,000
100,000
125,000
Spain Croatia Tunisia Cyprus Italy
US
D '
00
0
2005 2004 2003 2002
• Spain and Croatia are the leaders in Atlantic Bluefin aquaculture (fattening) with around 3,400 MT each in 2005
• Spain has the longest history of Atlantic Bluefin aquaculture, extending back to 1985, other countries have a much shorter history
• The total value of Atlantic bluefin farming in 2004 and 2005 was USD 131 million and USD 87 million respectively
• In 2005, Atlantic bluefin accounted for 33% of total global tuna aquaculture, in 2004 its share was 43%
Spain leads the way in Atlantic bluefin aquaculture
Source: FAO FIGIS online 2007 (latest data for 2005), FAO

22
Glitnir Seafood Industry Report – Tuna
Pacific bluefin tuna
• In 2005, total catches of Pacific bluefin (Thunnus orientalis) were 4,400 MT, 6% lower than the year before
• Catches of Pacific bluefin have varied substantially between years; the average catch for the period 1995–2005 is 10,000 MT
• Pacific bluefin spawn in the Western Pacific, then migrate over 11,112km to the Eastern Pacific, and eventually return to the West to spawn again
• According to FAO a single stock of Pacific bluefin has been assumed to exist in the Pacific Ocean. Tagging studdies have shown that substantial exchange of fish between the Eastern and Western Pacific Oceans exists
• Pacific bluefin can reach an age of 30 years, extend up to 3m in length and weigh up to 550kg
• Japan, Taiwan and Mexico are the main fishing nations with 1,780 MT, 1,368 MT and 996 MT respecitvely in 2005
Global Catch - Pacifc Bluefin tuna 1995-2005
7.3
16.1
11.07.6
16.8 16.2
9.1 9.1 8.2
4.7 4.4
02468
1012141618
1995 1996 1997 1998 1999 2000 2001 2002 2003 2004 2005
MT '0
00
Source: FAO FIGIS online 2007 (latest data for 2005), FAO

23
Glitnir Seafood Industry Report – Tuna
Mexico leads the way in Pacific bluefin aquaculture
M exico - P ac if ic B luef in A quaculture 2004-2005
517
4.193
7.869
0
2.000
4.000
6.000
8.000
10.000
MT
2003 2004 2005
• Mexico is the only country involved in
aquaculture of pacific bluefin
• In 2001–2003 aquaculture of Pacific bluefin in
Mexico totalled around 500 MT annually
• In 2004 the production jumped to 4,193 MT
and in 2005 the production further increased
to 7,869 MT
• The total value in 2004 and 2005 was USD 58
million and USD 120 million, respectively
• Farming of pacific bluefin represented 34% of
total farmed tuna in 2005
Source: FAO FIGIS online 2007 (latest data for 2005), FAO

24
Glitnir Seafood Industry Report – Tuna
Southern bluefin tuna
• In 2005, catches of Southern Bluefin (Thunnus maccoyii) totalled 16,000 MT, a 8.8% increase from the year before
• Catches have been trending downwards since peaking in 1999 although a slight increase occurred in 2005. The average catch for the period 1995–2005 is 15,800 MT
• Southern bluefin is found in open southern hemisphere waters of all the world’s oceans
• Southern bluefin reach a length up to 2.5m and weight up to 400kg and is therefore one of the largest bony fishes
• Japan, Australia and Indonesia are the main fishing nations with 7,344 MT, 5,535 MT and 1,831 MT respectively, in 2005
Global Catch - Southern Bluefin Tuna 1995-2005
13.816.2 15.0
17.219.6
15.217.5
15.413.5 14.7 16.0
0
5
10
15
20
25
1995 1996 1997 1998 1999 2000 2001 2002 2003 2004 2005
MT '0
00
Source: FAO FIGIS online 2007 (latest data for 2005), FAO

25
Glitnir Seafood Industry Report – Tuna
Australia leading the way in southern bluefin aquaculture
Source: FAO online 2007 (latest data for 2005), Forbes, PIRSA
• Australia is the only active country in farming of southern bluefin. The production peaked in 2004 at 9,558 MT but fell down to 7,458 MT in 2005
• The total value of the Australian production in 2004 and 2005 was USD 179 million and USD 107 million, respectively
• Farming of southern bluefin is one of the most valuable sector of the South Australian aquaculture industry
• The majority of the Australian farmed southern bluefin supply is serving the Japanese sashimi market
Australia - Aquaculture on Southern Bluefin Tuna
1,927 2,013 2,089 1,652 1,3732,649
3,889 4,011
7,458
9,558
7,763
0
2,000
4,000
6,000
8,000
10,000
12,000
1995 1996 1997 1998 1999 2000 2001 2002 2003 2004 2005
MT

26
Glitnir Seafood Industry Report – Tuna
Catch of principle market tuna species in 2005
Bluefin all
Bigeye tuna
Yellowfin tuna
Skipjack tuna
Albacore tuna
Japan
12.7
77.0
69.7
293.1
45.8
2005 (MT ‘000)
22,6%
19,1%
5,3%
12,7%
21,9%
%*
Bluefin all
Bigeye tuna
Yellowfin tuna
Skipjack tuna
Albacore tuna
Spain
9.0
25.7
92.3
137.6
20.4
2005 (MT ‘000)
16,0%
6,3%
7,1%
5,9%
9,7%
%*
Bluefin all
Bigeye tuna
Yellowfin tuna
Skipjack tuna
Albacore tuna
Taiwan
2.6
73.7
122.0
170.3
39.9
2005 (MT ‘000)
4,6%
18,2%
9,4%
7,3%
19,0%
%*
Bluefin all
Bigeye tuna
Yellowfin tuna
Skipjack tuna
Albacore tuna
Korea
1.0
24.2
52.5
171.6
2.9
2005 (MT ‘000)
1,7%
6,0%
4,0%
7,4%
1,4%
%*
Bluefin all
Bigeye tuna
Yellowfin tuna
Skipjack tuna
Albacore tuna
China
-
23.6
18.2
38.9
5.3
2005 (MT ‘000)
-
5,8%
1,4%
1,6%
2,5%
%*
Bluefin all
Bigeye tuna
Yellowfin tuna
Skipjack tuna
Albacore tuna
Ecuador
-
25.0
43.6
142.9
-
2005 (MT ‘000)
-
6,2%
3,3%
6,1%
-
%*
Bluefin all
Bigeye tuna
Yellowfin tuna
Skipjack tuna
Albacore tuna
Indonesia
-
35.9
65.9
235.1
19.8
2005 (MT ‘000)
-
8,9%
5,0%
10,1%
9,4%
%*
Bluefin all
Bigeye tuna
Yellowfin tuna
Skipjack tuna
Albacore tuna
Seychelles
-
10.4
43.8
46.0
0.1
2005 (MT ‘000)
-
2,5%
3,3%
1,9%
0,04%
%*
Bluefin all
Bigeye tuna
Yellowfin tuna
Skipjack tuna
Albacore tuna
Mexico
8.9
0.1
143.2
14.1
0.1
2005 (MT ‘000)
15,8%
0,02%
11,0%
0,6%
0,04%
%*
Source: FAO FIGIS online 2007, *% of total catch in 2005

27
Glitnir Seafood Industry Report – Tuna
2) Processing
Supply of RawMaterials
Catch / Aquaculture
ProcessingPrimary / Secondary
Tuna MarketTrade / Price
ConsumptionTrends / Species

28
Glitnir Seafood Industry Report – Tuna
Tuna processing
• The main internationally traded tuna forms are:
– raw material for canning
– pre-cooked loins for canning or frozen products
– tuna for direct consumption (sashimi)
– canned tuna
– smoked and dried tuna
• The two main types of processing are sashimi in terms of value and canning in term of quantity
• Tuna is also a popular value-added product, e.g. in tuna salads, tuna in a pouch, tuna steaks, tuna paste
and tuna burgers
• Skipjack tuna and yellowfin tuna account for 84% of the world catch and 70% of the global catches are
used in canning
• Tunas that are not acceptable for sashimi are sold in the steak market, mainly the EU and the US. The line
between sashimi-quality and steak-quality tuna varies with the state of the market, depending on the level
of demand
• Estimated production of canned tuna in 2006 is between 1.6 and 2.0 million MT
Source: Globefish; FAO, Glitnir Research

29
Glitnir Seafood Industry Report – Tuna
Canning dominates in terms of quantity
• The main species utilized for canning are skipjack yellowfin and albacore
• Around 70% of skipjack and yellowfin utilized for canning which in 2005 accounted for about 2.5 million MT
• Because of the colour of the meat, canned skipjack tuna and Yellowfin Tuna are also known as “light meat tuna”, while canned albacore Tuna is also known as “white meat”tuna
• Canned tuna products are packed in oil, brine, spring water or sauce
• The main importers of canned tuna are the US, UK and France
Source: Globefish
The Processing Chain for Canned tuna
Capture
Thawing
Gilling, Gutting, Heading
Freezing
Pre-cooking
Loining
Canning
Retort cooking
Cooling labelling and packing for distribution

30
Glitnir Seafood Industry Report – Tuna
The value lies in sashimi processing
Source: Globefish, FAO
• The sashimi market requires the use of larger species, such as bluefins (ensuring the premium sashimi)
bigeye and yellowfin
• Sashimi originates from fresh raw tuna meat, or from tuna frozen at -40° immediately after harvest
• In terms of capture methods, tuna for the premium sashimi market is generally caught by long-lines, which
ensure the best handling of the fish
• Sashimi is typically served in small slices, dipped in soy sauce or occasionally mixed with wasabi (Japanese
horse radish) and consumed raw
• Different sashimi cuts from different species have various market values, depending on fat contents: the
higher the fat content, the lighter the colour and the more valued the sashimi will be
• The best sashimi comes from toro, the peripheral layer of the fish belly with a fat content of about 25%
• Tuna for sashimi utilization is graded according to:
– Species
– Capture method
– Fat contents
– Aesthetic characteristics

31
Glitnir Seafood Industry Report – Tuna
3) Tuna Market – Trade and Prices
Supply of RawMaterials
Catch / Aquaculture
ProcessingPrimary / Secondary
Tuna MarketTrade / Price
ConsumptionTrends / Species

32
Glitnir Seafood Industry Report – Tuna
Tuna ranks number four in export value
0.8Fresh
5.5Total
2.7Canned
2.0Frozen
Value (USD billion)
Tuna trade by product category
• Total export value of fisheries products amounted to USD 72 billion in
2004, whereof tuna accounted for 7.6%
• The top 4 fisheries products accounted for 43% of total export value
• Capture supply is dominating the global trade
• Yellowfin, bigeye, bluefin and skipjack are the most traded tuna
species
• The main markets for canned tuna are the US and EU and for
sashimi, Japan is the largest market 5.5Tuna
5.7Salmon/Trout
7.3Fillets
12.2Shrimp
Value (USD billion)
Export of top 4 fisheries products
Source: FAO Fisheries Statistics – Commodities, 2006
Main Tuna Markets

33
Glitnir Seafood Industry Report – Tuna
Bluefin the most valuable tuna species
Tuna - Catch volumes and value of global trade in 2004
0
500
1,000
1,500
2,000
2,500
Yellow fin Bigeye Bluefin* Skipjack
M
T '
00
0
0
200
400
600
800
1,000
1,200
US
D '
00
0
Quantity Value
Source: FAO Fisheries Yearbook 2006
• Yellowfin is the largest tuna species in terms of international trade while skipjack is the largest and most
widespread species in terms of landed volume
• Bluefin tuna are the most valuable tuna species in terms of value per kilo harvested
• Most of the total USD 550 million bluefin trade is in the form of fresh products, or about 70% of sold value
*Atlantic, Pacific and southern bluefin

34
Glitnir Seafood Industry Report – Tuna
Tuna imports into Japan declining
10.311.414.5Total
0.020.070.03S. Bluefin
---Albacore
0.07-0.03Skipjack
3.764.144.73Bigeye
1.782.043.69Bluefin
4.705.176.04Yellowfin
200720062005
Fresh/Chilled TunaJanuary – March
(‘000 MT)
• Japan is the prime market for the highest graded fresh tuna, sashimi tuna
• Demand for sashimi tuna in Japan has been weakening, the cause is higher prices
• An increasing quantity of fresh tuna is being traded outside the traditional auction market because landing and freight costs have increased, also because the traditional marketing channel in Japan is very long
• Imports of all major tuna species into Japan have declined in recent years and at the same time import values have moved up
• During the first 3 months of 2007 imports of fresh/chilled and frozen tuna fell by 24% in quantity while value increased by 12%
• The total import of fresh/chilled tuna and frozen tuna in 2006 was 44.328 MT and 246.446 MT, respectively
• In the first six months 2006, total market share of tuna in total fishery imports into Japan was 14%
• Weakening of the Japanese Yen has also contributed to decrease of purchasing power
Source: Globefish, Glitnir Research
45.862.974.7Total
0.510.761.14Albacore
6.7712.6215.00Skipjack
12.9424.3726.15Yellowfin
21.5022.7729.27Bigeye
0.070.190.26S. Bluefin
4.032.262.92Bluefin
200720062005
Frozen TunaJanuary – March
(‘000 MT)
Japan Imports Japan Imports

35
Glitnir Seafood Industry Report – Tuna
Prices declining in the past but on the rise again
Historical prices of sashimi-grade tuna in Japan
0
1,000
2,000
3,000
4,000
5,000
6,000
7,000
8,000
19
86
19
87
19
88
19
89
19
90
19
91
19
92
19
93
19
94
19
95
19
96
19
97
19
98
19
99
20
00
20
01
20
02
20
03
Yen
/kg
Atlantic and Pacific bluefin tunas Southern bluefin tuna Bigeye Tuna Yellowfin Tuna
Source: Globefish, Project Topaz - Tuna Market Review – December 2005 Report by Camillo Catarci
• Historically, prices for Atlantic, Pacific and southern bluefin have been downward trending
• The average per kilogramme import value for tuna during January–September 2006, increased between 4% and 20%
• In general tuna prices are expected to increase in near future
• Prices of sashimi-grade tuna fluctuate widely during the year, depending on the periods of peak consumption of sashimi:
– The Golden Week in May;– The Bon Festival, which takes place during July and August; and– The New Year festivities

36
Glitnir Seafood Industry Report – Tuna
The US market: Declining in canned, growing in fresh
• Total imports of fresh/chilled tuna increased slightly, from 6,500 MT to 6,400 MT, in the first three months of 2007 compared to the same period last year
• Total yearly imports of fresh tuna are expected to be around 25,000 MT in near future
• Imports of canned tuna in 2005 and 2006 were 169,000 MT and 152,500 MT respectively, in 2007 imports are expected to further decrease to 145,000 MT
• Imports of yellowfin into the US in the first three months of 2007 were 5% higher than in the same period in 2006
US imports and supplying countries
020406080
100120140160180
1998 1999 2000 2001 2002 2003 2004 2005 2006
MT
'0
00
Thailand Philippines Indonesia Ecuador others US total imports
Source: Globefish, Glitnir Research

37
Glitnir Seafood Industry Report – Tuna
A slight increase in canned tuna prices
US - Canned tuna prices
10
12
14
16
18
20
22
24
26
USD
/ca
rton
Jan-99
Jul-99
Jul-00
Jan-01Jul-01
Jul-02
Jan-02
Jan-03
Jul-03
Jul-04
Jan-04
Jan-05
Jul-05
Jan-06
Jul-06
Jan-07
Jan-00
• Prices of canned tuna in the US have been upward trending although demand and imports have been decreasing
• Higher raw material prices seem to be resulting in somewhat higher product prices of canned tuna which was not the case first when raw material prices started to rise
• Prices are expected to rise further following the tight supply situation
Source: Globefish, Glitnir Research

38
Glitnir Seafood Industry Report – Tuna
EU demand is strong for both canned and fresh tuna
• UK (132,000 MT), France (108,000 MT), Germany (84,000 MT) and Italy (63,000 MT) are the largest importers of canned tuna within the EU
• Imports of canned tuna into Germany, UK, France and Italy have decreased by 4% since peaking in 2003
• Spain is the single largest supplier of canned tuna that is imported into the EU
EU 4 largest importers and country off suppliers
050
100150200250300350400450
2000 2001 2002 2003 2004 2005
MT
'000
Others Cote d´l voire Seychelles Spain EU 4 Biggest importers
Source: Globefish, Glitnir Research

39
Glitnir Seafood Industry Report – Tuna
EU – Canned tuna prices rising
Source: Globefish, Glitnir Research
Canned Tuna prices in the EU
0
5
10
15
20
25
30
1998 1999 2000 2001 2002 2003 2004 2005 2006 2007
US
D/
cart
on
• Prices of canned tuna on the EU market rose again after falling slightly at the start of 2007
• Despite price increases, demand for tuna on the EU market has been rather strong, but there are indications showing that demand might increase due to further foreseeable price increases
• The main reason for higher prices is low supply of raw material

40
Glitnir Seafood Industry Report – Tuna
4) Tuna consumption
Supply of RawMaterials
Catch / Aquaculture
ProcessingPrimary / Secondary
Tuna MarketTrade / Price
ConsumptionTrends / Species

41
Glitnir Seafood Industry Report – Tuna
Canned tuna consumption stagnant
World consumption of canned tuna
0.0
0.10.2
0.30.4
0.5
0.60.7
0.8
1980 1982 1984 1986 1988 1990 1992 1994 1996 1998 2000 2002 2004E 2006E
kg
/ye
ar/
cap
ita
• Tuna consumption has been stagnant for the last three years after a slow increase in previous years
• Recession in global supply in recent years is a likely cause for stagnant consumption
• World consumption of canned tuna (live weight equivalent) was 0.26 kg/year/capita in 1980 and according to Glitnir’s estimate the consumption in 2006 was around 0.45 kg/year/capita
• Prices for the principal species used for canning have been constantly increasing in recent years
• Reduced supply and increased prices of canned tuna will lead to less consumption in near future
Source: Globefish, Glitnir Research, Project Topaz - Tuna Market Review – December 2005 Report by Camillo Catarci

42
Glitnir Seafood Industry Report – Tuna
The US and EU largest in canned tuna consumption
Consumption of canned tuna in selected countries
0.50.60.70.70.80.90.91.11.2
1.41.51.61.8
2.12.22.3
3.3
0.0
0.5
1.0
1.5
2.0
2.5
3.0
3.5
Spai
n
Ital
yFr
ance
UKPor
tuga
l EU
25Fi
nlan
d Den
mar
k Bel
gium
Ir
elan
d Ger
man
y Net
herl.
Austr
ia
Greec
e Sw
eden
Luxe
mb.
Wor
ld
Kg/
year
/cap
ita
Source: Globefish, Project Topaz - Tuna Market Review – December 2005 Report by Camillo Catarci
• Spain is the single largest country in tuna consumption with 3.3 kg/year/capita
• In the US consumption of canned tuna is 1.3 kg/year/capita and due to large population this is an important market
• The main consuming countries of canned tuna are the European Union (EU), the United States, Canada, Japan and Mexico
Consumption of canned tuna outside EU - 2003
0,70,70,9
1,3
0,0
0,5
1,0
1,5
USA* Canada Japan Mexico
Kg/
year
/cap
ita
* 2006 figure

43
Glitnir Seafood Industry Report – Tuna
Canned tuna consumption decreasing in USA
Consumption - Top 10 species in USA ( kg per capita, edible weight)
n/a0,160.15Flatfish10
7.36
0.19
0.26
0.29
0.38
0.46
0.66
1.10
1.40
1.86
2005
7.507.54Total all species
0.200.21Clams9
0.220.27Cod8
0.300.28Crab7
0.450.31Tilapia 6
0.440.49Catfish 5
0.750.58Pollack 4
0.920.97Salmon3
1.311.50Canned Tuna 2
2.001.90Shrimp 1
20062004Species
• Consumption of canned tuna has decreased
last three years
• Despite reduced consumption canned tuna
is the second most consumed seafood item
in the US and the US market is still the
single largest market for canned tuna
• Shrimp is still the most consumed fisheries
product in the US and Tilapia is the fastest
growing species in terms of consumption
• Overall seafood consumption in the US has
been relatively stable in recent years, the
consumption in 2006 was 7.5 kg/capita
compared to 22 kg/capita in the EU (2005
figure)
Source: NFI

44
Glitnir Seafood Industry Report – Tuna
Increased demand for fresh tuna
• Consumption of fresh tuna, mainly Yellowfin and Bluefin has
increased in past years and farmed tuna from Australia,
Mexico and Croatia is mainly utilized for that purpose
• Increased demand for fresh tuna has lead to higher prices
in world markets
• Increased consumption of sushi in the US and EU has
contributed significantly to this increased demand
• Consumption in Japan is still strong but there are indication
of some downward trend which is considered to be caused
by higher prices. Prices seems to be too high to maintain
the strong demand which used to characterize the
Japanese market
• The US has emerged as the second largest import market
for fresh tuna and tuna products
Source: Globefish, Glitnir Research

45
Glitnir Seafood Industry Report – Tuna
5) Case Study: Tuna Farming

46
Glitnir Seafood Industry Report – Tuna
Tuna are captured at sea by purse seine netting, sometimes with help of helicopters and airplanes. The tunas are then transferred to a specialised towing sea-cage.
The cages are slowly towed (1–2 mph) to the farming location. The farming location can be in long distance and the sailing can take up to 30 days.
The tunas are transferred to the growth-out cages and the formal fattening process starts. The main feed is sardine, mackerel and anchovy.
The fattening period takes from 6 to 24 months and time of harvesting usually depends on market condition in main markets.
Tuna farming chain
• Tuna farming was first carried out in 1975 in eastern Canada
• Farming of tuna has almost exclusively been carried out in the form of catching small tunas for fattening
• Atlantic, Southern and Pacific Bluefin are the tuna species commercially utilized for farming but Yellowfin farming has been gaining foothold recently
• The fattening period takes from 6 to 24 months and the monthly growth rate is approximately 7%
• The feed conversion ratio (FCR*) is around 20 (it takes 20 kg of feed to produce 1 kg of tuna) which is high compared to farming of other fish species (salmon 1–2)
• The farmed tuna is usually higher priced than wild tuna because the sashimi market is basing the price on the fat content of the product, which is high for farmed tuna
• Farming also enables better timing of supply
• Atlantic bluefin is most valuable of the farmed tuna species
• The bulk of the farmed tuna is flown or shipped directly into Japan
Source: Glitnir Research, FAO *FCR is the mass of the food eaten divided by the body mass gain
Bluefin tunas are the farming species

47
Glitnir Seafood Industry Report – Tuna
Australia and Mexico biggest in tuna farming
Tuna – Main farming locations• Australia and Mexico are largest in tuna
farming, other countries are:
– Croatia: Atlantic bluefin
– Tunisia: Atlantic bluefin
– Spain: Atlantic bluefin
– Portugal: Atlantic bluefin
– Cyprus: Atlantic bluefin
– Italy: Atlantic bluefin
– Oman: Yellowfin
Source: FAO FIGIS online 2007

48
Glitnir Seafood Industry Report – Tuna
Aquaculture growing, but there is still long way ahead
Tuna - Global Aquaculture 1996-2005
0
5,000
10,000
15,000
20,000
25,000
30,000
1996
1997
1998
1999
2000
2001
2002
2003
2004
2005
MT
0
100,000
200,000
300,000
400,000
US
D '
00
0
Quantity Value
Source: FAO FIGIS online
• Global tuna farming increased from 2,090 MT in 1996 to 22,195 MT in 2005
• Tuna farming still represents low share of the total global tuna supply and in 2005 it was 0,5% compared to 0.6% in 2004
• Lower catch in 2005 is the reason for increased share of tuna farming of total supply
• The main Aquaculture countries are Spain (Atlantic bluefin tuna), Croatia (Atlantic bluefin tuna), Australia (Southern bluefin tuna) and Mexico (Pacific bluefin tuna), representing more than 95% of total supply
Tuna - Main Farming Countries 2005
0
2,000
4,000
6,000
8,000
10,000Mex
ico
Australia
Croatia
Spain
M
T0
50,000
100,000
150,000
US
D '
00
0
Quantity Value

49
Glitnir Seafood Industry Report – Tuna
Tuna Farming: Opportunities and challenges
Opportunities
• Tuna is a high value fisheries product posing it as an interesting species for farming
• The demand for a sashimi graded tuna is high which represents an opportunity for farmed bluefin
• One of the main criteria of sashimi graded tuna is the fat content, which is possible to control under farming conditions
• The US and the EU markets are growing as sashimi markets
• Declining catch leaves a gap in market for the tuna farming industry to fill
• The catch of Bluefin tuna is declining and prices are rising due to less supplies
Challenges
• Further development of the larval technology is crucial for tuna farming to be able to grow and to become truly sustainable
• With ability to produce fingerlings, the tuna farming business is more likely to be accepted by environmentalist group, which have criticised catch of small tunas for fattening
• Some countries do not request trade certification for live tuna that is sold from one country to another for farming, therefore live tuna trade sometimes escapes international and regional monitoring
• High feed conversion ratio (FCR)
• The usage of dry feed

50
Glitnir Seafood Industry Report – Tuna
51
Glitnir Seafood Industry Report – Tuna
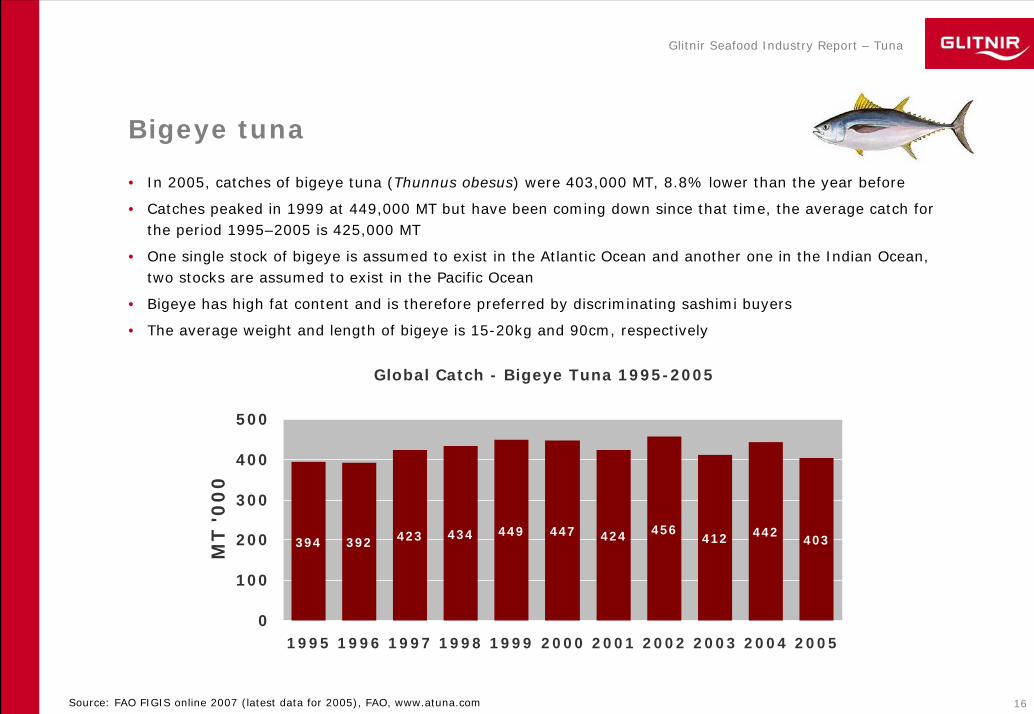
Glitnir Seafood Stockwatch – Europe
126,2
26,2%
6,8%
Europe Index
Index, %change YTD
Index, %change from June 19
16.812.0-13.4%6.3294IcelandIcelandic Group
24.714.231.0%5.2352GreeceNirefs (Nireus)24.010.051.6%46.7377NorwayAker Seafoods17.09.615.6%5.7541IcelandAlfesca13.913.423.0%305,0615DenmarkBiomar Holding23.211.148.6%40.2703SpainPescanova
12.08.818.1%133.51,168NorwayLeröy Seafood Group
12.58.023.4%113.51,769NorwayCermaq
13.68.033.7%57.51,770NorwayAustevoll Seafood
12.59.024.6%7.34,223NorwayMarine Harvest
12M P/E12m EV/EBITDAChange (%) in share price YTD
Current share price
M.Capm.USDCountryCompany
Europe
Index: January 1, 2007 = 100
Sources: Bloomberg, Individual Stock Exchanges, Company Annual and Quarterly Reports Revenues, Glitnir. Data as of July 20, 2007, "nmf" = not meaningful, "n/a" = not available.
Disclaimer: The companies on the list have been selected by Glitnir. Glitnir banki hf. hereby disclaims liability and does not accept any responsibility for such information or is giving any advice in relation to investments in those companies.
in cooperation with

52
Glitnir Seafood Industry Report – Tuna
Glitnir Seafood Stockwatch – Asia
115,2
15,2%
-7,6%
Asia Index
Index, %change YTD
Index, %change from June 19
16.4nmf0.5%366.0129JapanChuo Gyorui Co.
24.213.45.9%1475.0175JapanUoriki Co.18.5n/a-3.2%244.0219JapanKyokuyo Co.n/an/a-20.0%2.8242ThailandSea Horse18.9nmf-11.8%195.0264JapanNichiro Corporation17.8n/a59.0%2.8613ChinaPacific Andes
nmfn/a-9.2%218.0639JapanMaruha Group
10.18.6-4.0%24.0654ThailandThai Union Frozen Foods Group
23.116.947.2%2.31,186ChinaChina Fishery Group
nmfn/a7.2%749.01,697JapanNippon Suisan Kaisha
12M P/E12m EV/EBITDAChange (%) in share price YTD
Current share price
M.Capm.USDCountryCompany
Asia
Index: January 1, 2007 = 100
Sources: Bloomberg, Individual Stock Exchanges, Company Annual and Quarterly Reports Revenues, Glitnir. Data as of July 20, 2007, "nmf" = not meaningful, "n/a" = not available.
Disclaimer: The companies on the list have been selected by Glitnir. Glitnir banki hf. hereby disclaims liability and does not accept any responsibility for such information or is giving any advice in relation to investments in those companies.
in cooperation with

53
Glitnir Seafood Industry Report – Tuna
Glitnir Seafood Stockwatch – The Americas
132,0
32,0%
3,9%
The Americas Index
Index, %change YTD
Index, %change from June 19
27.216.214.9%10.198CanadaHigh Liner Foods
nmf11.225.9%9.7160USOmega Protein Corp27.813.290.4%14.5188CanadaFishery Products International (FPI)nmfn/a-0.4%5.0245CanadaClearwater Seafoods Income Fund9.3n/a49.4%37.5258ChilePesquera Iquique-Guanaye (Igemar)18.4n/a32.0%622.3277ChileInvertec Pesquera (Invermar)15.111.441.9%305.0356ChilePesquera Itata
11.012.911.7%1005.0375ChileSociedad Pesquera Coloso
10.28.80.2%10.5510CanadaConnors Brothers Income Fund
15.57.054.8%69.0671PeruCopeinca
12M P/E12m EV/EBITDAChange (%) in share price YTD
Current share price
M.Capm.USDCountryCompany
The Americas
Index: January 1, 2007 = 100
Sources: Bloomberg, Individual Stock Exchanges, Company Annual and Quarterly Reports Revenues, Glitnir. Data as of July 20, 2007, "nmf" = not meaningful, "n/a" = not available.
Disclaimer: The companies on the list have been selected by Glitnir. Glitnir banki hf. hereby disclaims liability and does not accept any responsibility for such information or is giving any advice in relation to investments in those companies.
in cooperation with
54
Glitnir Seafood Industry Report – Tuna
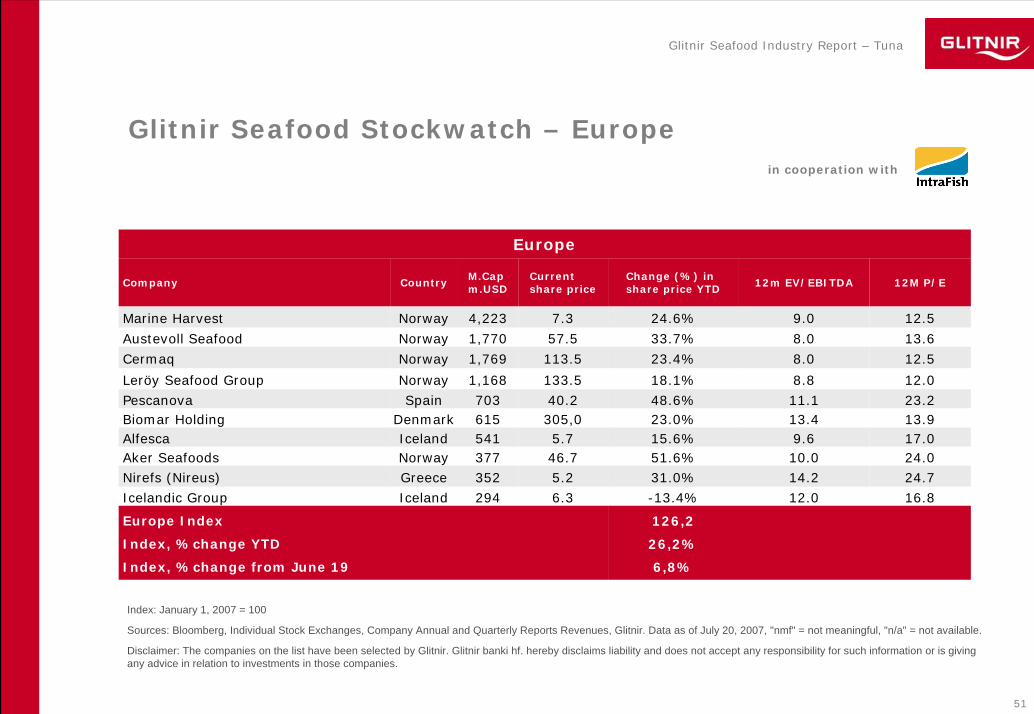
Introduction to Glitnir
• Home markets are Iceland and Norway
• Focus on niche segments worldwide
Seafood Industry, Sustainable Energy & Shipping – Offshore Supply Vessels
• Strong focus on the seafood industry since 1904
• Today 8% of the bank’s loan portfolio is in the seafood industry
• Credit ratings:
Aa3 / P-1 (Moody’s), A / F1 (Fitch) and A-/A-2 (Standard and Poor’s)
Credit facilities
– Term loan facilities– Working capital facilities– Syndicated loans– Vessel financing– Bridge loans
Capital Markets
– Bond issuances– FX dealings– Forward contracts– Options
Mergers & acquisitions
– Financial advisory– Acquisitions– Disposals– Minority investments– MBOs / LBOs / MBIs– Private Placements– Strategic reviews
Other services
– Risk management advisory– Equity participation
Our services include:
Glitnir’s total loan portfolio $22 billion
Commerce5%
Industry & contractors
8%
Other5%
Seafood8%
Individuals21%
Services26%
Real Estate27%
* as of April 30, 2007

55
Glitnir Seafood Industry Report – Tuna
Glitnir’s International Platform
London Branch • Corporate Banking• Corporate Finance • Centre of Excellence
• Food industry• Structured Finance• Loan Syndication
Iceland
United Kingdom Luxembourg
Norway
DenmarkCopenhagen Branch • Leveraged Finance• Corporate Finance
Glitnir Luxembourg• Corporate Banking• Centre of Excellence
• Real Estate• Private Banking
Headquarters• Corporate Banking • Centres of Excellence
• Global seafood• Sustainable energy• International core customers
• Structured Finance• Capital Markets• Corporate Finance
Canada
China
Glitnir CanadaRepresentative Office
Halifax • Opened April 2006
Glitnir ChinaRepresentative
Office Shanghai• Opened
December 2006
BNbank• Corporate and retail mortgageGlitnir Bank• Full service bank, trad. indust. • Centre of Excellence
• Shipping/ Offshore supply vessels• Subsidiaries:
• Glitnir Factoring Glitnir SecuritiesUnion GroupNorsk Privatøkonomi ASA
41 LothburyLondon City 534 Rue de Neudorf Frederiksgade 19
Copenhagen
KirkjusandurReykjavik
1718 Argyle StreetHalifax
Level 8, CitiGroup Tower33, Hua Yuan Shai Qiao RoadPudong, Shanghai
BNbank: Munkegata 21, TrondheimDronningens gate 40, OsloGlitnir Bank:St. Olavsplass 1, AlesundGlitnir Securities:Haakon VII’s gate 10, Oslo
Sweden
HovslagargatanStockholm
Glitnir AB • Equity
Trading & Brokerage
FIM Group• Funds• Structured products• Asset Management• Brokerage• Investment Banking
FinlandGlitnir Capital Corp.• New York office: open 2007• Corporate Credit & Corporate
Finance• Support of Glitnir clients in the
U.S. marketGlitnir Capital Corporation, 222 East 41st Street, New York NY 10017
The U.S. Russia
Pohjoisesplanadi 33 A,00100 Helsinki
FIM Financial Services• Funds• Structured products• Asset Management• Brokerage• Investment Banking
Paveletskaya sq. 2, bldg 3, 115054Moscow

56
Glitnir Seafood Industry Report – Tuna
Iceland
Glitnir Seafood Team
Magnús BjarnasonExecutive Vice PresidentInternational BankingDirect line: +354 440 4523Mobile: +354 844 [email protected]
Helgi Anton EiríkssonExecutive Vice PresidentInvestment BankingDirect line: +354 440 4518Mobile: +354 844 [email protected]
Kristján Th. DavídssonManaging Director Corporate Banking IcelandDirect line: +354 440 4517 Mobile: +354 844 4517 [email protected]
Ragnar GudjónssonDirectorCorporate Banking IcelandDirect line: +354 440 4550Mobile: +354 844 [email protected]
Hjálmur NordalDirectorCorporate Banking IcelandDirect line: +354 - 440 4522Mobile: +354 - 844 [email protected]
Gudmundur RagnarssonSenior ManagerCorporate Banking IcelandDirect line: +354 440 4547Mobile: +354 844 [email protected]
Ásmundur GíslasonAnalyst l SeafoodDirect line: +354 440 4768Mobile: +354 844 [email protected]
Valdimar HalldórssonAnalystDirect line: +354 440 4638Mobile: +354 844 [email protected]
Alexander RichterAnalystDirect line: +354 440 4766Mobile: +354 844 [email protected]
Guðmundur HjaltasonExecutive Vice PresidentCorporate BankingDirect line: +354 440 4515Mobile: +354 844 [email protected]
Bjarni HjaltasonGlobal Seafood DirectorCorporate BankingDirect line: +354 440 4788 Mobile: +354 844 4788 [email protected]

57
Glitnir Seafood Industry Report – Tuna
Joe FillmoreDirectorCanadaDirect: +1 (902) 429 3114Mobile: +1 (902) 237 [email protected]
North AmericaJonathan LoganManaging DirectorNorth AmericaMobile: +1 (203) 979 [email protected]
Michael RichardDirectorUnited StatesMobile: +1 (508) 878 [email protected]
Natasha SiderisAssociateCanadaDirect line: +1 (902) 429 3115 Mobile: +1 (902) 441 9190 [email protected]
AsiaJiang ZhuDirector Glitnir Rep. Office ChinaDirect: +86 21 6101 0190Mobile: +86 139 0161 [email protected]
Grace LiuExecutive AssistantGlitnir Rep. Office ChinaDirect: +86 21 6101 0191Mobile: +86 136 6166 [email protected]
Hafliði SævarssonAnalystGlitnir Rep. Office ChinaDirect: +86 21 6101 0191Mobile: +86 138 1807 [email protected]
Bjartur Logi Ye ShenAnalystInternational BankingDirect: +354 440 4560Mobile: +354 844 [email protected]
Glitnir Seafood – Regional Teams
Ignacio KleimanHead of Corporate FinanceInternational BankingDirect: +1 (212) 922 0228Mobile: +1 917 578 [email protected]
Eyþór EyjólfssonDirector – Japan and OceniaInternational BankingDirect: +354 440 4738Mobile: +354 844 [email protected]

58
Glitnir Seafood Industry Report – Tuna
Europe/Nordic
Kjartan ÓlafssonDirectorGlitnir Securities - NorwayDirect: +47 2287 8613Mobile: +47 9592 [email protected]
Ola ÖvrelidBank ExecutiveGlitnir Bank - NorwayDirect: +47 7010 2026Mobile: +47 9133 [email protected]
Henning LundAnalystGlitnir Securities - NorwayDirect: +47 2201 6347Mobile: +47 9525 [email protected]
Kristján HjaltasonDirectorGlitnir Bank - DenmarkDirect: +45 - 8833 5081 Mobile: +45 - 5199 [email protected]
Glitnir Seafood – Regional Teams
Glenn KristiansenDirectorGlitnir Securities - NorwayDirect: +47 - 2201 6392 Mobile: +47 – 9117 9105 [email protected]
South America
Jón Garðar GuðmundssonManaging DirectorEmerging MarketsDirect: +354 440 4516Mobile: +354 844 [email protected]
Anna Rósa RóbertsdóttirAnalystCorporate BankingDirect: +354 440 4554Mobile: +354 844 [email protected]
Kurt KvalsvikDirectorGlitnir Bank - NorwayDirect: +47 7010 2015 Mobile: +47 – 9480 [email protected]
Hjörtur Thor SteindórssonCredit ManagerInternational Corporate CreditDirect: +354 440 4503Mobile: +354 844 [email protected]
Sverrir Ingi ÁrmannssonAnalystInternational BankingDirect: +354 440 4528Mobile: +354 844 [email protected]
Guðjón SverrissonSenior Credit ManagerInternational BankingDirect: +1 (212) 71 60 105Mobile: + (646) 696 86 [email protected]

59
Glitnir Seafood Industry Report – Tuna
Gísli SigurgeirssonSenior ManagerInternational Corporate CreditDirect line: +354 440 4765Mobile: +354 844 [email protected]
Tim OwenExecutive DirectorHead of Corporate Finance, UKDirect line: +44(0) 20 7710 9130 Mobile: +44(0) 7843 512 [email protected]
Timothy H. SpanosExecutive DirectorInternational Corporate CreditDirect line: +354 440 4777Mobile: +354 844 [email protected]
Kyrre DaleCredit Manager | Glitnir BankSeafood Credit, NorwayDirect line: +47 7011 2034Mobile: +47 9137 [email protected]
Glitnir Seafood Team – Other Members
Atli Rafn BjörnssonDirectorCorporate FinanceDirect line: +354 440 4739Mobile: +354 844 [email protected]
Snorri Arnar VidarssonCredit OfficerCorporate Banking IcelandDirect line: +354 440 4771Mobile: +354 844 [email protected]
Eiríkur R. EiríkssonSenior ManagerCorporate Risk AdvisoryDirect line: +354 440 4565Mobile: +354 844 [email protected]
Rúnar JónssonFX BrokerageCapital MarketsDirect line: +354 440 4489 Mobile: +354 844 [email protected]
Stefán Eiríks StefánssonFX BrokerageCapital MarketsDirect line: +354 440 4483Mobile: +354 844 [email protected]
Ingi Rafnar JúlíussonExecutive DirectorCapital MarketsDirect line: +354 440 4459Mobile: +354 844 [email protected]
Davíð StefánssonAnalystCorporate Finance, UKDirect line: +44(0) 20 7710 9136 Mobile: +44(0) 788 795 [email protected]
Merete Stokke NesdalAccount Manager | Glitnir BankSeafood Credit, NorwayDirect line: +47 7010 2016Mobile: +47 926 67 [email protected]

60
Glitnir Seafood Industry Report – Tuna
Legal Disclaimer
All opinions and analyses represent the views of Glitnir at the time of writing and are subject to change without notice. Glitnir and its employees cannot be held responsible for any trading conducted on the basis of the information and views presented here. Glitnir may at any time have vested interests in individual companies, for example as an investor, creditor or service provider, but its opinions and analyses are produced independently by the Glitnir Research division, based on publicly available information on the company in question.
This Seafood Industry Report was written by
Ásmundur Gíslason, Analyst l Seafood – Glitnir Corporate Banking: [email protected]
Magnús Sigurðsson, Analyst l Cross Border Accounts – Glitnir CB: [email protected]
Valdimar Halldórsson, Analyst – Glitnir Research Reykjavik: [email protected]

61
Glitnir Seafood Industry Report – Tuna
www.glitnir.is/seafood