Embed Size (px)
Citation preview


The image on the cover page represents the creation
of a Buckyball (Buckministerfullerine) molecule in
progress. Buckyball, a spherical fullerene molecule
made fully of carbon, is one of the strongest, roundest
and most symmetrical large molecules known to man
and even today continues to astonish with one
amazing property after another.
The ability to withstand high speed collisions – like
slamming into a stainless steel plate at 15000 mph
and merely bouncing back unharmed; and on
compression upto 70%, gaining twice the hardness of
a diamond are just two of such amazing properties.
Being the only molecule composed of a single
element to form a hollow spheroid which provides
the potential for filling it up, Buckyball also finds use in
novel drug delivery systems.
The ‘creation in progress’ visual of the Buckyball
molecule is a representation of Glenmark’s e�orts to build a strong Foundation through Innovation for continuous Growth.

*As per SCRIP 100 – the annual listing of world’s leading companies as per pharma sales
7 novel moleculesin the research pipeline most of which are first-in-class, with 2 molecules out-licensed and
one molecule having completed phase III.
Building therapeutic centres of excellence in Dermatology,
Respiratory and Oncology across the entire chain from Innovation to Branded Formulations to
Pure Generics
3 Innovation R&D centres, 3 Generics R&D centres and
14 Manufacturing facilitiesspread across the globe
Building a Strong Foundationthrough Innovation
for continuous
Significant and sizeable presence in key markets
like India, US, Brazil and Russia which together
contribute to 75% of the business revenue
Now among theTop 100
Pharmaceutical and Biotech companies in
the world*

Corporate Information
Registered O�ce
B/2, Mahalaxmi Chambers, 22, Bhulabhai Desai Road,
Mumbai – 400026, Maharashtra
Corporate O�ce
Glenmark House, HDO – Corporate Building, Wing A, BD Sawant Marg,
Chakala, Off Western Express Highway, Andheri (East),
Mumbai – 400099, India, Tel. : +91 22 40189999,
Site : www.glenmarkpharma.com
Email : [email protected]
Auditors
• Walker, Chandiok & Co.
Chartered Accountants, Mumbai
Cost Auditors
• Sevekari Khare and Associates, Cost Accountants, Mumbai
Solicitor
• Kanga and Co. Mumbai
• Trilegal, Mumbai
Registrar and Transfer Agents
• Karvy Computershare Pvt. Ltd., Plot No. 17 to 24, Near Image
Hospital, Vittal Rao Nagar, Madhapur, Hyderabad – 500081
Tel.: 040 – 23420815; 23420818 – 828
Fax: 040 – 23420814
Banker
• Bank of India
Company Secretary
• Mr. Marshall Mendonza
Manufacturing Facilities
Formulations
• E 37, MIDC Industrial Area, D Road, Satpur, Nasik – 422007
Maharashtra
• Plot No. 7, Colvale Industrial Estate, Bardez – 403115, Goa
• D 42, Plot no. 50, Kundaim Industrial Estate, Kundaim – 403115, Goa
• Unit - I, Vill Kishanpura, Baddi-Nalagarh Road, Teh Baddi,
Dist. - Solan HP, Pin - 174101
• Unit - II, Vill Bhattanwala, PO Rajpura, Teh Nalagarh, Dist. - Solan HP,
Pin - 174101
• Unit - III, Vill Kishanpura, Baddi-Nalagarh Road, Dist. - Solan HP,
Pin - 174101
• Plot No 2, Phase -II, Pharma Zone, Special Economic Zone Area,
Pithampur, Indore 454775, Madhya Pradesh
• Rua Assahi, 33-1 Andar CEP 09633-0110, Rudge, Ramos Sao
Bernardo Do Campo, Sao Paulo, Brazil
• Rua Frei Liberato De Gries, 548, Jardim Arpoadar, CEP : 05572-210,
Sao Paulo, Brazil
• Glenmark Pharmaceuticals s.r.o., Fibichova 143, 56617, Vysoke Myto,
Czech Republic
• Calle 9 Ing Meyer Oks N 593, Parque Industrial Pilar, B1629MX
Buenos Aires, Argentina
API
• 3109 – C, GIDC Industrial Estate, Ankleshwar, Dist. Bharuch –
393002, Gujarat
• Plot no 163- 165/170 – 172, Chandramouli Industrial Estate, Mohol
Bazarpeth, Solapur – 413213, Maharashtra
• Plot No. A80, MIDC Area, Kurkumbh, Daund, Pune – 413802,
Maharashtra
Manufacturing Facilities under construction
Formulations
• Growth Centre, Samlik-Marchak, Dist. - East Sikkim, Sikkim
API
• Z-103 I, Dahej SEZ, Dahej District, Bharuch, Gujarat
• Plot No. B-25, Five Star MIDC, Shendra, Dist. - Aurangabad,
Maharashtra
R&D Centres
• Plot No. A 607, TTC Industrial Area, MIDC Mahape, Vashi,
Navi Mumbai – 400705, Maharashtra
• Chemin de la Combeta 5, 2300 La Chaux-de-fonds, Switzerland
• Plot No. C 152, MIDC Sinnar Industrial Area, Malegaon,
Dist. - Nasik – 422113, Maharashtra
• Plot No. M4, Taloja industrial area, MIDC Taloja, Taluka Panvel.
410208, Dist. - Raigad, Maharashtra
Clinical Research Centres
• Plot No. D 508, TTC Industrial Estate, MIDC, Turbhe,
Navi Mumbai – 400705, Maharashtra
• C2 7600, The Quorum, Oxford Business Park, North Oxford,
OX4 2JZ, UK

Contents
Chairman'sLetter04
KeyFinancials07
Highlights09
Board ofDirectors08
Innovation11
CorporateSocial Responsibility14
15 ManagementDiscussion & Analysis
29 Profiles of Directors
30 Directors' Report andRelevant Annexures
36 Report onCorporate Governance
47 Standalone Auditor’s Report
50 StandaloneBalance Sheet
51 StandaloneStatement of Pro�t & Loss
52 StandaloneCash Flow Statement
54 StandaloneNotes to Financial Statements
75 ConsolidatedAuditor’s Report
76 ConsolidatedStatment of Financial Position
81 Notes to ConsolidatedFinancial Statements
77 Consolidated Statement ofComprehensive Income
80 ConsolidatedCash Flow Statement
79 ConsolidatedStatement of Changes in Shareholders’ Equity
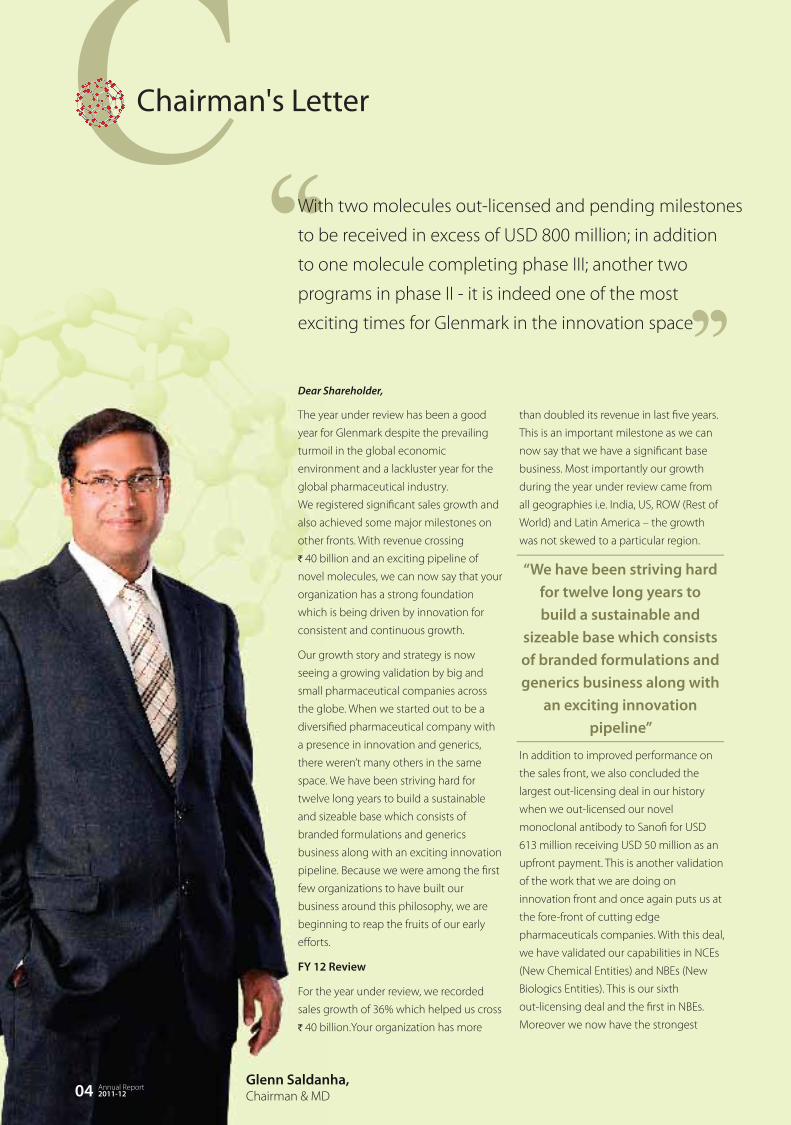
Chairman's Letter
With two molecules out-licensed and pending milestones
to be received in excess of USD 800 million; in addition
to one molecule completing phase III; another two
programs in phase II - it is indeed one of the most
exciting times for Glenmark in the innovation space
Dear Shareholder,
“We have been striving hard for twelve long years to build a sustainable and
sizeable base which consists of branded formulations and generics business along with
an exciting innovation pipeline”
Annual Report2011-1204
The year under review has been a good
year for Glenmark despite the prevailing
turmoil in the global economic
environment and a lackluster year for the
global pharmaceutical industry.
We registered significant sales growth and
also achieved some major milestones on
other fronts. With revenue crossing
` 40 billion and an exciting pipeline of
novel molecules, we can now say that your
organization has a strong foundation
which is being driven by innovation for
consistent and continuous growth.
Our growth story and strategy is now
seeing a growing validation by big and
small pharmaceutical companies across
the globe. When we started out to be a
diversified pharmaceutical company with
a presence in innovation and generics,
there weren’t many others in the same
space. We have been striving hard for
twelve long years to build a sustainable
and sizeable base which consists of
branded formulations and generics
business along with an exciting innovation
pipeline. Because we were among the first
few organizations to have built our
business around this philosophy, we are
beginning to reap the fruits of our early
efforts.
FY 12 Review
For the year under review, we recorded
sales growth of 36% which helped us cross
` 40 billion.Your organization has more
than doubled its revenue in last five years.
This is an important milestone as we can
now say that we have a significant base
business. Most importantly our growth
during the year under review came from
all geographies i.e. India, US, ROW (Rest of
World) and Latin America – the growth
was not skewed to a particular region.
In addition to improved performance on
the sales front, we also concluded the
largest out-licensing deal in our history
when we out-licensed our novel
monoclonal antibody to Sanofi for USD
613 million receiving USD 50 million as an
upfront payment. This is another validation
of the work that we are doing on
innovation front and once again puts us at
the fore-front of cutting edge
pharmaceuticals companies. With this deal,
we have validated our capabilities in NCEs
(New Chemical Entities) and NBEs (New
Biologics Entities). This is our sixth
out-licensing deal and the first in NBEs.
Moreover we now have the strongest
Glenn Saldanha,Chairman & MD
Annual Report2011-1205
pipeline than ever before. With two
molecules out-licensed and pending
milestones to be received in excess of USD
800 million; in addition to one molecule
completing phase III; another two
programs in phase II and another two in
Phase I – it is indeed one of the most
exciting times for Glenmark in the
innovation space.
On the other molecules, we are excited
about Revamilast which is currently
undergoing two phase II studies for
Asthma and Rheumatoid Arthritis(RA).
Besides Revamilast, GRC 17536 is another
molecule that is progressing well in the
clinics having successfully completed
Phase I studies in Netherlands and will
begin Phase II study in Neuropathic pain in
this year. On Crofelemer, the pivotal study
in Adult Acute Diarrhea including cholera
has begun recruiting patients and the
study is progressing well. We continue to
remain excited about innovation as we feel
that innovation is the only way to truly
transform the organization into a global
pharmaceutical organization.
Specialty business
The specialty business recorded strong
revenue growth of 30% for the year under
review. Once again, the India business
outperformed industry growth rate with
business growth at 19%. In the last two
years, we have renewed our focus on the
India business and during the year we
have realigned our portfolio by
understanding what our focus brands are
and invested resources behind these
brands. Also, in the early part of the year
under review, we completed our addition
of medical representatives for the Indian
market. This addition of nearly 500 medical
representatives along with the focus brand
strategy will pay dividends for the
organization in the coming financial year
too. The India business is on a strong base
and we are confident that this business
has the ability to outpace industry growth
in future. The only detriment for this
growth will be how the government’s
pricing policy will play out.
The ROW region registered 46% revenue
growth due to the strong performance of
all three regions - Asia, Africa and CIS. In
CIS, the Russian subsidiary still contributes
nearly half of the ROW business and the
subsidiary recorded in excess of 25%
growth. The Russian pharma market is
going through a number of regulatory
changes and this we feel will impact
industry growth in the next couple of
financial years. Russia remains a focus
market for your organization and we are
poised to do well in this financial year due
to four derma product approvals received
during the year. We see huge potential for
your organization in this market as we now
have a sizeable business in Russia. The
other markets of Asia and Africa performed
exceedingly well. Our power brands
strategy in these markets and focus on few
markets in each of the regions is paying
huge dividend. The Asia region recorded
strong growth rates and the secondary
growth rates are still high. The Africa
region also recorded astounding growth
despite the difficult political and economic
environment. The ROW region as a whole
should continue to register strong growth
and remain a very profitable region for us
in the future.
The Latin American region is another
region in focus for the organization. The
region grew in revenue by 50% in the year.
The key markets for us are Brazil, Mexico
and Venezuela. Presently Brazil contributes
nearly 70% of revenue for the region and is
expected to grow strongly in the next year
too. The Brazil market is one of the largest
branded formulations markets in the
world. We have been operating in this
market for the last seven years. Initially we
patched a business together, acquired a
small company, in-licensed few products,
got the manufacturing facility up and
running. And now our business has
reached a decent size and scale. I am
confident that our patience and
perseverance will pay us well in the
coming years with the Brazilian subsidiary
expected to record good growth rates
backed by our own product approvals. We
are now beginning to get product
approvals that we registered few years ago
and these products mostly have limited
competition. The other focus market is
Mexico where we have also been
operating for the last 5-6 years and is the
second largest generic market after Brazil
in the region. While we have filed for
approvals of various products in the
dermatology and the respiratory area, we
will benefit from the restrictions that have
just been lifted in Mexico and the
assurance by the regulator to hasten the
product approvals process.
The Latin American region will remain a
major growth driver for the business with
Brazil, Mexico and Venezuela remaining
main focus markets. We have now
developed a strong pipeline for the entire
Latin American region focusing on three
therapeutic areas viz. Oncology,
Dermatology and Respiratory. The focus
has been to formulate differentiated
products with limited competition. With a
good pipeline, we are confident that the
Latin American region will consistently
record good growth in the next couple of
years.
The Central Eastern European region grew
moderately in this financial year. The
economic environment has been very
tough in all operating markets viz.
Romania and Poland. The strategy for this
region would be to remain close to
break-even and focus our filings on
differentiated products. We expect the
current tough economic environment to
continue. However we don’t see this
region impacting the overall numbers
significantly.
Generics Business
In the pure generics space, the US
business did extraordinarily well, crossing
revenue of USD 250 million registering
growth in excess of 45%. What is
“With limited capital expenditure expected and no
acquisition plans as of now for next couple of years, the business will continuously
generate free cash”

Annual Report2011-1206
important is that most of the revenue now
constitutes the base business. Even the
Para IV exclusivity of Malarone will
continue in this financial year.
This is another significant achievement as
we have been in this market just around
seven years and now this business is larger
than the India business. Most importantly
the product approvals received in last 18
months have mostly seen limited
competition. I would like to mention that
our strategy of focusing on limited
competition and niche segments is paying
off. We now have ten oral contraceptives
approved for the US market and five OCs
(of combined market opportunity of USD
350 million) will get launched in this
financial year. Also in dermatology we
have 19 products which we have
indigenously developed and easily have
one of the largest derma portfolio in the
US. Our focus on a differentiated/niche
portfolio is beginning to pay dividends
and we feel confident that the US business
will show good growth in this year.
The Western Europe business has also
recorded strong growth in this financial
year. This is another business model which
is built on limited infrastructure cost. While
manufacturing is currently being done
from USFDA approved plants, we have
limited investments in people across the
region. Even at this base of USD 20 million
in revenue, the business is profitable and
the profitability will only get better with
increased sales.
The API business continues to increase its
presence in regulated markets and this
strategy of focussing on regulated markets
will remain for the business. Even for
developing markets, the API business will
focus on difficult to manufacture
molecules and thus maintain profitability
of the business.
In this year, we also managed to
significantly improve our financial position.
Our working capital position has been a
cause for concern in the last couple of
years. We have consciously been working
on this area of our working capital and in a
matter of three years we have managed to
bring this down substantially. This
reduction in working capital has been
achieved on the back of high sales growth
and a business model which is spread
across many geographies.
The free cash for your organization has also
significantly increased in this year and as a
result we increased dividend payout.
With limited capital expenditure expected
and no acquisition plans as of now for the
next couple of years, the business will
continuously generate free cash which will
go primarily towards reducing debt.
I would like to sum by saying that your
organization is in a unique position and
well placed for sustainable growth.
For long we have focussed on building
capabilities and a strong pipeline and we
have now most importantly reached a
certain scale in our business which is a
solid foundation for growth. At Glenmark,
we believe that R&D is our edge whether it
is for formulating products for the branded
generics markets or the pure generics
market. We are building centres of
excellence around three therapeutic areas
i.e. Oncology, Dermatology and
Respiratory. We have built capabilities
across the spectrum in these areas from
innovation to branded generics to pure
generics. Because of our unique
capabilities, we will be able to launch any
product in these segments in any of the
operating markets.
Another factor is that we have scale in all
major markets like the US, India, Russia,
and Brazil. These four markets now
account for over 75% of our overall
business revenue and these businesses are
poised for consistent growth rate in the
next few years. We have been working
hard to reach this size and scale and this
entire build-out has been achieved by
organic growth.
The road ahead...
In the coming year, we are confident of
building on the foundation that we have
to grow at an even faster rate. We will
continue to focus on accelerating sales
growth by maximising our diverse product
portfolio, bringing more innovative
products to market and continuing to
expand our presence in operating
geographies. We will also look for
innovative ways to grow our generics
business and ensure that we get better
and better products by investing in R&D.
As we move forward, I would like to thank
our shareholders for standing by Glenmark
as we grew from strength to strength,
despite the many challenges that came
our way.
I would also like to reaffirm our
commitment to making Glenmark one of
the leading global innovation led
pharmaceutical organizations and with
your support I look forward to another
successful year.
Regards,
Glenn SaldanhaChairman & MD
“At Glenmark, we believe that R&D is our edge whether it is for formulating products for
the branded generics markets or the pure generics
markets. We are building centres of excellence around three therapeutic areas i.e.
oncology, dermatology and respiratory. We have built
capabilities across the spectrum in these areas from
innovation to branded generics to pure generics.
Because of our unique capabilities we will be able to launch any product in these
segments in any of the operating markets”

Annual Report2011-1207
Key Financials
Note: It must be noted that the financial information for FY 11 and FY 12 has been prepared under International Financial Reporting Standards (IFRS), where as prior years' financial information have been prepared under Indian Generally Accepted Accounting Principles (I-GAAP); accordingly FY 11 and FY 12 information is not strictly comparable with prior years' information.
2011-12
Total Revenue
Consolidated Financial Highlights(In INR Mn, unless otherwise stated)
Net Worth
Return on Equity [PAT / Net Worth]
Total Debt
Gross Fixed Assets
Net Fixed Assets
Total Assets
Debt : Equity ratio
Earning Per Share (`)
Key Indicators
Closing market price as on 31 March
Market Capitalisation
24,247.59
58,834.27
83,230.25
307.65
17.03
0.93
19.33% 22.47% 14.06% 12.11% 41.64%
1.03 0.79 1.31 0.65
16.78 12.40 7.70 25.84
283.60 266.25 157.80 490.70
76,649.15 71,844.25 39,532.02 122,049.73
50,977.77 43,651.32 37,525.84 26,048.43
21,517.50 23,880.78 21,116.52 12,557.43
22,445.01 21,084.62 18,693.91 20,943.47 9,909.39
24,016.30 20,372.37 23,552.33 15,981.56 15,178.73
Reserve and Surplus
Equity Share Capital
Equity dividend%
Pro�t for the year
Depreciation and Amortisation
Earning before Depreciation, Finance cost, and Tax expenses [ EBDIT ]
40,299.04
4,643.07 4,578.33 3,310.32 1,934.73 6,321.12
978.78
28,384.24 24,685.23 27,763.12 23,839.86 14,613.30
23,745.77 20,102.10 23,282.49 15,731.04 14,930.00
270.53 270.27 269.84 250.52 248.73
200% 40% 40% 40% 70%
946.78 1,206.10 1,026.83 716.80
7,236.24 7,327.89 6,685.29 6,289.95 8,463.46
30,895.88 25,496.10 22,900.45 20,550.21
2010-11 2009-10 2008-09 2007-08
Specialty Generics
Revenue Split
58.71%41.29%

Mr. Gracias SaldanhaFounder & Chairman Emeritus
Mr. Glenn SaldanhaChairman & Managing Director
Mrs. Cherylann PintoExecutive Director
Mr. Rajesh V. DesaiExecutive Director & CFO
Mrs. B. E. SaldanhaNon-Executive Director
Mr. D. R. MehtaNon-Executive Director
Ex Deputy Governor, Reserve Bank of India and Ex Chairman, Securities and
Exchange Board of India, he has over 4 decades of rich experience in civil services.
Mr. Bernard MunosNon-Executive Director
The Founder, InnoThink Center for Research in Biomedical Innovation served Eli
Lilly and Company, USA as Advisor - Corporate Strategy. He has presented his
findings at numerous meetings sponsored by academies, foundations, universities
in the US and Europe.
Dr. Brian W TempestNon-Executive Director
A CSCI, CCHEM, FRSC, BSC, PHD, he has worked in the Pharmaceutical Industry for
the last 40 years and managed healthcare businesses across numerous regions;
He is a Fellow of the Royal Society of Chemistry and a Fellow of the Royal Society
of Medicine. He worked at Ranbaxy Laboratories assuming positions of Chief
Executive Officer and Vice-Chairman.
Mr. Julio F. RibeiroNon-Executive Director
A retired Government officer, he has served the country under various
assignments like Ex-Commissioner of Police, Mumbai and Former Special Secretary
to Government of India, Ministry of Home Affairs.
Mr. Hocine Sidi SaidNon-Executive Director
Founder & Director, Bio-nAbler - an investment company, he has over two decades
of experience in global pharma industry having been associated with companies
like Pfizer and UCB.
Mr. Sridhar GorthiNon-Executive Director
Presently a partner at Trilegal, he has been involved in legal advisory services to
various multinational and domestic corporations on restructuring, debt finance,
joint ventures, acquisition/mergers etc.
Mr. N. B. DesaiNon-Executive Director
Founder of Equitorial Bank PLC, UK, he has rich experience of over four decades in
the Banking sector globally, having assumed leadership positions like Ex Chairman,
Bank of Baroda Uganda Ltd.
In the FY 12, Glenmark was granted approval of 14 Abbreviated New
Drug Applications (ANDA), which comprised of 12 final and 2
tentative approvals in the US.
In the US, Glenmark successfully launched 12 products during fiscal
year 2012 consisting of a mix of semi-solid preparations,
oral-contraceptives, extended release, and immediate release items.
It also includes the exclusive launch of Atovaquone Proguanil tablets
250mg/100mg, their generic version of Malarone® tablets, under a
royalty-bearing license from GSK. In March 2012, the Company
initiated the exclusive launch of Fluticasone Propionate lotion, their
generic version of Nycomed’s Cutivate® lotion.
Glenmark has one of the largest Dermatology (19 approvals) and Oral
Contraceptives (10 approvals) product portfolios in the US.
Glenmark Europe launched over 15 products across European
markets, including the United Kingdom.
Glenmark successfully signed 10 deals for licensing out and supply of
products in EU markets.
The API business launched Telmisartan in Europe and Canada
through two global generic players. The business continued its
leadership position for Lercanidipine, Topiramate and Amiodarone,
combined with launches of new products during the year viz.
Atovaquone, Ropinirole, Riluzole and Terbinafine.
The API business registered its first sale in the Japan market and also
submitted JDMF of Milnacipran HCL in the country.
The Oncology business based out of Argentina filed 41 product
dossiers for various countries.
Annual Report2011-1208
Board of Directors
Research & Development
Signed an outlicensing agreement with Sanofi for GBR 500, its novel
monoclonal antibody for Crohn’s disease and other anti inflammatory
diseases for a landmark deal size of USD 613 million receiving USD 50
million as upfront payment .
Crofelemer, a first-in-class anti-diarrheal drug, entered Pivotal trials for
Adult Acute Diarrhea including Cholera. Glenmark has exclusive
Crofelemer rights for diarrhea indications in nearly 140 countries
including India and is the sole API supplier globally for Crofelemer
(ex-China).
Initiated Phase IIb studies for Revamilast, our PDE4 inhibitor in Asthma
and Rheumatoid Arthritis in multiple countries for each indication.
The Phase IIb study for Asthma will report in this financial year.
Successfully completed Phase I trials for its novel molecule ‘GRC
17536’ a potentially first in class molecule targeting TRPA1 receptor
for pain and respiratory conditions in Netherlands. We have also
obtained approval for Phase II proof of concept study in pain
indication in the UK (MHRA) and awaiting approval in Germany
(BfArM).
Completed Phase I trial for GRC 15300 – a TRPV3 Inhibitor for
treatment of pain in the UK. This is the first TRPV3 inhibitor which
entered clinical trials. This molecule is outlicensed to Sanofi.
Formulations Business
The Indian Formulations business recorded one of the highest growth
among the top 25 companies in the country as per IMS.
Launched in India, over 20 key products viz. in its core therapeutic
areas of Oncology, Dermatology, Respiratory and Cardiovascular.
Glenmark entered into an exclusive licensing agreement with IDC,
a leading Canadian company for a range of high end Dermatology
products and launched the Cosmocare division in India to strengthen
its Dermatology / Cosmetology franchise of Glenmark.
‘Respicare’ – Glenmark’s Respiratory Division launched to consolidate
Glenmark’s presence in the acute care segment.
Registered ten products in the Asia region during the year which will
drive the growth in FY 2013
Despite challenges in the business environment; Glenmark’s Africa &
Middle East operations recorded strong secondary sales growth of
over 40% backed by its power brands strategy.
Glenmark Russia is now among the top 20 pharma companies in
Dermatology in the country and one of the fastest growing
pharmaceutical company in Russia.
In Central Eastern Europe, Glenmark launched 6 products in Czech /
Slovak; Entered the Dermatology segment in Poland, CNS segment in
Romania and Cardiovascular segment in Hungary
In Latam, Brazil, the largest subsidiary contributing over 70% of sales
from LatAm region, grew by over 30%.
Glenmark Venezuela gained 21 ranks in the IMS ranking and is now
ranked 74 in the country.
Generics Business
Glenmark Generics Inc., U.S.A. registered an increase of 45% in
revenue from sale of finished dosage formulations over the
corresponding previous year.

In the FY 12, Glenmark was granted approval of 14 Abbreviated New
Drug Applications (ANDA), which comprised of 12 final and 2
tentative approvals in the US.
In the US, Glenmark successfully launched 12 products during fiscal
year 2012 consisting of a mix of semi-solid preparations,
oral-contraceptives, extended release, and immediate release items.
It also includes the exclusive launch of Atovaquone Proguanil tablets
250mg/100mg, their generic version of Malarone® tablets, under a
royalty-bearing license from GSK. In March 2012, the Company
initiated the exclusive launch of Fluticasone Propionate lotion, their
generic version of Nycomed’s Cutivate® lotion.
Glenmark has one of the largest Dermatology (19 approvals) and Oral
Contraceptives (10 approvals) product portfolios in the US.
Glenmark Europe launched over 15 products across European
markets, including the United Kingdom.
Glenmark successfully signed 10 deals for licensing out and supply of
products in EU markets.
The API business launched Telmisartan in Europe and Canada
through two global generic players. The business continued its
leadership position for Lercanidipine, Topiramate and Amiodarone,
combined with launches of new products during the year viz.
Atovaquone, Ropinirole, Riluzole and Terbinafine.
The API business registered its first sale in the Japan market and also
submitted JDMF of Milnacipran HCL in the country.
The Oncology business based out of Argentina filed 41 product
dossiers for various countries.
Annual Report2011-1209
Highlights
Research & Development
Signed an outlicensing agreement with Sanofi for GBR 500, its novel
monoclonal antibody for Crohn’s disease and other anti inflammatory
diseases for a landmark deal size of USD 613 million receiving USD 50
million as upfront payment .
Crofelemer, a first-in-class anti-diarrheal drug, entered Pivotal trials for
Adult Acute Diarrhea including Cholera. Glenmark has exclusive
Crofelemer rights for diarrhea indications in nearly 140 countries
including India and is the sole API supplier globally for Crofelemer
(ex-China).
Initiated Phase IIb studies for Revamilast, our PDE4 inhibitor in Asthma
and Rheumatoid Arthritis in multiple countries for each indication.
The Phase IIb study for Asthma will report in this financial year.
Successfully completed Phase I trials for its novel molecule ‘GRC
17536’ a potentially first in class molecule targeting TRPA1 receptor
for pain and respiratory conditions in Netherlands. We have also
obtained approval for Phase II proof of concept study in pain
indication in the UK (MHRA) and awaiting approval in Germany
(BfArM).
Completed Phase I trial for GRC 15300 – a TRPV3 Inhibitor for
treatment of pain in the UK. This is the first TRPV3 inhibitor which
entered clinical trials. This molecule is outlicensed to Sanofi.
Formulations Business
The Indian Formulations business recorded one of the highest growth
among the top 25 companies in the country as per IMS.
Launched in India, over 20 key products viz. in its core therapeutic
areas of Oncology, Dermatology, Respiratory and Cardiovascular.
Glenmark entered into an exclusive licensing agreement with IDC,
a leading Canadian company for a range of high end Dermatology
products and launched the Cosmocare division in India to strengthen
its Dermatology / Cosmetology franchise of Glenmark.
‘Respicare’ – Glenmark’s Respiratory Division launched to consolidate
Glenmark’s presence in the acute care segment.
Registered ten products in the Asia region during the year which will
drive the growth in FY 2013
Despite challenges in the business environment; Glenmark’s Africa &
Middle East operations recorded strong secondary sales growth of
over 40% backed by its power brands strategy.
Glenmark Russia is now among the top 20 pharma companies in
Dermatology in the country and one of the fastest growing
pharmaceutical company in Russia.
In Central Eastern Europe, Glenmark launched 6 products in Czech /
Slovak; Entered the Dermatology segment in Poland, CNS segment in
Romania and Cardiovascular segment in Hungary
In Latam, Brazil, the largest subsidiary contributing over 70% of sales
from LatAm region, grew by over 30%.
Glenmark Venezuela gained 21 ranks in the IMS ranking and is now
ranked 74 in the country.
Generics Business
Glenmark Generics Inc., U.S.A. registered an increase of 45% in
revenue from sale of finished dosage formulations over the
corresponding previous year.
Specialty Business
Strengthening our businesses,expanding our presence throughan innovation led portfolio Out-licensed GBR 500 – a monoclonal antibody
to Sano� in a landmark deal worth USD 613 Mln
Among the top 20 fastest growing pharma companies in Russia and among
the top 25 pharma companies in India
SCRIP – one of the world’s leading pharmaceutical magazines awarded Glenmark as the ‘Best Pharma
Company in an Emerging Market’ and the ‘Best Overall Pipeline’ at SCRIP Awards 2011

In the FY 12, Glenmark was granted approval of 14 Abbreviated New
Drug Applications (ANDA), which comprised of 12 final and 2
tentative approvals in the US.
In the US, Glenmark successfully launched 12 products during fiscal
year 2012 consisting of a mix of semi-solid preparations,
oral-contraceptives, extended release, and immediate release items.
It also includes the exclusive launch of Atovaquone Proguanil tablets
250mg/100mg, their generic version of Malarone® tablets, under a
royalty-bearing license from GSK. In March 2012, the Company
initiated the exclusive launch of Fluticasone Propionate lotion, their
generic version of Nycomed’s Cutivate® lotion.
Glenmark has one of the largest Dermatology (19 approvals) and Oral
Contraceptives (10 approvals) product portfolios in the US.
Glenmark Europe launched over 15 products across European
markets, including the United Kingdom.
Glenmark successfully signed 10 deals for licensing out and supply of
products in EU markets.
The API business launched Telmisartan in Europe and Canada
through two global generic players. The business continued its
leadership position for Lercanidipine, Topiramate and Amiodarone,
combined with launches of new products during the year viz.
Atovaquone, Ropinirole, Riluzole and Terbinafine.
The API business registered its first sale in the Japan market and also
submitted JDMF of Milnacipran HCL in the country.
The Oncology business based out of Argentina filed 41 product
dossiers for various countries.
Research & Development
Signed an outlicensing agreement with Sanofi for GBR 500, its novel
monoclonal antibody for Crohn’s disease and other anti inflammatory
diseases for a landmark deal size of USD 613 million receiving USD 50
million as upfront payment .
Crofelemer, a first-in-class anti-diarrheal drug, entered Pivotal trials for
Adult Acute Diarrhea including Cholera. Glenmark has exclusive
Crofelemer rights for diarrhea indications in nearly 140 countries
including India and is the sole API supplier globally for Crofelemer
(ex-China).
Initiated Phase IIb studies for Revamilast, our PDE4 inhibitor in Asthma
and Rheumatoid Arthritis in multiple countries for each indication.
The Phase IIb study for Asthma will report in this financial year.
Successfully completed Phase I trials for its novel molecule ‘GRC
17536’ a potentially first in class molecule targeting TRPA1 receptor
for pain and respiratory conditions in Netherlands. We have also
obtained approval for Phase II proof of concept study in pain
indication in the UK (MHRA) and awaiting approval in Germany
(BfArM).
Completed Phase I trial for GRC 15300 – a TRPV3 Inhibitor for
treatment of pain in the UK. This is the first TRPV3 inhibitor which
entered clinical trials. This molecule is outlicensed to Sanofi.
Formulations Business
The Indian Formulations business recorded one of the highest growth
among the top 25 companies in the country as per IMS.
Launched in India, over 20 key products viz. in its core therapeutic
areas of Oncology, Dermatology, Respiratory and Cardiovascular.
Glenmark entered into an exclusive licensing agreement with IDC,
a leading Canadian company for a range of high end Dermatology
products and launched the Cosmocare division in India to strengthen
its Dermatology / Cosmetology franchise of Glenmark.
‘Respicare’ – Glenmark’s Respiratory Division launched to consolidate
Glenmark’s presence in the acute care segment.
Registered ten products in the Asia region during the year which will
drive the growth in FY 2013
Despite challenges in the business environment; Glenmark’s Africa &
Middle East operations recorded strong secondary sales growth of
over 40% backed by its power brands strategy.
Glenmark Russia is now among the top 20 pharma companies in
Dermatology in the country and one of the fastest growing
pharmaceutical company in Russia.
In Central Eastern Europe, Glenmark launched 6 products in Czech /
Slovak; Entered the Dermatology segment in Poland, CNS segment in
Romania and Cardiovascular segment in Hungary
In Latam, Brazil, the largest subsidiary contributing over 70% of sales
from LatAm region, grew by over 30%.
Glenmark Venezuela gained 21 ranks in the IMS ranking and is now
ranked 74 in the country.
Generics Business
Glenmark Generics Inc., U.S.A. registered an increase of 45% in
revenue from sale of finished dosage formulations over the
corresponding previous year.
Glenmark Europe launched over 15 products across European markets,
including the United Kingdom
GGI, US launches a portfolio of 12 products (semi solid preparations, oral contraceptives,
extended release and immediate release items)
*SCRIP is one of the leading pharmaceutical magazines in the world
SCRIP Awards, 2011:Best Pharma Company in an Emerging Market
SCRIP Awards, 2011:Best Overall Pipeline
Glenmark, in recognition of its world class R&D Capabilities and Business Performance, was awarded the ‘Best Pharma Company in an Emerging Market’ and ‘Best Overall Pipeline’ at SCRIP Awards 2011, London.
In Pursuit of Excellence
Annual Report2011-1210

We, at Glenmark, have always believed that innovation is the only way to build a truly global organization that delivers outstanding results.In line with this belief, Glenmark’s ground-breaking drug discovery e�ort is focused in the therapeutic areas of In�ammation, Pain and Oncology. Today, Glenmark has a pipeline of six molecules in clinical development - both Novel Chemical Entities and Monoclonal Antibodies and most being �rst-in-class globally. Glenmark has followed the strategy of developing and out-licensing of its own molecules in various stages of clinical development to large global multinationals. The six out-licensing deals concluded till date, earning more than USD 200 mn is a testimony to Glenmark’s e�orts and capabilities in this area. This has helped build Glenmark’s reputation as an innovation driven organization worldwide.Glenmark’s R&D centers are well equipped to deliver innovation by combining cutting edge technology, state-of-the-art infrastructure, and the brightest minds in the business. The R&D Team of several scientists spread across �ve R&D facilities operate in an integrated manner to provide the creative strength and energy to our business. They are the key to achieving our strategic research and development objectives in today’s rapidly changing environment. Glenmark’s research e�orts are focussed on both Innovation R&D and Generics R&D.
In the FY 12, Glenmark was granted approval of 14 Abbreviated New
Drug Applications (ANDA), which comprised of 12 final and 2
tentative approvals in the US.
In the US, Glenmark successfully launched 12 products during fiscal
year 2012 consisting of a mix of semi-solid preparations,
oral-contraceptives, extended release, and immediate release items.
It also includes the exclusive launch of Atovaquone Proguanil tablets
250mg/100mg, their generic version of Malarone® tablets, under a
royalty-bearing license from GSK. In March 2012, the Company
initiated the exclusive launch of Fluticasone Propionate lotion, their
generic version of Nycomed’s Cutivate® lotion.
Glenmark has one of the largest Dermatology (19 approvals) and Oral
Contraceptives (10 approvals) product portfolios in the US.
Glenmark Europe launched over 15 products across European
markets, including the United Kingdom.
Glenmark successfully signed 10 deals for licensing out and supply of
products in EU markets.
The API business launched Telmisartan in Europe and Canada
through two global generic players. The business continued its
leadership position for Lercanidipine, Topiramate and Amiodarone,
combined with launches of new products during the year viz.
Atovaquone, Ropinirole, Riluzole and Terbinafine.
The API business registered its first sale in the Japan market and also
submitted JDMF of Milnacipran HCL in the country.
The Oncology business based out of Argentina filed 41 product
dossiers for various countries.
Research & Development
Signed an outlicensing agreement with Sanofi for GBR 500, its novel
monoclonal antibody for Crohn’s disease and other anti inflammatory
diseases for a landmark deal size of USD 613 million receiving USD 50
million as upfront payment .
Crofelemer, a first-in-class anti-diarrheal drug, entered Pivotal trials for
Adult Acute Diarrhea including Cholera. Glenmark has exclusive
Crofelemer rights for diarrhea indications in nearly 140 countries
including India and is the sole API supplier globally for Crofelemer
(ex-China).
Initiated Phase IIb studies for Revamilast, our PDE4 inhibitor in Asthma
and Rheumatoid Arthritis in multiple countries for each indication.
The Phase IIb study for Asthma will report in this financial year.
Successfully completed Phase I trials for its novel molecule ‘GRC
17536’ a potentially first in class molecule targeting TRPA1 receptor
for pain and respiratory conditions in Netherlands. We have also
obtained approval for Phase II proof of concept study in pain
indication in the UK (MHRA) and awaiting approval in Germany
(BfArM).
Completed Phase I trial for GRC 15300 – a TRPV3 Inhibitor for
treatment of pain in the UK. This is the first TRPV3 inhibitor which
entered clinical trials. This molecule is outlicensed to Sanofi.
Formulations Business
The Indian Formulations business recorded one of the highest growth
among the top 25 companies in the country as per IMS.
Launched in India, over 20 key products viz. in its core therapeutic
areas of Oncology, Dermatology, Respiratory and Cardiovascular.
Glenmark entered into an exclusive licensing agreement with IDC,
a leading Canadian company for a range of high end Dermatology
products and launched the Cosmocare division in India to strengthen
its Dermatology / Cosmetology franchise of Glenmark.
‘Respicare’ – Glenmark’s Respiratory Division launched to consolidate
Glenmark’s presence in the acute care segment.
Registered ten products in the Asia region during the year which will
drive the growth in FY 2013
Despite challenges in the business environment; Glenmark’s Africa &
Middle East operations recorded strong secondary sales growth of
over 40% backed by its power brands strategy.
Glenmark Russia is now among the top 20 pharma companies in
Dermatology in the country and one of the fastest growing
pharmaceutical company in Russia.
In Central Eastern Europe, Glenmark launched 6 products in Czech /
Slovak; Entered the Dermatology segment in Poland, CNS segment in
Romania and Cardiovascular segment in Hungary
In Latam, Brazil, the largest subsidiary contributing over 70% of sales
from LatAm region, grew by over 30%.
Glenmark Venezuela gained 21 ranks in the IMS ranking and is now
ranked 74 in the country.
Generics Business
Glenmark Generics Inc., U.S.A. registered an increase of 45% in
revenue from sale of finished dosage formulations over the
corresponding previous year.
Pioneering innovation thatsets global benchmarks
Innovation
Annual Report2011-1211
Innovation R&D
Glenmark has three dedicated R&D centres for drug discovery and
development.
NCE R&D Centre, India
Glenmark R&D centre situated on the outskirts of Mumbai is spread
over 1,25,000 sq feet with a number of scientists working on multiple
targets in broad therapeutic areas of pain and inflammation
The research facility is equipped with modern infrastructure and the
expertise required to carry out NCE (Novel Chemical Entity) Discovery
and Development activities ranging from target selection to clinical
development and other research activities like medicinal chemistry,
process & analytical chemistry, in-vitro & in-vivo studies and project
management. This centre has been responsible for taking several
molecules to clinics and is credited for five out of the six outlicensing
deals concluded by Glenmark.
Biopharmaceutical R&D Centre, Switzerland is dedicated to the
development of Biopharmaceuticals with a special focus on
developing novel Monoclonal Antibodies. The key capabilities of the
centre include Antibody Screening, Antibody Engineering, Cell Line
Development and Biological assay development process supported
by a state-of-the-art Quality Control & Analytics Department.
Clinical R&D Centre, UK focuses on both New Biological Entities
(NBEs) and New Chemical Entities (NCEs) and serves as the global
centre for Clinical Development for Glenmark. In addition to this, it
also hosts leadership teams for toxicology, regulatory affairs and
pharmacovigilance.
Generics R&D
Glenmark is committed to the cause of developing special and
differentiated formulations for global markets through its R&D
centres for generic formulations.
Sinnar, India
This facility focuses on developing Specialty / Branded Formulations
for the global market with the capability of developing all kinds of
dosage forms, including niche ones like nano particles, pMDIs, DPIs
and nasal sprays.
Taloja, India
This state-of-the-art integrated R&D Centre spanning 1,70,000 sq. ft.
is dedicated to developing APIs and Formulated products for GGL.
This centre is capable of developing all types of Finished Forms
ranging from conventional Oral Solid Dosages to Suspensions to
Liquid Injectables and Technology driven Extended Release products.
Turbhe, India
The Clinical Research Unit conducts human volunteer bioavailability /
bioequivalence studies as part of its regulatory submissions to
countries including the United States, Brazil and the European Union.
This Clinical Research unit has been approved by global regulatory
authorities which include the DCGI (India), FDA (US), ANVISA (Brazil)
and MHRA (UK).
Glenmark’s R&D centers are well equipped to deliver innovation by combining cutting edge
technology, state-of-the-art infrastructure and the brightest minds in the business
NBE R&D Centre, Switzerland NCE R&D Centre, India

Annual Report2011-1212
Innovation Research Pipeline
Primary Indication
NCE
Preclinical Phase I Phase II Phase III Approval
Creating a world of possibilities
Asthma
Rheumatoid Arthritis (RA)
Reva
mila
stPD
E IV
Inhi
bito
rG
RC 1
7536
TRPA
1 In
hibi
tor Neuropathic Pain
Respiratory Disorders
Chronic Pain
GBR
900
TrkA
Ant
agon
ist
(MA
b)
Adult Acute InfectiousDiarrhea incl. Cholera
HIV related Diarrhea
Crof
elem
er*
CFTR
Inhi
bito
r
NBE
* In-licensed from Napo Pharamaceuticals
Ulcerative Colitis
Vate
lizum
abVL
A -2
Ant
agon
ist
(mA
b)
Neuropathic Pain
GRC
153
00TR
PV-3
Ant
agon
ist
Out-licensed to Sano�
Out-licensed to Sano�
Annual Report2011-1213
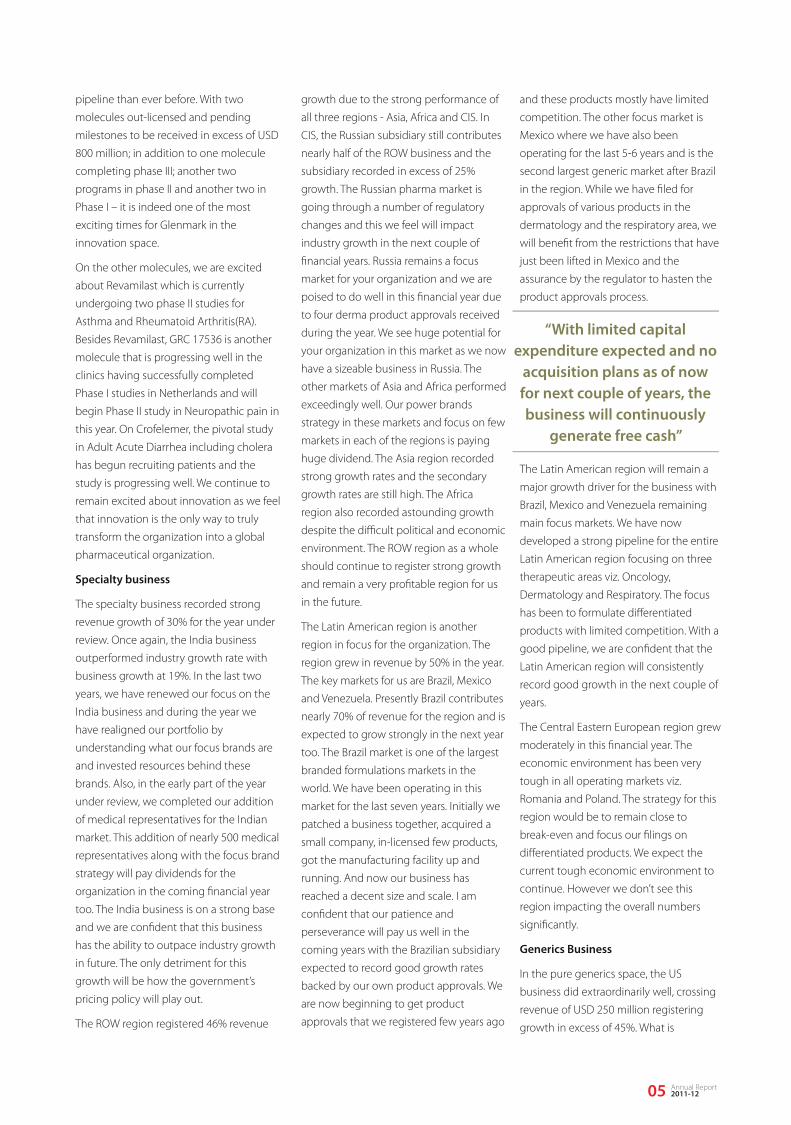
Potential Peak SalesHighlights of Program Disease Incidence / Market
> USD 1 Bnworldwide
300 Mn patients globallyMarket: USD 15 Bn
> USD 2 Bnworldwide
> USD 1 Bnworldwide
• Initiated a global phase IIb trial in 4 countries in Europe and in India• Revamilast is a non-steroidal oral drug with good safety profile; therapy presently dominated by inhaled formulations
• Initiated global phase II b trials in 5 countries in Europe and Asia• Phase IIb studies are expected to be completed in Q4, FY 2012-13
> 20 Mn patients globallyMarket: USD 13 Bn
> 40 Mn patients worldwideMarket: USD 2 Bn
> USD 2 Bnworldwide
> USD 2 Bnworldwide
• Successful completion of phase I study in Europe; Molecule shows good safety and pharmacokinetic pro�le• Completed regulatory submissions for phase II with MHRA- UK, BFARM – Germany for Diabetic Peripheral Neuropathic Pain
• To be tested via the inhaled route for respiratory condition• Phase I enabling toxicity studies via inhalation route nearing completion• Plans to initiate human inhalation studies by Q2, FY 2013
300 Mn patients globallyMarket: USD 15 Bn
> 100 Mn Chronic Pain patients globally Pain Market: > USD 25 Bn
> USD 1 Bnworldwide
• First-in-class opportunity with a novel mechanism for treatment of pain; potential for better e�cacy• Significant and long-lasting analgesic effects in several animal models.
USD 80 Mn inROW countries
To Be Estimated
• First-in-class, First-in-disease molecule for HIV related diarrhea• Fast track status granted by the US-FDA; FDA’s decision on NDA in Sep ‘12
• Pivotal study in over 700 patients; Dosing in patients commenced• Study expected to be completed in early FY 2013 – 14
10 Mn patients globally
Diarrheal disease incidence in Emerging Markets is estimated at 3870.20 Mn
> 1.5 Mn patients globally with about 750,000 in the US aloneMarket: USD 3 Bn
> USD 2 Bnworldwide
• Novel mechanism with broad anti-inflammatory potential• First in class opportunity: No other monoclonal antibody (mAb) against same target• An application will be filed by Sanofi in Q1, FY 2013 to initiate a PoC trial in Ulcerative Colitis in US and other countries
> 40 Mn patients worldwide Market: USD 5 Bn
> USD 2 Bnworldwide
• Potential First-in-class opportunity• Globally the only reported TRPV3 antagonist molecule to complete phase I• A phase IIa Proof of Concept study in Neuropathic pain will be initiated in Q1, FY 2012 -13

Child Health
Glenmark identified child health as a major national and international issue over three years ago particularly the age group of 0 – 5 years which are the foundation years for a healthy life. This flagship program titled “Healthier Children Healthier World” focuses on children of this age group and addresses the issue through interventions which target malnutrition, immunization and sanitation. As Infant and Child Mortality are important indicators of child health we began focussing on states where the IMR and CMR is higher than the national average.
Glenmark has initiated three major child health programs in this �nancial year in the states of Madhya Pradesh, Rajasthan and in the city of Mumbai. These interventions are focused on encouraging a positive health seeking behaviour of the target population which includes pregnant mothers, mothers with infants and caregivers such as ASHA workers and Aanganwadi workers towards right nutrition, good hygiene practices and complete immunization for children between the age group 0-5 years. In order to deliver maximum impact, the foundation follows the strategy of complementing the Government’s Integrated Child Development Scheme (ICDS) by conducting health education sessions for mothers and caregivers, developing Information, Education and Communication (IEC) material in local language, conducting street plays
and puppet shows. It also uses a service delivery component to make maximum impact in the targeted population. Some of the service delivery mechanisms includes the provision of ambulatory care, doctor counselling sessions, interaction with nutritionists, health camps in far flung areas with accessibility issues and addressing anaemia in mothers. The Child Health programme enables Glenmark to reach out to a population of 300,000 in 100 villages in Khandwa, MP; 150 villages in Sanganer, Rajasthan; and 2000 households in Andheri slums in Mumbai.
Sustainable Livelihood
Creating Sustainable livelihoods is the other CSR initiative identified by Glenmark. Presently Glenmark runs three initiatives in this area where one initiative focuses on providing vocation training for school dropouts, another focuses on enabling the physically challenged to become productive and the last initiative focuses on sustainable livelihoods for Below-The-Poverty line families.
Nashik, Maharashtra: The project is focussed on the skill development of school and college dropouts. Last year, over 650 youth were trained in various trades viz. computer basics, auto repair, mobile repairing, nursing etc. By providing them relevant vocational training, these students will be able to acquire a sustainable livelihood so that they can take care of their families.
Jaipur, Rajasthan: Glenmark believes in inclusive development of the whole society with each member having an equal opportunity to lead a productive life. Through our association with Jaipur Foot,in this financial year we have been able to rehabilitate 3250 individuals who were able to walk once again and lead a productive life.
Rayagada, Odisha: Through capacity building, improvement in crop yields and helping them generate more sources of income, this project in Odisha focuses on below-the-poverty line tribal families covering 2000 households.
Employee Volunteering
Each year, Glenmark sensitizes its employees to various social causes by providing them an opportunity to interact with the less priviledged sections of the society through an NGO. This year, over 750 employees across the globe came forward and spent time on employee volunteering on various different child health projects.
Other Initiatives
Through our other CSR initiatives, we have been providing medical aid by donating medicines to the poor, needy and disaster hit on a regular basis. Americares, Navjeet Bandra Community Health Centre, Sri Satya Sai, Ram Krishna Mission and Prison Ministry of India are few of the many NGOs and civil society groups we partner with to conduct health camps and donate medicines.
Glenmark’s CSR function is led by the vision to enrich lives to create a healthy and a happier world. Committed to being a socially responsible organization, Glenmark Foundation (the CSR arm of the Glenmark Group) engages in strategizing, implementing and creating social impact through various community based programmes. Glenmark’s key areas de�ned for delivering an impact are.1. Child Health2. Sustainable livelihood for the marginalized and vulnerable sections of society
Corporate Social Responsibility
Annual Report2011-1214
A strong foundation encompassing a healthier community
in local language, conducting street plays
The world economy has entered a very difficult phase characterized
by significant downside risks and fragility. The financial turmoil
generated by the intensification of the fiscal crisis in Europe has
spread to both developing and high-income countries, and is
generating significant headwinds. Capital flows to developing
countries have declined by almost half as compared to last year,
Europe appears to have entered recession, and growth in several
major developing countries (Brazil, India, and to a lesser extent Russia,
South Africa and Turkey) has slowed partly in reaction to domestic
policy tightening. As a result, and despite relatively strong activity in
the United States and Japan, global growth and world trade have
slowed sharply.
IMF in its recent report has projected lower growth in 2012 for the
world economy. It forecasts a global economic growth of 3.5% in
2012 against an estimated growth of 3.9% in 2011. The U.S and Euro
economies are projected to grow at 2.1% and - 0.3% respectively.
The negative growth forecast for the Euro area is concerning.
Moreover, growth in emerging economies is also expected to come
down marginally as compared to 2011. The outlook for global
economic growth dipping below 2011 levels does not augur well and
is reflective of the challenges being faced.
The prospects for the global economy in 2012 remain uncertain
despite positive signals in North America. This is especially due to
doubts about the outcome of the euro crisis, which are likely to
dampen investment activity. The high levels of private and public
debt in many countries will probably also have a negative impact on
demand. A significant increase in the oil price during the year would
further weaken the economy. In contrast, the highly expansionary
monetary policy is expected to continue supporting growth.
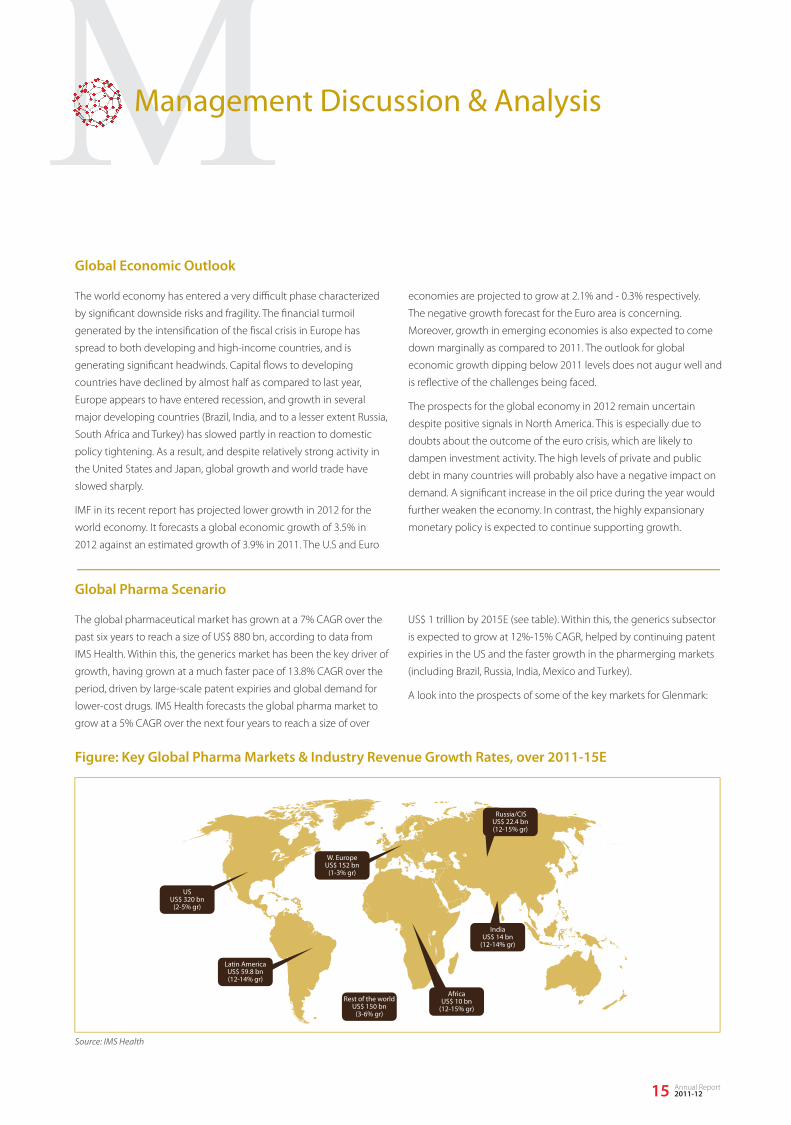
The global pharmaceutical market has grown at a 7% CAGR over the
past six years to reach a size of US$ 880 bn, according to data from
IMS Health. Within this, the generics market has been the key driver of
growth, having grown at a much faster pace of 13.8% CAGR over the
period, driven by large-scale patent expiries and global demand for
lower-cost drugs. IMS Health forecasts the global pharma market to
grow at a 5% CAGR over the next four years to reach a size of over
US$ 1 trillion by 2015E (see table). Within this, the generics subsector
is expected to grow at 12%-15% CAGR, helped by continuing patent
expiries in the US and the faster growth in the pharmerging markets
(including Brazil, Russia, India, Mexico and Turkey).
A look into the prospects of some of the key markets for Glenmark:
Global Economic Outlook
Global Pharma Scenario
Figure: Key Global Pharma Markets & Industry Revenue Growth Rates, over 2011-15E
Annual Report2011-1215
Management Discussion & Analysis
IndiaUS$ 14 bn
(12-14% gr)
AfricaUS$ 10 bn
(12-15% gr)Rest of the world
US$ 150 bn(3-6% gr)
Russia/CISUS$ 22.4 bn(12-15% gr)
W. EuropeUS$ 152 bn
(1-3% gr)
USUS$ 320 bn
(2-5% gr)
Latin AmericaUS$ 59.8 bn(12-14% gr)
Source: IMS Health
US Generics: Signi�cant generics opportunity until 2015
2012 may see the biggest patent expires, but significant generics
opportunity at least until 2015 will sustain momentum of growth in
the US.
We believe that the growth momentum will be sustained in the US
market owing to:
1. Continuing patent expiries and Para-IV challenges over 2012-15,
providing fresh launch opportunities.
2. Ability to garner greater market share in the US generics market.
3. Focus on limited-competition therapeutic areas like dermatology,
oral contraceptives and oncology.
The last two factors, in our view, should continue to sustain growth
even beyond the patent cliff period of 2015 (which is when the
number of generic launch opportunities is likely to reduce as the
patent expiries begin to recede).
Domestic Indian Market to sustain the growth momentum
We believe that the growth rate for the domestic Indian pharma
market is set to rise over the medium term due to factors like
continued new product launches by Indian firms and measured by
them on improving effectiveness of field force additions. Although,
the pricing environment hitherto, a favourable one, may pose some
challenges with issues like Draft National Pharmaceutical Pricing
Policy (NPPP) 2011 coming to the fore.
The domestic pharma market has grown at a 14% CAGR over the past
18 years. However, drug consumption per capita in India is still among
the lowest globally. Even adjusting for India having the lowest prices
in the world, the per capita consumption volumes are estimated to
be 8 -12x lower than in the US and Japan. Hence, there is tremendous
room for growth for the Indian industry.
ROW Markets: Signi�cant opportunities for Growth
Since growth from the US market may begin to taper from 2015,
possessing critical mass in the ROW market by 2015 may become a
prerequisite to maintain the current growth trajectory for global
pharma companies. Most of the “pharmerging” markets like Brazil,
Mexico, Russia and other CIS countries, have a predominantly
branded generics market. This, in our view, will be beneficial to
companies like Glenmark as we have a deep understanding of the
branded generics model and the profitable nature of the branded
generics markets may also mean that profitability or cash returns may
not be hit from exposure to these markets.
Innovation: a critical success factor
Innovation leading to new drugs is critical to meeting unmet medical
need. Existing drugs will continue to be important in meeting the
growing demand for healthcare, particularly with the increasing use
of generic medication. At the same time, advances in disease
understanding and the application of new technologies will be
required to ensure the delivery of new medicines. Such approaches
include personalized healthcare and predictive science as well as new
types of therapy. The challenges of Improving R&D productivity is a
critical challenge for the pharmaceutical industry.
Annual Report2011-1216
Current portion of Long Term Liabilities:
Re-classification of Long Term Debts due for payments during next
year has been considered under current portion of long term
liabilities resulting in increase in current portion of Long Term debts
to ` 2445.74 mn (PY ` 111.70 mn)
Other Current Liabilities:
Other Current Liabilities includes Statutory dues of ` 179.02 mn
(PY ` 147.24 mn); Employee dues of ` 130.64 mn (PY ` 117.34 mn);
Accrued expenses of ` 509.10 mn (PY ` 365.63 mn); Other liabilities of
` 623.49 mn (PY ` 286.01 mn) and Unclaimed dividend of
` 3.68 mn (PY ` 3.66 mn) resulting increase to ` 1445.93 mn in FY 12
compared with ` 919.88 mn in FY 11.
Provisions:
Provisions decreased to ` 106.26 mn (PY ` 116.24 mn).
Long Term Liability (excluding Current portion of borrowings):
Long Term Liability includes Notes payable of ` 1.70 mn (PY ` 3.24 mn)
and Term loan from Banks of ` 13123.00 mn (PY ` 6167.42 mn)
Other Non-Current Liabilities:
Other Non-Current Liabilities includes Income received in advance of
` 743.89 mn (PY ` Nil) and Security deposit of ` 35.93 mn (PY ` 31.83
mn), resulting in overall increase to ` 779.82 mn (PY ` 31.83 mn).
Employee Obligations:
Employee Obligations includes Provisions for gratuity benefit plan of
` 132.63 mn (PY ` 59.41 mn) and Others of ` 13.14 mn (PY ` 9.61 mn),
resulting in overall increase to ` 145.77 mn (PY ` 69.02 mn).
Cash and Bank Balance:
Cash and bank balance increased to ` 3253.46 mn
(PY ` 1986.26 mn).
Account Receivables (Net):
Accounts Receivables increased to ` 12436.07 mn (PY ` 11308.14 mn)
was mainly attributable to the increased revenue in the various
overseas markets.
Inventory:
Materials inventory increased to ` 2544.07 mn (PY ` 2340.07 mn)
mainly to support the increase in sale of formulation and API business.
Finished goods and work-in-process inventory decrease to ` 5332.63
mn (PY ` 5730.05 mn).
Other Current Assets:
Other Current Assets includes input taxes receivables ` 661.83 mn
(PY ` 822.05 mn); Advances to vendors ` 1266.48 mn (PY ` 406.96 mn);
Short Term Deposits ` 109.13 mn (PY ` 109.00 mn); Other receivables
` 88.69 mn (PY ` 605.16 mn); Deposits and Advances receivable in
cash & kind ` 3245.35 mn (PY ` 2029.48 mn).
Property, Plant & Equipment:
The gross block increased to ` 15974.93 mn (PY ` 13945.78 mn)
on account of addition to the tune of ` 1812.38 mn and translation
adjustment of ` 216.77 mn.
Intangible Assets:
The value of Intangible Assets increased to ` 12409.31 mn
(PY ` 10739.45 mn) on account of addition to tune of ` 638.03 mn &
translation adjustment of ` 1031.83 mn.
Material Consumed and Purchase of traded goods:
Cost of Material consumed including Finished goods purchased were
at ` 13453.97 mn as against ` 9918.32 mn in the previous year and as
a percentage to sale was at 36% as against 35% of previous year.
The marginal increase in consumption including finished goods
purchased was attributable to change in the sales mix and product
mix during the year.
Employee Cost:
Employee Cost was at ` 6288.95 mn as against ` 5101.65 mn an
increase of 23% mainly attributed to increase in head count due to
expansion of business and inflationary trends prevailing in the
markets in which the Company operates.
Research & Development Expenditure:
The total R & D expenditure in the P & L was ` 2916.25 mn in
FY 11-12 as compared to ` 1380.47 mn in FY 2010 -11.
In FY 11-12, approximately 60% of total R&D expenditure was spent
towards innovation R&D and balance 40% was incurred on overall
Generics R&D. Total R&D expenditure as a percentage to revenue for
the company was 7.25% for FY 11-12
Other Expenses:
Other Expense includes Manufacturing Overheads, Selling and
Marketing Expenses, Administrative and General Expenses, R&D
Expenses, foreign exchange losses and payment to Paul Capital
Royalty Fund to purchase the right to receive royalty on certain
derma product portfolio as per the terms of the agreement with
them.
The Expenditure increased to ` 13319.88 mn as against ` 8548.19 mn
an increase of 55.82%. The increase in expenditure was mainly
attributed to payment of ` 1316.80 mn to Paul Capital, increase in
selling & marketing expenditure to support growth, R&D expenditure
to provide strong Product Portfolio and exchange losses due to global
recessionary trends and weakness of Rupee as against the US Dollar.
Depreciation:
Depreciation increased marginally to ` 978.78 mn as against
` 946.78 mn during the year.
Finance Costs:
Interest Expenses showed a decline of 8.66% at ` 1465.67 mn as
against ` 1604.55 mn. The decline in interest cost is attributed to
re-shuffling of debt portfolio from short term domestic loans to long
term foreign currency loans.
Pro�t after tax:
There was marginal increase in Profit after tax. Profit after tax for the
year was at ` 4643.07 mn as against ` 4578.33 mn in the
previous year.
Dividend:
The Board of Directors have recommended a final dividend of 200%
(` 2 per equity share of ` 1 each) on the equity share capital as at
31 March 2012 subject to the approval of shareholders.
Equity Capital:
The equity capital has increased from ` 270.27 mn in FY 11 to
` 270.53 mn due to allotment of equity on conversion 263450 stock
options.
Accounts Payable:
Accounts Payable increased to ` 7888.29 mn (PY ` 6574.06 mn) on
account of the increase in the consumption of Materials and purchase
of Finished Goods.
Current Tax Liabilities:
Current Tax Liabilities increased to ` 256.63 mn (PY ` 66.44 mn).
Short Term Borrowings:
Short Term Borrowings decreased to ` 6874.57 mn (PY ` 14802.26 mn)
on account of reshuffling of debt portfolio from Short Term domestic
Loan to Long Term Foreign Currency Loans.
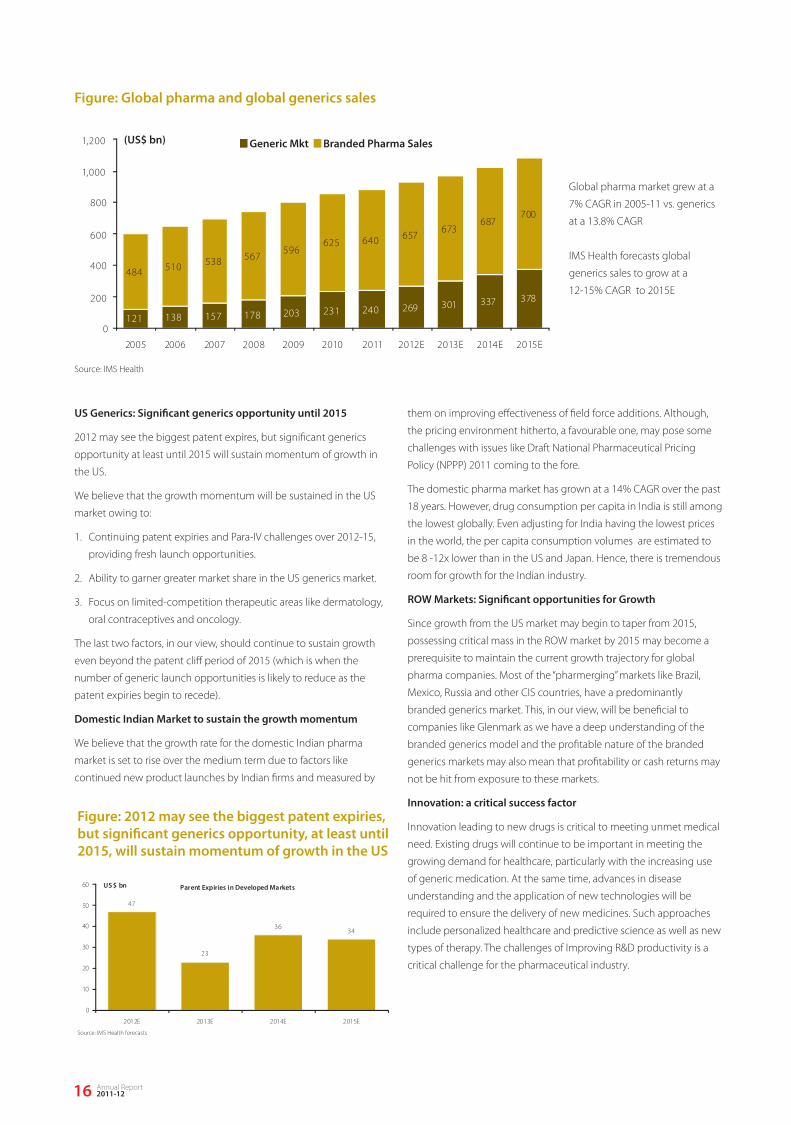
Figure: Global pharma and global generics sales
121 138 157 178 203 231 240 269 301 337 378
484 510 538 567596
625 640 657673
687700
0
200
400
600
800
1,000
1,200 (US$ bn) Generic Mkt Branded Pharma Sales
Source: IMS Health
Figure: 2012 may see the biggest patent expiries,but signi�cant generics opportunity, at least until2015, will sustain momentum of growth in the US
Parent Expiries in Developed Markets
47
23
3634
0
10
20
30
40
50
60 US $ bn
Source: IMS Health forecasts
Global pharma market grew at a
7% CAGR in 2005-11 vs. generics
at a 13.8% CAGR
IMS Health forecasts global
generics sales to grow at a
12-15% CAGR to 2015E

Annual Report2011-1217
Current portion of Long Term Liabilities:
Re-classification of Long Term Debts due for payments during next
year has been considered under current portion of long term
liabilities resulting in increase in current portion of Long Term debts
to ` 2445.74 mn (PY ` 111.70 mn)
Other Current Liabilities:
Other Current Liabilities includes Statutory dues of ` 179.02 mn
(PY ` 147.24 mn); Employee dues of ` 130.64 mn (PY ` 117.34 mn);
Accrued expenses of ` 509.10 mn (PY ` 365.63 mn); Other liabilities of
` 623.49 mn (PY ` 286.01 mn) and Unclaimed dividend of
` 3.68 mn (PY ` 3.66 mn) resulting increase to ` 1445.93 mn in FY 12
compared with ` 919.88 mn in FY 11.
Provisions:
Provisions decreased to ` 106.26 mn (PY ` 116.24 mn).
Long Term Liability (excluding Current portion of borrowings):
Long Term Liability includes Notes payable of ` 1.70 mn (PY ` 3.24 mn)
and Term loan from Banks of ` 13123.00 mn (PY ` 6167.42 mn)
Other Non-Current Liabilities:
Other Non-Current Liabilities includes Income received in advance of
` 743.89 mn (PY ` Nil) and Security deposit of ` 35.93 mn (PY ` 31.83
mn), resulting in overall increase to ` 779.82 mn (PY ` 31.83 mn).
Employee Obligations:
Employee Obligations includes Provisions for gratuity benefit plan of
` 132.63 mn (PY ` 59.41 mn) and Others of ` 13.14 mn (PY ` 9.61 mn),
resulting in overall increase to ` 145.77 mn (PY ` 69.02 mn).
Cash and Bank Balance:
Cash and bank balance increased to ` 3253.46 mn
(PY ` 1986.26 mn).
Account Receivables (Net):
Accounts Receivables increased to ` 12436.07 mn (PY ` 11308.14 mn)
was mainly attributable to the increased revenue in the various
overseas markets.
Inventory:
Materials inventory increased to ` 2544.07 mn (PY ` 2340.07 mn)
mainly to support the increase in sale of formulation and API business.
Finished goods and work-in-process inventory decrease to ` 5332.63
mn (PY ` 5730.05 mn).
Other Current Assets:
Other Current Assets includes input taxes receivables ` 661.83 mn
(PY ` 822.05 mn); Advances to vendors ` 1266.48 mn (PY ` 406.96 mn);
Short Term Deposits ` 109.13 mn (PY ` 109.00 mn); Other receivables
` 88.69 mn (PY ` 605.16 mn); Deposits and Advances receivable in
cash & kind ` 3245.35 mn (PY ` 2029.48 mn).
Property, Plant & Equipment:
The gross block increased to ` 15974.93 mn (PY ` 13945.78 mn)
on account of addition to the tune of ` 1812.38 mn and translation
adjustment of ` 216.77 mn.
Intangible Assets:
The value of Intangible Assets increased to ` 12409.31 mn
(PY ` 10739.45 mn) on account of addition to tune of ` 638.03 mn &
translation adjustment of ` 1031.83 mn.
Material Consumed and Purchase of traded goods:
Cost of Material consumed including Finished goods purchased were
at ` 13453.97 mn as against ` 9918.32 mn in the previous year and as
a percentage to sale was at 36% as against 35% of previous year.
The marginal increase in consumption including finished goods
purchased was attributable to change in the sales mix and product
mix during the year.
Employee Cost:
Employee Cost was at ` 6288.95 mn as against ` 5101.65 mn an
increase of 23% mainly attributed to increase in head count due to
expansion of business and inflationary trends prevailing in the
markets in which the Company operates.
Research & Development Expenditure:
The total R & D expenditure in the P & L was ` 2916.25 mn in
FY 11-12 as compared to ` 1380.47 mn in FY 2010 -11.
In FY 11-12, approximately 60% of total R&D expenditure was spent
towards innovation R&D and balance 40% was incurred on overall
Generics R&D. Total R&D expenditure as a percentage to revenue for
the company was 7.25% for FY 11-12
Other Expenses:
Other Expense includes Manufacturing Overheads, Selling and
Marketing Expenses, Administrative and General Expenses, R&D
Expenses, foreign exchange losses and payment to Paul Capital
Royalty Fund to purchase the right to receive royalty on certain
derma product portfolio as per the terms of the agreement with
them.
The Expenditure increased to ` 13319.88 mn as against ` 8548.19 mn
an increase of 55.82%. The increase in expenditure was mainly
attributed to payment of ` 1316.80 mn to Paul Capital, increase in
selling & marketing expenditure to support growth, R&D expenditure
to provide strong Product Portfolio and exchange losses due to global
recessionary trends and weakness of Rupee as against the US Dollar.
Depreciation:
Depreciation increased marginally to ` 978.78 mn as against
` 946.78 mn during the year.
Finance Costs:
Interest Expenses showed a decline of 8.66% at ` 1465.67 mn as
against ` 1604.55 mn. The decline in interest cost is attributed to
re-shuffling of debt portfolio from short term domestic loans to long
term foreign currency loans.
Pro�t after tax:
There was marginal increase in Profit after tax. Profit after tax for the
year was at ` 4643.07 mn as against ` 4578.33 mn in the
previous year.
Dividend:
The Board of Directors have recommended a final dividend of 200%
(` 2 per equity share of ` 1 each) on the equity share capital as at
31 March 2012 subject to the approval of shareholders.
Equity Capital:
The equity capital has increased from ` 270.27 mn in FY 11 to
` 270.53 mn due to allotment of equity on conversion 263450 stock
options.
Accounts Payable:
Accounts Payable increased to ` 7888.29 mn (PY ` 6574.06 mn) on
account of the increase in the consumption of Materials and purchase
of Finished Goods.
Current Tax Liabilities:
Current Tax Liabilities increased to ` 256.63 mn (PY ` 66.44 mn).
Short Term Borrowings:
Short Term Borrowings decreased to ` 6874.57 mn (PY ` 14802.26 mn)
on account of reshuffling of debt portfolio from Short Term domestic
Loan to Long Term Foreign Currency Loans.
Financial Summary
Glenmark Value Proposition
Glenmark Pharmaceuticals Ltd
Glenmark
APIManufacturing
Pure GenericsBusiness
Key Requisites Low cost; low margins Forging IP challenges
"Push" for products E�cient distribution
P H A R M A C E U T I C A L V A L U E C H A I N
Glenmark Generics moving down the value chain into Pure Generics & API space
Glenmark Pharma moving up the value chain with
Discovery research
Big pharma moving down the value chain by entering the Branded Generics & Pure Generics space
Branded Genericsbusiness
Propriety BrandedBusiness
Key Requisites Innovation Brand Building
"Pull" for products Marketing front end
Annual Report2011-1218
Current portion of Long Term Liabilities:
Re-classification of Long Term Debts due for payments during next
year has been considered under current portion of long term
liabilities resulting in increase in current portion of Long Term debts
to ` 2445.74 mn (PY ` 111.70 mn)
Other Current Liabilities:
Other Current Liabilities includes Statutory dues of ` 179.02 mn
(PY ` 147.24 mn); Employee dues of ` 130.64 mn (PY ` 117.34 mn);
Accrued expenses of ` 509.10 mn (PY ` 365.63 mn); Other liabilities of
` 623.49 mn (PY ` 286.01 mn) and Unclaimed dividend of
` 3.68 mn (PY ` 3.66 mn) resulting increase to ` 1445.93 mn in FY 12
compared with ` 919.88 mn in FY 11.
Provisions:
Provisions decreased to ` 106.26 mn (PY ` 116.24 mn).
Long Term Liability (excluding Current portion of borrowings):
Long Term Liability includes Notes payable of ` 1.70 mn (PY ` 3.24 mn)
and Term loan from Banks of ` 13123.00 mn (PY ` 6167.42 mn)
Other Non-Current Liabilities:
Other Non-Current Liabilities includes Income received in advance of
` 743.89 mn (PY ` Nil) and Security deposit of ` 35.93 mn (PY ` 31.83
mn), resulting in overall increase to ` 779.82 mn (PY ` 31.83 mn).
Employee Obligations:
Employee Obligations includes Provisions for gratuity benefit plan of
` 132.63 mn (PY ` 59.41 mn) and Others of ` 13.14 mn (PY ` 9.61 mn),
resulting in overall increase to ` 145.77 mn (PY ` 69.02 mn).
Cash and Bank Balance:
Cash and bank balance increased to ` 3253.46 mn
(PY ` 1986.26 mn).
Account Receivables (Net):
Accounts Receivables increased to ` 12436.07 mn (PY ` 11308.14 mn)
was mainly attributable to the increased revenue in the various
overseas markets.
Inventory:
Materials inventory increased to ` 2544.07 mn (PY ` 2340.07 mn)
mainly to support the increase in sale of formulation and API business.
Finished goods and work-in-process inventory decrease to ` 5332.63
mn (PY ` 5730.05 mn).
Other Current Assets:
Other Current Assets includes input taxes receivables ` 661.83 mn
(PY ` 822.05 mn); Advances to vendors ` 1266.48 mn (PY ` 406.96 mn);
Short Term Deposits ` 109.13 mn (PY ` 109.00 mn); Other receivables
` 88.69 mn (PY ` 605.16 mn); Deposits and Advances receivable in
cash & kind ` 3245.35 mn (PY ` 2029.48 mn).
Property, Plant & Equipment:
The gross block increased to ` 15974.93 mn (PY ` 13945.78 mn)
on account of addition to the tune of ` 1812.38 mn and translation
adjustment of ` 216.77 mn.
Intangible Assets:
The value of Intangible Assets increased to ` 12409.31 mn
(PY ` 10739.45 mn) on account of addition to tune of ` 638.03 mn &
translation adjustment of ` 1031.83 mn.
Material Consumed and Purchase of traded goods:
Cost of Material consumed including Finished goods purchased were
at ` 13453.97 mn as against ` 9918.32 mn in the previous year and as
a percentage to sale was at 36% as against 35% of previous year.
The marginal increase in consumption including finished goods
purchased was attributable to change in the sales mix and product
mix during the year.
Employee Cost:
Employee Cost was at ` 6288.95 mn as against ` 5101.65 mn an
increase of 23% mainly attributed to increase in head count due to
expansion of business and inflationary trends prevailing in the
markets in which the Company operates.
Research & Development Expenditure:
The total R & D expenditure in the P & L was ` 2916.25 mn in
FY 11-12 as compared to ` 1380.47 mn in FY 2010 -11.
In FY 11-12, approximately 60% of total R&D expenditure was spent
towards innovation R&D and balance 40% was incurred on overall
Generics R&D. Total R&D expenditure as a percentage to revenue for
the company was 7.25% for FY 11-12
Other Expenses:
Other Expense includes Manufacturing Overheads, Selling and
Marketing Expenses, Administrative and General Expenses, R&D
Expenses, foreign exchange losses and payment to Paul Capital
Royalty Fund to purchase the right to receive royalty on certain
derma product portfolio as per the terms of the agreement with
them.
The Expenditure increased to ` 13319.88 mn as against ` 8548.19 mn
an increase of 55.82%. The increase in expenditure was mainly
attributed to payment of ` 1316.80 mn to Paul Capital, increase in
selling & marketing expenditure to support growth, R&D expenditure
to provide strong Product Portfolio and exchange losses due to global
recessionary trends and weakness of Rupee as against the US Dollar.
Depreciation:
Depreciation increased marginally to ` 978.78 mn as against
` 946.78 mn during the year.
Finance Costs:
Interest Expenses showed a decline of 8.66% at ` 1465.67 mn as
against ` 1604.55 mn. The decline in interest cost is attributed to
re-shuffling of debt portfolio from short term domestic loans to long
term foreign currency loans.
Pro�t after tax:
There was marginal increase in Profit after tax. Profit after tax for the
year was at ` 4643.07 mn as against ` 4578.33 mn in the
previous year.
Dividend:
The Board of Directors have recommended a final dividend of 200%
(` 2 per equity share of ` 1 each) on the equity share capital as at
31 March 2012 subject to the approval of shareholders.
Equity Capital:
The equity capital has increased from ` 270.27 mn in FY 11 to
` 270.53 mn due to allotment of equity on conversion 263450 stock
options.
Accounts Payable:
Accounts Payable increased to ` 7888.29 mn (PY ` 6574.06 mn) on
account of the increase in the consumption of Materials and purchase
of Finished Goods.
Current Tax Liabilities:
Current Tax Liabilities increased to ` 256.63 mn (PY ` 66.44 mn).
Short Term Borrowings:
Short Term Borrowings decreased to ` 6874.57 mn (PY ` 14802.26 mn)
on account of reshuffling of debt portfolio from Short Term domestic
Loan to Long Term Foreign Currency Loans.
Products in-licensed in FY 11-12
Imatinib, Zoledronic acid, Temozolamide, Memantine,
Rivastigmine patches, Capecitabine
(IDC Range of Cosmeceutical Products) 9 products
Bezafibrate, Acitretin
Clopidogrel, Danazol, Lactulose , Montelukast
Ciprofloxacin
Itraconazole, Levofloxacin
Molecule Names Countries
Czech Republic, Slovak Republic, Poland, Romania
India and 7 other countries
Brazil
Kenya
Nigeria
UK

Glenmark’s top brands continued to gain rankings in the Indian market as per IMS (MAT Mar 2012)Glenmark’s top brands continued to gain rankings in the Indian market as per IMS (MAT Mar 2012)Glenmark’s top brands continued to gain rankings in the Indian market as per IMS (MAT Mar 2012)Glenmark’s top brands continued to gain rankings in the Indian market as per IMS (MAT Mar 2012)Glenmark’s top brands continued to gain rankings in the Indian market as per IMS (MAT Mar 2012)Glenmark’s top brands continued to gain rankings in the Indian market as per IMS (MAT Mar 2012)
Business Review
Specialty Business
Glenmark’s branded formulations business is currently organized
around four regions – India, Latin America, Central Eastern Europe and
Semi Regulated Markets of Africa/Asia/CIS.
For the year ended 31 March 2012; Specialty formulations business
revenue was at ` 23327.66 mn (USD 483.66 mn) as against
` 16858.15 (USD 367.28 mn) for the corresponding previous period,
registering growth of 38%.
During the financial year, the Specialty Business focused on 3 critical
areas globally:
• People Development: Enhancing the productivity of our most
critical resource - people through training and development
initiatives and ushering in better performance of people across the
value chain.
• Product Pipeline Management: Continuing with our therapeutic
focus strategy, we have strived to enhance the portfolio in focus
segments like Dermatology, Oncology and Respiratory, across
markets.
• Operational Efficiency: With a focus on improving operational
efficiency at all levels of the value chain, we streamlined our field
force and aligned them with our therapeutic focus to enhance
productivity. Greater control was exercised on our in-channel
inventory, as well as receivables management. All these efforts
have resulted in solid secondary sales growth, higher profitability
and better cash flows.
India
Glenmark’s India formulations business surged ahead gaining 3
ranks in FY 12 as per IMS. The company continued to gain market
share in key segments like dermatology, respiratory and
cardiology. While top brands like Telma, Candid and Ascoril
continued to excel, the company launched over 20 products in
focus therapeutic segments to build the foundation of future
growth.
Sales for the formulations business in India increased to ` 10,021.30
mn (USD 206.50 mn) for the financial year as compared to ` 8,446.88
mn (USD 184.03 mn), in the previous corresponding year, recording a
growth of 19% in ` term.
The company registered value growth of 26.4% vis-a-vis the industry
growth of 15% and gained ranks to be at 22nd from 25th rank with
1.71% market share as per MAT Mar 2012. On cumulative basis, the
company is the 2nd fastest growing company among top 20
companies in IPM with significant growth of 33.5%. The growth is
driven by significant gains in market share and rankings of top brands
as per IMS (MAT Mar 2012) data.
• Telma (Telmisartan) gained 15 ranks to be at 80th
• Telma-H (Telmisartan, Hydrochlorothiazide) has gained 52 ranks to
be at 106th
• Candid B (Clotrimazole + Beclomethasone) has gained 27 ranks to
be at 116th and crossed ` 500 mn milestone
• Candid (Clotrimazole) has gained 39 ranks to be at 231st
• Ascoril (Expectorant + Mucolytic) stood at 92nd rank
The company strengthened its presence in following therapeutic
segments with significant growth in market share as per IMS Mat Mar
11’ v/s Mat Mar 12’ respectively. Derma from Market Share (MS) 8.23%
to 8.69%, Cardiac from MS 2.34% to 2.86%, Respiratory – MS 2.65% to
2.84%, Anti-infective – MS from 1.31% to 1.44%, Gynecology – MS
from 1.26% to 1.43%; Pain/Analgesic - MS from 1.0% to 1.08%, and
Anti-diabetic registered MS of 1.45%
The company has further strengthened its presence in IPM across its
core therapeutic area i.e Dermatalogy through launch of Cosmocare
division. The launch of this division will consolidate our presence in
Dermato-cosmoceuticals segment. We also launched a new Respicare
division to consolidate our presence in Acute care prioritizing brand
promotion and launch of Zoltan Care division to strengthen our
presence in Cardiovascular segment through focus approach.
Annual Report2011-1219
Current portion of Long Term Liabilities:
Re-classification of Long Term Debts due for payments during next
year has been considered under current portion of long term
liabilities resulting in increase in current portion of Long Term debts
to ` 2445.74 mn (PY ` 111.70 mn)
Other Current Liabilities:
Other Current Liabilities includes Statutory dues of ` 179.02 mn
(PY ` 147.24 mn); Employee dues of ` 130.64 mn (PY ` 117.34 mn);
Accrued expenses of ` 509.10 mn (PY ` 365.63 mn); Other liabilities of
` 623.49 mn (PY ` 286.01 mn) and Unclaimed dividend of
` 3.68 mn (PY ` 3.66 mn) resulting increase to ` 1445.93 mn in FY 12
compared with ` 919.88 mn in FY 11.
Provisions:
Provisions decreased to ` 106.26 mn (PY ` 116.24 mn).
Long Term Liability (excluding Current portion of borrowings):
Long Term Liability includes Notes payable of ` 1.70 mn (PY ` 3.24 mn)
and Term loan from Banks of ` 13123.00 mn (PY ` 6167.42 mn)
Other Non-Current Liabilities:
Other Non-Current Liabilities includes Income received in advance of
` 743.89 mn (PY ` Nil) and Security deposit of ` 35.93 mn (PY ` 31.83
mn), resulting in overall increase to ` 779.82 mn (PY ` 31.83 mn).
Employee Obligations:
Employee Obligations includes Provisions for gratuity benefit plan of
` 132.63 mn (PY ` 59.41 mn) and Others of ` 13.14 mn (PY ` 9.61 mn),
resulting in overall increase to ` 145.77 mn (PY ` 69.02 mn).
Cash and Bank Balance:
Cash and bank balance increased to ` 3253.46 mn
(PY ` 1986.26 mn).
Account Receivables (Net):
Accounts Receivables increased to ` 12436.07 mn (PY ` 11308.14 mn)
was mainly attributable to the increased revenue in the various
overseas markets.
Inventory:
Materials inventory increased to ` 2544.07 mn (PY ` 2340.07 mn)
mainly to support the increase in sale of formulation and API business.
Finished goods and work-in-process inventory decrease to ` 5332.63
mn (PY ` 5730.05 mn).
Other Current Assets:
Other Current Assets includes input taxes receivables ` 661.83 mn
(PY ` 822.05 mn); Advances to vendors ` 1266.48 mn (PY ` 406.96 mn);
Short Term Deposits ` 109.13 mn (PY ` 109.00 mn); Other receivables
` 88.69 mn (PY ` 605.16 mn); Deposits and Advances receivable in
cash & kind ` 3245.35 mn (PY ` 2029.48 mn).
Property, Plant & Equipment:
The gross block increased to ` 15974.93 mn (PY ` 13945.78 mn)
on account of addition to the tune of ` 1812.38 mn and translation
adjustment of ` 216.77 mn.
Intangible Assets:
The value of Intangible Assets increased to ` 12409.31 mn
(PY ` 10739.45 mn) on account of addition to tune of ` 638.03 mn &
translation adjustment of ` 1031.83 mn.
Material Consumed and Purchase of traded goods:
Cost of Material consumed including Finished goods purchased were
at ` 13453.97 mn as against ` 9918.32 mn in the previous year and as
a percentage to sale was at 36% as against 35% of previous year.
The marginal increase in consumption including finished goods
purchased was attributable to change in the sales mix and product
mix during the year.
Employee Cost:
Employee Cost was at ` 6288.95 mn as against ` 5101.65 mn an
increase of 23% mainly attributed to increase in head count due to
expansion of business and inflationary trends prevailing in the
markets in which the Company operates.
Research & Development Expenditure:
The total R & D expenditure in the P & L was ` 2916.25 mn in
FY 11-12 as compared to ` 1380.47 mn in FY 2010 -11.
In FY 11-12, approximately 60% of total R&D expenditure was spent
towards innovation R&D and balance 40% was incurred on overall
Generics R&D. Total R&D expenditure as a percentage to revenue for
the company was 7.25% for FY 11-12
Other Expenses:
Other Expense includes Manufacturing Overheads, Selling and
Marketing Expenses, Administrative and General Expenses, R&D
Expenses, foreign exchange losses and payment to Paul Capital
Royalty Fund to purchase the right to receive royalty on certain
derma product portfolio as per the terms of the agreement with
them.
The Expenditure increased to ` 13319.88 mn as against ` 8548.19 mn
an increase of 55.82%. The increase in expenditure was mainly
attributed to payment of ` 1316.80 mn to Paul Capital, increase in
selling & marketing expenditure to support growth, R&D expenditure
to provide strong Product Portfolio and exchange losses due to global
recessionary trends and weakness of Rupee as against the US Dollar.
Depreciation:
Depreciation increased marginally to ` 978.78 mn as against
` 946.78 mn during the year.
Finance Costs:
Interest Expenses showed a decline of 8.66% at ` 1465.67 mn as
against ` 1604.55 mn. The decline in interest cost is attributed to
re-shuffling of debt portfolio from short term domestic loans to long
term foreign currency loans.
Pro�t after tax:
There was marginal increase in Profit after tax. Profit after tax for the
year was at ` 4643.07 mn as against ` 4578.33 mn in the
previous year.
Dividend:
The Board of Directors have recommended a final dividend of 200%
(` 2 per equity share of ` 1 each) on the equity share capital as at
31 March 2012 subject to the approval of shareholders.
Equity Capital:
The equity capital has increased from ` 270.27 mn in FY 11 to
` 270.53 mn due to allotment of equity on conversion 263450 stock
options.
Accounts Payable:
Accounts Payable increased to ` 7888.29 mn (PY ` 6574.06 mn) on
account of the increase in the consumption of Materials and purchase
of Finished Goods.
Current Tax Liabilities:
Current Tax Liabilities increased to ` 256.63 mn (PY ` 66.44 mn).
Short Term Borrowings:
Short Term Borrowings decreased to ` 6874.57 mn (PY ` 14802.26 mn)
on account of reshuffling of debt portfolio from Short Term domestic
Loan to Long Term Foreign Currency Loans.
Annual Report2011-1220
Table 1: Key Product Launches: India
Brand Brand Proposition Division
Azifine C (Cefixime + Azithromycin) Majesta strengthening Antibiotic portfolio Majesta
Vorth TP Plus (Tapentadol + Paracetamol) Consolidating presence in Pain Management from severe pain to moderate Pain Integrace
Integrace
Vorth TP (Tapentadol)
Kefpod O (Ofloxacin+Cefpodoxime Proxetil) Management of Typhoid
Alex Cold (Paracetamol+Caffeine+Phenylephrine+Chlorphenamine)
Respicare initiative to focus on Cough & Cold Preparation
Respicare
Glevopod (Levofloxacin + Cefpodoxime)Unique combination for Upper Respiratory Tract Infection
Airtec FB DPI (Formoterol + Budesonide) Asthma/COPD Inhalation Drug
Respiratory
Airtec FF (Formoterol-Fluticasone) Asthma Inhalation Drug
Airtio (Tiotropium Bromide) COPD Inhalation Drug
Airtio F (Formoterol-Tiotropium) COPD Inhalation Drug
Airlevo (Levosalbutamol) Acute Asthma Inhalation Drug
Dosetil (Desonide)Management of Atopic and Seborrheic dermatitis Glenmark
Elovera IMF (Dl-Lactic Acid+Allantoin+Gluconic Acid+Vitamin E+Aloe Barbadensis)
Strengthens Gracewell's equity in Dermatology by launching unique combination in management of Plaque and Palmoplantar Psoraisis Gracewell
Deriva BPO (Benzoyl Peroxide+Adapalene) In the Management of Comedonal Acne
Milical O (Folic Acid+Cyanocobalamin+Calcium Orotate +Zinc)
Calcium Supplement in Pregnancy & Lactation G&G
Dermato-Cosmoceutical Product RangeCosmoceuticals in the Management Anti-Wrinkle, Firming, Complexion Lightener, Sunscreen
Cosmo
ZoltanTelma AMH (Hydrochlorothiazide+Amlodipine+Telmisartan)
Enhancing Zoltan’s equity in management of hypertension
Olmax 3D (Hydrochlorothiazide+Amlodipine+Olmesartan Medoxomil)
Strengthens hypertension portfolio of Healtheon Healtheon
Doriglen ( Doripenem)
Casfung (Caspofungin)
Strengthens Critical Care product basket by introducing the products in the management of Serious Gram Negative Infection Critica
Management of Systemic Fungal Infections
Highlighting Initiatives:
• Launch of MIDAS (Medical Information & Dissemination And Service) to resolve product specific and other medical queries encountered by customers
• Pharmacovigilance initiatives to report adverse events encountered
• Webinars to disseminate product benefits and to address the disease management through top KOLs
• Launch of Glenmark first product website Vwash, (www.vwash.com) is dedicated to women’s intimate health & hygiene, empowering women with knowledge, stating do’s / don’ts regarding woman’s hygiene
• Introduction of Toll free number to bring about awareness among patient on Eczema and Psorasis, the activity strengthen organization perception to be a scientific oriented company among Doctors and end users

Annual Report2011-1221
ROW Markets
Glenmark’s Rest of the World (ROW) operations delivered a stellar
performance across markets clocking growth of 46% in FY 11-12
over the previous �nancial year. The Russian subsidiary continued
to gain ranks. It continued to improve its rankings and emerged
among top 20 pharma companies in the dermatology segment
and among the fastest growing companies in Russia.
In the year under review, Glenmark’s revenues from its ROW
operations increased to ` 5925.52 mn (USD 122.10 mn) from
` 4069.66 mn (USD 88.66 mn) in FY 10-11; registering a growth of
46% in ` terms.
Russia / CIS
During the financial year, the Russian subsidiary registered strong
growth in secondary sales. Acording to Pharmexpert MAT March 2012
data,the subsidiary registered value growth of 17.8% vis-a-vis that of
the industry 17.4% (on a MAT basis). Glenmark is one of the fastest
growing Indian pharma companies in Russia and the company now
ranks 59th in the market, gaining 3 ranks vis-a-vis March 2011.
A more focused approach has been adopted with the creation of two
separate business units for respiratory and dermatology segments.
The secondary sales growth for dermatology products was over 50%
in the financial year. The company launched two Dermatology
products Supirocin and Supirocin B in the third quarter which paved
the way for the establishment of ‘Glenmark Institute of Healthy Skin’.
The company’s market share in the dermatology segment in Russia
increased to 1.75 from 1.56%% vis-à-vis the previous financial year.
On the regulatory front, new packaging design for the products of
dermatology portfolio has been approved and registered.
Furthermore, registration was completed for the cosmetics range of
products, which are planned to be launched in FY 13.
In other CIS markets of Ukraine, Kazakhstan and Uzbekistan; the
positive trend of growth in secondary sales continued. In Ukraine,
which is the largest market in the CIS region after Russia, Glenmark
has recorded over 83% growth in secondary sales in the year, driven
primarily by its focus brands strategy.
During the year, the company conducted several training
programmes (both online and offline) to improve the effectiveness of
its sales force across CIS markets. It also participated in several
seminars to reach out to Doctors and Key Opinion Leaders (KOL)
Glenmark’s Russian subsidiary : Making a mark through it’s powerful brands in dermatology and respiratory segments
Members of Glenmark’s Russia team
Glenmark’s Russian subsidiary : Making a mark through it’s powerful brands in dermatology and respiratory segmentsGlenmark’s Russian subsidiary : Making a mark through it’s powerful brands in dermatology and respiratory segmentsGlenmark’s Russian subsidiary : Making a mark through it’s powerful brands in dermatology and respiratory segmentsGlenmark’s Russian subsidiary : Making a mark through it’s powerful brands in dermatology and respiratory segmentsGlenmark’s Russian subsidiary : Making a mark through it’s powerful brands in dermatology and respiratory segments
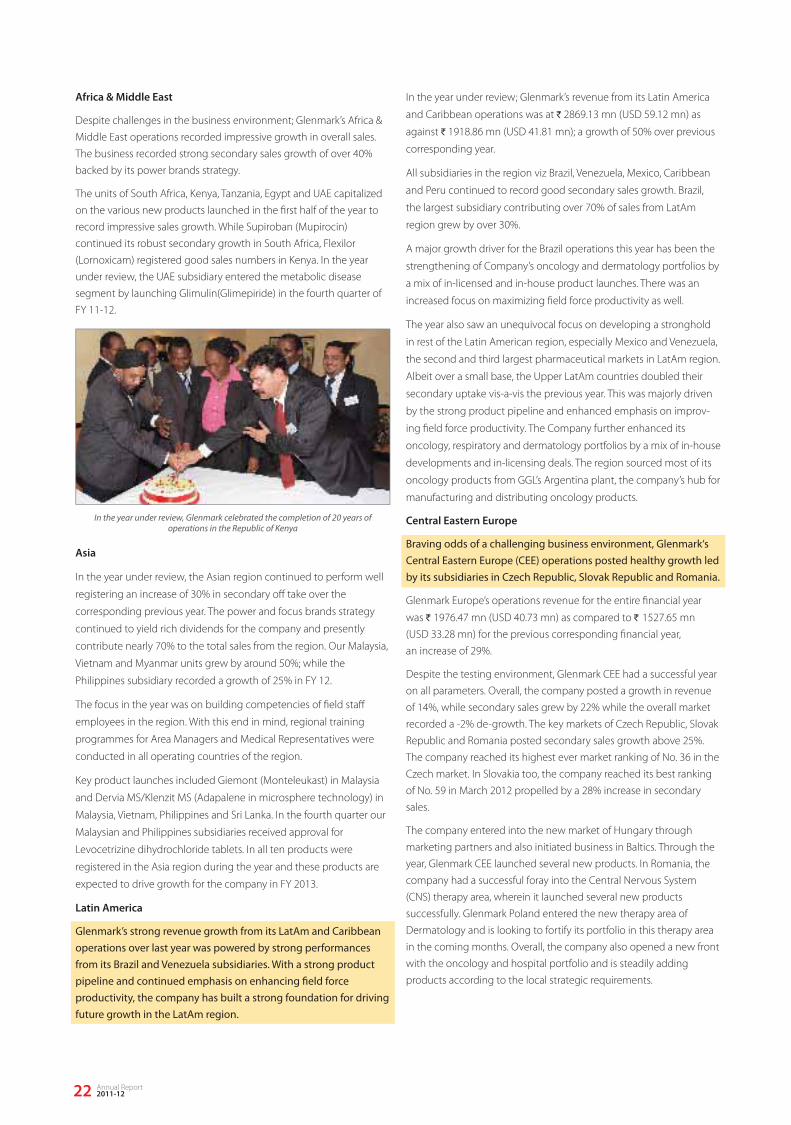
In the year under review, Glenmark celebrated the completion of 20 years of operations in the Republic of Kenya
In the year under review; Glenmark’s revenue from its Latin America
and Caribbean operations was at ` 2869.13 mn (USD 59.12 mn) as
against ` 1918.86 mn (USD 41.81 mn); a growth of 50% over previous
corresponding year.
All subsidiaries in the region viz Brazil, Venezuela, Mexico, Caribbean
and Peru continued to record good secondary sales growth. Brazil,
the largest subsidiary contributing over 70% of sales from LatAm
region grew by over 30%.
A major growth driver for the Brazil operations this year has been the
strengthening of Company’s oncology and dermatology portfolios by
a mix of in-licensed and in-house product launches. There was an
increased focus on maximizing field force productivity as well.
The year also saw an unequivocal focus on developing a stronghold
in rest of the Latin American region, especially Mexico and Venezuela,
the second and third largest pharmaceutical markets in LatAm region.
Albeit over a small base, the Upper LatAm countries doubled their
secondary uptake vis-a-vis the previous year. This was majorly driven
by the strong product pipeline and enhanced emphasis on improv-
ing field force productivity. The Company further enhanced its
oncology, respiratory and dermatology portfolios by a mix of in-house
developments and in-licensing deals. The region sourced most of its
oncology products from GGL’s Argentina plant, the company’s hub for
manufacturing and distributing oncology products.
Central Eastern Europe
Braving odds of a challenging business environment, Glenmark‘s Central Eastern Europe (CEE) operations posted healthy growth led by its subsidiaries in Czech Republic, Slovak Republic and Romania.
Glenmark Europe’s operations revenue for the entire financial year
was ` 1976.47 mn (USD 40.73 mn) as compared to ` 1527.65 mn
(USD 33.28 mn) for the previous corresponding financial year,
an increase of 29%.
Despite the testing environment, Glenmark CEE had a successful year
on all parameters. Overall, the company posted a growth in revenue
of 14%, while secondary sales grew by 22% while the overall market
recorded a -2% de-growth. The key markets of Czech Republic, Slovak
Republic and Romania posted secondary sales growth above 25%.
The company reached its highest ever market ranking of No. 36 in the
Czech market. In Slovakia too, the company reached its best ranking
of No. 59 in March 2012 propelled by a 28% increase in secondary
sales.
The company entered into the new market of Hungary through
marketing partners and also initiated business in Baltics. Through the
year, Glenmark CEE launched several new products. In Romania, the
company had a successful foray into the Central Nervous System
(CNS) therapy area, wherein it launched several new products
successfully. Glenmark Poland entered the new therapy area of
Dermatology and is looking to fortify its portfolio in this therapy area
in the coming months. Overall, the company also opened a new front
with the oncology and hospital portfolio and is steadily adding
products according to the local strategic requirements.
Asia
In the year under review, the Asian region continued to perform well
registering an increase of 30% in secondary off take over the
corresponding previous year. The power and focus brands strategy
continued to yield rich dividends for the company and presently
contribute nearly 70% to the total sales from the region. Our Malaysia,
Vietnam and Myanmar units grew by around 50%; while the
Philippines subsidiary recorded a growth of 25% in FY 12.
The focus in the year was on building competencies of field staff
employees in the region. With this end in mind, regional training
programmes for Area Managers and Medical Representatives were
conducted in all operating countries of the region.
Key product launches included Giemont (Monteleukast) in Malaysia
and Dervia MS/Klenzit MS (Adapalene in microsphere technology) in
Malaysia, Vietnam, Philippines and Sri Lanka. In the fourth quarter our
Malaysian and Philippines subsidiaries received approval for
Levocetrizine dihydrochloride tablets. In all ten products were
registered in the Asia region during the year and these products are
expected to drive growth for the company in FY 2013.
Latin America
Glenmark’s strong revenue growth from its LatAm and Caribbean operations over last year was powered by strong performances from its Brazil and Venezuela subsidiaries. With a strong product pipeline and continued emphasis on enhancing �eld force productivity, the company has built a strong foundation for driving future growth in the LatAm region.
Africa & Middle East
Despite challenges in the business environment; Glenmark’s Africa &
Middle East operations recorded impressive growth in overall sales.
The business recorded strong secondary sales growth of over 40%
backed by its power brands strategy.
The units of South Africa, Kenya, Tanzania, Egypt and UAE capitalized
on the various new products launched in the first half of the year to
record impressive sales growth. While Supiroban (Mupirocin)
continued its robust secondary growth in South Africa, Flexilor
(Lornoxicam) registered good sales numbers in Kenya. In the year
under review, the UAE subsidiary entered the metabolic disease
segment by launching Glimulin(Glimepiride) in the fourth quarter of
FY 11-12.
Annual Report2011-1222

Annual Report2011-1223
Table 3: Glenmark’s Para IV Filings with Sole Exclusivity
*All above mentioned Para IV litigations settled. GGL has visibility in terms of sales for Para IV opportunities
Product
Ezetimibe Zetia Schering Plough USD 1.3 bn Dec 2016
Hydrocotisone Butyrate Cream
Locoid Lipocream Triax and Astellas USD 38 mn Dec 2013
Fluticasone Lotion0.005%
Cutivate Nycomed USD 39 mn Launched in Mar 2012
Atovaquone &Proguanil HCI
Malarone Glaxosmith kline USD 64 mn Launched Sep’11
Brand Name Plainti� Sales* (MAT Apr 2012) Launch Timeline
US Formulations
Glenmark’ US formulations business registered a signi�cant growth on the back of its robust product portfolio focused on niche and high entry barriers segments like Dermatology, Hormones, Controlled Substances and Modi�ed Release categories. With over 80 products authorized for distribution in the US market, including 19 dermatology and 10 oral contraceptives products, the US business is all set to scale newer heights.
Glenmark Generics Inc., U.S.A. registered revenue from sale of finished
dosage fomulations of ` 12136.93 mn (USD 250.09 mn) for FY 12
against revenue of ` 8351.56 mn (USD 181.95 mn), an increase of 45%
in ` term over the corresponding previous year.
In the fiscal year 2012, Glenmark was granted approval of 14
Abbreviated New Drug Applications (ANDA), comprised of 12 final
and 2 tentative approvals. Glenmark completed successful launch of
12 products during fiscal year 2012 consisting of a mix of semi-solid
preparations, oral-contraceptives, extended release, and immediate
release items.
In March 2012, the Company initiated the exclusive launch of
fluticasone propionate lotion, their generic version of Nycomed’s
Cutivate® lotion. Under the terms of the Settlement Agreement,
Glenmark will market and distribute its Fluticasone propionate lotion
under a royalty-bearing license from Nycomed US, for which they are
entitled to 180 days exclusivity.
In September 2011, Glenmark Generics also completed royalty
payment to Paul Capital Partners' Royalty Fund for developing
dermatological products for the US market with the final tranche of
USD 28.8 mn. With the exercise of the purchase option election, the
company has no further obligation to pay royalties to Paul Capital.
The company launched Atovaquone & Proguanil HCl (Malarone) in
September 2011 and Fluticasone lotion (Cutivate) in March 2012. The
company expects Malarone’s exclusivity to run throughout FY 13,
while Cutivate will have 6 months exclusivity in FY 13. Another
success for the US business has been in the area of female hormonal
products. Glenmark currently has 10 Oral Contraceptives (OCs)
authorized for distribution by the U.S. FDA. Glenmark’s OC pipeline
includes around 6 filings pending with the USFDA. In dermatology
space, the company now has a portfolio of 19 products.
Glenmark’s marketing portfolio as on 31 March 2012 consisted of 77
generic products authorized for distribution in the U.S. market. The
Company currently has 39 applications pending in various stages of
the approval process with the US FDA, of which 17 are Paragraph IV
applications.
Glenmark Generics’ corporate o�ce in Mahwah, NJ – USA

Annual Report2011-1224
Table 4: Niche Area Focus in ANDA Filings
Immediate Release
Hormones
Modified Release
Derm Products
Para IV Filings
Total
7387
996
939
716
10246
266
20550
Market Size ($mn)
As on March, 2012
Controlled Substances
11
4
4
3
17
0
39
39
11
7
19
0
3
79
50
15
11
22
17
3
118
Niche / Focus Area Pending Approval Authorized toDistribute Total Filings
Glenmark has a dedicated hormone facility in Goa, India which manufactures oral contraceptives and other hormone products for the US market
Glenmark Generics Inc., USA driving growth through focused presence in niche segments

Western Europe Formulations
The European generics business continued to grow at a fast pace aided by its strategy of Product Sales, Licensing Revenues and expanding its presence through Distribution Partners in several European countries.
Revenues from Glenmark’s European business increased to
` 1031.36 mn (USD 21.25 mn) as against a revenue of ` 543.61 mn
(USD 11.84 mn) in the previous financial year; an increase of
90% in ` term.
The European business comprises of Glenmark Generics (Europe) Ltd
(GGEL) which is headquartered in UK and two new entities: Glenmark
Generics B.V (GGBV) based in the Netherlands and Glenmark
Arzneimittel GmbH (GAG) which is incorporated in Germany.
The European business steadily expanded through product sales and
licensing income and by increasing its presence through Distribution
Partners in several EU countries. The UK entity built on its business
through addition of new accounts. It also entered the Republic of
Ireland market for the first time in FY 11-12 with a targeted portfolio
of products. The Netherlands business continued supplying products
to Pharmacies through health insurance contracts; while the German
operation commenced sales from October 2011.
GGEL entered into 10 new out-licensing deals during 2011-12. The
company also in-licensed 6 new products and won three tenders in
Germany and five tenders in Netherlands. The company obtained
several marketing authorizations for different markets and also filed
couple of MA application for products across several EU markets
through the decentralised procedure (DCP) route.
their oncology portfolio. In the year, a total of 41 oncology dossiers
were provided to various countries – Argentina, Brazil, Mexico, Peru,
Middle East and Caribbean nations.
In the coming years, the business stands to play a pivotal role in the
growth story of Glenmark, with increasing number of filings and
launches planned in both regulated and non regulated markets.
Mr. Jyotiraditya Scindia, Hon. Minister of State for Commerce & Industry, Government of India (3rd from right) and Ms. Debora Giorgi (2nd from right), Hon. Minister of Industry
- Argentina inaugurating Glenmark’ oncology manufacturing facility near Buenos Aires in April 2011
Also seen in the picture : Mr. Jalaj Sharma – Director & President Operations, Glenmark Generics (2nd from left)
Oncology
Glenmark’s oncology business continued to �le dossiers at a healthy rate
Based out of Buenos Aires – Argentina, Glenmark’s oncology business
serves as the hub for manufacturing and distribution of oncology
products across Glenmark markets. The facility provides dossiers to
various Glenmark geographies helping them initiate and strengthen
Annual Report2011-1225
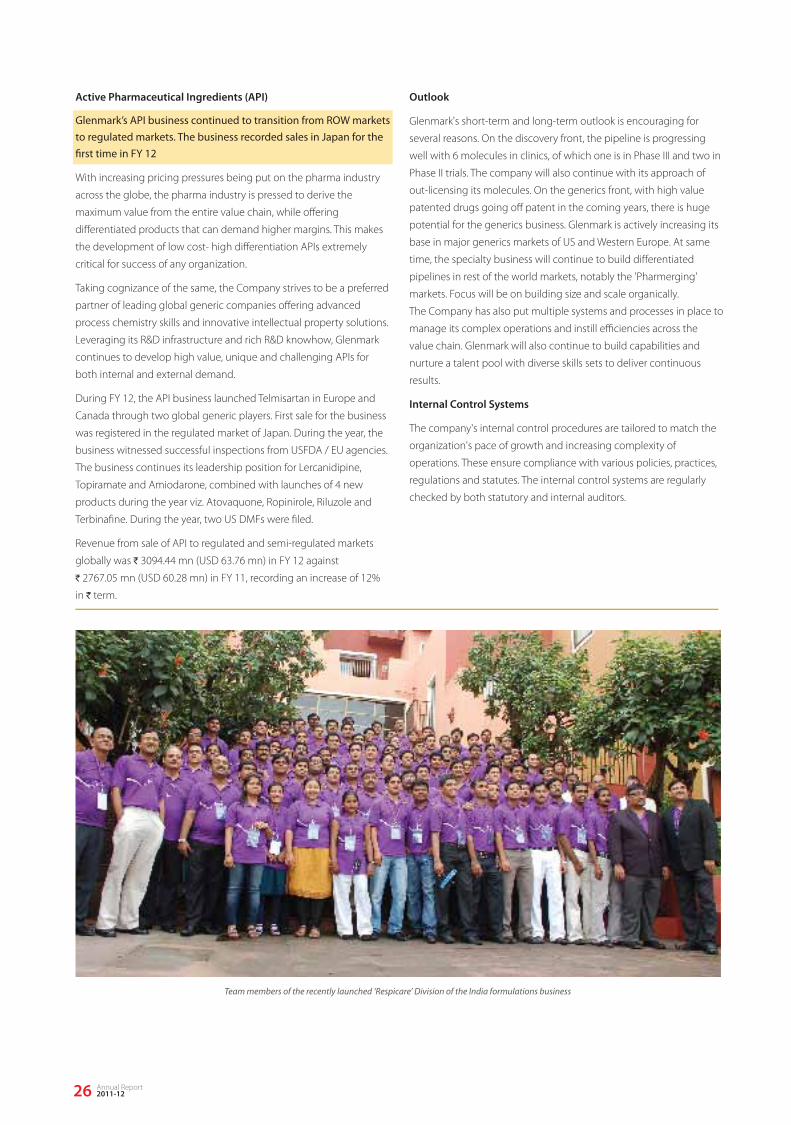
Active Pharmaceutical Ingredients (API)
Glenmark’s API business continued to transition from ROW markets to regulated markets. The business recorded sales in Japan for the �rst time in FY 12
With increasing pricing pressures being put on the pharma industry
across the globe, the pharma industry is pressed to derive the
maximum value from the entire value chain, while offering
differentiated products that can demand higher margins. This makes
the development of low cost- high differentiation APIs extremely
critical for success of any organization.
Taking cognizance of the same, the Company strives to be a preferred
partner of leading global generic companies offering advanced
process chemistry skills and innovative intellectual property solutions.
Leveraging its R&D infrastructure and rich R&D knowhow, Glenmark
continues to develop high value, unique and challenging APIs for
both internal and external demand.
During FY 12, the API business launched Telmisartan in Europe and
Canada through two global generic players. First sale for the business
was registered in the regulated market of Japan. During the year, the
business witnessed successful inspections from USFDA / EU agencies.
The business continues its leadership position for Lercanidipine,
Topiramate and Amiodarone, combined with launches of 4 new
products during the year viz. Atovaquone, Ropinirole, Riluzole and
Terbinafine. During the year, two US DMFs were filed.
Revenue from sale of API to regulated and semi-regulated markets
globally was ` 3094.44 mn (USD 63.76 mn) in FY 12 against
` 2767.05 mn (USD 60.28 mn) in FY 11, recording an increase of 12%
in ` term.
Outlook
Glenmark's short-term and long-term outlook is encouraging for
several reasons. On the discovery front, the pipeline is progressing
well with 6 molecules in clinics, of which one is in Phase III and two in
Phase II trials. The company will also continue with its approach of
out-licensing its molecules. On the generics front, with high value
patented drugs going off patent in the coming years, there is huge
potential for the generics business. Glenmark is actively increasing its
base in major generics markets of US and Western Europe. At same
time, the specialty business will continue to build differentiated
pipelines in rest of the world markets, notably the 'Pharmerging'
markets. Focus will be on building size and scale organically.
The Company has also put multiple systems and processes in place to
manage its complex operations and instill efficiencies across the
value chain. Glenmark will also continue to build capabilities and
nurture a talent pool with diverse skills sets to deliver continuous
results.
Internal Control Systems
The company's internal control procedures are tailored to match the
organization's pace of growth and increasing complexity of
operations. These ensure compliance with various policies, practices,
regulations and statutes. The internal control systems are regularly
checked by both statutory and internal auditors.
Team members of the recently launched ‘Respicare’ Division of the India formulations business
Annual Report2011-1226

Risk Management
Strategy Risk Management:
Description of Risk
Description of Risk
The ever changing business environment necessitates continuous monitoring, evaluation & management of signi�cant risks faced by the organization. Some key risk factors, that can impact a rapidly expanding company like Glenmark, are listed below. Also outlined are the key mechanisms followed to manage these risks.
Although the Company has defined business objectives based on
strategy for each of the businesses, it may or may not be able to
achieve the expected results due to numerous internal and external
variables, leading to probable strategic risks.
At Glenmark, the strategy de-risking is done by growing multiple
business domains in high opportunity areas. The innovative effort in
discovery research is also accompanied by traditional branded
generics and generics business. The company also has API business
interest in regulated and semi-regulated markets. Being a fully
integrated Company operating globally helps it to de-risk its
strategic moves.
Mitigating factor
Research Risk Management:
Description of Risk
Developing new products is investment intensive, having a longer
gestation period with uncertain outcome. A new product candidate
can fail at any stage of the development process or could fail to
receive regulatory approval.
The Company cannot accurately predict whether existing controls,
pressures or restrictions will increase or whether new controls,
pressures or restrictions will be introduced. These controls include,
but are not restricted to, pricing controls and manufacturing practice
regulations, and may materially and adversely affect the Company’s
existing products as well as introduction of new products. Single
sourcing for certain components, bulk active materials and finished
products does expose the Company to multiple probable risks.
Business Portfolio Risk Management:
To counter these, Glenmark has adopted harmonized quality system
across its plants. Regular vendor audits are conducted to ensure
regulatory compliance. The Company also does business continuity
planning to foresee and create appropriate solutions for other risks in
advance. The Company also develops a second source for its
important API, Bulk Active materials. Continuous monitoring is done
of the changes in the pricing regulations in the various markets in
which the company operates in order to minimize the adverse
impact on the revenue and profitability of the company.
Mitigating factor
Glenmark is vigilantly balancing the risk involved in its drug discovery
program. Targets are selected after exhaustive screening and research
across various parameters. The company also works on parallel targets
to maximize success prospects. Strategic tie-ups for NCEs and NBEs
minimize the inherent risk of failure in a program.
Mitigating factor
Competition Risk Management:
Description of Risk
Glenmark operates in many markets, facing stiff competition from
local and MNC companies on both branded and generics business.
As a research-led, fully integrated global pharmaceutical company
based out of India and having a rich human resource pool of
technically qualified graduates, high skills and expertise in product
development at a relatively lower cost, gives it an edge over players
from other markets.
Mitigating factor
Economic & Political Risk Management:
Description of Risk
The Company’s approach is to ensure as far as possible, that it has
sufficient liquidity to meet its liabilities when due. Where it has
entered into long-term financial obligations, these are structured in
such a way that maturities are evenly spread out. Glenmark has
selectively opted for appropriate measures to mitigate the impact
due to volatile forex movements. The company also reviews the
economic and political stability of a market to respond to any
situations that may impact business. The Company takes adequate
steps to assess the customers based on proactive market information.
The Company’s taxation policy is reviewed continuously in order to
understand the impact of changes in tax regulations and minimize
the risks in tax planning.
Mitigating factor
Given the scale and international exposure of the Company, our
business is constantly at risk owing to any unforeseen, political and
economic changes i.e. Intra-Company transfer pricing is an inherent
tax risk, changes in tax laws or in their application may affect the
financial results, Credit risk arising on account of failure to meet the
contractual obligations by a customer, Liquidity risk may arise on
account of the company not being able to meet its financial
obligations as and when they fall due, Political changes in the country
may change the regulatory and business policies.
Annual Report2011-1227

Litigation Risk:
Description of Risk
The Company operates globally in complex legal and regulatory
environments that often vary among jurisdictions. The failure to
comply with applicable laws, rules and regulations in these
jurisdictions may result in legal proceedings. As those rules and
regulations change or as governmental interpretation of those rules
and regulations evolve, prior conduct may be called into question.
Also, notwithstanding the efforts the Company makes to determine
the safety of its products through regulated clinical trials,
unanticipated side effects may become evident only when the drugs
are introduced into the marketplace.
The Company has adequate framework to review on a regular basis
all the applicable rules and regulations applicable which have been
identified with the help of external and internal expertise and also
there is a continuous review of the various changes in the rules,
regulations and policies impacting the industry.
Mitigating factor
Environment Risk Management:
Description of Risk
The manufacture of APIs and pharmaceutical formulations and
disposal of wastes poses certain risks to environment.
Glenmark is committed to managing its waste in a sound and
responsible manner and adhering to norms stipulated by the
regulatory authorities.
Mitigating factor
Protection of IPR
Description of Risk
The Company relies on critical and sensitive data, such as personally
identifiable information, trade secrets, intellectual property and
Mitigating factor
Information Technology
Description of Risk
Mitigating factor
The Company has put in place adequate systems to ensure its IPR is
protected.
The size and complexity of our computer systems make them
potentially vulnerable to breakdown, malicious intrusion and
random attack. While we have invested adequately in the protection
of data and information technology, there can be no assurance that
our efforts will prevent breakdown or breaches in our systems that
could adversely affect our business.
The Company takes steps to have proper back ups so as to avoid loss
of data.
The Significant portion of the Company’s overseas revenue is
coming from the products manufactured in India and therefore
exposed to currency rate fluctuation. This fluctuation in currency
may impact top-line as well as profitability of the Company.
The Company has raised foreign currency debts which may impact
the company’s profitability.
The Company has adopted a conservative hedge strategy to reduce
the net exposure to foreign currency assets and liabilities.
Foreign Exchange Risk
Description of Risk
Mitigating factor
corporate strategic plans. Security of this type of data is exposed to
increasing external threats. The Company is also subject to various
standards for the protection of personally identifiable information.
Annual Report2011-1228

29Annual Report 2011 - 2012
Profiles of Directors
Mr. Gracias Saldanha (Founder and Chairman Emeritus)
Mr. Gracias Saldanha is the founder of the Company. He has over 40 years experience in the industry. His educational qualifications include a M.Sc. from Bombay University with a Diploma in Management Studies from Jamnalal Bajaj Institute of Management Studies, Mumbai. He has worked with leading pharmaceutical companies like Abbott Laboratories andE. Merck.
Mr. Glenn Saldanha (Chairman & Managing Director)
Mr. Glenn Saldanha is a B.Pharm from Bombay University and was awarded the Watumall Foundation Award for overall excellence. His other educational qualifications include an MBA from New York University’s Leonard N. Stern School of Business (US). He has worked for Eli Lilly in the US and was a Management Consultant with Price Waterhouse Coopers. His services have been used by Smithkline Beecham, Rhorer, Astra, Merck and Johnson and Johnson, among others.
Mrs. B. E. Saldanha (Non-Executive Director)
Mrs. B. E. Saldanha has graduated in B.Sc., B.Ed., from Bombay University and was a Whole-time Director of the Company from 1982 to 2005. She was responsible to a large extent in developing the Company’s export business.
Mrs. Cherylann Pinto (Director - Corporate Affairs)
Mrs. Cherylann Pinto is a graduate in Pharmacy from the University of Bombay. She has over 24 years experience in the pharmaceuticals business.
Mr. Rajesh V. Desai (Executive Director & CFO)
Mr. Rajesh V. Desai is the Executive Director & CFO of the Company and has been with the Company for close to three decades. A Science graduate from Bombay University and a Chartered Accountant from Institute of Chartered Accountants of India, he is responsible for the Finance, Legal and IT function of the entire organization. A member of the leadership team for over a decade, he has been responsible for charting the Company’s growth in the domestic and overseas markets.
Mr. N. B. Desai (Non-Executive Director)
Mr. N. B. Desai is a retired General Manager of Bank of Baroda. He has over 48 years experience in the Banking Sector. He has worked in India and overseas. He was Chairman of Bank of Baroda Uganda Ltd. He was the founder and Managing Director of Equitorial Bank PLC, UK from which he retired in 1992.
Mr. J. F. Ribeiro (Non-Executive Director)
Mr. J. F. Ribeiro is a retired government official and has served the country under various assignments. Amongst the major positions held, he has been the Ex-Commissioner of Police, Mumbai, former Special Secretary to Government of India, Ministry of Home Affairs, former Director General of Police, Punjab, Ex-Adviser to the Governor of Punjab, Ex-Ambassador of India to Romania.
Mr. D. R. Mehta (Non-Executive Director)
Mr D. R. Mehta has graduated in Arts and Law from Rajasthan University. He also studied at Royal Institute of Public Administration, London, UK and the Alfred Sloan School of Management, Boston, USA. He has over 42 years of experience in civil services and has held various positions in the Government of Rajasthan and Government of India. He
was the Deputy Governor of Reserve Bank of India and also the Chairman of the Securities and Exchange Board of India.
Mr. Hocine Sidi Said (Non-Executive Director)
Mr. Hocine Sidi Said has graduated in B.A. (International Marketing). He is the Founder & Director of Bio-nAbler, an investment company that partners with Sovereign Wealth Funds and Private Equity Firms across Asia and the MENA region to identify and execute product and company acquisitions. He has over 22 years of experience in the pharmaceuticals industry and has worked with companies like Pfizer and UCB. During his stint at UCB, he was incharge of the entire Emerging Markets Region and designated as Senior Vice President. Prior to joining UCB, he spent close to 17 years with Pfizer in various senior management and developmental roles in the Middle East, Central and Eastern Europe and Asia.
Mr. Sridhar Gorthi (Non-Executive Director)
Mr. Sridhar Gorthi is a B.A., L.L.B. (Hons.) from the National Law School of India University. He is presently a partner in Trilegal and has worked with Arthur Anderson and Lex Inde, Mumbai. He is involved in legal advisory services to various multinational and domestic corporations on restructuring, debt finance, joint ventures, acquisition/mergers etc.
Dr. Brian W. Tempest (Non-Executive Director)
Dr. Brian W. Tempest is a CSCI, CCHEM, FRSC, BSC, PHD. He has worked in the pharmaceutical industry for the last 40 years and has managed Healthcare Businesses in North America, South America, Europe, Africa, Middle East, Australasia, China, Japan and India.
He worked for Ranbaxy Laboratories from 1995 – 2008 where he last held the position of Vice Chairman and retired as the Non-Executive Director in 2008. He has also worked for Glaxo as Regional Director-Far East and Regional Director-Middle East & Africa from 1985 to 1992.
A PhD in Chemistry from Lancaster University and Chairman of the Advisory Board for the Lancaster University Management School, he is a Fellow of the Royal Society of Chemistry and a Fellow of the Royal Society of Medicine.
Mr. Bernard Munos (Non-Executive Director)
Mr. Bernard Munos is the founder of the InnoThink Center for Research in Biomedical Innovation. Prior to that, he was Advisor for corporate strategy at Eli Lilly and Company, a multi-billion dollar global pharmaceutical company. His research, which has been published in Nature and Science Journal and was recently profiled by Forbes Magazine, has helped stimulate a broad rethinking of the pharmaceutical business model worldwide.
He has presented his findings at numerous meetings sponsored by the National Academies, the Institute of Medicine, the President’s Cancer Panel, the NIH Leadership Forum, the World Health Organization, the OECD, the Kauffman Foundation, the US Patent and Trademark Office, as well as leading universities and think-tanks in the US and Europe.
An MBA from Stanford University, and holds other graduate degrees in economics and animal science from the University of California at Davis, and the Paris Institute of Technology for Life, Food and Environmental Sciences in France.
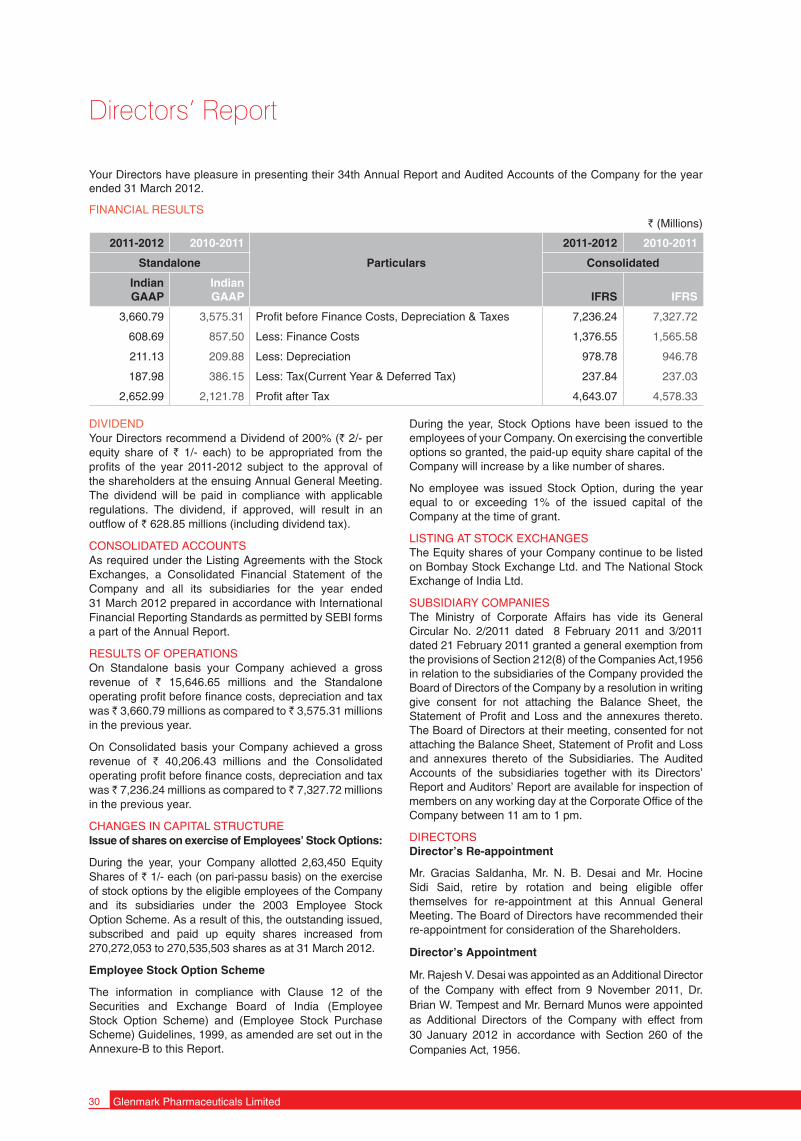
30 Glenmark Pharmaceuticals Limited
Directors’ Report
Your Directors have pleasure in presenting their 34th Annual Report and Audited Accounts of the Company for the year ended 31 March 2012.
FINANCIAL RESULTS ` (Millions)
2011-2012 2010-2011 2011-2012 2010-2011
Standalone Particulars Consolidated
Indian GAAP
Indian GAAP IFRS IFRS
3,660.79 3,575.31 Profit before Finance Costs, Depreciation & Taxes 7,236.24 7,327.72
608.69 857.50 Less: Finance Costs 1,376.55 1,565.58
211.13 209.88 Less: Depreciation 978.78 946.78
187.98 386.15 Less: Tax(Current Year & Deferred Tax) 237.84 237.03
2,652.99 2,121.78 Profit after Tax 4,643.07 4,578.33
DIVIDENDYour Directors recommend a Dividend of 200% (` 2/- per equity share of ` 1/- each) to be appropriated from the profits of the year 2011-2012 subject to the approval of the shareholders at the ensuing Annual General Meeting. The dividend will be paid in compliance with applicable regulations. The dividend, if approved, will result in an outflow of ` 628.85 millions (including dividend tax).
CONSOLIDATED ACCOUNTSAs required under the Listing Agreements with the Stock Exchanges, a Consolidated Financial Statement of the Company and all its subsidiaries for the year ended 31 March 2012 prepared in accordance with International Financial Reporting Standards as permitted by SEBI forms a part of the Annual Report.
RESULTS OF OPERATIONSOn Standalone basis your Company achieved a gross revenue of ` 15,646.65 millions and the Standalone operating profit before finance costs, depreciation and tax was ̀ 3,660.79 millions as compared to ̀ 3,575.31 millions in the previous year.
On Consolidated basis your Company achieved a gross revenue of ` 40,206.43 millions and the Consolidated operating profit before finance costs, depreciation and tax was ̀ 7,236.24 millions as compared to ̀ 7,327.72 millions in the previous year.
CHANGES IN CAPITAL STRUCTUREIssue of shares on exercise of Employees’ Stock Options:
During the year, your Company allotted 2,63,450 Equity Shares of ` 1/- each (on pari-passu basis) on the exercise of stock options by the eligible employees of the Company and its subsidiaries under the 2003 Employee Stock Option Scheme. As a result of this, the outstanding issued, subscribed and paid up equity shares increased from 270,272,053 to 270,535,503 shares as at 31 March 2012.
Employee Stock Option Scheme
The information in compliance with Clause 12 of the Securities and Exchange Board of India (Employee Stock Option Scheme) and (Employee Stock Purchase Scheme) Guidelines, 1999, as amended are set out in the Annexure-B to this Report.
During the year, Stock Options have been issued to the employees of your Company. On exercising the convertible options so granted, the paid-up equity share capital of the Company will increase by a like number of shares.
No employee was issued Stock Option, during the year equal to or exceeding 1% of the issued capital of the Company at the time of grant.
LISTING AT STOCK EXCHANGESThe Equity shares of your Company continue to be listed on Bombay Stock Exchange Ltd. and The National Stock Exchange of India Ltd.
SUBSIDIARY COMPANIESThe Ministry of Corporate Affairs has vide its General Circular No. 2/2011 dated 8 February 2011 and 3/2011 dated 21 February 2011 granted a general exemption from the provisions of Section 212(8) of the Companies Act,1956 in relation to the subsidiaries of the Company provided the Board of Directors of the Company by a resolution in writing give consent for not attaching the Balance Sheet, the Statement of Profit and Loss and the annexures thereto. The Board of Directors at their meeting, consented for not attaching the Balance Sheet, Statement of Profit and Loss and annexures thereto of the Subsidiaries. The Audited Accounts of the subsidiaries together with its Directors’ Report and Auditors’ Report are available for inspection of members on any working day at the Corporate Office of the Company between 11 am to 1 pm.
DIRECTORSDirector’s Re-appointment
Mr. Gracias Saldanha, Mr. N. B. Desai and Mr. Hocine Sidi Said, retire by rotation and being eligible offer themselves for re-appointment at this Annual General Meeting. The Board of Directors have recommended their re-appointment for consideration of the Shareholders.
Director’s Appointment
Mr. Rajesh V. Desai was appointed as an Additional Director of the Company with effect from 9 November 2011, Dr. Brian W. Tempest and Mr. Bernard Munos were appointed as Additional Directors of the Company with effect from 30 January 2012 in accordance with Section 260 of the Companies Act, 1956.
31Annual Report 2011 - 2012
Mr. Rajesh V. Desai, Dr. Brian W. Tempest and Mr. Bernard Munos hold office up to the date of the ensuing Annual General Meeting of the Company scheduled to be held on 3 August 2012. The requisite notices together with necessary deposits have been received from members pursuant to Section 257 of the Companies Act, 1956, proposing the election of Mr. Rajesh V. Desai, Dr. Brian W. Tempest and Mr. Bernard Munos as Directors of the Company.
COST AUDITORSM/s. Sevekari Khare & Associates are the Cost Auditors of the Company. They have been re-appointed as cost auditors for the Financial Year 2012-2013. Due date for filing of Cost Audit Report by the Cost Auditor for the Financial Year 2011-2012 is 30 September 2012.
CORPORATE GOVERNANCEYour Company believes Corporate Governance is at the core of stakeholder satisfaction. Your Company's governance practices are described separately in this Annual Report. Your Company has obtained a certification from S. S. Rauthan & Associates, Company Secretaries on your Company’s compliance with Clause 49 of the Listing Agreement with Indian Stock Exchanges. This certificate is attached to the Report on Corporate Governance.
MANAGEMENT DISCUSSION AND ANALYSIS REPORTThe management discussion and analysis report on the operations of the Company, as required under the Listing agreements with the stock exchanges is provided in a separate section and forms a part of this report.
AUDITORSThe auditors, M/s. Walker, Chandiok & Co., Chartered Accountants, retire at the ensuing Annual General Meeting and have confirmed their eligibility and willingness to accept office, if re-appointed. The proposal for their re-appointment is included in the notice for Annual General Meeting sent herewith.
HUMAN RESOURCESCompany’s industrial relations continued to be harmonious during the year under review.
PARTICULARS OF EMPLOYEES Information as required under the provisions of Section 217(2A) of the Companies Act, 1956 read together with the Companies (Particulars of Employees) Rules, 1975, as amended, are given in an Annexure forming part of this report.
CONSERVATION OF ENERGY, RESEARCH AND DEVELOPMENT, TECHNOLOGY ABSORPTION, FOREIGN EXCHANGE EARNINGS AND OUTGOThe particulars as prescribed under Section 217(1)(e) of the Companies Act, 1956, read with the Companies (Disclosure of particulars in the report of Board of Directors) Rules, 1988 are set out in the Annexure-A to this report.
DIRECTORS' RESPONSIBILITY STATEMENTPursuant to Section 217(2AA) of the Companies Act, 1956, the directors confirm that –
(i) in the preparation of the annual accounts, the applicable accounting standards have been followed along with proper explanation relating to material departures, if any;
(ii) appropriate accounting policies have been selected and applied consistently and have made judgements and estimates that are reasonable and prudent so as to give a true and fair view of the state of affairs of the Company as at 31 March 2012 and of the profit of the Company for the year ended 31 March 2012;
(iii) proper and sufficient care has been taken for maintenance of adequate accounting records in accordance with the provisions of the Companies Act, 1956 for safeguarding the assets of the Company and for preventing and detecting fraud and other irregularities;
(iv) the annual accounts have been prepared on a going concern basis.
GREEN INITIATIVEThe Ministry of Corporate Affairs has taken the Green initiative in Corporate Governance by allowing paperless compliances by Companies through electronic mode.
Your Company supports the Green initiative and has accordingly decided to send all communications to its shareholders at their respective registered e-mail addresses.
Your Company appeals to you, its shareholders who are yet to register your e-mail addresses that they take necessary steps for registering the same so that you can also become a part of the intiative and contribute towards a Greener environment.
APPRECIATION AND ACKNOWLEDGEMENTSYour Directors express their gratitude to the Company’s customers, shareholders, business partner’s viz. distributors and suppliers, medical profession, Company’s bankers, financial institutions including investors for their valuable & sustained support and co-operation.
Your Directors commend the continuing commitment and dedication of employees at all levels.
For and on behalf of the Board of Directors
Glenn SaldanhaChairman & Managing Director
Place: MumbaiDate: 08 May 2012.

32 Glenmark Pharmaceuticals Limited
Annexures to the Directors’ Report
ANNEXURE - A
Information under Section 217(1)(e) of the Companies Act, 1956 read with Companies (Disclosure of Particulars in the Report of the Board of Directors) Rules, 1988 and forming part of the Directors’ Report.
A. CONSERVATION OF ENERGY
Energy Generation Measures Taken
I. Power and Fuel Consumption 2011-12 2010-111. Electricity
(i) Purchased Unit (in ’000 Kwhrs) 11,030.92 11,010.20 Total Amount (` in ’000’s) 58,136.77 52,398.82 Rate/Unit (`) 5.27 4.76(ii) Own Generation (a) Through Diesel Generator Unit (in ’000 Kwhrs) 560.00 1,686.72 Units per Ltr. of Diesel Oil 3.18 3.35 Cost/Unit (`) 12.93 11.07 (b) Through Steam Turbine/Generator NIL NIL
2. Coal NIL NILQty.Total CostAverage Rate
3. Furnace Oil/Light Diesel Oil Qty. (K. Ltr.) 397.96 714.58Total Amount (` in ’000’s) 15,975.35 26,252.47Average Rate (`/K. Ltr.) 40.87 38.19
4. i) Internal generation Light Diesel Oil Qty. (In Ltr. ’000’s) NIL NIL Total Cost (` in ’000’s) NIL NIL Rate/Unit (`) NIL NILii) Natural Gas Qty. (M3 ’000’s) NIL NIL Total Cost (` in ’000’s) NIL NIL Rate/Unit (`) NIL NIL
II. Consumption
The Company manufactures several Drug Formulations in different pack sizes. In view of this, it is impracticable to apportion the consumption and cost of utilities to each Product/Formulation.
B. RESEARCH AND DEVELOPMENT (R&D)
1. Specific areas in which R&D activities were carried out by the Company are:
Pharmaceutical Development
Design a quality product and its manufacturing process to consistently deliver the intended performance of the product. Control specifications and manufacturing process to achieve sustained performance and quality. Dosage form selection based on suitability and intended use. Determination of aspects of drug substances, excipients, container closure system and manufacturing process those are critical to product quality and evaluation of drug substance physicochemical and biological properties. Manufacturing process improvements and product lifecycle management.
Development of immediate release, delayed release, sustained release, metered dose inhalers, dry powder
inhalers, nasal sprays, topical, liquid orals, injectable formulations and various platform technologiesFormulation development includes literature survey, compatibility studies, pre- formulation studies, formulation development of dosage forms for selected drug molecules on laboratory scale.
R & D has developed the formulations for new molecules, existing molecules and fixed dose combinations which include its standardization and technology transfer and execution at production site, evaluation of these batches against reference samples for safety, efficacy and bio-equivalence.
Analytical Method Development
Development of new analytical test procedures for various dosage forms to establish the quality and setting up specification for the release, stability testing of dosage forms and Active Pharmaceutical ingredient. These methods are validated as per International Regulatory Standards.
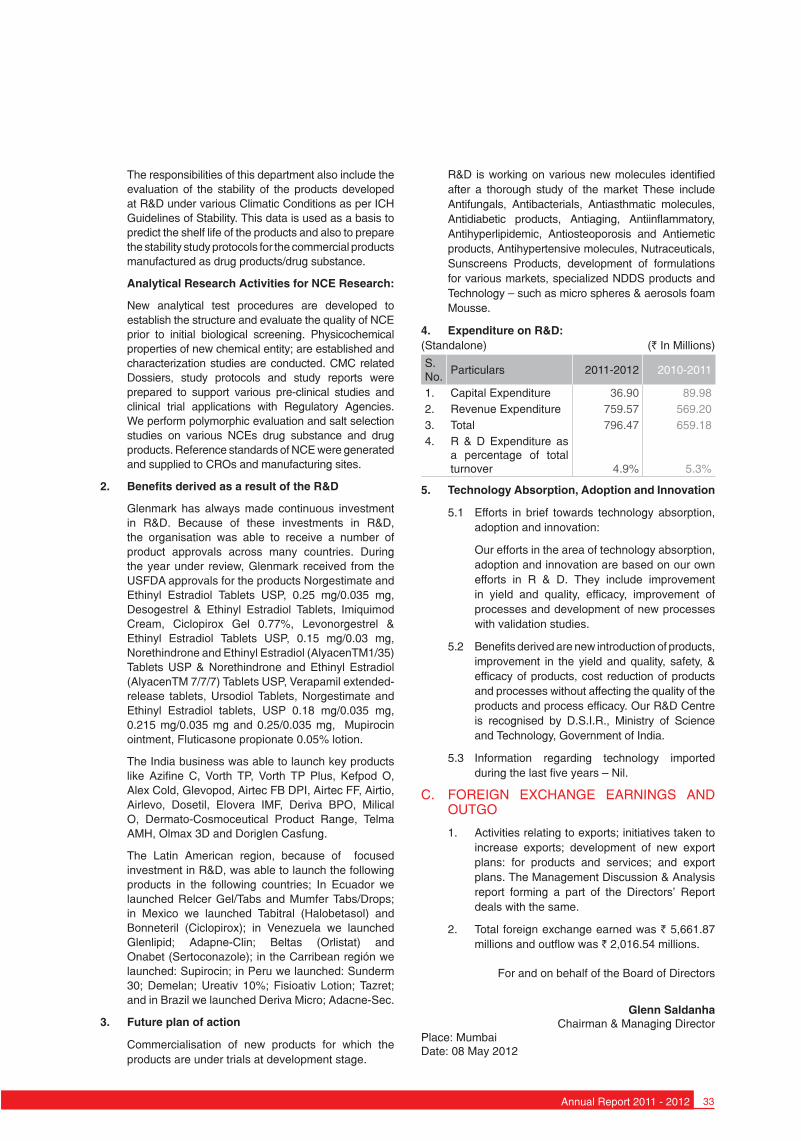
33Annual Report 2011 - 2012
The responsibilities of this department also include the evaluation of the stability of the products developed at R&D under various Climatic Conditions as per ICH Guidelines of Stability. This data is used as a basis to predict the shelf life of the products and also to prepare the stability study protocols for the commercial products manufactured as drug products/drug substance.
Analytical Research Activities for NCE Research:
New analytical test procedures are developed to establish the structure and evaluate the quality of NCE prior to initial biological screening. Physicochemical properties of new chemical entity; are established and characterization studies are conducted. CMC related Dossiers, study protocols and study reports were prepared to support various pre-clinical studies and clinical trial applications with Regulatory Agencies. We perform polymorphic evaluation and salt selection studies on various NCEs drug substance and drug products. Reference standards of NCE were generated and supplied to CROs and manufacturing sites.
2. Benefits derived as a result of the R&D
Glenmark has always made continuous investment in R&D. Because of these investments in R&D, the organisation was able to receive a number of product approvals across many countries. During the year under review, Glenmark received from the USFDA approvals for the products Norgestimate and Ethinyl Estradiol Tablets USP, 0.25 mg/0.035 mg, Desogestrel & Ethinyl Estradiol Tablets, Imiquimod Cream, Ciclopirox Gel 0.77%, Levonorgestrel & Ethinyl Estradiol Tablets USP, 0.15 mg/0.03 mg, Norethindrone and Ethinyl Estradiol (AlyacenTM1/35) Tablets USP & Norethindrone and Ethinyl Estradiol (AlyacenTM 7/7/7) Tablets USP, Verapamil extended-release tablets, Ursodiol Tablets, Norgestimate and Ethinyl Estradiol tablets, USP 0.18 mg/0.035 mg, 0.215 mg/0.035 mg and 0.25/0.035 mg, Mupirocin ointment, Fluticasone propionate 0.05% lotion.
The India business was able to launch key products like Azifine C, Vorth TP, Vorth TP Plus, Kefpod O, Alex Cold, Glevopod, Airtec FB DPI, Airtec FF, Airtio, Airlevo, Dosetil, Elovera IMF, Deriva BPO, Milical O, Dermato-Cosmoceutical Product Range, Telma AMH, Olmax 3D and Doriglen Casfung.
The Latin American region, because of focused investment in R&D, was able to launch the following products in the following countries; In Ecuador we launched Relcer Gel/Tabs and Mumfer Tabs/Drops; in Mexico we launched Tabitral (Halobetasol) and Bonneteril (Ciclopirox); in Venezuela we launched Glenlipid; Adapne-Clin; Beltas (Orlistat) and Onabet (Sertoconazole); in the Carribean región we launched: Supirocin; in Peru we launched: Sunderm 30; Demelan; Ureativ 10%; Fisioativ Lotion; Tazret; and in Brazil we launched Deriva Micro; Adacne-Sec.
3. Future plan of action
Commercialisation of new products for which the products are under trials at development stage.
R&D is working on various new molecules identified after a thorough study of the market These include Antifungals, Antibacterials, Antiasthmatic molecules, Antidiabetic products, Antiaging, Antiinflammatory, Antihyperlipidemic, Antiosteoporosis and Antiemetic products, Antihypertensive molecules, Nutraceuticals, Sunscreens Products, development of formulations for various markets, specialized NDDS products and Technology – such as micro spheres & aerosols foam Mousse.
4. Expenditure on R&D:(Standalone) (` In Millions)
S. No.
Particulars 2011-2012 2010-2011
1. Capital Expenditure 36.90 89.982. Revenue Expenditure 759.57 569.203. Total 796.47 659.184. R & D Expenditure as
a percentage of total turnover 4.9% 5.3%
5. Technology Absorption, Adoption and Innovation
5.1 Efforts in brief towards technology absorption, adoption and innovation:
Our efforts in the area of technology absorption, adoption and innovation are based on our own efforts in R & D. They include improvement in yield and quality, efficacy, improvement of processes and development of new processes with validation studies.
5.2 Benefits derived are new introduction of products, improvement in the yield and quality, safety, & efficacy of products, cost reduction of products and processes without affecting the quality of the products and process efficacy. Our R&D Centre is recognised by D.S.I.R., Ministry of Science and Technology, Government of India.
5.3 Information regarding technology imported during the last five years – Nil.
C. FOREIGN EXCHANGE EARNINGS AND OUTGO
1. Activities relating to exports; initiatives taken to increase exports; development of new export plans: for products and services; and export plans. The Management Discussion & Analysis report forming a part of the Directors’ Report deals with the same.
2. Total foreign exchange earned was ` 5,661.87 millions and outflow was ` 2,016.54 millions.
For and on behalf of the Board of Directors
Glenn SaldanhaChairman & Managing Director
Place: MumbaiDate: 08 May 2012

34 Glenmark Pharmaceuticals Limited
ANNEXURE - BDisc losure in the Directors’ Report as per SEBI Guidelines for the year 2011-12:
S. No
Particulars
a Options granted 10,386,900
b Pricing Formula Exercise Price shall be the latest available closing market price of the equity shares of the Company, prior to the date of grant.
c Options Vested** 7,777,500
d Options Exercised** 2,950,150
e Total no. of shares arising as result of exercise of Options
2,950,150
f Options lapsed* 6,017,450
g Variation in terms of Options None
h Money realised by exerise of Options (in ` Millions) 182.31
i Total number of options in force** 1,419,300
* Lapsed Options includes options cancelled/lapsed.
** The number of options have been reported as on 31.03.2012
j Employee wise details of options granted to:
- Senior Management Name of the employee No of options granted
Sandeep Gupta 25,000
- any other employee who receives a grant in any one year of option amounting to 5% or more of option granted during that year
None
- employees who were granted option, during any one year, equal to or exceeding 1% of the issued capital (excluding warrants and conversions) of the Company at the time of grant
None
k Diluted earnings per share pursuant to issue of shares on exercise of option calculated in accordance with AS 20 ‘Earnings per Share’
l Proforma Adjusted Net Income and Earning Per Share
Particulars ` In Millions
Net Income (As Reported) 2,652.99
Add: Intrinsic Value Compensation Cost NIL
Less: Fair Value Compensation Cost 0.25
Adjusted Proforma Net Income 2,652.74
Earning Per Share: Basic
As Reported: 9.81
Adjusted Proforma 9.80
Earning Per Share: Diluted
As Reported: 9.80
Adjusted Proforma 9.80
m Weighted average exercise price of Options granted during the year whose
i. Exercise price equals market price 319.25
ii. Exercise price is greater than market price NA
iii. Exercise price is less than market price NA

35Annual Report 2011 - 2012
Weighted average fair value of options granted during the year whose
i. Exercise price equals market price 187.91
ii. Exercise price is greater than market price NA
iii. Exercise price is less than market price NA
n Description of method and significant assumptions used to estimate the fair value of options
The fair value of the options granted has been estimated using the Black-Scholes option pricing Model. Each tranche of vesting have been considered as a separate grant for the purpose of valuation. The assumptions used in the estimation of the same has been detailed below:
Variables Weighted average values for options granted during the year
Stock Price 311.80
Volatility 53.79%
Risk free Rate 8.54%
Exercise Price 319.25
Time To Maturity 6.00
Dividend yield 0.17%
187.91
Stock Price: Closing price on NSE as on the date of grant has been considered for valuing the grants.
Volatility: We have considered the historical volatility of the stock till the date of grant to calculate the fair value.
Risk-free rate of return: The risk-free interest rate being considered for the calculation is the interest rate applicable for a maturity equal to the expected life of the options based on the zero-coupon yield curve for Government Securities.
Exercise Price: The Exercise Price is the latest available closing market price of the equity shares of the Company, prior to the date of grant, for the respective grants.
Time to Maturity: Time to Maturity / Expected Life of options is the period for which the Company expects the options to be live. The minimum life of a stock option is the minimum period before which the options cannot be exercised and the maximum life is the maximum period after which the options cannot be exercised.
Expected divided yield: Expected dividend yield has been calculated as an average of dividend yields for the four financial years preceding the date of the grant.
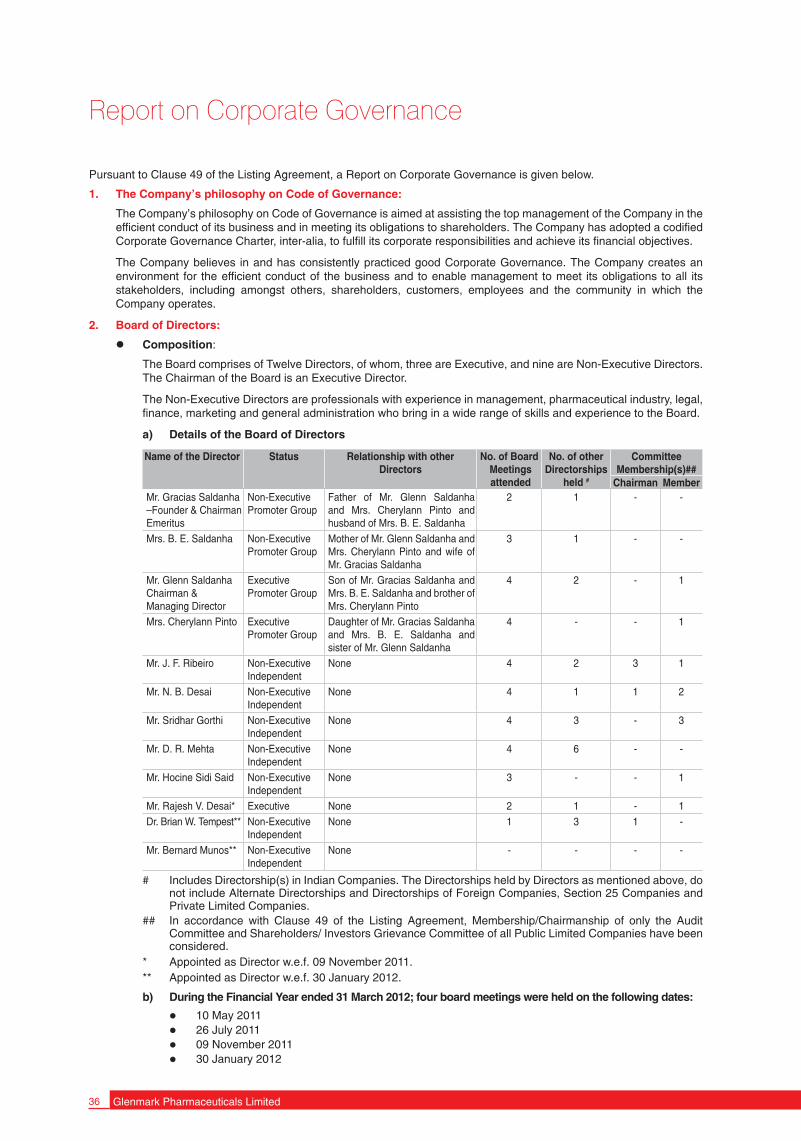
36 Glenmark Pharmaceuticals Limited
Report on Corporate Governance
Pursuant to Clause 49 of the Listing Agreement, a Report on Corporate Governance is given below.
1. The Company’s philosophy on Code of Governance:
The Company’s philosophy on Code of Governance is aimed at assisting the top management of the Company in the efficient conduct of its business and in meeting its obligations to shareholders. The Company has adopted a codified Corporate Governance Charter, inter-alia, to fulfill its corporate responsibilities and achieve its financial objectives.
The Company believes in and has consistently practiced good Corporate Governance. The Company creates an environment for the efficient conduct of the business and to enable management to meet its obligations to all its stakeholders, including amongst others, shareholders, customers, employees and the community in which the Company operates.
2. Board of Directors:
� Composition:
The Board comprises of Twelve Directors, of whom, three are Executive, and nine are Non-Executive Directors. The Chairman of the Board is an Executive Director.
The Non-Executive Directors are professionals with experience in management, pharmaceutical industry, legal, finance, marketing and general administration who bring in a wide range of skills and experience to the Board.
a) Details of the Board of Directors
Name of the Director Status Relationship with other Directors
No. of Board Meetings attended
No. of otherDirectorships
held #
Committee Membership(s)##
Chairman MemberMr. Gracias Saldanha –Founder & Chairman Emeritus
Non-Executive Promoter Group
Father of Mr. Glenn Saldanha and Mrs. Cherylann Pinto and husband of Mrs. B. E. Saldanha
2 1 - -
Mrs. B. E. Saldanha Non-Executive Promoter Group
Mother of Mr. Glenn Saldanha and Mrs. Cherylann Pinto and wife of Mr. Gracias Saldanha
3 1 - -
Mr. Glenn Saldanha Chairman & Managing Director
Executive Promoter Group
Son of Mr. Gracias Saldanha and Mrs. B. E. Saldanha and brother of Mrs. Cherylann Pinto
4 2 - 1
Mrs. Cherylann Pinto Executive Promoter Group
Daughter of Mr. Gracias Saldanha and Mrs. B. E. Saldanha and sister of Mr. Glenn Saldanha
4 - - 1
Mr. J. F. Ribeiro Non-Executive Independent
None 4 2 3 1
Mr. N. B. Desai Non-Executive Independent
None 4 1 1 2
Mr. Sridhar Gorthi Non-Executive Independent
None 4 3 - 3
Mr. D. R. Mehta Non-Executive Independent
None 4 6 - -
Mr. Hocine Sidi Said Non-Executive Independent
None 3 - - 1
Mr. Rajesh V. Desai* Executive None 2 1 - 1Dr. Brian W. Tempest** Non-Executive
IndependentNone 1 3 1 -
Mr. Bernard Munos** Non-Executive Independent
None - - - -
# Includes Directorship(s) in Indian Companies. The Directorships held by Directors as mentioned above, do not include Alternate Directorships and Directorships of Foreign Companies, Section 25 Companies and Private Limited Companies.
## In accordance with Clause 49 of the Listing Agreement, Membership/Chairmanship of only the Audit Committee and Shareholders/ Investors Grievance Committee of all Public Limited Companies have been considered.
* Appointed as Director w.e.f. 09 November 2011. ** Appointed as Director w.e.f. 30 January 2012.
b) During the Financial Year ended 31 March 2012; four board meetings were held on the following dates:
� 10 May 2011 � 26 July 2011 � 09 November 2011 � 30 January 2012

37Annual Report 2011 - 2012
• None of the Non-Executive Directors of the Company, have any pecuniary relationship or transactions with the Company other than sitting fees paid for attending board meeting/committee meetings.
• Mr. Glenn Saldanha, Mrs. Cherylann Pinto and Mr. J. F. Ribeiro attended the last Annual General Meeting of the Company held on 11 August 2011.
• Information flow to the Board Members
We present our Operating plans of our businesses to the Board for their review, inputs and approval. Likewise, our Quarterly Financial Statements and Annual Financial Statements are first presented to the Audit Committee and subsequently to the Board of Directors for their approval. In most cases information to Directors is submitted along with the Agenda papers well in advance of the Board Meeting, in some instances documents are tabled during the course of the Board Meetings or the Appropriate Committees of the Board.
The Company has adopted the Glenmark Code of Conduct for Executive Directors, Senior Management Personnel and other Executives of the Company. The Company has received confirmations from the Managing Director as well as Senior Management Personnel regarding compliance of the Code during the year under review. It has also adopted the Glenmark Code of Conduct for Non-Executive Directors of the Company. The Company has received confirmations from the Non-Executive Directors regarding compliance of the Code for the year under review.
• Post-meeting follow-up system
After the Board Meetings, we have a formal system of follow up, review and reporting on actions taken by the management on the decisions of the Board and sub-committees of the Board.
3. Board Committees:
As per Listing Agreement, the Board has formed three committees: Audit Committee, Compensation Committee and Shareholders’/Investors’ Grievance Committee.
1. AUDIT COMMITTEE:
� Your Company has a qualified and independent Audit Committee. The primary objective of the committee is to monitor and provide effective supervision of the Management’s financial reporting process to ensure accurate and timely disclosures, with the highest levels of transparency, integrity and quality of financial reporting. The committee oversees the work carried out in the financial reporting process by the Management, the internal auditors and the independent auditor, and notes the processes and the safeguards employed by each. The committee has the ultimate authority and responsibility to select, evaluate and, where appropriate, replace the independent auditor in accordance with the law. All possible measures must be taken by the committee to ensure the objectivity and independence of the independent auditor.
� Terms of Reference:
a) Approving and implementing the audit procedures and techniques.
b) Reviewing audit reports of both statutory and internal auditors with auditors and management.
c) Reviewing financial reporting systems, internal control systems and control procedures.
d) Ensuring compliance with regulatory guidelines.
e) Reviewing the quarterly, half-yearly and annual financial results of the Company before submission to the Board.
� During the Financial Year ended 31 March 2012, the committee met four times on 09 May 2011; 25 July 2011; 08 November 2011 and 30 January 2012.
� Audit Committee Attendance during the fiscal 2012
NameNo. of meetings
RemarksHeld Attended
Mr. N. B. Desai* 4 4 ChairmanMr. J. F. Ribeiro** 4 4 MemberMr. Sridhar Gorthi 4 3 MemberMr. Hocine Sidi Said# 4 1 Member
* Appointed as Chairman w.e.f 30 January 2012.
** Ceased to be Chairman w.e.f 30 January 2012.
# Appointed as Member w.e.f 30 January 2012.
� Mr. Glenn Saldanha, Chairman & Managing Director; Mr. Rajesh V. Desai, Executive Director & CFO and Mr. Prakash Sevekari, Cost Auditor are permanent invitees to all Audit Committee Meetings. The statutory

38 Glenmark Pharmaceuticals Limited
auditors of the Company are present in the Audit Committee meetings during the year. The Company Secretary officiates as the secretary of the Committee. The terms of reference of this committee are wide enough covering matters specified in the Companies Act, 1956 read together with Clause 49 of the Listing Agreement of the Stock Exchange. The current Charter of the Audit Committee is in line with international best practices and the regulatory changes formulated by SEBI and the listing agreements with the stock exchanges on which your Company is listed.
2. SHAREHOLDERS’ / INVESTORS’ GRIEVANCES COMMITTEE:
� The committee has the mandate to review and redress shareholder grievances. The committee reviews shareholders’ complaints and resolution thereof. The committee expresses satisfaction with the Company’s performance in dealing with investor grievances and its share transfer system.
� Four investor grievance committee meetings were held during the year - 09 May 2011; 24 July 2011; 08 November 2011 and 30 January 2012.
� Shareholders’/Investors’ Grievances Committee Attendance during the fiscal 2012
NameNo. of meetings
RemarksHeld Attended
Mr. J. F. Ribeiro 4 4 Chairman Mr. Glenn Saldanha 4 4 MemberMr. N. B. Desai 4 4 MemberMrs. Cherylann Pinto 4 4 Member
� The Details of complaints resolved during the year ended 31 March 2012 are as follows.
No. of complaints 2011-2012 2010-2011Received 39 39Resolved 39 39Pending NIL NIL
� Name & Designation of Compliance Officer:
Mr. Sanjay Chowdhary, Jt. Company Secretary & Compliance Officer.
� The Company's Registrars, Karvy Computershare Private Ltd., had received letters/complaints during the financial year, all of which were replied/resolved to the satisfaction of the shareholders.
3. COMPENSATION COMMITTEE:
� The purpose of the committee of the Board of Directors (‘the Board’) shall be to discharge the Board’s responsibilities related to compensation of the Company’s executive directors. The committee has the overall responsibility of approving and evaluating the compensation plans, policies and programs for executive directors.
� Broad terms of reference of the Compensation Committee:
i. To recommend and review remuneration package of Executive / Non-Executive Directors.
ii. To approve issue of stock options to the employees.
Three Compensation Committee meetings were held during the year - 09 November 2011, 07 December 2011 and 30 December 2011.
� Compensation Committee Attendance during the fiscal 2012
NameNo. of meetings
RemarksHeld Attended
Mr. J. F. Ribeiro 3 3 Chairman Mr. Glenn Saldanha 3 3 MemberMr. N. B. Desai 3 3 MemberMr. Sridhar Gorthi 3 3 Member
� Compensation Policy:
The Company follows a market linked remuneration policy, which is aimed at enabling the Company to attract and retain the best talent. Compensation is also linked to individual and team performance as they support the achievement of Corporate Goals. The Company has formulated an Employee Stock Option Scheme for rewarding and retaining performers.
4. Remuneration of Directors:
� The compensation committee determines and recommends to the Board the compensation payable to the directors. All Board-level compensation is approved by the shareholders and separately disclosed

39Annual Report 2011 - 2012
in the financial statements. Remuneration of the executive directors consists of a fixed component and a performance incentive. The annual compensation of the executive directors is approved by the compensation committee, within the parameters set by the shareholders at the shareholders’ meetings.
� The Remuneration Committee also functions as the Compensation Committee as per SEBI guidelines on the Employees’ Stock Option Scheme.
� The remuneration of the executive and non-executive Directors of your Company is decided by the Board of Directors on the terms and conditions as per the recommendation by the Compensation Committee.
� Given below are the details of remuneration/fees/commission paid to Directors during the financial year ended 31 March 2012:
S. No.
Name of Director Salaries Retirement benefits/other
reimbursements
Commission Sitting Fees Total
Amount (`)
Amount (`)
Amount (`)
Amount (`)
Amount (`)
1 Mr. Gracias Saldanha - - - 40,000 40,000
2 Mrs. B. E. Saldanha - - - 60,000 60,000
3 Mr. Glenn Saldanha 45,349,145 10,098,346 2,679,000 - 58,126,491
4 Mrs. Cherylann Pinto 11,551,270 1,649,955 1,969,653 - 15,170,878
5 Mr. Rajesh V. Desai 9,511,988 1,142,818 1,091,232 - 11,746,038
6 Mr. J. F. Ribeiro - - - 160,000 160,000
7 Mr. N. B. Desai - - - 160,000 160,000
8 Mr. Sridhar Gorthi - - - 140,000 140,000
9 Mr. D. R. Mehta - - - 80,000 80,000
10 Mr. Hocine Sidi Said - - - 80,000 80,000
11 Dr. Brian W. Tempest - - - 20,000 20,000
12 Mr. Bernard Munos - - - - -
TOTAL 66,412,403 12,891,119 5,739,885 740,000 85,783,407
Notes:
1. Mr. Glenn Saldanha, Chairman & Managing Director and Mrs. Cherylann Pinto, Director – Corporate Affairs hold office as Executive Directors upto 15 May 2012 and have been reappointed subject to the approval of the shareholders at the Annual General Meeting for the term of five years w.e.f. 16 May 2012. The service contract can be terminated with a notice of six months.
2. Mr. Rajesh V. Desai was appointed as Executive Director w.e.f 09 November 2011 for a term of five years. The service contract can be terminated with a notice of six months.
3. Sitting fees of ` 140,000 of Mr. Sridhar Gorthi was paid to Trilegal on his behalf.
Shareholding of the Non-executive/ Independent directors in the Company as on 31 March 2012:
Director Equity Shares (Nos.)Mr. Gracias Saldanha 262,660Mrs. B. E. Saldanha 221,306Mr. J. F. Ribeiro 45,800Mr. N. B. Desai 30,000Mr. Sridhar Gorthi 559Mr. D. R. Mehta NILMr. Hocine Sidi Said NILMr. Bernard Munos NILDr. Brian W. Tempest NIL
5. Disclosures by Management :
a) No material, financial and commercial transactions were reported by the management to the Board, in which the management had personal interest having a potential conflict with the interest of the Company at large.

40 Glenmark Pharmaceuticals Limited
b) There are no transactions with the Director or Management, their associates or their relatives etc. that may have potential conflict with the interest of the Company at large.
c) There was no non-compliance during the last three years by the Company on any matter related to capital market. Consequently, there were neither penalties imposed nor strictures passed on the Company by Stock Exchanges, SEBI or any Statutory Authority.
d) Though there is no formal Whistle Blower Policy, the Company takes cognizance of the complaints made and suggestions given by the employees and others. Even anonymous complaints are looked into and whenever necessary, suitable corrective steps are taken. No employee of the Company has been denied access to the Audit Committee of the Board of Directors of the Company.
e) The Company has fulfilled a non-mandatory requirement as prescribed in Annexure I D to Clause 49 of the Listing Agreement with the Stock Exchanges, related to Remuneration Committee (Compensation Committee). Please see the Para on Compensation Committee.
6. Disclosures regarding the appointment or re-appointment of directors:
According to the Articles of Association, one-third of the directors retire by rotation and, if eligible, seek re-appointment at the Annual General Meeting of shareholders. Mr. Gracias Saldanha; Mr. N. B. Desai and Mr. Hocine Sidi Said will retire in the ensuing Annual General Meeting. The Board has recommended the re-appointment of all the retiring directors. The Board also decided to re-appoint Mr. Glenn Saldanha as Chairman and Managing Director and Mrs. Cherylann Pinto as Wholetime Director designated as Director – Corporate Affairs. These re-appointments are effective from 16 May 2012. The Board appointed Mr. Rajesh V Desai as Wholetime Director designated as Executive Director & CFO with effect from 09 November 2011. Dr. Brian W. Tempest and Mr. Bernard Munos were appointed as Additional Directors with effect from 30 January 2012 and hold office upto the date of ensuing Annual General Meeting. The detailed profiles of all these directors are provided in the Notice convening the Annual General Meeting.
7. General Body Meetings:
� The last three Annual General Meetings of the Company were held at the venue and time as under:
Financial Year Ended
Date and Time Venue Special Resolution Passed
31 March 2009 25 September 2009 at 11 am
Sunville Banquet & Conference Hall3rd floor, Dr. Annie Besant Road,Worli, Mumbai - 400 018.
None
31 March 2010 27 September 2010 at 11 am
Sunville Banquet & Conference Hall3rd floor, Dr. Annie Besant Road,Worli, Mumbai - 400 018.
None
31 March 2011 11 August 2011 at 11 am
Sunville Banquet & Conference Hall3rd floor, Dr. Annie Besant Road,Worli, Mumbai - 400 018.
None
� All resolutions moved at the last Annual General Meeting were passed by a show of hands by requisite majority of members who attended the meeting.
� No special resolutions were passed last year through postal ballot.
� There are no special resolutions proposed for the ensuing Annual General Meeting which need to be passed by Postal Ballot.
8. Shareholders information:
Share Transfer Process:
The shares are sent/received for physical transfer at R & T’s office and all valid transfer requests are processed and returned within a period of 30 days from the date of receipt.
Dematerialisation of shares and Liquidity:
As of 31 March 2012; 99.10% of shares have been dematerialised and held in electronic form through NSDL and CDSL. The shares of your Company are permitted to be traded only in dematerialised form.
Shareholding Pattern as at 31 March 2012:
Description No. of Shareholders Shares held % to EquityCo mpany Promoters 14 130,589,649 48.27Foreign Institutional Investor 198 94,455,776 34.92Resident Individuals 61,186 25,109,109 9.28Indian Financial Institutions 21 9,055,129 3.35Bodies Corporates 927 4,772,811 1.76
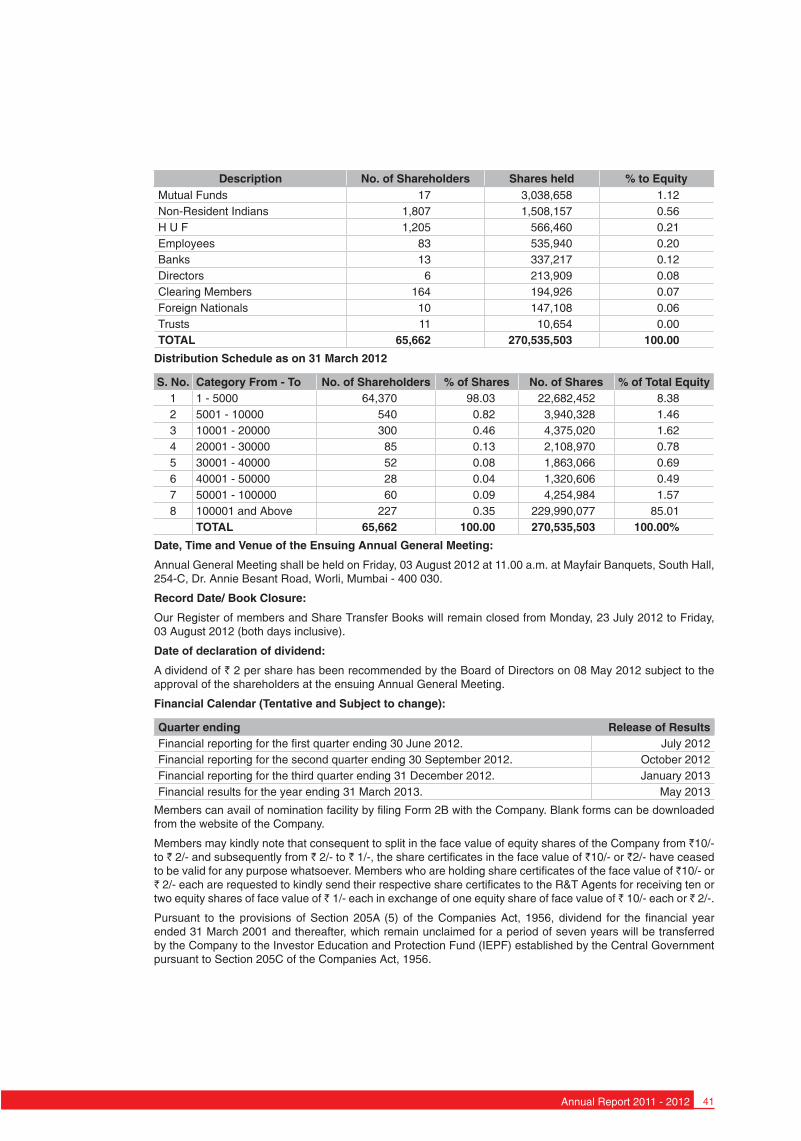
41Annual Report 2011 - 2012
Description No. of Shareholders Shares held % to EquityMutual Funds 17 3,038,658 1.12Non-Resident Indians 1,807 1,508,157 0.56H U F 1,205 566,460 0.21Employees 83 535,940 0.20Banks 13 337,217 0.12Directors 6 213,909 0.08Clearing Members 164 194,926 0.07Foreign Nationals 10 147,108 0.06Trusts 11 10,654 0.00TOTAL 65,662 270,535,503 100.00
Distribution Schedule as on 31 March 2012
S. No. Category From - To No. of Shareholders % of Shares No. of Shares % of Total Equity1 1 - 5000 64,370 98.03 22,682,452 8.382 5001 - 10000 540 0.82 3,940,328 1.463 10001 - 20000 300 0.46 4,375,020 1.624 20001 - 30000 85 0.13 2,108,970 0.785 30001 - 40000 52 0.08 1,863,066 0.696 40001 - 50000 28 0.04 1,320,606 0.497 50001 - 100000 60 0.09 4,254,984 1.578 100001 and Above 227 0.35 229,990,077 85.01
TOTAL 65,662 100.00 270,535,503 100.00%
Date, Time and Venue of the Ensuing Annual General Meeting:
Annual General Meeting shall be held on Friday, 03 August 2012 at 11.00 a.m. at Mayfair Banquets, South Hall, 254-C, Dr. Annie Besant Road, Worli, Mumbai - 400 030.
Record Date/ Book Closure:
Our Register of members and Share Transfer Books will remain closed from Monday, 23 July 2012 to Friday,03 August 2012 (both days inclusive).
Date of declaration of dividend:
A dividend of ` 2 per share has been recommended by the Board of Directors on 08 May 2012 subject to the approval of the shareholders at the ensuing Annual General Meeting.
Financial Calendar (Tentative and Subject to change):
Quarter ending Release of ResultsFinancial reporting for the first quarter ending 30 June 2012. July 2012Financial reporting for the second quarter ending 30 September 2012. October 2012Financial reporting for the third quarter ending 31 December 2012. January 2013Financial results for the year ending 31 March 2013. May 2013
Members can avail of nomination facility by filing Form 2B with the Company. Blank forms can be downloaded from the website of the Company.
Members may kindly note that consequent to split in the face value of equity shares of the Company from `10/- to ` 2/- and subsequently from ` 2/- to ` 1/-, the share certificates in the face value of `10/- or `2/- have ceased to be valid for any purpose whatsoever. Members who are holding share certificates of the face value of `10/- or ` 2/- each are requested to kindly send their respective share certificates to the R&T Agents for receiving ten or two equity shares of face value of ` 1/- each in exchange of one equity share of face value of ` 10/- each or ` 2/-.
Pursuant to the provisions of Section 205A (5) of the Companies Act, 1956, dividend for the financial year ended 31 March 2001 and thereafter, which remain unclaimed for a period of seven years will be transferred by the Company to the Investor Education and Protection Fund (IEPF) established by the Central Government pursuant to Section 205C of the Companies Act, 1956.
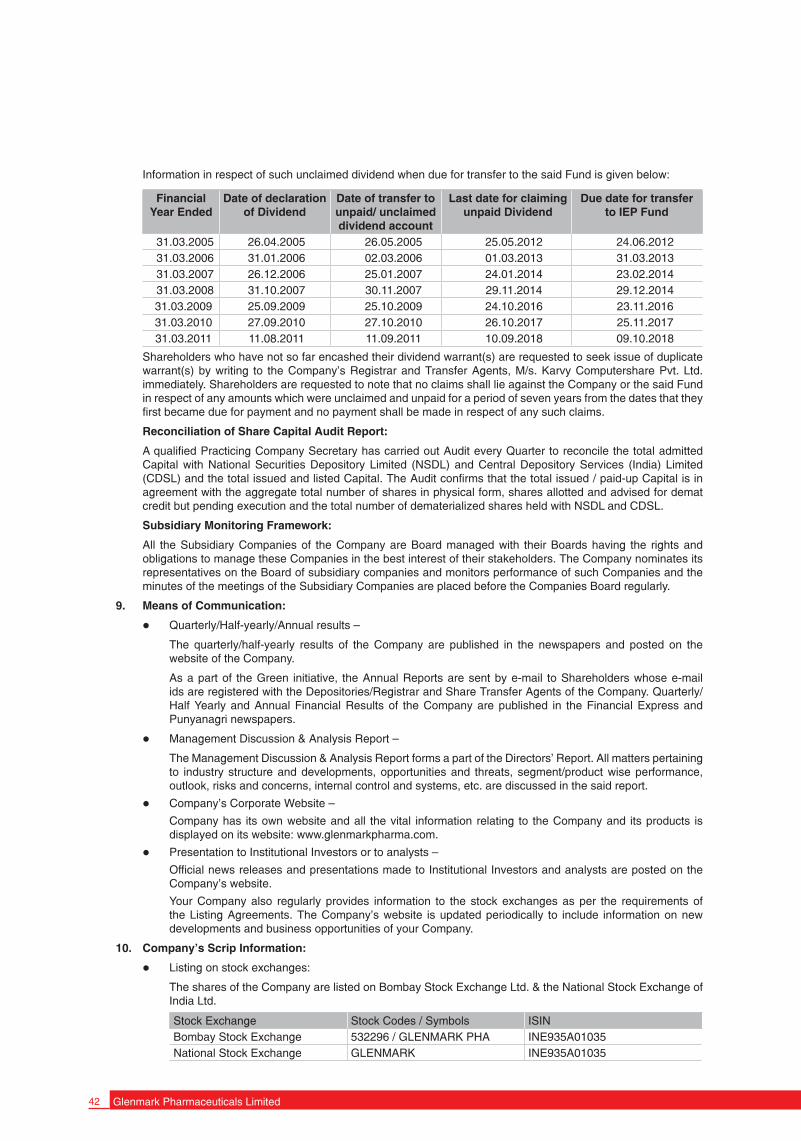
42 Glenmark Pharmaceuticals Limited
Information in respect of such unclaimed dividend when due for transfer to the said Fund is given below:
Financial Year Ended
Date of declaration of Dividend
Date of transfer to unpaid/ unclaimed dividend account
Last date for claiming unpaid Dividend
Due date for transfer to IEP Fund
31.03.2005 26.04.2005 26.05.2005 25.05.2012 24.06.2012 31.03.2006 31.01.2006 02.03.2006 01.03.2013 31.03.2013 31.03.2007 26.12.2006 25.01.2007 24.01.2014 23.02.2014 31.03.2008 31.10.2007 30.11.2007 29.11.2014 29.12.201431.03.2009 25.09.2009 25.10.2009 24.10.2016 23.11.201631.03.2010 27.09.2010 27.10.2010 26.10.2017 25.11.201731.03.2011 11.08.2011 11.09.2011 10.09.2018 09.10.2018
Shareholders who have not so far encashed their dividend warrant(s) are requested to seek issue of duplicate warrant(s) by writing to the Company’s Registrar and Transfer Agents, M/s. Karvy Computershare Pvt. Ltd. immediately. Shareholders are requested to note that no claims shall lie against the Company or the said Fund in respect of any amounts which were unclaimed and unpaid for a period of seven years from the dates that they first became due for payment and no payment shall be made in respect of any such claims.
Reconciliation of Share Capital Audit Report:
A qualified Practicing Company Secretary has carried out Audit every Quarter to reconcile the total admitted Capital with National Securities Depository Limited (NSDL) and Central Depository Services (India) Limited (CDSL) and the total issued and listed Capital. The Audit confirms that the total issued / paid-up Capital is in agreement with the aggregate total number of shares in physical form, shares allotted and advised for demat credit but pending execution and the total number of dematerialized shares held with NSDL and CDSL.
Subsidiary Monitoring Framework:
All the Subsidiary Companies of the Company are Board managed with their Boards having the rights and obligations to manage these Companies in the best interest of their stakeholders. The Company nominates its representatives on the Board of subsidiary companies and monitors performance of such Companies and the minutes of the meetings of the Subsidiary Companies are placed before the Companies Board regularly.
9. Means of Communication:
� Quarterly/Half-yearly/Annual results –
The quarterly/half-yearly results of the Company are published in the newspapers and posted on the website of the Company.
As a part of the Green initiative, the Annual Reports are sent by e-mail to Shareholders whose e-mail ids are registered with the Depositories/Registrar and Share Transfer Agents of the Company. Quarterly/Half Yearly and Annual Financial Results of the Company are published in the Financial Express and Punyanagri newspapers.
� Management Discussion & Analysis Report –
The Management Discussion & Analysis Report forms a part of the Directors’ Report. All matters pertaining to industry structure and developments, opportunities and threats, segment/product wise performance, outlook, risks and concerns, internal control and systems, etc. are discussed in the said report.
� Company’s Corporate Website –
Company has its own website and all the vital information relating to the Company and its products is displayed on its website: www.glenmarkpharma.com.
� Presentation to Institutional Investors or to analysts –
Official news releases and presentations made to Institutional Investors and analysts are posted on the Company’s website.
Your Company also regularly provides information to the stock exchanges as per the requirements of the Listing Agreements. The Company’s website is updated periodically to include information on new developments and business opportunities of your Company.
10. Company’s Scrip Information:
� Listing on stock exchanges:
The shares of the Company are listed on Bombay Stock Exchange Ltd. & the National Stock Exchange of India Ltd.
Stock Exchange Stock Codes / Symbols ISINBombay Stock Exchange 532296 / GLENMARK PHA INE935A01035National Stock Exchange GLENMARK INE935A01035

43Annual Report 2011 - 2012
� Listing fees for the year 2012-2013 have been paid to the Stock Exchanges.
� Market Information:
Market Price Data: High, low (based on closing price) and volume during each month in last financial year.
MonthBombay Stock Exchange National Stock Exchange
High Price(`)
Low Price (`)
Volume(No. of Shares)
High Price (`)
Low Price(`)
Volume(No. of Shares)
Apr-11 308.80 283.05 847,714 308.70 284.50 4,852,657May-11 327.80 262.70 5,242,262 327.80 262.00 24,117,638Jun-11 324.80 290.00 1,559,314 332.05 290.55 9,725,497Jul-11 351.20 303.00 3,038,146 351.45 302.70 14,980,318Aug-11 344.00 301.20 1,936,112 344.35 301.55 12,182,802Sep-11 337.00 313.00 906,547 337.45 315.00 6,839,188Oct-11 317.45 285.00 1,106,207 318.50 285.40 10,792,675Nov-11 341.20 295.10 1,140,258 342.95 295.10 16,519,886Dec-11 323.40 265.00 879,656 324.00 264.75 9,189,813Jan-12 324.90 285.10 1,090,370 325.00 285.00 6,806,326Feb-12 319.00 291.50 2,117,367 319.65 290.05 11,820,876Mar-12 313.90 286.15 839,033 313.50 285.30 10,191,118
Performance in comparison to broad based indices namely BSE Sensex.
Glenmark Vs. BSE SENSEX
Gle
nm
ark
BS
E S
en
sex
MonthsGlenmark BSE
0
5,000
10,000
15,000
20,000
25,000
Mar
-12
Feb
-12
Jan-
12
Dec
-11
Nov
-11
Oct
-11
Sep
-11
Aug
-11
Jul-1
1
Jun-
11
May
-11
Apr
-11
270
280
290
300
310
320
330
340
11. Corporate Identity Number (CIN)
Our Corporate Identity Number (CIN), allotted by Ministry of Company Affairs, Government of India is L24299MH1977PLC019982, and our Company Registration Number is 19982.
12. Plant Locations:
The Company's plants are located at:
i. E-37, MIDC Industrial Area, D Road, Satpur, Nasik - 422 007, Maharashtra.
ii. Unit I - Village: Kishanpura, Baddi Nalagarh Road, Tehsil: Baddi, Dist.: Solan 174 101, Himachal Pradesh.
iii. Unit II - Village: Bhattanwala, PO Rajpura, Tehsil: Nalagarh, Dist. Solan, Himachal Pradesh.
iv. Unit III - Village: Kishanpura, Baddi Nalagarh Road, Tehsil: Baddi, Dist.: Solan 174 101, Himachal Pradesh.
13. Outstanding GDR's/ ADR's/ Warrants or any Convertible instruments exercised, date and likely impact on equity:
� The Company had issued 25,000 new options under Employees Stock Option Scheme viz. ESOS’ 2003. During the Financial Year 2011-2012, 2,79,950 options were cancelled and 2,63,450 options were exercised. As of 31 March 2012; 14,19,300 options were outstanding and are due for exercise on the following dates:
ESOS’ 2 003 ESOS’ 2003
Date Number of Options Date Number of Options
26 April 2012 60,000 24 September 2013 22,200
09 July 2012 34,200 09 October 2013 35,400
14 July 2012 28,550 07 December 2013 2,500

44 Glenmark Pharmaceuticals Limited
ESOS’ 2 003 ESOS’ 2003
Date Number of Options Date Number of Options
13 August 2012 43,200 05 February 2014 17,600
22 August 2012 114,400 25 February 2014 4,500
24 September 2012 11,100 30 March 2014 23,200
09 October 2012 51,600 14 July 2014 43,100
11 October 2012 1,200 24 September 2014 33,300
09 December 2012 162,000 07 December 2014 5,000
09 January 2013 196,500 25 February 2015 6,000
05 February 2013 207,600 30 March 2015 34,800
25 February 2013 4,500 24 September 2015 44,400
20 March 2013 102,500 07 December 2015 7,500
30 March 2013 11,600 30 March 2016 46,400
09 July 2013 22,800 07 December 2016 10,000
14 July 2013 31,650
� On exercising the convertible options so granted under the ESOS of the Company, the paid-up equity share capital of the Company will increase by a like number of shares.
14. National ECS facility (NECS):
As per RBI notification, w.e.f from 01 October 2009, the remittance of money through ECS is replaced by National Electronic Clearing Services (NECS) and banks have been instructed to move to the NECS platform.
NECS essentially operates on the new and unique bank account number, allotted by banks post implementation of Core Banking Solutions (CBS) for centralized processing of inward instructions and efficiency in handling bulk transactions.
In this regard, shareholders holding shares in electronic form are requested to furnish the new 10-digit Bank Account Number allotted to you by your bank, (after implementation of CBS), along with photocopy of a cheque pertaining to the concerned account, to your Depository Participant (DP). Please send these details to the Company/Registrars, only if the shares are held in physical form, immediately.
If your bank particulars have changed for any reason, please arrange to register the NECS with the revised bank particulars.
The Company will use the NECS mandate for remittance of dividend either through NECS or other electronic modes failing which the bank details available with Depository Participant will be printed on the dividend warrant. All the arrangements are subject to RBI guidelines, issued from time to time.
Shareholders are advised to opt for payment of dividend through NECS. The salient benefits of receiving dividend payment through NECS amongst others may be listed as below:
a) There are no clearing charges in the hands of the investor/recipient, the same are borne by the Company;
b) Risk as to fraudulent encashment of the dividend warrants, loss/interception of dividend warrants in transit, are eliminated;
c) The facility ensures instant credit of the dividend amount in the desired account which to the recipient, means effortless and speedier transaction and hassle free as to revalidation etc. are done away with;
d) Once the payment is made through NECS company issues intimation letters to the investors as to credit/ payment of dividend, providing therein the details of the account and amount. Investors may download the NECS Mandate Form from the Company’s website and send the same duly filed in to registrars for updating of records.
15. Code for prevention of Insider Trading
We have comprehensive guidelines on preventive insider trading. Our guidelines are in compliance with the SEBI guidelines on prevention of Insider Trading.

45Annual Report 2011 - 2012
16. Investor Helpdesk: for clarifications / assistance, if any, please contact:-
Corporate Office Registrars & Transfer AgentsPersons to contact Mr. Sanjay Chowdhary Mr. V. Rajendra PrasadAddress Glenmark Pharmaceuticals Ltd.
Glenmark House, HDO Corporate Building, Wing A, B. D. Sawant Marg, Chakala, Off. Western Express Highway, Andheri (E), Mumbai 400 099.
Karvy Computershare Pvt. Ltd.Plot No. 17 to 24, Near Image Hospital, Vittal Rao Nagar, Madhapur, Hyderabad - 500 081.
Telephone (022) 40189999 (040) 23420818 - 828Fax No. (022) 40189986 (040) 23420814E-mail [email protected] [email protected]: www.glenmarkpharma.com www.karvy.comInvestor Redressal: [email protected] -
Declaration regarding affirmation of Code of Conduct
In terms of the requirements of the amended Clause 49 of the Listing Agreement, this is to confirm that all the members of the Board and the senior management personnel have affirmed compliance with the Code of Conduct for the year ended 31 March 2012.
Place: Mumbai Glenn Saldanha Date: 08 May 2012 Chairman & Managing Director
Certification by the Chief Executive Officer (CEO) and Chief Financial Officer (CFO) on Financial Statements of the CompanyWe, Mr. Glenn Saldanha, Chairman & Managing Director and Mr. Rajesh V. Desai, Executive Director & Chief Financial Officer, of Glenmark Pharmaceuticals Ltd., certify that:
(a) We have reviewed financial statements and cash flow statement for the year and that to the best of our knowledge and belief:
i) these statements do not contain any materially untrue statement or omit any material fact or contain statements that might be misleading;
ii) these statements together present a true and fair view of the Company’s affairs and are in compliance with existing accounting standards, applicable laws and regulations.
(b) There are, to the best of our knowledge and belief, no transactions entered into by the Company during the year which are fraudulent, illegal or violative of the Company’s code of conduct.
(c) We accept responsibility for establishing and maintaining the internal controls for financial reporting and that we have evaluated the effectiveness of internal control systems of the Company pertaining to financial reporting and we have disclosed to the auditors and the Audit Committee, deficiencies in the design or operation of such internal controls, if any, of which we are aware and the steps we have taken or propose to take to rectify these deficiencies.
(d) We have indicated to the auditors and the Audit Committee:
i) significant changes in internal control over financial reporting during the year;
ii) significant changes in accounting policies during the year and that the same have been disclosed in the notes to the financial statements;
iii) during the year there were no instances of fraud which we have become aware. The management and its employees have a significant role in the Company’s internal control system.
Glenn Saldanha Rajesh V. DesaiChairman & Managing Director Executive Director & CFO
Place: MumbaiDate: 08 May 2012

46 Glenmark Pharmaceuticals Limited
Certificate on Corporate Governance
To the Members ofGlenmark Pharmaceuticals Limited
We have reviewed the implementation of Corporate Governance procedures by Glenmark Pharmaceuticals Limited during the year ended 31 March 2012, with the relevant records and documents maintained by the Company, furnished to us for our review and report on Corporate Governance as approved by the Board of Directors.
The compliance of conditions of Corporate Governance is the responsibility of the management. Our examination was limited to a review of procedures and implementation thereof, adopted by the Company for ensuring the compliances of the conditions of Corporate Governance. It is neither an audit nor an expression of opinion on the financial statements of the Company.
In our opinion and to the best of our information and explanations given to us, we certify that the Company has complied with the conditions of Corporate Governance as stipulated in the Listing Agreement.
On the basis of our review and according to the information and explanations given to us, the conditions of Corporate Governance as stipulated in Clause 49 of the Listing Agreement(s) with the stock exchanges have been complied with in all material respect by the Company and that no investor grievance is pending for a period exceeding one month against the Company as per the records maintained by the Shareholders’/Investors’ Grievance Committee.
We further state that such compliance is neither an assurance as to the future viability of the Company nor the efficiency or effectiveness with which the management has conducted the affairs of the Company.
For and on behalf of
S.S. Rauthan & AssociatesCompany Secretaries
Surjan Singh RauthanProprietor
M. No. - FCS-4807Place: Mumbai COP-3233Date: 08 May 2012

47Annual Report 2011 - 2012
Auditors’ Report
To,The Members of Glenmark Pharmaceuticals Limited
1. We have audited the attached Balance Sheet of Glenmark Pharmaceuticals Limited (the ‘Company’), as at 31 March 2012, and also the Statement of Profit and Loss and the Cash Flow Statement for the year ended on that date annexed thereto (collectively referred as the ‘financial statements’). These financial statements are the responsibility of the Company’s management. Our responsibility is to express an opinion on these financial statements based on our audit.
2. We conducted our audit in accordance with the auditing standards generally accepted in India. Those Standards require that we plan and perform the audit to obtain reasonable assurance about whether the financial statements are free of material misstatement. An audit includes examining, on a test basis, evidence supporting the amounts and disclosures in the financial statements. An audit also includes assessing the accounting principles used and significant estimates made by management, as well as evaluating the overall financial statement presentation. We believe that our audit provides a reasonable basis for our opinion.
3. As required by the Companies (Auditor’s Report) Order, 2003 (the ‘Order’) (as amended), issued by the Central Government of India in terms of sub-section (4A) of section 227 of the Companies Act, 1956 (the ‘Act’), we enclose in the Annexure a statement on the matters specified in paragraphs 4 and 5 of the Order.
4. Further to our comments in the Annexure referred to above, we report that:
a. We have obtained all the information and explanations, which to the best of our knowledge and belief were necessary for the purposes of our audit;
b. In our opinion, proper books of account as required by law have been kept by the Company so far as appears from our examination of those books;
c. The financial statements dealt with by this report are in agreement with the books of account;
d. On the basis of written representations received from the directors, as on 31 March 2012 and taken on record by the Board of Directors, we report that none of the directors is disqualified as on 31 March 2012 from being appointed as a director in terms of clause(g) of sub-section (1) of section 274 of the Act;
e. In our opinion and to the best of our information and according to the explanations given to us, the financial statements dealt with by this report comply with the accounting standards referred to in sub-section (3C) of section 211 of the Act and give the information required by the Act, in the manner so required and give a true and fair view in conformity with the accounting principles generally accepted in India, in the case of:
i) the Balance Sheet, of the state of affairs of the Company as at 31 March 2012;
ii) the Statement of Profit and Loss, of the profit for the year ended on that date; and
iii) the Cash Flow Statement, of the cash flows for the year ended on that date.
For Walker, Chandiok & Co.Chartered AccountantsFirm Registration No: 001076N
Per Khushroo B. PanthakyPartnerMembership No: F – 42423
Place: MumbaiDate: 08 May 2012
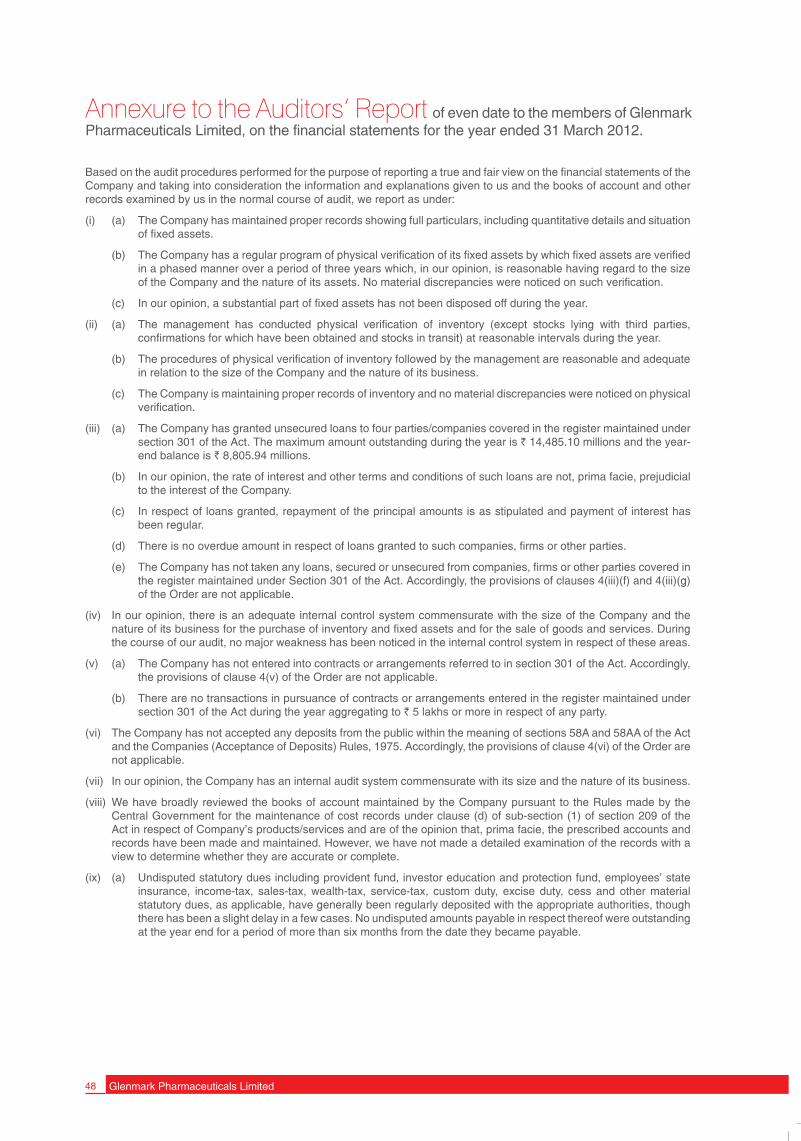
48 Glenmark Pharmaceuticals Limited
Annexure to the Auditors’ Report of even date to the members of Glenmark Pharmaceuticals Limited, on the financial statements for the year ended 31 March 2012.
Based on the audit procedures performed for the purpose of reporting a true and fair view on the financial statements of the Company and taking into consideration the information and explanations given to us and the books of account and other records examined by us in the normal course of audit, we report as under:
(i) (a) The Company has maintained proper records showing full particulars, including quantitative details and situation of fixed assets.
(b) The Company has a regular program of physical verification of its fixed assets by which fixed assets are verified in a phased manner over a period of three years which, in our opinion, is reasonable having regard to the size of the Company and the nature of its assets. No material discrepancies were noticed on such verification.
(c) In our opinion, a substantial part of fixed assets has not been disposed off during the year.
(ii) (a) The management has conducted physical verification of inventory (except stocks lying with third parties, confirmations for which have been obtained and stocks in transit) at reasonable intervals during the year.
(b) The procedures of physical verification of inventory followed by the management are reasonable and adequate in relation to the size of the Company and the nature of its business.
(c) The Company is maintaining proper records of inventory and no material discrepancies were noticed on physical verification.
(iii) (a) The Company has granted unsecured loans to four parties/companies covered in the register maintained under section 301 of the Act. The maximum amount outstanding during the year is ` 14,485.10 millions and the year-end balance is ` 8,805.94 millions.
(b) In our opinion, the rate of interest and other terms and conditions of such loans are not, prima facie, prejudicial to the interest of the Company.
(c) In respect of loans granted, repayment of the principal amounts is as stipulated and payment of interest has been regular.
(d) There is no overdue amount in respect of loans granted to such companies, firms or other parties.
(e) The Company has not taken any loans, secured or unsecured from companies, firms or other parties covered in the register maintained under Section 301 of the Act. Accordingly, the provisions of clauses 4(iii)(f) and 4(iii)(g) of the Order are not applicable.
(iv) In our opinion, there is an adequate internal control system commensurate with the size of the Company and the nature of its business for the purchase of inventory and fixed assets and for the sale of goods and services. During the course of our audit, no major weakness has been noticed in the internal control system in respect of these areas.
(v) (a) The Company has not entered into contracts or arrangements referred to in section 301 of the Act. Accordingly, the provisions of clause 4(v) of the Order are not applicable.
(b) There are no transactions in pursuance of contracts or arrangements entered in the register maintained under section 301 of the Act during the year aggregating to ` 5 lakhs or more in respect of any party.
(vi) The Company has not accepted any deposits from the public within the meaning of sections 58A and 58AA of the Act and the Companies (Acceptance of Deposits) Rules, 1975. Accordingly, the provisions of clause 4(vi) of the Order are not applicable.
(vii) In our opinion, the Company has an internal audit system commensurate with its size and the nature of its business.
(viii) We have broadly reviewed the books of account maintained by the Company pursuant to the Rules made by the Central Government for the maintenance of cost records under clause (d) of sub-section (1) of section 209 of the Act in respect of Company’s products/services and are of the opinion that, prima facie, the prescribed accounts and records have been made and maintained. However, we have not made a detailed examination of the records with a view to determine whether they are accurate or complete.
(ix) (a) Undisputed statutory dues including provident fund, investor education and protection fund, employees’ state insurance, income-tax, sales-tax, wealth-tax, service-tax, custom duty, excise duty, cess and other material statutory dues, as applicable, have generally been regularly deposited with the appropriate authorities, though there has been a slight delay in a few cases. No undisputed amounts payable in respect thereof were outstanding at the year end for a period of more than six months from the date they became payable.

49Annual Report 2011 - 2012
(b) The dues outstanding in respect of sales-tax, excise duty, on account of any dispute, are as follows:
Name of the statute
Nature of dues
Amount (` millions)
Period to which the amount relates
Forum where dispute is pending
Income Tax Act, 1961
Income Tax 128.24 A.Y 2009-10 Commissioner Income Tax Appeals
The Central Excise Act, 1944
Excise Duty
10.00 April 2003 to September 2007
The Central Excise and Service Tax Appellate Tribunal
Finance Act, 1994
Service Tax 9.71 FY 2004-05 and FY 2005-06 The Central Excise and Service Tax Appellate Tribunal
The Gujarat Sales Tax Act, 1969
Sales Tax 0.2 F.Y 2004-05 Deputy Commissioner (CT) Appeals
The Central Sales Tax Act, 1956
Central Sales Tax
1.86 FY 2004-05 Deputy Commissioner (CT) Appeals
The Central Sales Tax Act, 1956
Central Sales Tax
1.57 FY 2006-07 Deputy Commissioner (CT) Appeals
The Central Sales Tax Act, 1956
Central Sales Tax
2.89 FY 2007-08 Deputy Commissioner (CT) Appeals
(x) In our opinion, the Company has no accumulated losses at the end of the financial year and it has not incurred cash losses in the current and the immediately preceding financial year.
(xi) In our opinion, the Company has not defaulted in repayment of dues to a financial institution or a bank during the year.
(xii) The Company has not granted any loans and advances on the basis of security by way of pledge of shares, debentures and other securities. Accordingly, the provisions of clause 4(xii) of the Order are not applicable.
(xiii) In our opinion, the Company is not a chit fund or a nidhi/mutual benefit fund/society. Accordingly, the provisions of clause 4(xiii) of the Order are not applicable.
(xiv) In our opinion, the Company is not dealing in or trading in shares, securities, debentures and other investments. Accordingly, the provisions of clause 4(xiv) of the Order are not applicable.
(xv) In our opinion, the terms and conditions on which the Company has given guarantee for loans taken by others from banks or financial institutions are not, prima facie, prejudicial to the interest of the Company.
(xvi) In our opinion, the Company has applied the term loans for the purpose for which the loans were obtained.
(xvii) In our opinion, no funds raised on short-term basis have been used for long-term investment.
(xviii)During the year, the Company has not made any preferential allotment of shares to parties or companies covered in the register maintained under section 301 of the Act. Accordingly, the provisions of clause 4(xviii) of the Order are not applicable.
(xix) The Company has neither issued nor had any outstanding debentures during the year. Accordingly, the provisions of clause 4(xix) of the Order are not applicable.
(xx) The Company has not raised any money by public issues during the year. Accordingly, the provisions of clause 4(xx) of the Order are not applicable.
(xxi) N o fraud on or by the company has been noticed or reported during the period covered by our audit.
For Walker, Chandiok & Co.Chartered AccountantsFirm Registration No: 001076N
Per Khushroo B. PanthakyPartnerMembership No: F – 42423
Place: MumbaiDate: 08 May 2012

50 Glenmark Pharmaceuticals Limited
Balance Sheet(All amounts in millions of Indian Rupees, unless otherwise stated)
Note No.As at
31 March 2012As at
31 March 2011EQUITY AND LIABILITIESShareholders’ funds(a) Share capital 1 270.53 270.27 (b) Reserve and surplus 2 21,586.55 19,527.14
21,857.08 19,797.41 Non-current liabilities(a) Long-term borrowings 3 2,543.50 2,745.70 (b) Deferred tax liabilities (net) 4 238.01 229.30 (c) Other Long-term liabilities 5 778.42 31.23
3,559.93 3,006.23 Current liabilities(a) Short-term borrowings 6 2,220.89 7,973.83 (b) Trade payables 7 2,704.99 1,758.61 (c) Other current liabilities 8 644.14 1,007.99 (d) Short-term provisions 9 703.58 198.00
6,273.60 10,938.43 TOTAL 31,690.61 33,742.07
ASSETSNon-current assets(a) Fixed assets 10 (i) Tangible assets 2,162.68 2,160.20 (ii) Intangible assets 74.90 77.59 (iii) Capital work-in-progress 655.71 312.53 (iv) Intangible assets under development 33.70 23.40
2,926.99 2,573.72 (b) Non-current investments 11 10,832.69 10,412.47 (c) Long-term loans and advances 12 9,552.03 15,401.46 (d) Other non-current assets 13 1,018.31 530.61
24,330.02 28,918.26 Current assets(a) Inventories 14 1,759.27 1,570.07 (b) Trade receivables 15 3,587.43 1,893.44 (c) Cash and Bank Balances 16 475.14 309.49 (d) Short term loans and advances 17 670.45 236.94 (e) Other Current assets 18 868.30 813.87
7,360.59 4,823.81 TOTAL 31,690.61 33,742.07
Notes referred to above form an integral part of the Balance Sheet
This is the Balance Sheet referred to in our report of even date.
For Walker, Chandiok & Co. For and on behalf of the Board of DirectorsChartered Accountants
Khushroo B. Panthaky Glenn Saldanha Cherylann PintoPartner Chairman & Managing Director Executive Director
Rajesh Desai Marshall MendonzaPlace: Mumbai Executive Director & CFO Vice President &Date: 08 May 2012 Company Secretary

51Annual Report 2011 - 2012
Statement of Profit and Loss (All amounts in millions of Indian Rupees, unless otherwise stated)
Note No.Year ended
31 March 2012Year ended
31 March 2011
INCOME
Revenue from operations 19 15,646.65 11,629.39
Other income 20 551.04 717.52
Total Revenue 16,197.69 12,346.91
EXPENDITURE
Cost of materials consumed 21 3,376.69 2,404.91
Purchases of Stock-in-trade 22 1,049.47 871.58
Changes in inventories of finished goods, work-in-progressand Stock-in-trade
23 (128.63) 139.89
Employee benefit expenses 24 2,468.09 1,741.57
Finance costs 25 608.69 857.50
Depreciation and amortisation expenses 26 211.13 209.88
Other expenses 27 5,771.28 3,613.65
Total expenses 13,356.72 9,838.98
Profit before tax 2,840.97 2,507.93
Tax expense:
(i) Current tax 554.00 673.98
(ii) MAT Credit (entitlement)/utilisation (374.73) (286.15)
(iii) Deferred tax 8.71 (1.68)
187.98 386.15
Profit for the period 2,652.99 2,121.78
Earnings per equity share of face value of ` 1 each. 30
Basic (in `) 9.81 7.86
Diluted (in `) 9.80 7.85
Notes referred to above form an integral part of the Statement of Profit and Loss
This is the Statement of Profit and Loss referred to in our report of even date.
For Walker, Chandiok & Co. For and on behalf of the Board of DirectorsChartered Accountants
Khushroo B. Panthaky Glenn Saldanha Cherylann PintoPartner Chairman & Managing Director Executive Director
Rajesh Desai Marshall MendonzaPlace: Mumbai Executive Director & CFO Vice President &Date: 08 May 2012 Company Secretary

52 Glenmark Pharmaceuticals Limited
Cash Flow Statement(All amounts in millions of Indian Rupees, unless otherwise stated)
Year ended31 March 2012
Year ended31 March 2011
A. Cash flow from operating activities
Net profit before tax 2,840.97 2,507.93
Adjustments for:
Depreciation/Amortisation 211.13 209.88
Interest expense 608.69 857.50
Interest income (431.37) (496.68)
Income from investments - dividends (0.07) -
Loss on sale of fixed assets 4.72 0.37
Provision for doubtful debts - 15.00
Provision for gratuity and leave encashment 73.99 42.17
Unrealised foreign exchange gain (319.06) (275.88)
Operating profit before working capital changes 2,989.00 2,860.29
Adjustments for changes in working capital:
- (Increase)/Decrease in trade receivables (1,590.67) 1,435.40
- (Increase)/Decrease in other receivables (701.00) (149.05)
-(Increase)/Decrease in inventories (189.19) (66.10)
- Increase/(Decrease) in trade and other payables 1,898.47 606.95
Cash generated from operations 2,406.61 4,687.49
- Taxes paid (net of tax deducted at source) (460.08) (476.87)
Net cash generated from operating activities 1,946.53 4,210.62
B. Cash flow from investing activities
Purchase of fixed assets (including Capital work-in-progress) (576.77) (536.28)
Proceeds from sale of fixed assets 17.66 15.77
Investments in subsidiaries (420.22) (483.27)
Loans and advances to subsidiaries/enterprise 6,705.65 (6,338.42)
(Increase)/decrease in restricted Cash (1.08) (1.30)
Share application money paid (123.12) -
Interest received 413.09 796.28
Dividend received 0.07 -
Net cash from/(used in) investing activities 6,015.28 (6,547.22)

53Annual Report 2011 - 2012
Cash Flow Statement(All amounts in millions of Indian Rupees, unless otherwise stated)
Year ended31 March 2012
Year ended31 March 2011
C. Cash flow from financing activities
Proceeds from fresh issue of
- Share capital including securities premium (net of issue expenses) 35.56 40.86
Repayment of long-term borrowings (1,108.28) (1,242.87)
Proceeds/(repayment) of short-term borrowings (5,599.88) 5,491.49
Proceeds/(repayment) from working capital facilities (388.93) 1,250.63
Redemption of FCCB (including premium and tax) - (1,959.48)
Interest paid (609.64) (860.79)
Dividend paid (including dividend distribution tax) (126.08) (125.82)
Net cash from/(used in) financing activities (7,797.25) 2,594.02
Net increase in cash and cash equivalents 164.56 257.42
Opening balance of cash and cash equivalents 290.34 32.92
Closing balance of cash and cash equivalents 454.90 290.34
Cash and cash equivalents comprise:
Cash 2.38 1.90
Deposits with banks 340.00 -
Balance with banks 112.52 288.44
454.90 290.34
Notes:
1. The Cash Flow Statement has been prepared under the “Indirect Method” as set out in Accounting Standard - 3 ‘Cash Flow Statements’ specified in the Companies (Accounting Standards) Rules, 2006.
2. Cash and cash equivalents includes ` 3.68 (2011 - `. 3.66) which are not available for use by the Company.
3. Figures in bracket indicate Cash outgo.
This is the Cash Flow Statement referred to in our report of even date.
For Walker, Chandiok & Co. For and on behalf of the Board of DirectorsChartered Accountants
Khushroo B. Panthaky Glenn Saldanha Cherylann PintoPartner Chairman & Managing Director Executive Director
Rajesh Desai Marshall MendonzaPlace: Mumbai Executive Director & CFO Vice President &Date: 08 May 2012 Company Secretary

54 Glenmark Pharmaceuticals Limited
Notes to the Financial Statements(All amounts in millions of Indian Rupees, unless otherwise stated)
As at 31 March 2012 As at 31 March 2011No. of Shares Amount No. of Shares Amount
1. Share capital AuthorisedEquity Shares of ` 1 each 350,000,000 350.00 350,000,000 350.00 Cumulative Redeemable non convertible preference shares of ` 100 each 4,000,000 400.00 4,000,000 400.00 Issued, Subscribed and fully Paid-up Equity Shares of ` 1 each At the beginning of the year 270,272,053 270.27 269,837,553 269.84 Add: Issued during the year - Under the Employee Stock Option Scheme, 2003 263,450 0.26 434,500 0.43 At the end of the year 270,535,503 270.53 270,272,053 270.27
As at 31 March 2012 As at 31 March 2011List of Shareholders holding more than 5% shares % of Holding No. of Shares % of Holding No. of Shares Saldanha Family Trust 47.40 128,241,936 47.45 128,241,936 HSBC Global Investment Funds Mauritius Limited 5.38 14,557,222 - -
As at 31 March 2012, 1,419,300 options were outstanding under Employee Stock Option Scheme 2003. On exercise of the options so granted under Employee Stock Option Scheme 2003, the paid-up Equity Share Capital of the Company will increase by equivalent number of shares.
The Company has formulated an Employee Stock Option Plan (‘ESOP’) scheme namely ESOP 2003 under which it has made grants on various dates from time to time. Each grant has a vesting period which varies from 1-2 years and up to 4-6 years from the date of grant depending on the terms of the grant. The grants are made at the market price of the equity shares of the Company on either the date or the closing price of the date prior to day of the grant.
As at31 March 2012
As at31 March 2011
2. Reserves and Surplus Capital ReserveAt the beginning of the year 1.00 1.00 Add: Current year transfer - - Less: Written back in current year - - At the end of the year 1.00 1.00 Capital Redemption ReserveAt the beginning of the year 200.00 200.00 Add: Current year transfer - - Less: Written back in current year - - At the end of the year 200.00 200.00 Securities Premium AccountAt the beginning of the year 7,262.12 7,158.30 Add: Premium on issue of shares pursuant to conversion of ESOS 35.30 51.07 Less: Issue expenses on issue of shares to QIBs - 10.64 Less: Redemption premium of FCC Bonds (FCCB) - 96.33 Less: Tax deducted at source on FCCB redemption premium - 59.94 Add: Tax impact on FCCB redemption premium - 219.66 At the end of the year 7,297.42 7,262.12 General ReserveAt the beginning of the year 1,769.88 1,557.69 Add: Transferred from Statement of Profit and Loss 265.30 212.19 At the end of the year 2,035.18 1,769.88 Surplus in Statement of Profit and LossAt the beginning of the year 10,294.14 8,511.12 Add: Profit for the year 2,652.99 2,121.78 Net Profit available for appropriation 12,947.13 10,632.90 Less: Allocations and appropriations- Proposed dividend on equity shares 541.07 108.11 - Tax on proposed dividend on equity shares 87.78 17.96 - Residual dividend and dividend tax 0.03 0.50 - Transfer to general reserve 265.30 212.19 At the end of the year 12,052.95 10,294.14 Balance carried to Balance Sheet 21,586.55 19,527.14
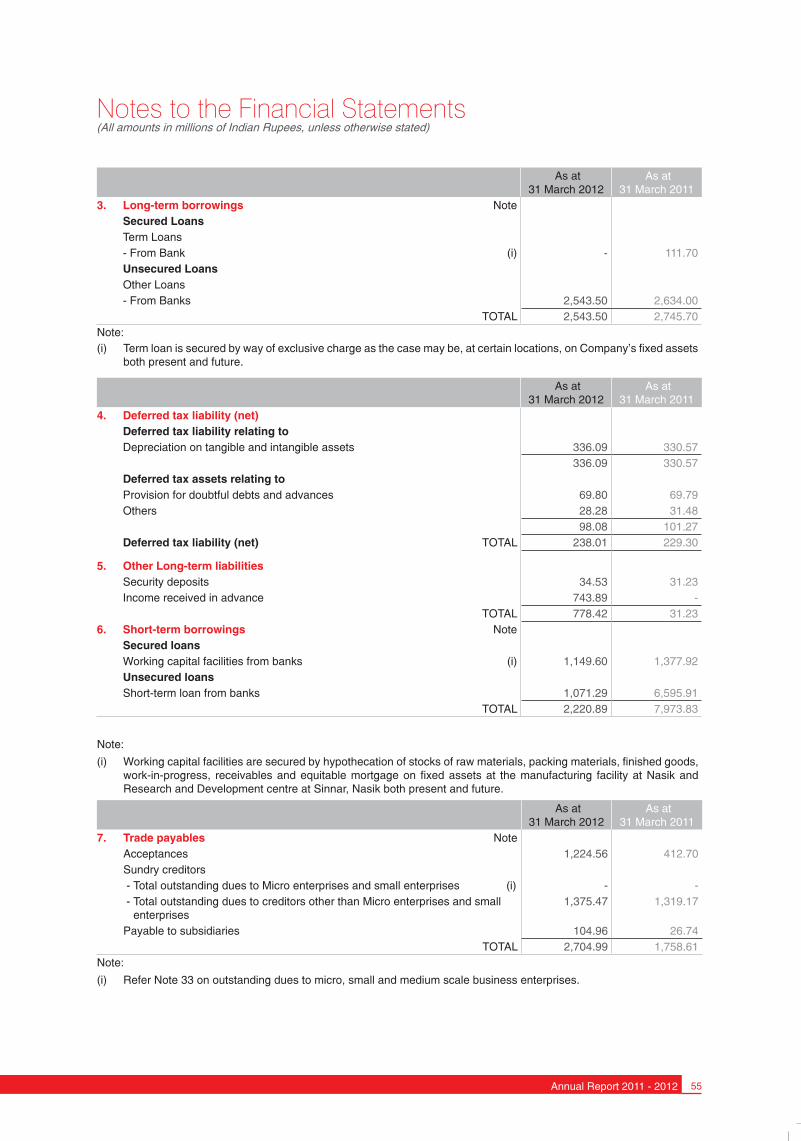
55Annual Report 2011 - 2012
Notes to the Financial Statements(All amounts in millions of Indian Rupees, unless otherwise stated)
As at31 March 2012
As at31 March 2011
3. Long-term borrowings NoteSecured LoansTerm Loans- From Bank (i) - 111.70 Unsecured LoansOther Loans - From Banks 2,543.50 2,634.00
TOTAL 2,543.50 2,745.70 Note:(i) Term loan is secured by way of exclusive charge as the case may be, at certain locations, on Company’s fixed assets
both present and future.
As at31 March 2012
As at31 March 2011
4. Deferred tax liability (net) Deferred tax liability relating toDepreciation on tangible and intangible assets 336.09 330.57
336.09 330.57 Deferred tax assets relating toProvision for doubtful debts and advances 69.80 69.79 Others 28.28 31.48
98.08 101.27 Deferred tax liability (net) TOTAL 238.01 229.30
5. Other Long-term liabilities Security deposits 34.53 31.23 Income received in advance 743.89 -
TOTAL 778.42 31.23 6. Short-term borrowings Note
Secured loansWorking capital facilities from banks (i) 1,149.60 1,377.92 Unsecured loansShort-term loan from banks 1,071.29 6,595.91
TOTAL 2,220.89 7,973.83
Note:
(i) Working capital facilities are secured by hypothecation of stocks of raw materials, packing materials, finished goods, work-in-progress, receivables and equitable mortgage on fixed assets at the manufacturing facility at Nasik and Research and Development centre at Sinnar, Nasik both present and future.
As at31 March 2012
As at31 March 2011
7. Trade payables NoteAcceptances 1,224.56 412.70 Sundry creditors - Total outstanding dues to Micro enterprises and small enterprises (i) - - - Total outstanding dues to creditors other than Micro enterprises and small
enterprises 1,375.47 1,319.17
Payable to subsidiaries 104.96 26.74 TOTAL 2,704.99 1,758.61
Note:
(i) Refer Note 33 on outstanding dues to micro, small and medium scale business enterprises.
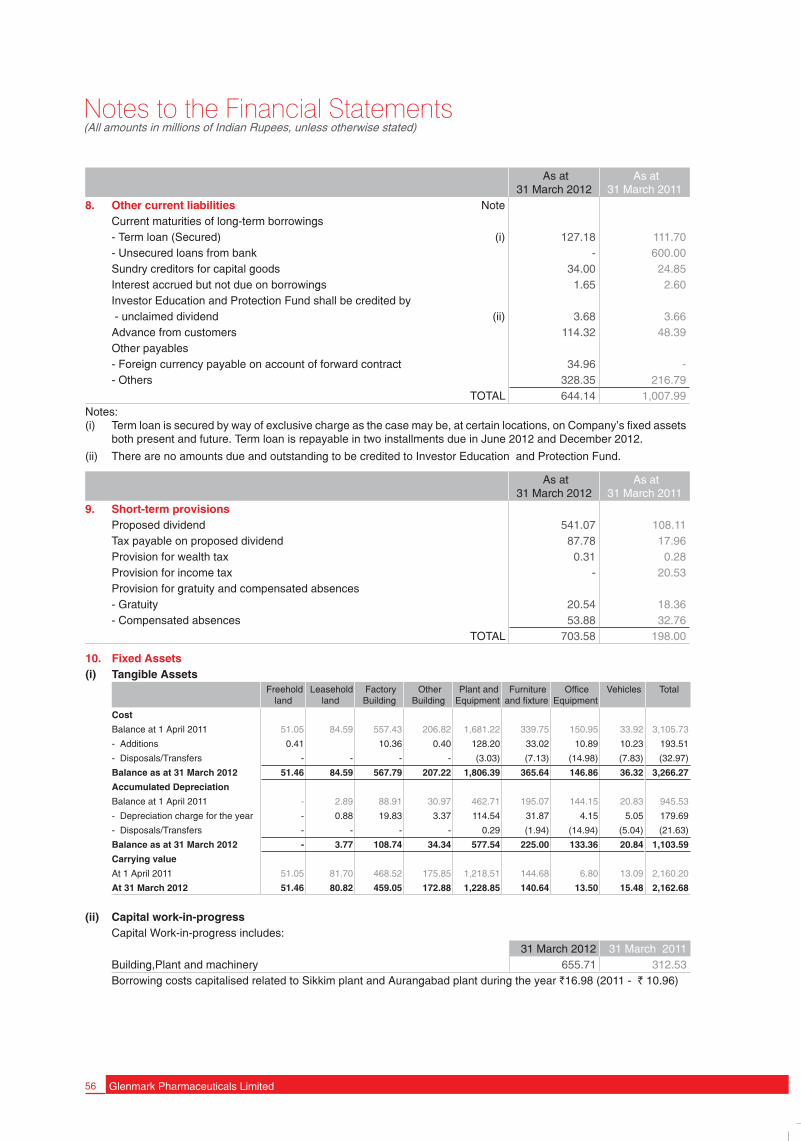
56 Glenmark Pharmaceuticals Limited
As at31 March 2012
As at31 March 2011
8. Other current liabilities NoteCurrent maturities of long-term borrowings- Term loan (Secured) (i) 127.18 111.70 - Unsecured loans from bank - 600.00 Sundry creditors for capital goods 34.00 24.85 Interest accrued but not due on borrowings 1.65 2.60 Investor Education and Protection Fund shall be credited by - unclaimed dividend (ii) 3.68 3.66 Advance from customers 114.32 48.39 Other payables- Foreign currency payable on account of forward contract 34.96 - - Others 328.35 216.79
TOTAL 644.14 1,007.99 Notes:(i) Term loan is secured by way of exclusive charge as the case may be, at certain locations, on Company’s fixed assets
both present and future. Term loan is repayable in two installments due in June 2012 and December 2012.
(ii) There are no amounts due and outstanding to be credited to Investor Education and Protection Fund.
As at31 March 2012
As at31 March 2011
9. Short-term provisions Proposed dividend 541.07 108.11 Tax payable on proposed dividend 87.78 17.96 Provision for wealth tax 0.31 0.28 Provision for income tax - 20.53 Provision for gratuity and compensated absences- Gratuity 20.54 18.36 - Compensated absences 53.88 32.76
TOTAL 703.58 198.00
10. Fixed Assets(i) Tangible Assets
Freehold land
Leasehold land
Factory Building
Other Building
Plant and Equipment
Furniture and fixture
Office Equipment
Vehicles Total
Cost
Balance at 1 April 2011 51.05 84.59 557.43 206.82 1,681.22 339.75 150.95 33.92 3,105.73
- Additions 0.41 10.36 0.40 128.20 33.02 10.89 10.23 193.51
- Disposals/Transfers - - - - (3.03) (7.13) (14.98) (7.83) (32.97)
Balance as at 31 March 2012 51.46 84.59 567.79 207.22 1,806.39 365.64 146.86 36.32 3,266.27
Accumulated Depreciation
Balance at 1 April 2011 - 2.89 88.91 30.97 462.71 195.07 144.15 20.83 945.53
- Depreciation charge for the year - 0.88 19.83 3.37 114.54 31.87 4.15 5.05 179.69
- Disposals/Transfers - - - - 0.29 (1.94) (14.94) (5.04) (21.63)
Balance as at 31 March 2012 - 3.77 108.74 34.34 577.54 225.00 133.36 20.84 1,103.59
Carrying value
At 1 April 2011 51.05 81.70 468.52 175.85 1,218.51 144.68 6.80 13.09 2,160.20
At 31 March 2012 51.46 80.82 459.05 172.88 1,228.85 140.64 13.50 15.48 2,162.68
(ii) Capital work-in-progressCapital Work-in-progress includes:
31 March 2012 31 March 2011 Building,Plant and machinery 655.71 312.53 Borrowing costs capitalised related to Sikkim plant and Aurangabad plant during the year `16.98 (2011 - ` 10.96)
Notes to the Financial Statements(All amounts in millions of Indian Rupees, unless otherwise stated)

57Annual Report 2011 - 2012
(iii) Intangible Assets Computer
software Brands Products
Marketing Rights Total
CostBalance at 1 April 2011 88.49 350.07 82.65 521.21 - Additions 38.92 - - 38.92 - Disposals/Transfers (4.18) - - (4.18)Balance as at 31 March 2012 123.23 350.07 82.65 555.95
Accumulated AmortisationBalance at 1 April 2011 52.37 350.07 41.18 443.62 - Amortisation charge for the year 14.91 - 16.53 31.44 - Disposals/Transfers 5.99 - - 5.99 Balance as at 31 March 2012 73.27 350.07 57.71 481.05 Carrying valueAt 1 April 2011 36.12 - 41.47 77.59 At 31 March 2012 49.96 - 24.94 74.90
(iv) Intangible assets under Development31 March 2012 31 March 2011
Marketing rights and Software 33.70 23.40
As at31 March 2012
As at31 March 2011
11. Non-current Investment Long-Term Investments - At Cost - (Fully Paid except otherwise stated)Trade InvestmentUnquoted
(i) Equity shares(a) Investments in Subsidiary Companies
a) Glenmark Access Limited, India (formerly known as Glenmark Exports Ltd.) [1,850,020 (2011 - 1,850,020) Equity Shares of ` 10 each]
18.50 18.50
b) Glenmark Impex LLC, Russia [577,767,277 (2011 - 577,767,277) shares of RUR 1 each]
901.95 901.95
c) Glenmark Philippines Inc., Philippines [640,490 (2011- 640,490) shares of Pesos 200 each]
116.70 116.70
d) Glenmark Pharmaceuticals (Nigeria) Ltd., Nigeria [502,833,724 (2011 - 365,003,963) shares of Naira 1 each]
159.56 116.06
e) Glenmark Pharmaceuticals Malaysia Sdn. Bhd., Malaysia [2,110,342 (2011 - 2,110,342) shares of RM 1 each]
28.32 28.32
f) Glenmark Generics Ltd., India [145,438,997 (2011 - 144,348,393) shares of ` 10 each]
8,427.24 8,100.25
g) Glenmark Holding S. A., Switzerland [22,520,000 (2011 - 22,520,000) shares of CHF 1 each]
797.11 797.11
h) Glenmark Pharmaceuticals (Australia) Pty. Ltd., Australia. [1,992,002 (2011 - 1,992,002) shares of AUD 1 each]
65.77 65.77
i) Glenmark Pharmaceuticals Egypt S.A.E., Egypt [14,723,837 (2011 - 8,457,443) shares of EGP 1 each]
119.55 71.10
j) Glenmark Pharmaceuticals FZE (U.A.E) [1 (2011 - 1) share of AED 1,000,000 each]
12.92 12.92
k) Glenmark Dominicana, SRL, Dominican Republic [210 ( 2011 - 100) shares of RD 1,000 each]
0.13 0.06
(b) Investment in Joint Venture 26,215 Ordinary shares [2011 - 9,800 Ordinary shares of THB 100 each and 16,415 Ordinary Shares of THB 100 each (paid up THB 50)] of Glenmark Pharmaceuticals (Thailand) Co. Ltd. of THB 100 each.
3.72 2.51
(c) Other Investment1 (2011 - 1) Equity Share of Esquados 340,000 of Glenmark Pharmaceutica Limitada, Lisbon (Portugal)
0.05 0.05
213,032 (2011 - 213,032) Equity Shares of Bharuch Eco-Aqua Infrastructure Limited of ` 10 each
2.13 2.13
Notes to the Financial Statements(All amounts in millions of Indian Rupees, unless otherwise stated)
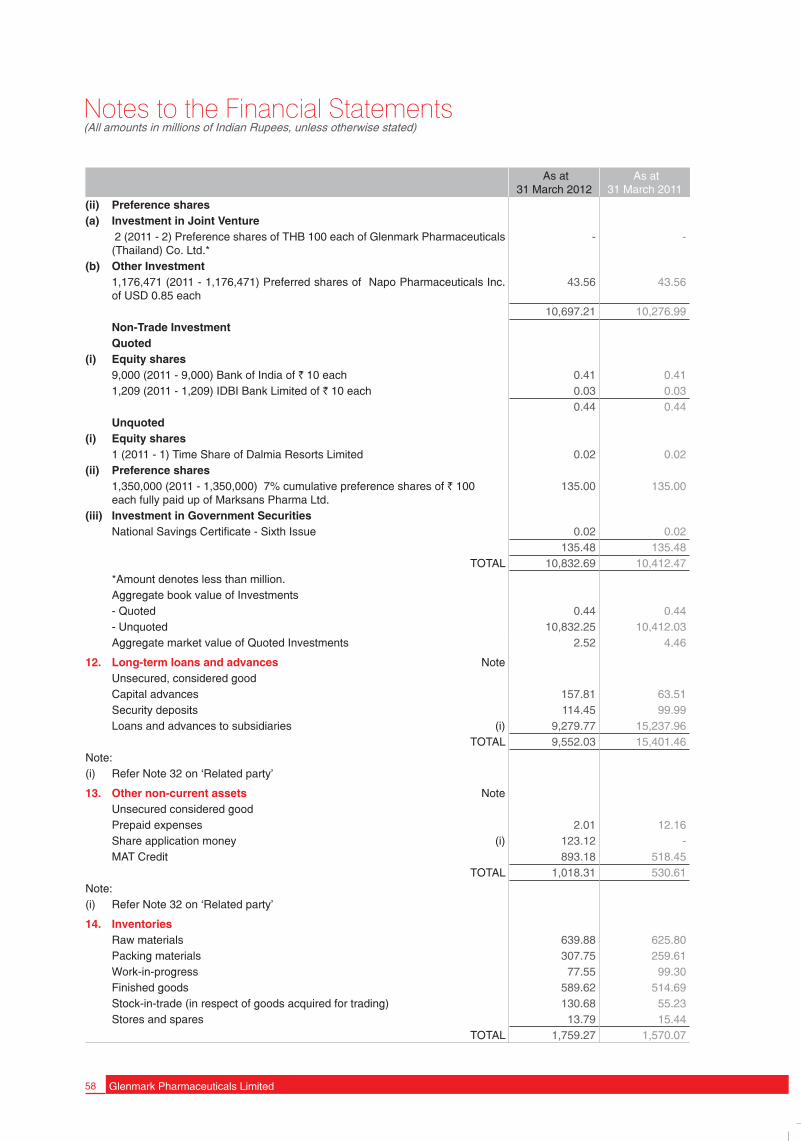
58 Glenmark Pharmaceuticals Limited
As at31 March 2012
As at31 March 2011
(ii) Preference shares(a) Investment in Joint Venture
2 (2011 - 2) Preference shares of THB 100 each of Glenmark Pharmaceuticals (Thailand) Co. Ltd.*
- -
(b) Other Investment1,176,471 (2011 - 1,176,471) Preferred shares of Napo Pharmaceuticals Inc. of USD 0.85 each
43.56 43.56
10,697.21 10,276.99 Non-Trade InvestmentQuoted
(i) Equity shares 9,000 (2011 - 9,000) Bank of India of ` 10 each 0.41 0.41 1,209 (2011 - 1,209) IDBI Bank Limited of ` 10 each 0.03 0.03
0.44 0.44 Unquoted
(i) Equity shares 1 (2011 - 1) Time Share of Dalmia Resorts Limited 0.02 0.02
(ii) Preference shares1,350,000 (2011 - 1,350,000) 7% cumulative preference shares of ` 100 each fully paid up of Marksans Pharma Ltd.
135.00 135.00
(iii) Investment in Government SecuritiesNational Savings Certificate - Sixth Issue 0.02 0.02
135.48 135.48 TOTAL 10,832.69 10,412.47
*Amount denotes less than million.Aggregate book value of Investments- Quoted 0.44 0.44 - Unquoted 10,832.25 10,412.03 Aggregate market value of Quoted Investments 2.52 4.46
12. Long-term loans and advances NoteUnsecured, considered goodCapital advances 157.81 63.51 Security deposits 114.45 99.99 Loans and advances to subsidiaries (i) 9,279.77 15,237.96
TOTAL 9,552.03 15,401.46 Note:(i) Refer Note 32 on ‘Related party’
13. Other non-current assets NoteUnsecured considered goodPrepaid expenses 2.01 12.16 Share application money (i) 123.12 - MAT Credit 893.18 518.45
TOTAL 1,018.31 530.61 Note:(i) Refer Note 32 on ‘Related party’
14. Inventories Raw materials 639.88 625.80 Packing materials 307.75 259.61 Work-in-progress 77.55 99.30 Finished goods 589.62 514.69 Stock-in-trade (in respect of goods acquired for trading) 130.68 55.23 Stores and spares 13.79 15.44
TOTAL 1,759.27 1,570.07
Notes to the Financial Statements(All amounts in millions of Indian Rupees, unless otherwise stated)

59Annual Report 2011 - 2012
As at31 March 2012
As at31 March 2011
15. Trade Receivables Unsecured, considered goodOutstanding for more than six months 1,211.52 1,306.93 Others 2,375.91 1,836.51 Less: Sale of Receivables (discounted with recourse) - (1,250.00)
3,587.43 1,893.44 Unsecured, considered doubtfulOutstanding for more than six months 191.10 191.10 Others - -
191.10 191.10 Less: Provision for doubtful debts (191.10) (191.10)
TOTAL 3,587.43 1,893.44
16. Cash and Bank balances Note(i) Cash and cash equivalents Balance with banks - Current accounts 42.62 269.64 - EEFC accounts 69.90 18.80 - Deposits (less than 3 months) 340.00 - Cash on hand 2.38 1.90 (ii) Other bank balance Balance with banks - Margin money account (i) 16.56 15.49 - Unpaid dividend 3.68 3.66
TOTAL 475.14 309.49 Note:(i) The balance in margin money accounts are given as security against guarantees
issued by banks on behalf of the Company.
17. Short-term loans and advances Unsecured considered goodAdvance to vendors 630.57 207.26 Security deposit 39.88 29.68
TOTAL 670.45 236.94
18. Other Current assets Advances recoverable in cash or kind or for value to be received (unsecured)- considered good 580.73 396.53 - considered doubtful 29.10 29.10
609.83 425.63 Less: Provision for doubtful advances (29.10) (29.10)
580.73 396.53 Advance tax (net of provision) 133.37 247.80 Balance with excise authorities 154.20 169.54
TOTAL 868.30 813.87
Notes to the Financial Statements(All amounts in millions of Indian Rupees, unless otherwise stated)
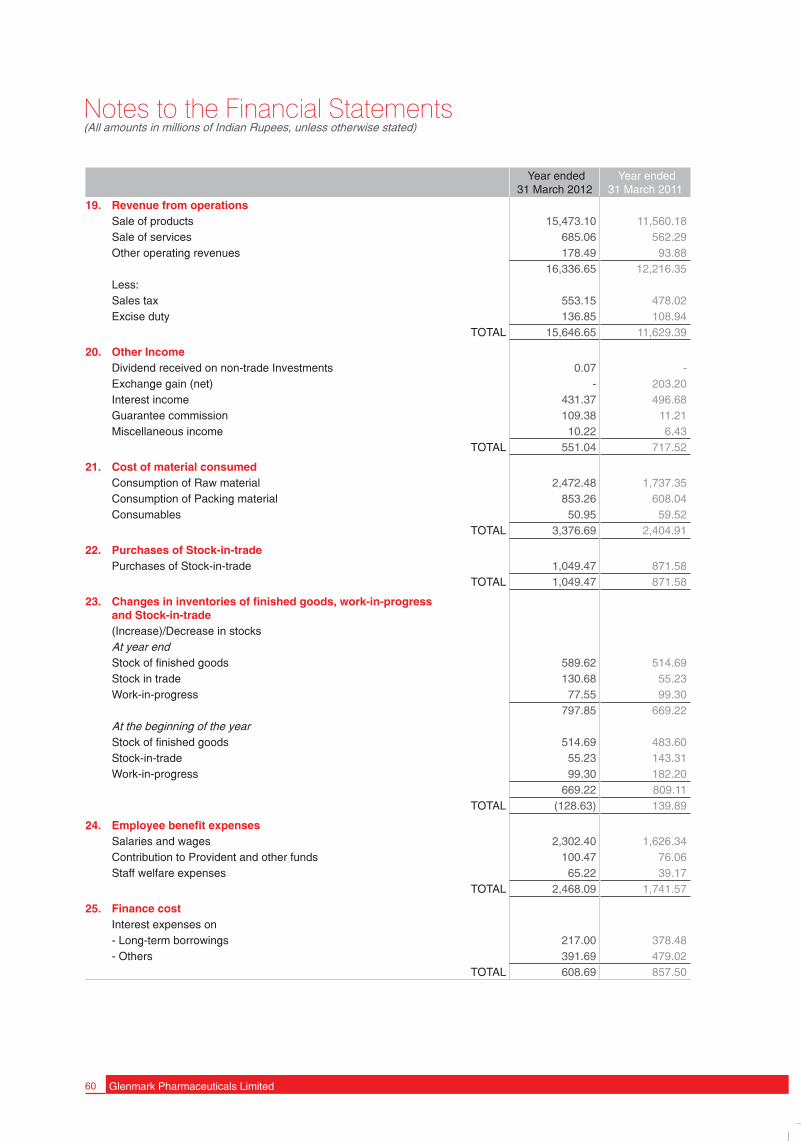
60 Glenmark Pharmaceuticals Limited
Year ended31 March 2012
Year ended31 March 2011
19. Revenue from operations Sale of products 15,473.10 11,560.18 Sale of services 685.06 562.29 Other operating revenues 178.49 93.88
16,336.65 12,216.35 Less:Sales tax 553.15 478.02 Excise duty 136.85 108.94
TOTAL 15,646.65 11,629.39
20. Other Income Dividend received on non-trade Investments 0.07 -Exchange gain (net) - 203.20 Interest income 431.37 496.68 Guarantee commission 109.38 11.21 Miscellaneous income 10.22 6.43
TOTAL 551.04 717.52
21. Cost of material consumed Consumption of Raw material 2,472.48 1,737.35 Consumption of Packing material 853.26 608.04 Consumables 50.95 59.52
TOTAL 3,376.69 2,404.91
22. Purchases of Stock-in-trade Purchases of Stock-in-trade 1,049.47 871.58
TOTAL 1,049.47 871.58
23. Changes in inventories of finished goods, work-in-progress and Stock-in-trade (Increase)/Decrease in stocksAt year endStock of finished goods 589.62 514.69 Stock in trade 130.68 55.23 Work-in-progress 77.55 99.30
797.85 669.22 At the beginning of the yearStock of finished goods 514.69 483.60 Stock-in-trade 55.23 143.31 Work-in-progress 99.30 182.20
669.22 809.11 TOTAL (128.63) 139.89
24. Employee benefit expenses Salaries and wages 2,302.40 1,626.34 Contribution to Provident and other funds 100.47 76.06 Staff welfare expenses 65.22 39.17
TOTAL 2,468.09 1,741.57
25. Finance cost Interest expenses on- Long-term borrowings 217.00 378.48 - Others 391.69 479.02
TOTAL 608.69 857.50
Notes to the Financial Statements(All amounts in millions of Indian Rupees, unless otherwise stated)

61Annual Report 2011 - 2012
Year ended31 March 2012
Year ended31 March 2011
26. Depreciation and amortisation expenses Depreciation on tangible assets 179.69 165.83 Amortisation on intangible assets 31.44 44.05
TOTAL 211.13 209.88
27. Other Expenses
Labour charges 205.80 160.12
Power, fuel and water charges 87.90 93.95
Lab chemicals and re-agents 201.24 151.55
Repairs and maintenance - plant and machinery 24.08 28.60
Repairs and maintenance - building 5.78 4.24
Repairs and maintenance - others 156.16 86.33
Rent 171.10 113.12
Other manufacturing expenses 55.87 29.12
Incentive and commission 229.49 217.45
Directors’ meeting fees 0.74 0.80
Selling and marketing expenses 1,055.42 682.15
Sales promotion expenses 679.30 333.09
Export commission 54.14 36.88
Commission on sales 41.77 67.93
Travelling expenses 733.63 519.92
Freight outward 230.25 244.21
Telephone expenses 26.15 22.93
Rates and taxes 20.15 16.79
Provision for doubtful debts - 15.00
Insurance premium 36.50 25.51
Electricity charges 53.02 54.23
Auditors’ remuneration
- Audit fees 6.50 5.50
- Out of pocket expenses 0.12 0.10
Loss on sale of assets 4.72 0.37
Exchange loss 528.87 -
Other operating expenses 1,162.58 703.76 TOTAL 5,771.28 3,613.65
28. Significant Accounting Policies
i) Basis of Accounting
The Financial Statements are prepared to comply in all material aspects with the accounting principles generally accepted in India, including the applicable Accounting Standards notified under Section 211(3C) of the Companies Act,1956 and the relevant provisions of the Companies Act,1956.
ii) Fixed Assets (Tangible and Intangibles), Depreciation and Amortisation
Fixed assets are stated at cost less accumulated depreciation and amortisation. The Company capitalises all costs relating to the acquisition and installation of fixed assets. Expenditure directly related to the setting up of new projects, is capitalised as an indirect cost towards construction of the fixed assets.
Depreciation is provided using the straight line method, pro-rata to the period of use of assets, based on the useful lives of fixed assets as estimated by management, or at the rates specified in Schedule XIV of the Companies Act, 1956, whichever is higher. Brands/Intellectual property rights are amortised from the month of products launch/commercial production, over the estimated economic life not exceeding 10 years.
Fixed assets having aggregate cost of ` 5,000 or less are depreciated fully in the year of acquisition.
Notes to the Financial Statements(All amounts in millions of Indian Rupees, unless otherwise stated)
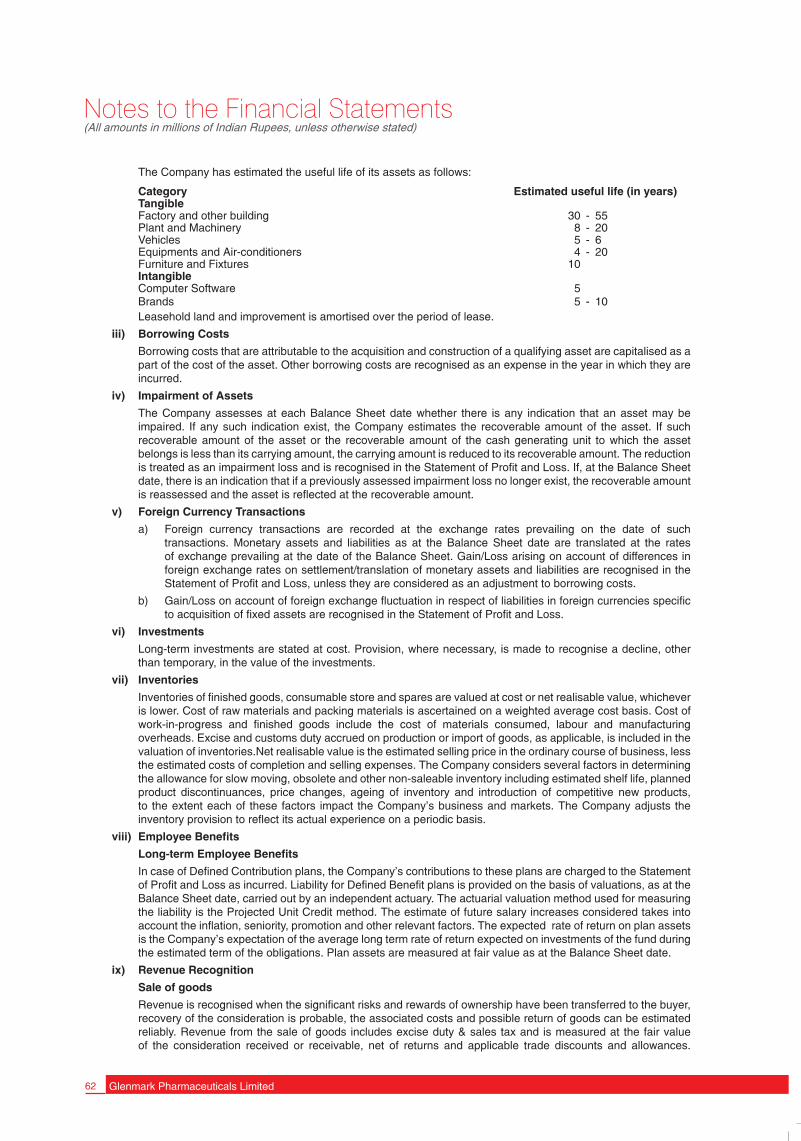
62 Glenmark Pharmaceuticals Limited
The Company has estimated the useful life of its assets as follows:
Category Estimated useful life (in years) TangibleFactory and other building 30 - 55Plant and Machinery 8 - 20Vehicles 5 - 6Equipments and Air-conditioners 4 - 20Furniture and Fixtures 10IntangibleComputer Software 5Brands 5 - 10
Leasehold land and improvement is amortised over the period of lease.
iii) Borrowing Costs
Borrowing costs that are attributable to the acquisition and construction of a qualifying asset are capitalised as a part of the cost of the asset. Other borrowing costs are recognised as an expense in the year in which they are incurred.
iv) Impairment of Assets
The Company assesses at each Balance Sheet date whether there is any indication that an asset may be impaired. If any such indication exist, the Company estimates the recoverable amount of the asset. If such recoverable amount of the asset or the recoverable amount of the cash generating unit to which the asset belongs is less than its carrying amount, the carrying amount is reduced to its recoverable amount. The reduction is treated as an impairment loss and is recognised in the Statement of Profit and Loss. If, at the Balance Sheet date, there is an indication that if a previously assessed impairment loss no longer exist, the recoverable amount is reassessed and the asset is reflected at the recoverable amount.
v) Foreign Currency Transactions
a) Foreign currency transactions are recorded at the exchange rates prevailing on the date of such transactions. Monetary assets and liabilities as at the Balance Sheet date are translated at the rates of exchange prevailing at the date of the Balance Sheet. Gain/Loss arising on account of differences in foreign exchange rates on settlement/translation of monetary assets and liabilities are recognised in the Statement of Profit and Loss, unless they are considered as an adjustment to borrowing costs.
b) Gain/Loss on account of foreign exchange fluctuation in respect of liabilities in foreign currencies specific to acquisition of fixed assets are recognised in the Statement of Profit and Loss.
vi) Investments
Long-term investments are stated at cost. Provision, where necessary, is made to recognise a decline, other than temporary, in the value of the investments.
vii) Inventories
Inventories of finished goods, consumable store and spares are valued at cost or net realisable value, whichever is lower. Cost of raw materials and packing materials is ascertained on a weighted average cost basis. Cost of work-in-progress and finished goods include the cost of materials consumed, labour and manufacturing overheads. Excise and customs duty accrued on production or import of goods, as applicable, is included in the valuation of inventories.Net realisable value is the estimated selling price in the ordinary course of business, less the estimated costs of completion and selling expenses. The Company considers several factors in determining the allowance for slow moving, obsolete and other non-saleable inventory including estimated shelf life, planned product discontinuances, price changes, ageing of inventory and introduction of competitive new products, to the extent each of these factors impact the Company’s business and markets. The Company adjusts the inventory provision to reflect its actual experience on a periodic basis.
viii) Employee Benefits
Long-term Employee Benefits
In case of Defined Contribution plans, the Company’s contributions to these plans are charged to the Statement of Profit and Loss as incurred. Liability for Defined Benefit plans is provided on the basis of valuations, as at the Balance Sheet date, carried out by an independent actuary. The actuarial valuation method used for measuring the liability is the Projected Unit Credit method. The estimate of future salary increases considered takes into account the inflation, seniority, promotion and other relevant factors. The expected rate of return on plan assets is the Company’s expectation of the average long term rate of return expected on investments of the fund during the estimated term of the obligations. Plan assets are measured at fair value as at the Balance Sheet date.
ix) Revenue Recognition
Sale of goods
Revenue is recognised when the significant risks and rewards of ownership have been transferred to the buyer, recovery of the consideration is probable, the associated costs and possible return of goods can be estimated reliably. Revenue from the sale of goods includes excise duty & sales tax and is measured at the fair value of the consideration received or receivable, net of returns and applicable trade discounts and allowances.
Notes to the Financial Statements(All amounts in millions of Indian Rupees, unless otherwise stated)

63Annual Report 2011 - 2012
Revenue from contract research is recognised in Statement of Profit and Loss when right to receive a non-refundable payment from out- licensing partner has been established.
The Company accounts for sales returns by recording a provision based on the Company’s estimate of expected sales returns. The Company deals in various products and operates in various markets. Accordingly, the Company’s estimate of sales returns is determined primarily by its experience in these markets. In respect of established products, the Company determines an estimate of sales returns provision primarily based on its historical experience with such sales returns. Additionally, other factors that the Company considers in determining the estimate include levels of inventory in the distribution channel, estimated shelf life, product discontinuances, price changes of competitive products and introduction of competitive new products, to the extent each of these factors impact the Company’s business and markets. The Company considers all these factors and adjusts the sales return provision to reflect its actual experience. With respect to new products introduced by the Company, those have historically been either extensions of an existing line of products where the Company has historical experience or in therapeutic categories where established products exist and are sold either by the Company or its competitors.
Services Revenue from services rendered is recognised in Statement of Profit and Loss as the underlying services are
performed. Export entitlements Export entitlements from government authorities are recognised in Statement of Profit and Loss when the right
to receive credit as per the terms of the scheme is established in respect of the exports made by the Company, and where there is no significant uncertainty regarding the ultimate collection of the relevant export proceeds.
Dividend and Interest income Dividend income is recognised when the unconditional right to receive the income is established. Income from
interest on deposits, loans and interest bearing securities is recognised on the time proportionate method. x) Research and Development expenditure Capital expenditure on Research and Development (R & D) is capitalised as fixed assets. Development cost
relating to the new and improved product and/or process development is recognised as an intangible asset to the extent that it is expected that such asset will generate future economic benefits. Other research and development costs are expensed as incurred.
xi) Taxation Current Tax Current tax is determined as the amount of tax payable in respect of taxable income for the year. Deferred Tax Deferred tax is recognised, subject to the consideration of prudence, on timing differences being the difference
between taxable income and accounting income that originate in one period and are capable of reversal in one or more subsequent period. Deferred tax assets are not recognised on unabsorbed depreciation and carry forward of losses unless there is virtual certainty that sufficient future taxable income will be available against which such deferred tax assets can be realised.
Deferred tax assets/liabilities recognised as above is after excluding the amounts, which are getting reversed during the tax holiday period.
xii) Leases Finance Leases Assets acquired under finance lease are recognised as assets with corresponding liabilities in the Balance
Sheet at the inception of the lease at amounts equal to lower of the fair value of the leased asset or at the present value of the minimum lease payments. These leased assets are depreciated in line with the Company’s policy on depreciation of fixed assets. The interest is allocated to periods during the lease term so as to produce a constant periodic rate of interest on the remaining balance of the liability for each period.
Operating Leases Lease rent in respect of assets taken on operating lease are charged to the Statement of Profit and Loss as per
the terms of lease agreements. xiii) Employee Stock Option Schemes (ESOS) The Company accounts for compensation expense under the Employee Stock Option Schemes using the intrinsic
value method as permitted by the Guidance Note on “Accounting for Employee Share-based Payments” issued by the Institute of Chartered Accountants of India. The difference between the market price and the exercise price as at the date of the grant is treated as compensation expense and charged over the vesting period.
xiv) Provisions and Contingent Liabilities The Company recognises a provision when there is a present obligation as a result of a past event that probably
requires an outflow of resources and a reliable estimate can be made of the amount of the obligation. A disclosure for a contingent liability is made when there is a possible obligation or a present obligation that may, but probably will not, require an outflow of resources. Where there is a possible obligation or a present obligation that the likelihood of outflow of resources is remote, no provision or disclosure is made.
Notes to the Financial Statements(All amounts in millions of Indian Rupees, unless otherwise stated)
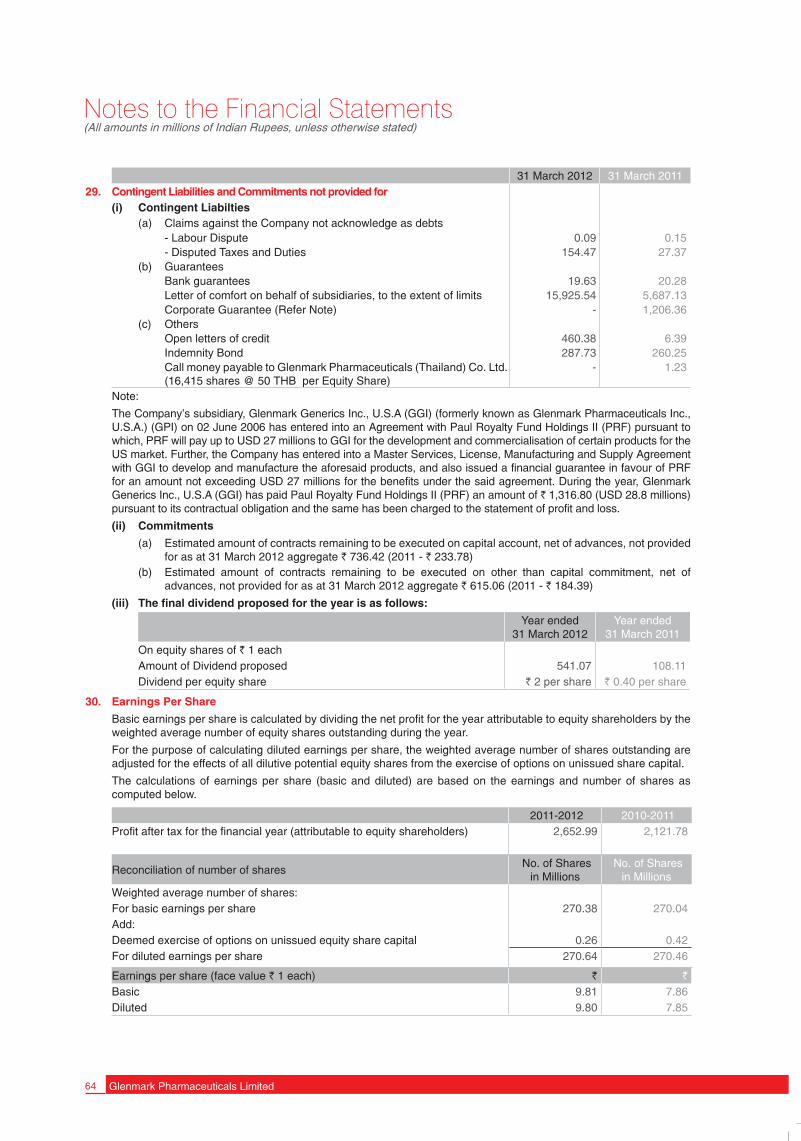
64 Glenmark Pharmaceuticals Limited
31 March 2012 31 March 201129. Contingent Liabilities and Commitments not provided for
(i) Contingent Liabilties(a) Claims against the Company not acknowledge as debts
- Labour Dispute 0.09 0.15 - Disputed Taxes and Duties 154.47 27.37
(b) GuaranteesBank guarantees 19.63 20.28 Letter of comfort on behalf of subsidiaries, to the extent of limits 15,925.54 5,687.13 Corporate Guarantee (Refer Note) - 1,206.36
(c) OthersOpen letters of credit 460.38 6.39 Indemnity Bond 287.73 260.25 Call money payable to Glenmark Pharmaceuticals (Thailand) Co. Ltd. (16,415 shares @ 50 THB per Equity Share)
- 1.23
Note:
The Company’s subsidiary, Glenmark Generics Inc., U.S.A (GGI) (formerly known as Glenmark Pharmaceuticals Inc., U.S.A.) (GPI) on 02 June 2006 has entered into an Agreement with Paul Royalty Fund Holdings II (PRF) pursuant to which, PRF will pay up to USD 27 millions to GGI for the development and commercialisation of certain products for the US market. Further, the Company has entered into a Master Services, License, Manufacturing and Supply Agreement with GGI to develop and manufacture the aforesaid products, and also issued a financial guarantee in favour of PRF for an amount not exceeding USD 27 millions for the benefits under the said agreement. During the year, Glenmark Generics Inc., U.S.A (GGI) has paid Paul Royalty Fund Holdings II (PRF) an amount of ` 1,316.80 (USD 28.8 millions) pursuant to its contractual obligation and the same has been charged to the statement of profit and loss.
(ii) Commitments
(a) Estimated amount of contracts remaining to be executed on capital account, net of advances, not provided for as at 31 March 2012 aggregate ` 736.42 (2011 - ` 233.78)
(b) Estimated amount of contracts remaining to be executed on other than capital commitment, net of advances, not provided for as at 31 March 2012 aggregate ` 615.06 (2011 - ` 184.39)
(iii) The final dividend proposed for the year is as follows:
Year ended31 March 2012
Year ended31 March 2011
On equity shares of ` 1 eachAmount of Dividend proposed 541.07 108.11 Dividend per equity share ` 2 per share ` 0.40 per share
30. Earnings Per Share
Basic earnings per share is calculated by dividing the net profit for the year attributable to equity shareholders by the weighted average number of equity shares outstanding during the year.
For the purpose of calculating diluted earnings per share, the weighted average number of shares outstanding are adjusted for the effects of all dilutive potential equity shares from the exercise of options on unissued share capital.
The calculations of earnings per share (basic and diluted) are based on the earnings and number of shares as computed below.
2011-2012 2010-2011Profit after tax for the financial year (attributable to equity shareholders) 2,652.99 2,121.78
Reconciliation of number of shares No. of Shares
in Millions No. of Shares
in Millions Weighted average number of shares: For basic earnings per share 270.38 270.04 Add: Deemed exercise of options on unissued equity share capital 0.26 0.42 For diluted earnings per share 270.64 270.46
Earnings per share (face value ` 1 each) ` ` Basic 9.81 7.86 Diluted 9.80 7.85
Notes to the Financial Statements(All amounts in millions of Indian Rupees, unless otherwise stated)

65Annual Report 2011 - 2012
31. Segment Information
Business segments
The Company is primarily engaged in a single segment business of formulations and is managed as one entity, for its various activities and manufacturing and marketing of pharmaceuticals is governed by a similar set of risks and returns.
Geographical segments
In the view of the management, the Indian and export markets represent geographical segments.
Revenue by market - The following is the distribution of the Company’s sale by geographical market:
2011-2012 2010-2011Geographical segment India 10,600.32 8,924.90 Other than India 5,557.84 3,197.58
TOTAL 16,158.16 12,122.48 Assets and additions to fixed assets by geographical area – The following table shows the carrying amount of segment
assets and additions to fixed assets by geographical area in which the assets are located:
India2011-2012
Others*2011-2012
India 2010-2011
Others*2010-2011
Carrying amount of segment assets 30,382.66 1,307.95 32,800.43 941.63 Additions to fixed assets 232.43 - 560.07 -
*Others represent receivables from debtors located outside India including those related to deemed exports and cash and bank balances of branches outside India.
32. Related Party Disclosures
In accordance with the requirements of Accounting Standard - 18 “Related Party Disclosures”, the names of the related parties where control exists and/or with whom transactions have taken place during the year and description of relationships, as identified and certified by the management are as follows:
a) Parties where direct/indirect control exists
i) Subsidiary companies
Glenmark Pharmaceuticals Europe Ltd., U.K. Glenmark Generics (Europe) Ltd., U.K.Glenmark Pharmaceuticals S.R.O., Czech RepublicGlenmark Pharmaceuticals SK, s.r.o., Slovak RepublicGlenmark Pharmaceuticals S. A., Switzerland Glenmark Holding S. A., Switzerland Glenmark Generics Holding S. A., Switzerland Glenmark Generics Finance S. A., Switzerland Glenmark Pharmaceuticals S.R.L., RomaniaGlenmark Pharmaceuticals Eood., BulgariaGlenmark Distributors SP z.o.o., PolandGlenmark Pharmaceuticals SP z.o.o., PolandGlenmark Generics Inc., USA Glenmark Therapeutics Inc., USAGlenmark Farmaceutica Ltda., Brazil Glenmark Generics SA., ArgentinaGlenmark Pharmaceuticals Mexico, S.A. DE C.V., MexicoGlenmark Pharmaceuticals Peru SAC., PeruGlenmark Pharmaceuticals Colombia Ltda., ColombiaGlenmark Uruguay S.A., Uruguay Glenmark Pharmaceuticals Venezuela., C.A., VenezuelaGlenmark Dominicana, SRL, Dominican RepublicGlenmark Pharmaceuticals Egypt S.A.E., EgyptGlenmark Pharmaceuticals FZE., United Arab EmiratesGlenmark Impex L.L.C., RussiaGlenmark Philippines Inc., Philippines
Notes to the Financial Statements(All amounts in millions of Indian Rupees, unless otherwise stated)

66 Glenmark Pharmaceuticals Limited
Glenmark Pharmaceuticals (Nigeria) Ltd., NigeriaGlenmark Pharmaceuticals Malaysia Sdn Bhd., MalaysiaGlenmark Pharmaceuticals (Australia) Pty Ltd., AustraliaGlenmark South Africa (Pty) Ltd., South Africa Glenmark Pharmaceuticals South Africa (Pty) Ltd., South Africa Glenmark Access Ltd (formerly known as Glenmark Exports Ltd.)Glenmark Generics Ltd., IndiaGlenmark Generics B.V., NetherlandsGlenmark Arzneimittel Gmbh., GermanyGlenmark Generics Canada, Inc.
ii) Investment in Joint Venture
Glenmark Pharmaceuticals (Thailand) Co. Ltd., Thailand
iii) Enterprise over which key managerial personnel exercise significant influence
Glenmark Foundation, India
b) Related party relationships where transactions have taken place during the year
Subsidiary Companies / Joint VentureGlenmark Farmaceutica Ltda., Brazil Glenmark Philippines Inc., PhilippinesGlenmark Pharmaceuticals (Nigeria) Ltd., NigeriaGlenmark Pharmaceuticals S.A., SwitzerlandGlenmark Pharmaceuticals Malaysia Sdn.Bhd., MalaysiaGlenmark Impex L.L.C., RussiaGlenmark Holding S.A., SwitzerlandGlenmark Generics Ltd., IndiaGlenmark Pharmaceuticals Peru SAC., PeruGlenmark Pharmaceuticals Venezuela., C.A., VenezuelaGlenmark Pharmaceuticals FZE., United Arab EmiratesGlenmark Pharmaceuticals Egypt S.A.E., EgyptGlenmark Generics SA., ArgentinaGlenmark Generics (Europe) Ltd., U.K.Glenmark Pharmaceuticals Europe Ltd., U.K. Glenmark Generics Inc., USAGlenmark Pharmaceuticals s.r.o., Czech RepublicGlenmark Therapeutics Inc., USAGlenmark Pharmaceuticals (Thailand) Co. Ltd., ThailandGlenmark Dominicana SA., Dominican RepublicGlenmark Distributor SP z.o.o., PolandGlenmark Pharmaceuticals SK, s.r.o., Slovak RepublicGlenmark Pharmaceuticals S.R.L., Romania
Enterprise over which key managerial personnel exercise significant influenceGlenmark Foundation, India
c) Key management personnel
Mr. Gracias SaldanhaMrs. B. E. SaldanhaMr. Glenn SaldanhaMrs. Cherylann PintoMr. R. V. Desai (Appointed w.e.f. 09 November 2011)Mr. A. S. Mohanty (Upto 10 May 2011)
Notes to the Financial Statements(All amounts in millions of Indian Rupees, unless otherwise stated)
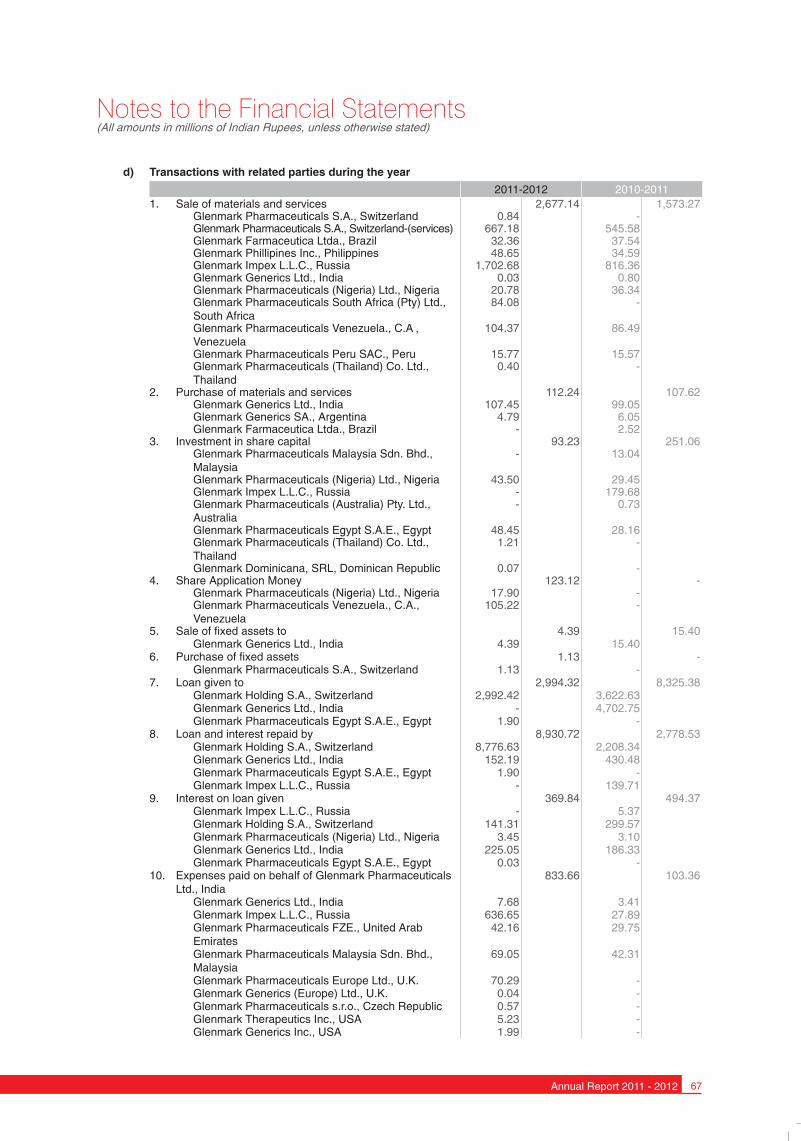
67Annual Report 2011 - 2012
d) Transactions with related parties during the year
2011-2012 2010-20111. Sale of materials and services 2,677.14 1,573.27
Glenmark Pharmaceuticals S.A., Switzerland 0.84 - Glenmark Pharmaceuticals S.A., Switzerland-(services) 667.18 545.58 Glenmark Farmaceutica Ltda., Brazil 32.36 37.54 Glenmark Phillipines Inc., Philippines 48.65 34.59 Glenmark Impex L.L.C., Russia 1,702.68 816.36 Glenmark Generics Ltd., India 0.03 0.80 Glenmark Pharmaceuticals (Nigeria) Ltd., Nigeria 20.78 36.34 Glenmark Pharmaceuticals South Africa (Pty) Ltd., South Africa
84.08 -
Glenmark Pharmaceuticals Venezuela., C.A , Venezuela
104.37 86.49
Glenmark Pharmaceuticals Peru SAC., Peru 15.77 15.57 Glenmark Pharmaceuticals (Thailand) Co. Ltd., Thailand
0.40 -
2. Purchase of materials and services 112.24 107.62 Glenmark Generics Ltd., India 107.45 99.05 Glenmark Generics SA., Argentina 4.79 6.05 Glenmark Farmaceutica Ltda., Brazil - 2.52
3. Investment in share capital 93.23 251.06 Glenmark Pharmaceuticals Malaysia Sdn. Bhd., Malaysia
- 13.04
Glenmark Pharmaceuticals (Nigeria) Ltd., Nigeria 43.50 29.45 Glenmark Impex L.L.C., Russia - 179.68 Glenmark Pharmaceuticals (Australia) Pty. Ltd., Australia
- 0.73
Glenmark Pharmaceuticals Egypt S.A.E., Egypt 48.45 28.16 Glenmark Pharmaceuticals (Thailand) Co. Ltd., Thailand
1.21 -
Glenmark Dominicana, SRL, Dominican Republic 0.07 - 4. Share Application Money 123.12 -
Glenmark Pharmaceuticals (Nigeria) Ltd., Nigeria 17.90 - Glenmark Pharmaceuticals Venezuela., C.A., Venezuela
105.22 -
5. Sale of fixed assets to 4.39 15.40 Glenmark Generics Ltd., India 4.39 15.40
6. Purchase of fixed assets 1.13 - Glenmark Pharmaceuticals S.A., Switzerland 1.13 -
7. Loan given to 2,994.32 8,325.38 Glenmark Holding S.A., Switzerland 2,992.42 3,622.63 Glenmark Generics Ltd., India - 4,702.75 Glenmark Pharmaceuticals Egypt S.A.E., Egypt 1.90 -
8. Loan and interest repaid by 8,930.72 2,778.53 Glenmark Holding S.A., Switzerland 8,776.63 2,208.34 Glenmark Generics Ltd., India 152.19 430.48 Glenmark Pharmaceuticals Egypt S.A.E., Egypt 1.90 - Glenmark Impex L.L.C., Russia - 139.71
9. Interest on loan given 369.84 494.37 Glenmark Impex L.L.C., Russia - 5.37 Glenmark Holding S.A., Switzerland 141.31 299.57 Glenmark Pharmaceuticals (Nigeria) Ltd., Nigeria 3.45 3.10 Glenmark Generics Ltd., India 225.05 186.33 Glenmark Pharmaceuticals Egypt S.A.E., Egypt 0.03 -
10. Expenses paid on behalf of Glenmark Pharmaceuticals Ltd., India
833.66 103.36
Glenmark Generics Ltd., India 7.68 3.41 Glenmark Impex L.L.C., Russia 636.65 27.89 Glenmark Pharmaceuticals FZE., United Arab Emirates
42.16 29.75
Glenmark Pharmaceuticals Malaysia Sdn. Bhd., Malaysia
69.05 42.31
Glenmark Pharmaceuticals Europe Ltd., U.K. 70.29 - Glenmark Generics (Europe) Ltd., U.K. 0.04 - Glenmark Pharmaceuticals s.r.o., Czech Republic 0.57 - Glenmark Therapeutics Inc., USA 5.23 -Glenmark Generics Inc., USA 1.99 -
Notes to the Financial Statements(All amounts in millions of Indian Rupees, unless otherwise stated)

68 Glenmark Pharmaceuticals Limited
2011-2012 2010-201111. Expenses paid on behalf of 100.74 91.23
Glenmark Generics Ltd., India 95.45 91.23 Glenmark Generics (Europe) Ltd., U.K. 0.68 - Glenmark Generics Inc., USA 0.68 - Glenmark Distributor SP z.o.o., Poland 3.93 -
12. Reimbursement of expenses to Glenmark Access Ltd., India
- 0.60
13. Other Income from 125.55 24.10 Glenmark Generics Ltd., India 16.16 12.89 Glenmark Holding S.A., Switzerland 94.88 11.21 Glenmark Pharmaceuticals s.r.o., Czech Republic 0.34 - Glenmark Farmaceutica Ltda., Brazil 1.01 - Glenmark Pharmaceuticals SK, s.r.o., Slovak Republic
0.51 -
Glenmark Distributor SP z.o.o., Poland 1.69 - Glenmark Pharmaceuticals S.R.L., Romania 1.60 - Glenmark Impex L.L.C., Russia 9.36 -
14. Contribution paid for CSR activities to Glenmark Foundation
3.23 -
15. Factory rent to Glenmark Generics Ltd., India 1.82 1.65 Key management personnelRemuneration 95.45 54.43
Mr. Gracias Saldanha 0.04 0.06 Mrs. B. E. Saldanha 0.06 0.08 Mr. Glenn Saldanha 58.13 32.25 Mrs. Cherylann Pinto 15.17 12.10 Mr. R. V. Desai (Appointed w.e.f 09 November 2011) 11.75 - Mr. A. S. Mohanty (Upto 10 May 2011) 10.30 9.94
e) Related party balancesReceivable/(Payable) from/(to) Related Parties 9,893.60 15,823.93 Glenmark Access Ltd., India 65.66 149.98 Glenmark Farmaceutica Ltda., Brazil 20.37 19.40 Glenmark Philippines Inc., Philippines 17.96 20.38 Glenmark Pharmaceuticals S.A., Switzerland 343.89 856.09 Glenmark Holding S.A., Switzerland 4,164.06 8,993.38 Glenmark Pharmaceuticals (Nigeria) Ltd., Nigeria 54.72 56.04 Glenmark Generics Ltd., India 4,736.02 5,355.67 Glenmark Impex L.L.C., Russia 456.86 340.24 Glenmark Pharmaceuticals South Africa (Pty) Ltd., South Africa 74.15 - Glenmark Pharmaceuticals FZE., United Arab Emirates (22.47) (14.83)Glenmark Generics SA., Argentina (0.22) 1.16 Glenmark Pharmaceuticals Venezuela., C.A , Venezuela 45.51 42.62 Glenmark Pharmaceuticals Malaysia Sdn. Bhd., Malaysia (17.28) (11.58)Glenmark Pharmaceuticals Peru SAC., Peru 9.91 15.34 Glenmark Foundation, India - 0.04 Glenmark Generics (Europe) Ltd., U.K. 0.66 - Glenmark Pharmaceuticals Europe Ltd., U.K. (62.18) - Glenmark Generics Inc., USA (1.31) - Glenmark Pharmaceuticals s.r.o., Czech Republic 0.34 - Glenmark Therapeutics Inc., USA (1.17) - Glenmark Pharmaceuticals SK, s.r.o., Slovak Republic 0.51 - Glenmark Distributor SP z.o.o., Poland 5.62 - Glenmark Pharmaceuticals S.R.L., Romania 1.60 - Glenmark Pharmaceuticals (Thailand) Co. Ltd., Thailand 0.39 -
33. Outstanding Dues to Micro, Small and Medium Scale Business Enterprises
The Company has not received any information from the “suppliers” regarding their status under the Micro, Small and Medium Enterprises Development Act, 2006 and hence disclosures, if any, relating to the amounts as at year end together with interest paid/payable as required under the said Act have not been given.
Notes to the Financial Statements(All amounts in millions of Indian Rupees, unless otherwise stated)

69Annual Report 2011 - 2012
34. Leases
The Company has taken on lease/leave and licence godowns/residential and office premises at various locations in the country.
i) The Company’s significant leasing arrangements are in respect of the above godowns and premises (including furniture and fittings therein, as applicable). The aggregate lease rentals payable are charged to Statement of Profit and Loss as Rent.
ii) The Leasing arrangements which are cancellable range between 11 months to 5 years. They are usually renewable by mutual consent on mutually agreeable terms. Under these arrangements, generally refundable interest free deposits have been given. An amount of ` 99.32 (2011 - ` 83.35) towards deposit and unadjusted advance rent is recoverable from the lessor.
The Company has entered into operating lease agreements for the rental of its office premises for a period of 3 to 5 years.
Minimum lease payments
31 March 2012Due within one year 119.92 Due later than one year and not later than five years 390.10 Due later than five years -
TOTAL 510.02
35. Taxation
Provision for current taxation for the Company of ` 554.00 represents Minimum Alternate Tax pursuant to the provisions of Section 115JB of the Income Tax Act, 1961 of India. The Finance Act, 2005 inserted sub-section (1A) to section 115JAA to grant tax credit in respect of MAT paid under Section 115JB of the Act with effect from Assessment Year 2006-07 and carry forward the credit for a period of 10 years. In accordance with the Guidance Note issued on “Accounting for credit available in respect of Minimum Alternative Tax (MAT) under the Income Tax Act 1961” by the Institute of the Chartered Accountants of India, the Company has recognised MAT Credit which is expected to be set-off against the tax liability, other than MAT in future years. Accordingly, an amount of ` 374.73 for the current year has been recognised as MAT Credit Entitlement in Note 13.
36. Employee Benefits
The disclosures as required as per the revised AS 15 are as under: 1. Brief description of the Plans The Company has various schemes for long-term benefits such as Provident Fund, Superannuation, Gratuity
and Compensated absences. In case of funded schemes, the funds are recognised by the Income tax authorities and administered through appropriate authorities. The Company’s defined contribution plans are Superannuation and Employees’ Provident Fund and Pension Scheme (under the provisions of the Employees’ Provident Funds and Miscellaneous Provisions Act, 1952) since the Company has no further obligation beyond making the contributions. The Company’s defined benefit plans include Gratuity and Compensated absences.
2011-2012 2010-20112. Charge to the Statement of Profit and Loss based on contributions:
Superannuation 2.01 2.42 Provident fund 98.47 73.63
100.48 76.05
Notes to the Financial Statements(All amounts in millions of Indian Rupees, unless otherwise stated)

70 Glenmark Pharmaceuticals Limited
3. Disclosures for defined benefit plans based on actuarial reports as on 31 March 2012:
2011-2012 2010-2011Gratuity Compen-
sated absences
Gratuity Compen-sated
absences(Funded
plan)(Funded
plan)(Funded
plan)(Funded
plan)(i) Change in Defined Benefit Obligation
Opening defined benefit obligation 150.87 72.59 126.82 68.28 Current service cost 28.14 1.13 23.39 17.69 Interest cost 11.75 5.31 7.31 3.61 Actuarial loss/(gain) (2.46) 40.27 3.52 (0.80)Benefits paid (18.52) (17.25) (10.17) (16.19)Closing defined benefit obligation 169.78 102.05 150.87 72.59
(ii) Change in Fair Value of AssetsOpening fair value of plan assets 132.51 39.82 122.97 31.87 Expected return on plan assets 12.38 3.81 8.30 2.32 Actuarial gain/(loss) (5.65) (0.40) 1.24 0.69 Contributions by employer 28.52 22.19 10.17 21.13 Benefits paid (18.52) (17.25) (10.17) (16.19)Closing fair value of plan assets 149.24 48.17 132.51 39.82
(iii) Reconciliation of Present Value of Defined Benefit Obligation and the Fair Value of AssetsPresent value of funded obligations as at year end 169.78 102.05 150.87 72.59 Fair value of plan assets as at year end (149.24) (48.17) (132.51) (39.82)Funded Liability/(Asset) recognised in the Balance Sheet 20.54 53.88 18.36 32.77 Present Value of Unfunded Obligation as at year end - - - - Unrecognised Actuarial Gain/(Loss) - - - - Unfunded Liability/(Asset) recognised in the Balance Sheet - - - -
(iv) Amount recognised in the Balance SheetPresent value of obligations as at year end 169.78 102.05 150.87 72.59 Fair value of plan assets as at year end (149.24) (48.17) (132.51) (39.82)Amount not recognised as an asset - - - - Net (asset)/liability recognised as at 31 March 2012 20.54 53.88 18.36 32.77
(v) Expenses recognised in the Statement of Profit and Loss
Current service cost 28.14 1.13 23.39 17.69 Interest on defined benefit obligation 11.75 5.31 7.31 3.61 Expected return on plan assets (12.38) (3.81) (8.30) (2.32)Net actuarial loss/(gain) recognised in the current year 3.19 40.67 2.28 (1.49)Total expenses 30.70 43.30 24.68 17.49
(vi) Actual Return on Plan AssetsExpected Return on Plan Assets 12.38 3.81 8.30 2.32 Actuarial gain/(loss) on Plan Assets (5.65) (0.40) 1.24 0.69 Actual Return on Plan Assets 6.73 3.41 9.54 3.01
(vii) Asset informationAdministered by Birla Sunlife Insurance Co. Ltd. and LIC of India. 100% 100% 100% 100%
(viii) Principal actuarial assumptions used Discount rate (p.a.) 8.50% 8.50% 8.30% 8.30%Expected rate of return on plan assets (p.a.) 9.00% 9.00% 9.00% 9.00%
Notes to the Financial Statements(All amounts in millions of Indian Rupees, unless otherwise stated)
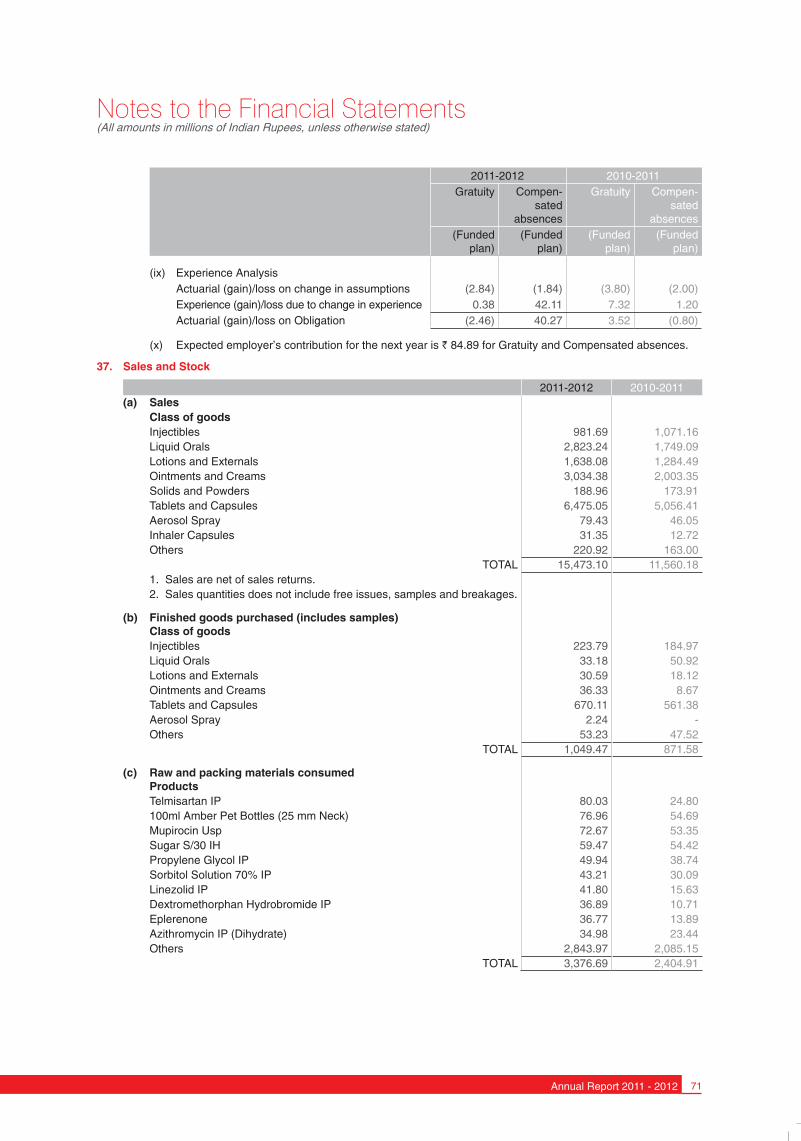
71Annual Report 2011 - 2012
2011-2012 2010-2011Gratuity Compen-
sated absences
Gratuity Compen-sated
absences(Funded
plan)(Funded
plan)(Funded
plan)(Funded
plan)
(ix) Experience AnalysisActuarial (gain)/loss on change in assumptions (2.84) (1.84) (3.80) (2.00)Experience (gain)/loss due to change in experience 0.38 42.11 7.32 1.20 Actuarial (gain)/loss on Obligation (2.46) 40.27 3.52 (0.80)
(x) Expected employer’s contribution for the next year is ` 84.89 for Gratuity and Compensated absences.
37. Sales and Stock
2011-2012 2010-2011(a) Sales
Class of goodsInjectibles 981.69 1,071.16 Liquid Orals 2,823.24 1,749.09 Lotions and Externals 1,638.08 1,284.49 Ointments and Creams 3,034.38 2,003.35 Solids and Powders 188.96 173.91 Tablets and Capsules 6,475.05 5,056.41 Aerosol Spray 79.43 46.05 Inhaler Capsules 31.35 12.72 Others 220.92 163.00
TOTAL 15,473.10 11,560.18 1. Sales are net of sales returns.2. Sales quantities does not include free issues, samples and breakages.
(b) Finished goods purchased (includes samples)Class of goodsInjectibles 223.79 184.97 Liquid Orals 33.18 50.92 Lotions and Externals 30.59 18.12 Ointments and Creams 36.33 8.67 Tablets and Capsules 670.11 561.38 Aerosol Spray 2.24 - Others 53.23 47.52
TOTAL 1,049.47 871.58
(c) Raw and packing materials consumedProductsTelmisartan IP 80.03 24.80 100ml Amber Pet Bottles (25 mm Neck) 76.96 54.69 Mupirocin Usp 72.67 53.35 Sugar S/30 IH 59.47 54.42 Propylene Glycol IP 49.94 38.74 Sorbitol Solution 70% IP 43.21 30.09 Linezolid IP 41.80 15.63 Dextromethorphan Hydrobromide IP 36.89 10.71 Eplerenone 36.77 13.89 Azithromycin IP (Dihydrate) 34.98 23.44 Others 2,843.97 2,085.15
TOTAL 3,376.69 2,404.91
Notes to the Financial Statements(All amounts in millions of Indian Rupees, unless otherwise stated)
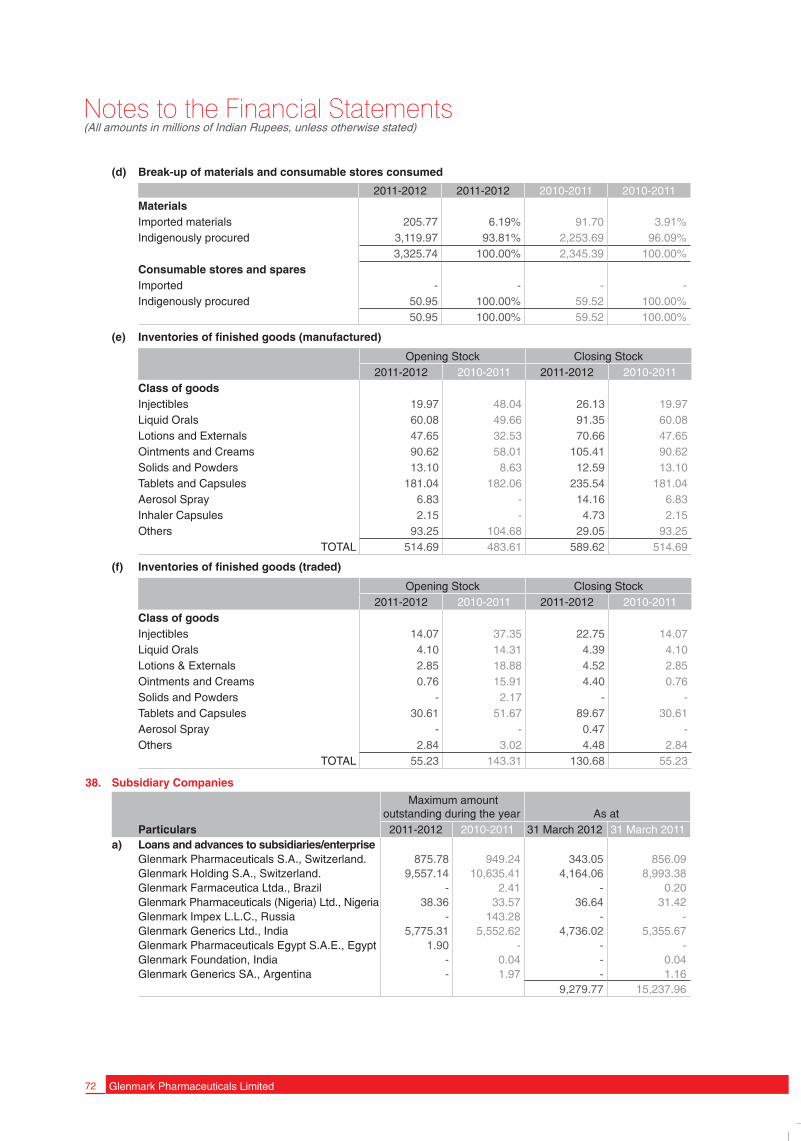
72 Glenmark Pharmaceuticals Limited
(d) Break-up of materials and consumable stores consumed
2011-2012 2011-2012 2010-2011 2010-2011MaterialsImported materials 205.77 6.19% 91.70 3.91% Indigenously procured 3,119.97 93.81% 2,253.69 96.09%
3,325.74 100.00% 2,345.39 100.00%Consumable stores and sparesImported - - - - Indigenously procured 50.95 100.00% 59.52 100.00%
50.95 100.00% 59.52 100.00%
(e) Inventories of finished goods (manufactured)
Opening Stock Closing Stock2011-2012 2010-2011 2011-2012 2010-2011
Class of goodsInjectibles 19.97 48.04 26.13 19.97 Liquid Orals 60.08 49.66 91.35 60.08 Lotions and Externals 47.65 32.53 70.66 47.65 Ointments and Creams 90.62 58.01 105.41 90.62 Solids and Powders 13.10 8.63 12.59 13.10 Tablets and Capsules 181.04 182.06 235.54 181.04 Aerosol Spray 6.83 - 14.16 6.83 Inhaler Capsules 2.15 - 4.73 2.15 Others 93.25 104.68 29.05 93.25
TOTAL 514.69 483.61 589.62 514.69
(f) Inventories of finished goods (traded)
Opening Stock Closing Stock2011-2012 2010-2011 2011-2012 2010-2011
Class of goodsInjectibles 14.07 37.35 22.75 14.07 Liquid Orals 4.10 14.31 4.39 4.10 Lotions & Externals 2.85 18.88 4.52 2.85 Ointments and Creams 0.76 15.91 4.40 0.76 Solids and Powders - 2.17 - - Tablets and Capsules 30.61 51.67 89.67 30.61 Aerosol Spray - - 0.47 - Others 2.84 3.02 4.48 2.84
TOTAL 55.23 143.31 130.68 55.23
38. Subsidiary Companies
Maximum amount outstanding during the year As at
Particulars 2011-2012 2010-2011 31 March 2012 31 March 2011 a) Loans and advances to subsidiaries/enterprise
Glenmark Pharmaceuticals S.A., Switzerland. 875.78 949.24 343.05 856.09 Glenmark Holding S.A., Switzerland. 9,557.14 10,635.41 4,164.06 8,993.38 Glenmark Farmaceutica Ltda., Brazil - 2.41 - 0.20 Glenmark Pharmaceuticals (Nigeria) Ltd., Nigeria 38.36 33.57 36.64 31.42 Glenmark Impex L.L.C., Russia - 143.28 - - Glenmark Generics Ltd., India 5,775.31 5,552.62 4,736.02 5,355.67 Glenmark Pharmaceuticals Egypt S.A.E., Egypt 1.90 - - - Glenmark Foundation, India - 0.04 - 0.04 Glenmark Generics SA., Argentina - 1.97 - 1.16
9,279.77 15,237.96
Notes to the Financial Statements(All amounts in millions of Indian Rupees, unless otherwise stated)

73Annual Report 2011 - 2012
As at 31 March 2012 31 March 2011
b) Receivable from subsidiary companiesGlenmark Pharmaceuticals S.A., Switzerland 0.84 - Glenmark Farmaceutica Ltda., Brazil 20.71 19.53 Glenmark Pharmaceuticals (Nigeria) Ltd., Nigeria 18.08 24.62 Glenmark Philippines Inc., Philippines 17.96 20.38 Glenmark Impex L.L.C., Russia 456.86 340.24 Glenmark Access Ltd., India 65.66 149.98 Glenmark Pharmaceuticals South Africa (Pty) Ltd., South Africa 74.15 - Glenmark Pharmaceuticals Venezuela., C.A , Venezuela 45.51 42.62 Glenmark Pharmaceuticals Peru SAC., Peru 9.91 15.34 Glenmark Generics (Europe) Ltd., U.K. 0.66 - Glenmark Pharmaceuticals s.r.o., Czech Republic 0.34 - Glenmark Pharmaceuticals SK, s.r.o., Slovak Republic 0.51 - Glenmark Distributor SP z.o.o., Poland 5.62 - Glenmark Pharmaceuticals S.R.L., Romania 1.60 - Glenmark Pharmaceuticals (Thailand) Co. Ltd., Thailand 0.39 -
c) Payable to subsidiariesGlenmark Pharmaceuticals FZE., United Arab Emirates 22.47 14.83 Glenmark Pharmaceuticals Malaysia Sdn.Bhd., Malaysia 17.28 11.58 Glenmark Farmaceutica Ltda., Brazil 0.34 0.33 Glenmark Pharmaceuticals Europe Ltd., U.K. 62.18 - Glenmark Therapeutics Inc., USA 1.17 - Glenmark Generics SA., Argentina 0.22 - Glenmark Generics Inc., USA 1.31 -
d) Movement of shares during the yearNo. of Shares in Millions
Balance as at
1 April 2011
Invested during
the Year
Sale/merger during
the Year
Balanceas at
31 March 2012Investments in Subsidiary Companies - Unquoted - trade Glenmark Generics Ltd., India 144.35 1.09 - 145.44 Glenmark Pharmaceuticals Egypt S.A.E., Egypt 8.46 6.26 - 14.72 Glenmark Pharmaceuticals (Nigeria) Ltd., Nigeria 365.00 137.83 - 502.83 Glenmark Dominicana S.A.,Dominican Republic 0* 0* - 0**denotes number less than a million
39. Derivative Instruments and Unhedged Foreign Currency Exposure
a) Derivatives outstanding as at the reporting date
Particulars Purpose Currency 31 March 2012 31 March 2011Forward contract Hedging USD 47.00 -
b) Particulars of unhedged foreign currency exposures as at the reporting date
Particulars Currency 31 March 2012 31 March 2011 Trade receivable, loans and advances USD 118.02 243.83
EUR 1.62 1.72 Trade payable and loans from banks USD 94.26 184.10
c) Derivative - Mark-to-Market losses
Particulars 31 March 2012 31 March 2011 Mark-to-market losses provided for 81.36 -
40. Extracts of Assets and Liabilities as on 31 March 2012 and Income and Expenses for the year ended 31 March 2012 related to the interest of the Company (without elimination of the effect of transactions between the Company and Glenmark Pharmaceuticals (Thailand) Co. Ltd., Thailand) have been extracted from the audited financial statements:
Notes to the Financial Statements(All amounts in millions of Indian Rupees, unless otherwise stated)

74 Glenmark Pharmaceuticals Limited
Particulars 2011-2012 2010-2011AssetsNet fixed assets including capital work-in-progress 0.00 - Deferred tax asset 0.81 0.38 Trade receivable 0.34 -Cash and Bank balances 0.46 0.14 Loans and advances 0.03 0.00 LiabilitiesCurrent liabilities 0.29 0.02 IncomeNet sales 0.30 - ExpensesCost of material 0.21 -Selling and operating expenses 1.00 0.86 Depreciation - - Finance cost 0.00 -Provision for taxation including deferred tax (0.35) (0.13)
41. Value of Imports on CIF Basis Capital goods 102.58 166.85 Materials 244.68 158.84
TOTAL 347.26 325.69 42. Earnings in Foreign Currency
Export of goods calculated on FOB basis 5,405.84 3,020.01 Guarantee commission 109.38 11.21 Interest on loan to subsidiaries 144.80 308.04 Royalty Income 1.85 -
TOTAL 5,661.87 3,339.26 43. Expenditure in Foreign Currency
Travelling expenses 71.04 42.60 Professional and consultancy charges 115.63 7.00 Export promotional expenses and export commission 394.82 176.10 Salary and related expenses 184.83 95.81 Product registration expenses 44.17 38.03 Interest expenses 391.86 264.09 QIB issue expenses - 10.64 FCCB premium on redemption - 600.03 Others 814.19 324.56
TOTAL 2,016.54 1,558.86 44. Dividend Remittance in Foreign Currency
Number of non-resident shareholders 16 16 Number of equity shares held by them 225,240 217,610 Amount of dividend paid (gross), TDS ` Nil (2011 - ` Nil) 0.09 0.09 Year to which dividend relates 2010-2011 2009-2010
45. Prior Year Comparatives During the year ended 31 March 2012 the revised schedule VI notified under the Companies Act,1956, has become
applicable to the Company. The company has reclassified previous year figures to confirm to this year’s classification. The adoption of revised schedule VI does not impact recognition and measurement principles followed for preparation of financial statements. However, it significantly impacts presentation and disclosure made in the financial statements.
Signatures to the Notes 1 to 45 which form an integral part of the Financial Statements.
For Walker, Chandiok & Co. For and on behalf of the Board of DirectorsChartered Accountants
Khushroo B. Panthaky Glenn Saldanha Cherylann PintoPartner Chairman & Managing Director Executive Director
Rajesh Desai Marshall MendonzaPlace: Mumbai Executive Director & CFO Vice President &Date: 08 May 2012 Company Secretary
Notes to the Financial Statements(All amounts in millions of Indian Rupees, unless otherwise stated)

75Annual Report 2011 - 2012
Auditors’ Report
Auditors’ report to the Board of Directors of Glenmark Pharmaceuticals Limited.
1. We have audited the attached Consolidated Statement of Financial Position of Glenmark Pharmaceuticals Limited ("the Company") its subsidiaries (as per list appearing in Note B) collectively referred to as "the Glenmark Group" as at 31 March 2012 and also the Consolidated Statement of Comprehensive Income, Consolidated Statement of Changes in Equity and the Consolidated Statement of Cash Flow for the year ended on the date annexed thereto (“collectively referred as consolidated financial statements”). These consolidated financial statements are the responsibility of the Glenmark Group’s management and have been prepared by the management on the basis of separate financial statements and other financial information regarding components. Our responsibility is to express an opinion on these consolidated financial statements based on our audit.
2. We conducted our audit in accordance with auditing standards generally accepted in India. Those standards require that we plan and perform the audit to obtain reasonable assurance whether the financial statements are free of material misstatement. An audit includes examining, on a test basis, evidence supporting the amounts and disclosures in the financial statements. An audit also includes assessing the accounting principles used and significant estimates made by management, as well as evaluating the overall financial statement presentation. We believe that our audit provides a reasonable basis for our opinion.
3. We report that:
a) the consolidated financial statements have been prepared by Glenmark Group’s management in accordance with the requirements of International Accounting Standard 27, ‘Consolidated and Separate Financial Statements’ forming part of International Financial Reporting Standards as permitted by SEBI circular CIR/CFD/DIL/1/2010 dated 5 April 2010 (“SEBI Circular”).
b) We did not audit the financial statements of certain subsidiaries, whose financial statements reflect total assets of ` 25,579.14 millions (P.Y. ` 14,389 millions) as at 31 March 2012, total revenue of ` 24,395.87 millions(P.Y. ` 18,938 millions) and cash flows amounting to ` 922.91 millions (P.Y. ` 1,019.62 millions) for the year then ended.
4. Based on our audit and consideration of reports of other auditors on financial statements and on the other financial information of the components, and to the best of our information and according to the explanations given to us, we are of the opinion that, the attached consolidated financial statements give a true and fair view in conformity with International Financial Reporting Standards as permitted vide SEBI circular:
a) in case of the consolidated Statement of Financial Position, of the state of affairs of the Glenmark Group as at 31 March 2012;
b) in case of the consolidated Statement of Comprehensive Income, of the profit for the year ended on that date;
c) in case of the consolidated Statement of Cash Flow, of the cash flows for the year ended on that date.
For Walker, Chandiok & Co.Chartered AccountantsFirm Registration No.: 001076N
Per Khushroo B. PanthakyPartnerMembership No.: F – 42423
Place: MumbaiDate: 08 May 2012
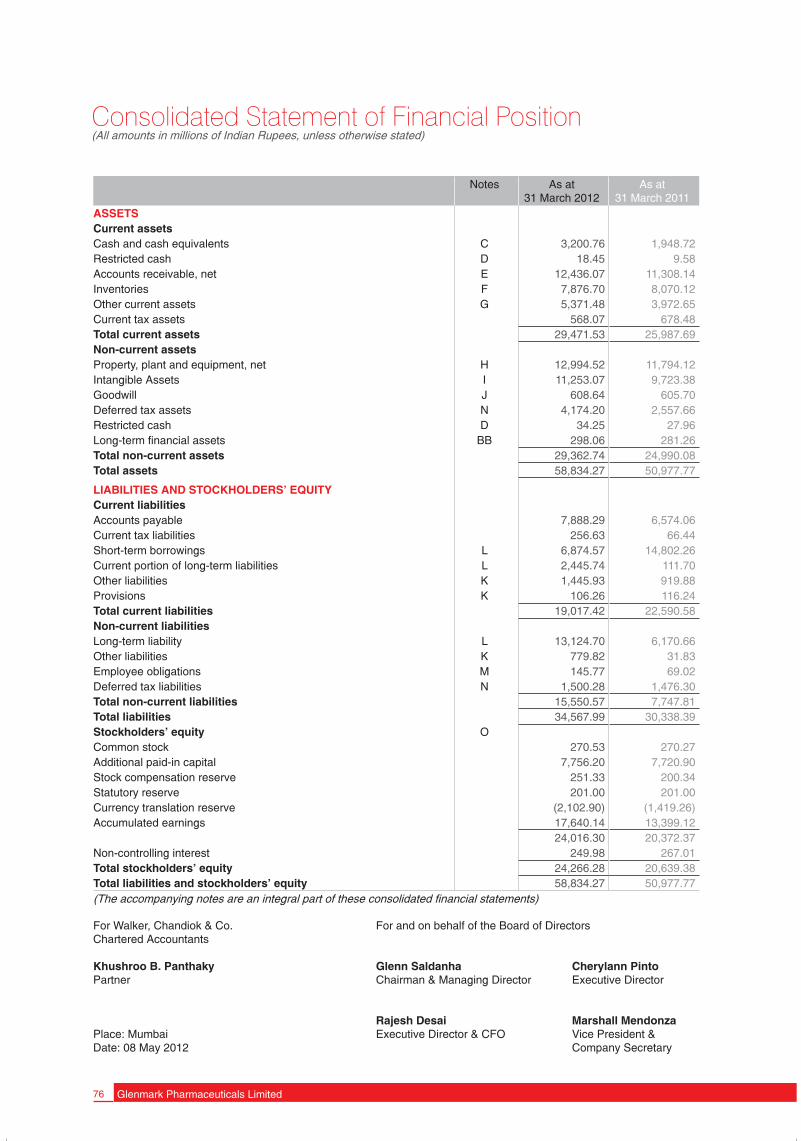
76 Glenmark Pharmaceuticals Limited
Consolidated Statement of Financial Position(All amounts in millions of Indian Rupees, unless otherwise stated)
Notes As at31 March 2012
As at31 March 2011
ASSETSCurrent assetsCash and cash equivalents C 3,200.76 1,948.72 Restricted cash D 18.45 9.58 Accounts receivable, net E 12,436.07 11,308.14 Inventories F 7,876.70 8,070.12 Other current assets G 5,371.48 3,972.65 Current tax assets 568.07 678.48 Total current assets 29,471.53 25,987.69 Non-current assetsProperty, plant and equipment, net H 12,994.52 11,794.12 Intangible Assets I 11,253.07 9,723.38 Goodwill J 608.64 605.70 Deferred tax assets N 4,174.20 2,557.66 Restricted cash D 34.25 27.96 Long-term financial assets BB 298.06 281.26 Total non-current assets 29,362.74 24,990.08 Total assets 58,834.27 50,977.77
LIABILITIES AND STOCKHOLDERS’ EQUITYCurrent liabilitiesAccounts payable 7,888.29 6,574.06 Current tax liabilities 256.63 66.44 Short-term borrowings L 6,874.57 14,802.26 Current portion of long-term liabilities L 2,445.74 111.70 Other liabilities K 1,445.93 919.88 Provisions K 106.26 116.24 Total current liabilities 19,017.42 22,590.58 Non-current liabilitiesLong-term liability L 13,124.70 6,170.66 Other liabilities K 779.82 31.83 Employee obligations M 145.77 69.02 Deferred tax liabilities N 1,500.28 1,476.30 Total non-current liabilities 15,550.57 7,747.81 Total liabilities 34,567.99 30,338.39 Stockholders’ equity OCommon stock 270.53 270.27 Additional paid-in capital 7,756.20 7,720.90 Stock compensation reserve 251.33 200.34 Statutory reserve 201.00 201.00 Currency translation reserve (2,102.90) (1,419.26)Accumulated earnings 17,640.14 13,399.12
24,016.30 20,372.37 Non-controlling interest 249.98 267.01 Total stockholders’ equity 24,266.28 20,639.38 Total liabilities and stockholders’ equity 58,834.27 50,977.77 (The accompanying notes are an integral part of these consolidated financial statements)
For Walker, Chandiok & Co. For and on behalf of the Board of DirectorsChartered Accountants
Khushroo B. Panthaky Glenn Saldanha Cherylann PintoPartner Chairman & Managing Director Executive Director
Rajesh Desai Marshall MendonzaPlace: Mumbai Executive Director & CFO Vice President &Date: 08 May 2012 Company Secretary
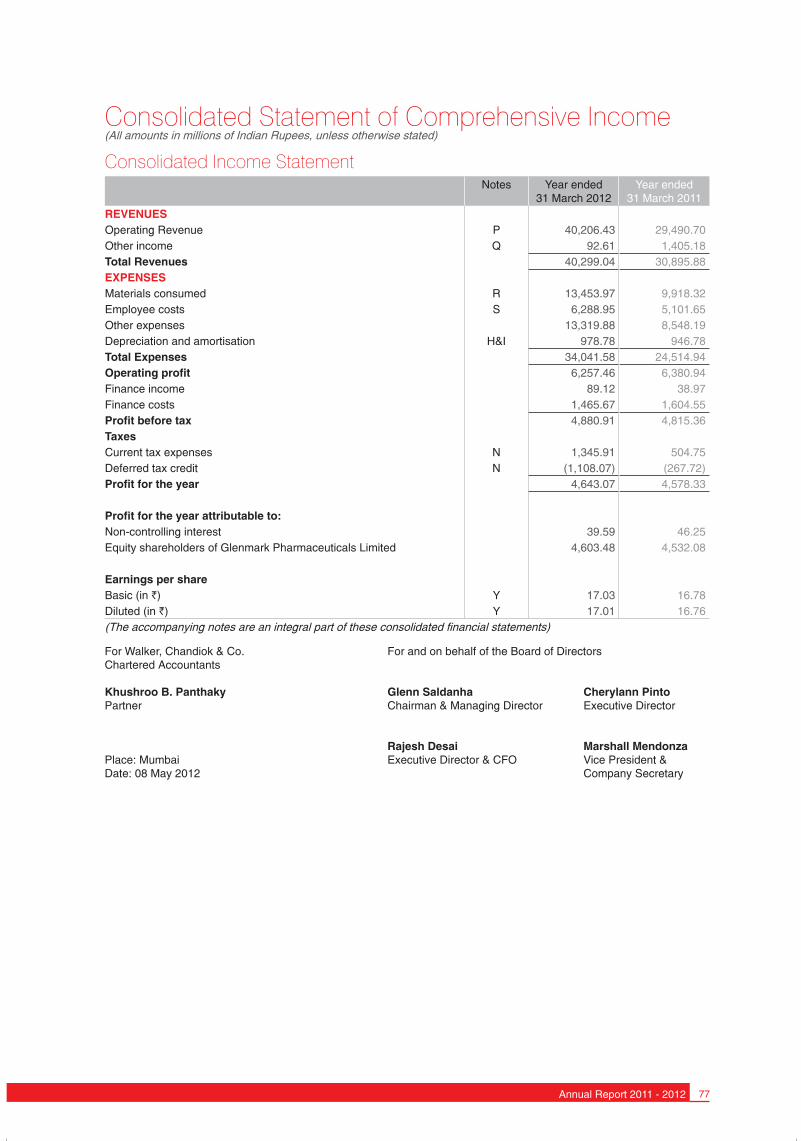
77Annual Report 2011 - 2012
Consolidated Statement of Comprehensive Income(All amounts in millions of Indian Rupees, unless otherwise stated)
Consolidated Income StatementNotes Year ended
31 March 2012 Year ended
31 March 2011REVENUESOperating Revenue P 40,206.43 29,490.70Other income Q 92.61 1,405.18Total Revenues 40,299.04 30,895.88EXPENSESMaterials consumed R 13,453.97 9,918.32Employee costs S 6,288.95 5,101.65Other expenses 13,319.88 8,548.19Depreciation and amortisation H&I 978.78 946.78 Total Expenses 34,041.58 24,514.94Operating profit 6,257.46 6,380.94Finance income 89.12 38.97 Finance costs 1,465.67 1,604.55Profit before tax 4,880.91 4,815.36TaxesCurrent tax expenses N 1,345.91 504.75 Deferred tax credit N (1,108.07) (267.72)Profit for the year 4,643.07 4,578.33
Profit for the year attributable to:Non-controlling interest 39.59 46.25Equity shareholders of Glenmark Pharmaceuticals Limited 4,603.48 4,532.08
Earnings per share Basic (in `) Y 17.03 16.78Diluted (in `) Y 17.01 16.76(The accompanying notes are an integral part of these consolidated financial statements)
For Walker, Chandiok & Co. For and on behalf of the Board of DirectorsChartered Accountants
Khushroo B. Panthaky Glenn Saldanha Cherylann PintoPartner Chairman & Managing Director Executive Director
Rajesh Desai Marshall MendonzaPlace: Mumbai Executive Director & CFO Vice President &Date: 08 May 2012 Company Secretary

78 Glenmark Pharmaceuticals Limited
Consolidated Statement of Comprehensive Income(All amounts in millions of Indian Rupees, unless otherwise stated)
Consolidated Statement of Other Comprehensive IncomeNotes Year ended
31 March 2012 Year ended
31 March 2011
Profit for the year 4,643.07 4,578.33
Other comprehensive income
Exchange differences on translating foreign operations O (683.64) (1,249.33)
Income tax relating to components of other comprehensive income - -
Other comprehensive income for the year, net of tax (683.64) (1,249.33)
Total comprehensive income for the year 3,959.43 3,329.00
Total comprehensive income attributable to:
Non-controlling interest 39.59 46.25
Equity shareholders of Glenmark Pharmaceuticals Limited 3,919.84 3,282.75
(The accompanying notes are an integral part of these consolidated financial statements)
For Walker, Chandiok & Co. For and on behalf of the Board of DirectorsChartered Accountants
Khushroo B. Panthaky Glenn Saldanha Cherylann PintoPartner Chairman & Managing Director Executive Director
Rajesh Desai Marshall MendonzaPlace: Mumbai Executive Director & CFO Vice President &Date: 08 May 2012 Company Secretary
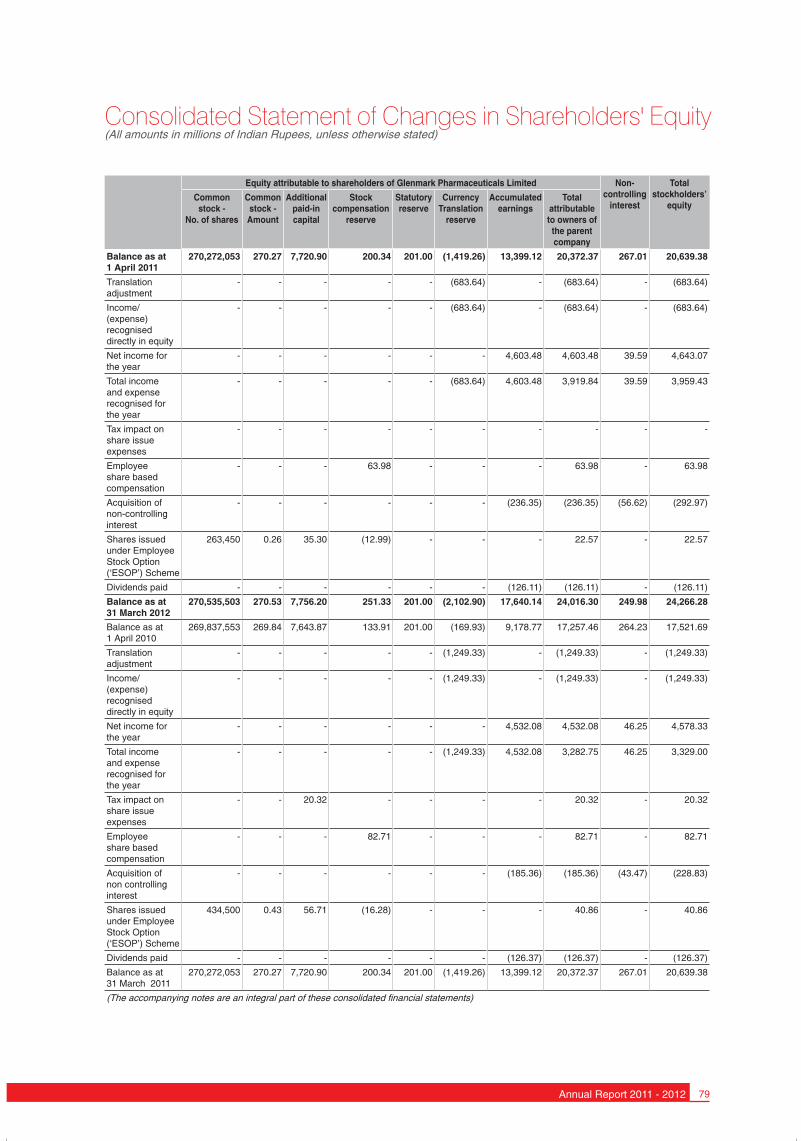
79Annual Report 2011 - 2012
Balance as at1 April 2010
269,837,553 269.84 7,643.87 133.91 201.00 (169.93) 9,178.77 17,257.46 264.23 17,521.69
Translation adjustment
- - - - - (1,249.33) - (1,249.33) - (1,249.33)
Income/ (expense) recognised directly in equity
- - - - - (1,249.33) - (1,249.33) - (1,249.33)
Net income for the year
- - - - - - 4,532.08 4,532.08 46.25 4,578.33
Total income and expense recognised for the year
- - - - - (1,249.33) 4,532.08 3,282.75 46.25 3,329.00
Tax impact on share issue expenses
- - 20.32 - - - - 20.32 - 20.32
Employee share based compensation
- - - 82.71 - - - 82.71 - 82.71
Acquisition of non controlling interest
- - - - - - (185.36) (185.36) (43.47) (228.83)
Shares issued under Employee Stock Option (‘ESOP’) Scheme
434,500 0.43 56.71 (16.28) - - - 40.86 - 40.86
Dividends paid - - - - - - (126.37) (126.37) - (126.37)
Balance as at31 March 2011
270,272,053 270.27 7,720.90 200.34 201.00 (1,419.26) 13,399.12 20,372.37 267.01 20,639.38
(The accompanying notes are an integral part of these consolidated financial statements)
Equity attributable to shareholders of Glenmark Pharmaceuticals Limited Non-controlling
interest
Total stockholders’
equityCommon
stock - No. of shares
Common stock -
Amount
Additional paid-in capital
Stock compensation
reserve
Statutory reserve
Currency Translation
reserve
Accumulated earnings
Total attributable to owners of
the parent company
Balance as at1 April 2011
270,272,053 270.27 7,720.90 200.34 201.00 (1,419.26) 13,399.12 20,372.37 267.01 20,639.38
Translation adjustment
- - - - - (683.64) - (683.64) - (683.64)
Income/ (expense) recognised directly in equity
- - - - - (683.64) - (683.64) - (683.64)
Net income for the year
- - - - - - 4,603.48 4,603.48 39.59 4,643.07
Total income and expense recognised for the year
- - - - - (683.64) 4,603.48 3,919.84 39.59 3,959.43
Tax impact on share issue expenses
- - - - - - - - - -
Employee share based compensation
- - - 63.98 - - - 63.98 - 63.98
Acquisition of non-controlling interest
- - - - - - (236.35) (236.35) (56.62) (292.97)
Shares issued under Employee Stock Option (‘ESOP’) Scheme
263,450 0.26 35.30 (12.99) - - - 22.57 - 22.57
Dividends paid - - - - - - (126.11) (126.11) - (126.11)
Balance as at 31 March 2012
270,535,503 270.53 7,756.20 251.33 201.00 (2,102.90) 17,640.14 24,016.30 249.98 24,266.28
Consolidated Statement of Changes in Shareholders' Equity(All amounts in millions of Indian Rupees, unless otherwise stated)

80 Glenmark Pharmaceuticals Limited
Consolidated Statement of Cash Flows(All amounts in millions of Indian Rupees, unless otherwise stated)
Particulars Year ended
31 March 2012 Year ended
31 March 2011(A) Cash inflow/(outflow) from operating activitiesProfit before tax 4,880.91 4,815.53 Adjustments to reconcile profit before tax to net cash provided by operating activities:Depreciation and amortisation 978.28 946.78 Employee share based compensation 63.98 82.71 Interest expense 1,332.00 1,604.55 Interest income (89.12) (38.97)Profit/(loss) on sale of assets 1.31 (3.52)Other provisions 10.58 48.32 Bad debts and provision for doubtful debts 13.35 98.60 Unrealised exchange differences (net) 2,530.13 (841.94)Operating profit before changes in operating assets and liabilities 9,721.42 6,712.06 Changes in operating assets and liabilitiesAccounts receivable (1,095.97) 3,011.77 Other assets (608.90) (1,923.86)Accounts payable and other liabilities 1,356.94 2,443.39 Net changes in operating assets and liabilities (347.93) 3,531.30 Income taxes paid (1,329.58) (937.54)Net cash provided by operating activities 8,043.91 9,305.82 (B) Cash inflow/(outflow) from investing activitiesRestricted cash (15.16) (3.21)Interest received 66.45 38.97 Payments for purchase of property, plant and equipment and intangible assets (2,853.96) (4,011.60)Proceeds from sale of property, plant and equipment 24.81 303.13 Net cash used in investing activities (2,777.86) (3,672.71)(C) Cash inflow/(outflow) from financing activitiesProceeds from long-term borrowings 6,523.26 8,346.01 Repayments of long-term borrowings (1,686.32) (8,888.59)Repayments of short-term borrowings, net (6,401.81) (2,037.36)Interest paid (1,631.53) (1,458.97)Proceeds from issue of share capital 35.56 40.86 Acquisition of non-controlling interest (327.00) (232.25)Dividend paid (including tax on dividend) (126.09) (125.82)Net cash used in financing activities (3,613.93) (4,356.12)Effect of exchange rate changes on cash (400.08) (364.10)Net increase in cash and cash equivalents 1,252.04 912.89 Cash and cash equivalents at the beginning of the year 1,948.72 1,035.83 Cash and cash equivalents at the end of the year (refer NOTE C) 3,200.76 1,948.72 (The accompanying notes are an integral part of these consolidated financial statements)
For Walker, Chandiok & Co. For and on behalf of the Board of DirectorsChartered Accountants
Khushroo B. Panthaky Glenn Saldanha Cherylann PintoPartner Chairman & Managing Director Executive Director
Rajesh Desai Marshall MendonzaPlace: Mumbai Executive Director & CFO Vice President &Date: 08 May 2012 Company Secretary

81Annual Report 2011 - 2012
Notes to Consolidated Financial Statements(All amounts in millions of Indian Rupees, unless otherwise stated)
NOTE A – BACKGROUND INFORMATION AND SUMMARY OF SIGNIFICANT ACCOUNTING POLICIES
1. Nature of Operations
Glenmark Pharmaceuticals Limited (“Glenmark” or ‘the Company’) and its subsidiaries (together referred to as ‘the Group’) are primarily engaged in the business of development, manufacture and marketing of pharmaceutical products. The Group has a significant presence in branded generics markets across emerging economies including India and also has a fast growing generics business in the United States and Europe. The Group also markets active pharmaceutical ingredients to regulated and semi-regulated markets. The Group is actively involved in the discovery of new molecules both NCEs (new chemical entities) and NBEs (new biological entities).
The Group’s research and development facilities are located at Mahape, Sinnar and Taloja in India, North Oxford in the United Kingdom and at La Chaux-de-fonds in Switzerland. The manufacturing facilities of the Group in India are located at Nasik, Goa, Baddi, Nalagarh, Indore, Ankleshwar, Mohol and Kurkumbh. Overseas manufacturing facilities are located in Brazil, Czech Republic and Argentina.
2. General Information
Glenmark Pharmaceuticals Limited, a public limited company, is domiciled in Mumbai, India and is the Group’s ultimate parent company. The registered office of Glenmark Pharmaceuticals Limited is at B/2, Mahalaxmi Chambers, 22 Bhulabhai Desai Road, Mumbai – 400 026, India.
The Company’s shares are listed on the Bombay Stock Exchange (“BSE”) and the National Stock Exchange of India (“NSE”).The Company had issued Foreign Currency Convertible Debt instruments which were traded on the Singapore Stock Exchange (SGX).
The consolidated financial statements of Glenmark Group are prepared and presented in millions of Indian Rupees (‘INR’), the Company’s functional currency.
The financial statements for the year ended 31 March 2012 were approved by the Board of Directors on 8 May 2012.
3. Summary of Significant Accounting Policies
3.1 Overall Considerations
The consolidated financial statements have been prepared using accounting policies specified by those IFRS that are in effect as at 31 March 2012. The significant accounting policies that have been used in the preparation of these consolidated financial statements are summarised below.
These accounting policies have been used throughout the periods presented in the financial statements.
An overview of standards, amendments and interpretations to IFRSs issued but not yet effective and which have not been adopted early by the Group are presented in Note A - 5.
The consolidated financial statements have been prepared on a going concern basis.
3.2 Presentation of Financial Statements
The consolidated financial statements are presented in accordance with IAS 1 Presentation of Financial Statements (Revised 2007). The Group has elected to present the ‘Statement of comprehensive income’ in two statements: the ‘Consolidated Income Statement’ and the ‘Consolidated Statement of Other Comprehensive Income’.
In future periods, two comparative periods will be presented for the statement of financial position when the Group:
(i) applies an accounting policy retrospectively,
(ii) makes a retrospective restatement of items in its financial statements, or
(iii) reclassifies items in the financial statements.
3.3 Basis of Consolidation
The group financial statements consolidate those of the Company and all of its subsidiary undertakings drawn up to the dates specified in Note B. Subsidiaries are all entities over which Glenmark Pharmaceuticals Limited has the power to control the financial and operating policies. In assessing control, potential voting rights that currently are exercisable are taken into account. The financial statements of subsidiaries are included in the consolidated financial statements from the date that control commences until the date that control ceases.Glenmark Pharmaceuticals Limited obtains and exercises control through voting rights.
Unrealised gains and losses on transactions between the Company and its subsidiaries are eliminated. Where unrealised losses on intra-group asset sales are reversed on consolidation, the underlying asset is also tested for impairment losses from the group perspective. Amounts reported in the financial statements of subsidiaries have been adjusted where necessary to ensure consistency with the accounting policies adopted by the Group.
Profit or loss and other comprehensive income of subsidiaries acquired or disposed off during the year are recognised from the effective date of acquisition, or up to the effective date of disposal as appropriate.
Non-controlling interests are presented in the consolidated statement of financial position within equity, separately from the equity of the owners of the parent.

82 Glenmark Pharmaceuticals Limited
Notes to Consolidated Financial Statements(All amounts in millions of Indian Rupees, unless otherwise stated)
Non-controlling interests represent the portion of a subsidiary’s profit or loss and net assets that is not held by the Group. Profit or loss and each component of other comprehensive income are attributed to the owners of the parent and to the non-controlling interests. Total comprehensive income is attributed to the owners of the parent and to the non-controlling interests even if this results in the non-controlling interests having a deficit balance.
3.4 Business Combinations
Business combinations are accounted for using the purchase method. The purchase method involves the recognition of the acquiree’s identifiable assets and liabilities, including contingent liabilities, regardless of whether they were recorded in the financial statements prior to acquisition. On initial recognition, the assets and liabilities of the acquired subsidiary are included in the consolidated statement of financial position at their fair values, which are also used as the basis for subsequent measurement in accordance with the Group’s accounting policies.
Goodwill is stated after separating out identifiable intangible assets. Goodwill represents the excess of consideration transferred and any non-controlling interests over the fair value of the identifiable net assets of the acquiree at the date of acquisition. Any excess of identifiable net assets over the consideration transferred and any non-controlling interest is recognised in income statement immediately after acquisition as a ‘gain on bargain purchase’.
3.5 Foreign Currency Translation
The consolidated financial statements are presented in Indian Rupees (‘INR’), which is also the functional currency of the parent company, Glenmark Pharmaceuticals Limited, being the currency of the primary economic environment in which it operates.
Foreign currency transactions
Transactions in foreign currencies are translated to the respective functional currencies of entities within the Group at exchange rates prevailing at the dates of the transactions. Foreign exchange gains and losses resulting from the settlement of such transactions and from the remeasurement of monetary items at year-end exchange rates are recognised in income statement. Non-monetary items measured at historical cost are translated using the exchange rates at the date of the transaction (not retranslated). Non-monetary items measured at fair value are translated using the exchange rates at the date when fair value was determined.
Foreign currency gains and losses are reported on a net basis.
Foreign operations
In the Group’s consolidated financial statements, the assets, liabilities and transactions of foreign operations are translated into INR, the Group’s presentation currency upon consolidation. The functional currencies of the entities in the Group have remained unchanged during the reporting period.
On consolidation, assets and liabilities have been translated into INR at exchange rates at the reporting date. Goodwill and fair value adjustments arising on the acquisition of a foreign entity have been treated as assets and liabilities of the foreign entity and translated into INR at the closing rate. The income and expenses of foreign operations are translated to INR at the average exchange rates prevailing during the year. Exchange differences are recognised in Other Comprehensive Income and recognised in the currency translation reserve in equity. When a foreign operation is disposed of, in part or in full, the cumulative currency translation differences recognised in equity are reclassified to income statement and recognised as part of the gain or loss on disposal.
3.6 Revenue Recognition
Sale of goods
Revenue is recognised when the significant risks and rewards of ownership have been transferred to the buyer, recovery of the consideration is probable, the associated costs and possible return of goods can be estimated reliably, there is no continuing management involvement with the goods and the amount of revenue can be measured reliably. Revenue from the sale of goods includes excise duty and is measured at the fair value of the consideration received or receivable, net of returns, value added tax and applicable trade discounts and allowances. Revenue includes shipping and handling costs billed to the customer.
Sales of active pharmaceutical ingredients and intermediates in India are made directly to customers of the Group. Significant risks and rewards in respect of ownership of active pharmaceuticals ingredients are transferred by the Group upon delivery of the products to the customers.
Revenue from contract research is recognised in income statement when right to receive a non-refundable payment from out-licensing partner has been established.
Provisions for chargeback, rebates, discounts and medical aid payments are estimated and provided for in the year of sales and recorded as reduction of revenue. A chargeback claim is a claim made by the wholesaler for the difference between the price at which the product is initially invoiced to the wholesaler and the net price at which it is agreed to be procured from the Group. Provisions for such chargebacks are accrued and estimated based on historical average chargeback rate actually claimed over a period of time, current contract prices with wholesalers/other customers and estimated inventory holding by the wholesaler. Such provisions are presented as a reduction from revenues.

83Annual Report 2011 - 2012
The Group accounts for sales returns by recording a provision based on the Group’s estimate of expected sales returns. The Group deals in various products and operates in various markets. Accordingly, the Group’s estimate of sales returns is determined primarily by its experience in these markets. In respect of established products, the Group determines an estimate of sales returns provision primarily based on its historical experience with such sales returns. Additionally, other factors that the Group considers in determining the estimate include levels of inventory in the distribution channel, estimated shelf life, product discontinuances, price changes of competitive products and introduction of competitive new products, to the extent each of these factors impact the Group’s business and markets. The Group considers all these factors and adjusts the sales return provision to reflect its actual experience. With respect to new products introduced by the Group, those have historically been either extensions of an existing line of product where the Group has historical experience or in therapeutic categories where established products exist and are sold either by the Group or its competitors.
Services
Revenue from services rendered is recognised in income statement as the underlying services are performed.
Export entitlements
Export entitlements from government authorities are recognised in income statement when the right to receive credit as per the terms of the scheme is established in respect of the exports made by the Group, and where there is no significant uncertainty regarding the ultimate collection of the relevant export proceeds.
Finance and other income
Finance income consists of interest income on funds invested (including available-for-sale financial assets), dividend income and gains on the disposal of available-for-sale financial assets. Interest income is recognised as it accrues in income statement, using the effective interest rate method. Dividend income is recognised in income statement on the date that the Group’s right to receive payment is established.
3.7 Property, Plant and Equipment
Recognition and measurement
Items of property, plant and equipment are measured at cost less accumulated depreciation and accumulated impairment losses. Cost includes expenditures that are directly attributable to the acquisition of the asset. The cost of self-constructed assets includes the cost of materials and other costs directly attributable to bringing the asset to a working condition for its intended use.
When parts of an item of property, plant and equipment have different useful lives, they are accounted for as separate items (major components) of property, plant and equipment.
Profits and losses upon disposal of an item of property, plant and equipment are determined by comparing the proceeds from disposal with the carrying amount of property, plant and equipment and are recognised net within “other income/expense, net” in income statement.
The cost of replacing part of an item of property, plant and equipment is recognised in the carrying amount of the item if it is probable that the future economic benefits embodied within the part will flow to the Group and its cost can be measured reliably. The costs of repairs and maintenance are recognised in income statement as incurred.
Depreciation
Depreciation is recognised in income statement on a straight-line basis over the estimated useful lives of property, plant and equipment. Leased assets are depreciated over the shorter of the lease term or their useful lives, unless it is reasonably certain that the Group will obtain ownership by the end of the lease term. Land is not depreciated.
The estimated useful lives are as follows:
Factory and other buildings 30 – 55 years
Plant and machinery 8 – 21 years
Furniture, fixtures and office equipment 4 – 21 years
Vehicles 5 – 6 years
Depreciation methods, useful lives and residual values are reviewed at each reporting date. Advances paid towards the acquisition of property, plant and equipment outstanding at each date of statement of financial position and the cost of property, plant and equipment not put to use before such date are disclosed under capital work-in-progress.
3.8 Borrowing Costs
Borrowing costs primarily comprise interest on the Group’s borrowings. Borrowing costs directly attributable to the acquisition, construction or production of a qualifying asset are capitalised during the period of time that is necessary to complete and prepare the asset for its intended use or sale. Other borrowing costs are expensed in the period in which they are incurred and reported in ‘finance costs’.
Finance costs consist of interest expense on loans and borrowings and impairment losses recognised on financial assets. Borrowing costs are recognised using the effective interest rate method.
Notes to Consolidated Financial Statements(All amounts in millions of Indian Rupees, unless otherwise stated)
84 Glenmark Pharmaceuticals Limited
3.9 Intangible Assets
Goodwill
Goodwill arises upon the acquisition of subsidiaries, associates and joint ventures.
Acquisitions prior to 1 April 2010
As part of its transition to IFRS, the Group elected to restate only those business combinations that occurred on or after 1 April 2010. In respect of acquisitions prior to 1 April 2010, goodwill represents the amount recognised under Indian GAAP.
Acquisitions on or after 1 April 2010
For acquisitions on or after 1 April 2010, goodwill represents the excess of the cost of the acquisition over the Group’s interest in the net fair value of the identifiable assets, liabilities and contingent liabilities of the acquiree.
Subsequent measurement
Goodwill is measured at cost less accumulated impairment losses.
Research and development
Expenditures on research activities undertaken with the prospect of gaining new scientific or technical knowledge and understanding are recognised in income statement when incurred.
Development activities involve a plan or design for the production of new or substantially improved products and processes. Development expenditures are capitalised only if development costs can be measured reliably, the product or process is technically and commercially feasible, future economic benefits are probable, and the Group intends to and has sufficient resources to complete development and to use or sell the asset. The expenditures capitalised include the cost of materials and other costs directly attributable to preparing the asset for its intended use. Other development expenditures are recognised in income statement as incurred.
The Group’s internal drug development expenditures are capitalised only if they meet the recognition criteria as mentioned above. Where uncertainties are such that the criteria are not met, the expenditures are recognised in income statement as incurred. Where, however, the recognition criteria are met, intangible assets are capitalised and based on the management estimate of infinite life or limited life these are tested for impairment or amortised on a straight-line basis over their useful economic lives from product launch respectively. During the periods prior to their launch (including periods when such products have been out-licenced to other companies), these assets are tested for impairment on an annual basis, as their economic useful life is indefinite till then.
Payments to in-license products and compounds from third parties generally taking the form of up-front payments and milestones are capitalised and amortised, generally on a straight-line basis, over their useful economic lives from product launch. During the periods prior to their launch, these assets are tested for impairment on an annual basis, as their economic useful life is indefinite till then.
De-recognition of intangible assets
Intangible assets are de-recognised either on their disposal or where no future economic benefits are expected from their use or disposal. Losses arising on such de-recognition are recorded in Income statement, and are measured as the difference between the net disposal proceeds, if any, and the carrying amount of respective intangible assets as on the date of de-recognition.
Intangible assets relating to products in development, other intangible assets not available for use and intangible assets having indefinite useful life are subject to impairment testing at each reporting date. All other intangible assets are tested for impairment when there are indications that the carrying value may not be recoverable. Any impairment losses are recognised immediately in the income statement.
Other intangible assets
Other intangible assets that are acquired by the Group, which have finite useful lives, are measured at cost less accumulated amortisation and accumulated impairment losses.
Subsequent expenditures are capitalised only when they increase the future economic benefits embodied in the specific asset to which they relate.
Software for internal use, which is primarily acquired from third-party vendors, including consultancy charges for implementing the software, is capitalised. Subsequent costs are charged to the income statement as incurred. The capitalised costs are amortised over the estimated useful life of the software.
Amortisation
Amortisation is recognised in income statement on a straight-line basis over the estimated useful lives of intangible assets, other than for goodwill, intangible assets not available for use and intangible assets having indefinite life, from the date that they are available for use.
The estimated useful lives are as follows:
Product related intangibles 10 years
Other intangibles 5 years
Notes to Consolidated Financial Statements(All amounts in millions of Indian Rupees, unless otherwise stated)

85Annual Report 2011 - 2012
3.10 Impairment testing of Financial Assets, Goodwill, Intangible Assets and Property, Plant and Equipment
Financial assets
A financial asset is assessed at each reporting date to determine whether there is any objective evidence that it is impaired. A financial asset is considered to be impaired if objective evidence indicates that one or more events had a negative effect on the estimated future cash flows of that asset.
An impairment loss, in respect of a financial asset measured at amortised cost is calculated as the difference between its carrying amount, and the present value of the estimated future cash flows discounted at the original effective interest rate. An impairment loss, in respect of an available-for-sale financial asset is calculated by reference to its fair value.
Individually significant financial assets are tested for impairment on an individual basis. All impairment losses are recognised in income statement. Any cumulative loss in respect of an available-for-sale financial asset recognised previously in equity is transferred to income statement. An impairment loss is reversed if the reversal can be related objectively to an event occurring after the impairment loss was recognised. For financial assets measured at amortised cost and available-for-sale financial assets that are debt securities, the reversal is recognised in income statement. For available-for-sale financial assets that are equity securities, the reversal is recognised in Other Comprehensive Income.
Non-financial assets
The carrying amounts of the Group’s non-financial assets, other than inventories and deferred tax assets are reviewed at each reporting date to determine whether there is any indication of impairment. If any such indication exists, then the asset’s recoverable amount is estimated. For goodwill and intangible assets that have indefinite lives or that are not yet available for use, the recoverable amount is estimated each year at the same time.
The recoverable amount of an asset or cash-generating unit (as defined below) is the greater of its value in use or its fair value less costs to sell. In assessing value in use, the estimated future cash flows are discounted to their present value using a pre-tax discount rate that reflects current market assessments of the time value of money and the risks specific to the asset. For the purpose of impairment testing, assets are grouped together into the smallest group of assets that generates cash inflows from continuing use that are largely independent of the cash inflows of other assets or groups of assets (the “cash-generating unit”). The goodwill acquired in a business combination is, for the purpose of impairment testing, allocated to cash-generating units that are expected to benefit from the synergies of the combination.
An impairment loss is recognised if the carrying amount of an asset or its cash-generating unit exceeds its estimated recoverable amount. Impairment losses are recognised in income statement. Impairment losses recognised in respect of cash-generating units are allocated first to reduce the carrying amount of any goodwill allocated to the units and then to reduce the carrying amount of the other assets in the unit on a pro-rata basis.
An impairment loss in respect of goodwill is not reversed. In respect of other assets, impairment losses recognised in prior periods are assessed at each reporting date for any indications that the loss has decreased or no longer exists. An impairment loss is reversed if there has been a change in the estimates used to determine the recoverable amount. An impairment loss is reversed only to the extent that the asset’s carrying amount does not exceed the carrying amount that would have been determined, net of depreciation or amortisation, if no impairment loss had been recognised.
3.11 Financial Instruments
Financial assets and financial liabilities are recognised when the Group becomes a party to the contractual provisions of the financial instrument.
Financial assets are derecognised when the contractual rights to the cash flows from the financial asset expire, or when the financial asset and all substantial risks and rewards are transferred.
A financial liability is derecognised when it is extinguished, discharged, cancelled or expires.
Financial assets and financial liabilities are measured initially at fair value plus transaction costs, except for financial assets and financial liabilities carried at fair value through income statement, which are measured initially at fair value. Financial assets and financial liabilities are measured subsequently as described below.
3.12 Financial Assets
Non-derivative financial instruments consists of investments in equity and debt securities, trade receivables, certain other assets, cash and cash equivalents, loans and borrowings, trade payables and certain other liabilities.
Non-derivative financial instruments are recognised initially at fair value plus, for instruments not at fair value through profit or loss, any directly attributable transaction costs. Subsequent to initial recognition, non-derivative financial instruments are measured as described below.
Cash and cash equivalents
Cash and cash equivalents consist of current cash balances and time deposits with banks. Bank overdrafts that are repayable on demand and form an integral part of the Group’s cash management are included as a component of cash and cash equivalents for the purpose of the statement of cash flows.
Notes to Consolidated Financial Statements(All amounts in millions of Indian Rupees, unless otherwise stated)
86 Glenmark Pharmaceuticals Limited
Held-to-maturity investments
If the Group has the positive intent and ability to hold debt securities to maturity, then they are classified as held-to-maturity. Held-to-maturity investments are measured at amortised cost using the effective interest rate method, less any impairment losses.
Available-for-sale financial assets
The Group’s investments in equity securities and certain debt securities are classified as available-for-sale financial assets. Subsequent to initial recognition, they are measured at fair value and changes therein, other than impairment losses, are recognised in Other Comprehensive Income. When an investment is derecognised, the cumulative gain or loss in Other Comprehensive Income is transferred to income statement.
Others
Other non-derivative financial instruments are measured at amortised cost using the effective interest rate method, less any impairment losses.
The Group holds derivative financial instruments to hedge its foreign currency exposure. Derivatives are recognised initially at fair value; transaction costs are recognised in income statement when incurred. Subsequent to initial recognition, derivatives are measured at fair value, and changes therein are recognised in income statement.
3.13 Financial Liabilities
The Group’s financial liabilities include trade and other payables, borrowings and derivative financial instruments. Payable and borrowings are initially measured at fair value and subsequently measured at amortised cost using effective interest rate method. They are included in Statement of Financial Position line items ‘long-term liabilities’ and ‘trade and other payables’.
Derivative financial instruments that are not designated and effective as hedging instruments are accounted for at fair value through profit or loss.
Financial liabilities are recognised when the Group becomes a party to the contractual agreements of the instrument. All interest related charges is recognised as an expense in “finance cost” in the income statement.
Trade payables are recognised initially at their fair value and subsequently measured at amortised cost less settlement payments.
Dividend distributions to shareholders are included in ‘other current liabilities’ when the dividends are approved by the shareholders’ meeting.
3.14 Inventories
Inventories of finished goods, consumable store and spares are valued at cost or net realisable value, whichever is lower. Cost of raw materials and packing materials is ascertained on a weighted average cost basis. Cost of work-in-progress and finished goods include the cost of materials consumed, labour and manufacturing overheads. Excise and customs duty accrued on production or import of goods, as applicable, is included in the valuation of inventories.
Net realisable value is the estimated selling price in the ordinary course of business, less the estimated costs of completion and selling expenses.
The factors that the Group considers in determining the allowance for slow moving, obsolete and other non-saleable inventory includes estimated shelf life, planned product discontinuances, price changes, ageing of inventory and introduction of competitive new products, to the extent each of these factors impact the Group’s business and markets. The Group considers all these factors and adjusts the inventory provision to reflect its actual experience on a periodic basis.
3.15 Accounting for Income Taxes
Income tax expense consists of current and deferred tax. Income tax expense is recognised in income statement except to the extent that it relates to items recognised in Other Comprehensive Income, in which case it is recognised in Other Comprehensive Income. Current tax is the expected tax payable on the taxable income for the year, using tax rates enacted or substantively enacted at the reporting date, and any adjustment to tax payable in respect of previous years.
Deferred tax is recognised using the Statement of Financial Position method, providing for temporary differences between the carrying amounts of assets and liabilities for financial reporting purposes and the amounts used for taxation purposes.
Deferred tax is not recognised for the following temporary differences:
- The initial recognition of assets or liabilities in a transaction that is not a business combination and that affects neither accounting nor taxable profit, and
- Differences relating to investments in subsidiaries and jointly controlled entities to the extent that it is probable that they will not reverse in the foreseeable future.
In addition, deferred tax is not recognised for taxable temporary differences arising upon the initial recognition of goodwill. Deferred tax is measured at the tax rates that are expected to be applied to the temporary differences when they reverse, based on the laws that have been enacted or substantively enacted by the reporting date.
Notes to Consolidated Financial Statements(All amounts in millions of Indian Rupees, unless otherwise stated)

87Annual Report 2011 - 2012
Deferred tax assets and liabilities are offset if there is a legally enforceable right to offset current tax liabilities and assets, and they relate to income taxes levied by the same tax authority on the same taxable entity, or on different tax entities, but they intend to settle current tax liabilities and assets on a net basis or their tax assets and liabilities will be realised simultaneously.
A deferred tax asset is recognised to the extent that it is probable that future taxable profits will be available against which the temporary difference can be utilised. Deferred tax assets are reviewed at each reporting date and are reduced to the extent that it is no longer probable that the related tax benefit will be realised.
3.16 Leasing Activities
At the inception of a lease, the lease arrangement is classified as either a finance lease or an operating lease, based on the substance of the lease arrangement.
Finance leases A finance lease is recognised as an asset and a liability at the commencement of the lease, at the lower of the
fair value of the asset or the present value of the minimum lease payments. Initial direct costs, if any, are also capitalised and, subsequent to initial recognition, the asset is accounted for in accordance with the accounting policy applicable to that asset. Minimum lease payments made under finance leases are apportioned between the finance expense and the reduction of the outstanding liability. The finance expense is allocated to each period during the lease term so as to produce a constant periodic rate of interest on the remaining balance of the liability.
Operating leases Other leases are operating leases, and the leased assets are not recognised on the Group’s balance sheet.
Payments made under operating leases are recognised in income statement on a straight-line basis over the term of the lease.
3.17 Equity
Share capital is determined using the nominal value of shares that have been issued. Incremental costs directly attributable to the issue of ordinary shares and stock options are recognised as a deduction from equity, net of any tax effects.
Additional paid-in capital includes any premium received on the initial issue of share capital. Any transaction costs associated with the issue of shares is deducted from additional paid-in capital, net of any related income tax benefits.
Foreign currency translation differences are included in the currency translation reserve.
Retained earnings include all current and prior period results, as disclosed in the income statement.
3.18 Employee Benefits
Defined contribution plan
A defined contribution plan is a post-employment benefit plan under which an entity pays fixed contributions into a separate entity and will have no legal or constructive obligation to pay further amounts. Obligations for contributions to recognised provident funds, approved superannuation schemes and other social securities which are defined contribution plans are recognised as an employee benefit expense in income statement when they are incurred.
Defined benefit plans
A defined benefit plan is a post-employment benefit plan other than a defined contribution plan. The Group’s net obligation in respect of an approved gratuity plan, which is a defined benefit plan, and certain other defined benefit plans is calculated separately for each plan by estimating the amount of future benefit that employees have earned in return for their service in the current and prior periods; that benefit is discounted to determine its present value. Any unrecognised past service costs and the fair value of any plan assets are deducted. The discount rate is the yield at the reporting date on risk free government bonds that have maturity dates approximating the terms of the Group’s obligations and that are denominated in the same currency in which the benefits are expected to be paid. The calculation is performed periodically by a qualified actuary using the projected unit credit method. When the calculation results in a benefit to the Group, the recognised asset is limited to the net total of any unrecognised past service costs and the present value of any future refunds from the plan or reductions in future contributions to the plan.
When the benefits of a plan are improved, the portion of the increased benefit relating to past service by employees is recognised in income statement on a straight-line basis over the average period until the benefits become vested. To the extent that the benefits vest immediately, the expense is recognised immediately in income statement. Actuarial gains and losses are recognised as an expense directly in income statement.
Termination benefits
Termination benefits are recognised as an expense when the Group is demonstrably committed, without realistic possibility of withdrawal, to a formal detailed plan to either terminate employment before the normal retirement date, or to provide termination benefits as a result of an offer made to encourage voluntary redundancy. Termination benefits for voluntary redundancies are recognised as an expense if the Group has made an offer encouraging voluntary redundancy, it is probable that the offer will be accepted and the number of acceptances can be estimated reliably.
Notes to Consolidated Financial Statements(All amounts in millions of Indian Rupees, unless otherwise stated)
88 Glenmark Pharmaceuticals Limited
Short-term benefits Short-term benefit obligations are measured on an undiscounted basis and are expensed as the related service
is provided. A liability is recognised for the amount expected to be paid under short-term cash bonus or profit-sharing plans
if the Group has a present legal or constructive obligation to pay this amount as a result of past service provided by the employee and the obligation can be estimated reliably.
Compensated accumulated absence Eligible employees are entitled to accumulate compensated absences up to prescribed limits in accordance with
the Group’s policy and receive cash in lieu thereof. The Group measures the expected cost of accumulating compensated absences as the additional amount that the Group expects to pay as a result of the unused entitlement that has accumulated at the date of Statement of Financial Position. Such measurement is based on actuarial valuation as at the date of Statement of Financial Position carried out by a qualified actuary.
3.19 Provisions, Contingent Liabilities and Contingent Assets Provisions are recognised when present obligations as a result of past events will probably lead to an outflow
of economic resources from the Group and they can be estimated reliably. Timing or amount of the outflow may still be uncertain. A present obligation arises from the presence of a legal or constructive obligation that has resulted from past events.
Provisions are measured at the estimated expenditure required to settle the present obligation, based on the most reliable evidence available at the date of Statement of Financial Position, including the risks and uncertainties associated with the present obligation.
In those cases where the possible outflow of economic resource as a result of present obligations is considered improbable or remote, or the amount to be provided for cannot be measured reliably, no liability is recognised in the consolidated Statement of Financial Position.
Any reimbursement that the Group can be virtually certain to collect from a third party with respect to the obligation is recognised as a separate asset. However, this asset may not exceed the amount of the related provisions. All provisions are reviewed at each reporting date and adjusted to reflect the current best estimate.
Possible inflows of economic benefits to the Group that do not yet meet the recognition criteria of an asset are considered contingent assets.
3.20 Share Based Compensation All employee services received in exchange for the grant of any share-based compensation are measured at
their fair values. These are indirectly determined by reference to the fair value of the share options awarded. Their value is appraised at the grant date and excludes the impact of any non-market vesting conditions (for example, profitability and sales growth targets).
All share-based compensation is ultimately recognised as an expense in income statement with a corresponding credit to additional paid-in capital, net of deferred tax where applicable. If vesting periods or other vesting conditions apply, the expense is allocated over the vesting period, based on the best available estimate of the number of share options expected to vest. Non-market vesting conditions are included in assumptions about the number of options that are expected to become exercisable. Estimates are subsequently revised, if there is any indication that the number of share options expected to vest differs from previous estimates.
No adjustment is made to expense recognised in prior periods if fewer share options ultimately are exercised than originally estimated. Upon exercise of share options, the proceeds received net of any directly attributable transaction costs up to the nominal value of the shares issued are allocated to share capital with any excess being recorded as additional paid-in capital.
4. Significant Management Judgement in applying Accounting Policies and Estimation of Uncertainty
When preparing the financial statements, management undertakes a number of judgements, estimates and assumptions about the recognition and measurement of assets, liabilities, income and expenses.
In the process of applying the Group’s accounting policies, the following judgements have been made apart from those involving estimations, which have the most significant effect on the amounts recognised in the financial information. Judgements are based on the information available at the date of Statement of Financial Position.
Leases The Group has evaluated each lease agreement for its classification between finance lease and operating lease. The
Group has reached its decisions on the basis of the principles laid down in IAS 17, “Leases” for the said classification.The Group has also used IFRIC 4, “Determining whether an arrangement contains a lease” for determining whether an arrangement is, or contains, a lease is based on the substance of the arrangement and based on the assessment whether:
a) fulfillment of the arrangement is dependent on the use of a specific asset or assets (the asset); and b) the arrangement conveys a right to use the asset. Deferred Tax Management judgement is required in determining provisions for income taxes, deferred tax assets and liabilities
and the extent to which deferred tax assets can be recognised. If the final outcome of these matters differs from the amounts initially recorded, differences will impact the income tax and deferred tax provisions in the period in which such determination is made.
Notes to Consolidated Financial Statements(All amounts in millions of Indian Rupees, unless otherwise stated)

89Annual Report 2011 - 2012
Research and developments costs Management monitors progress of internal research and development projects by using a project management
system. Significant judgement is required in distinguishing research from the development phase. Development costs are recognised as an asset when all the criteria are met, whereas research costs are expensed as incurred.
Management also monitors whether the recognition requirements for development costs continue to be met. This is necessary due to inherent uncertainty in the economic success of any product development.
Sales returns, rebates and charge back provisions Provisions for chargeback, rebates, discounts and medicaid payments are estimated and provided for in the year of
sales and recorded as reduction to revenue. A chargeback claim is a claim made by the wholesaler for the difference between the price at which the product is initially invoiced to the wholesaler and the net price at which it is agreed to be procured from the Company. Provisions for such chargebacks are accrued and estimated based on historical average chargeback rate actually claimed over a period of time, current contract prices with wholesalers/other customers and estimated inventory holding by the wholesaler. The Company accounts for sales returns a based on the levels of inventory in the distribution channel, estimated shelf life, product discontinuances, price changes of competitive products, and the introduction of competitive new products.
4.1 Estimation Uncertainty The preparation of these consolidated financial statements is in conformity with IFRS and requires the application
of judgement by management in selecting appropriate assumptions for calculating financial estimates, which inherently contain some degree of uncertainty. Management estimates are based on historical experience and various other assumptions that are believed to be reasonable in the circumstances, the results of which form the basis for making judgements about the reported carrying values of assets and liabilities and the reported amounts of revenues and expenses that may not be readily apparent from other sources. Actual results may differ from these estimates under different assumptions or conditions.
Estimates of life of various tangible and intangible assets and assumptions used in the determination of employee-related obligations and fair valuation of financial and equity instrument, impairment of tangible and intangible assets represent certain of the significant judgements and estimates made by management.
Useful lives of various assets Management reviews the useful lives of depreciable assets at each reporting date, based on the expected utility
of the assets to the Group. The carrying amounts are analysed in Notes 3.7 and 3.9. Actual results, however, may vary due to technical obsolescence, particularly relating to internally generated intangibles and software.
Post-employment benefits The cost of post-employment benefits is determined using actuarial valuations. The actuarial valuation involves
making assumptions about discount rates, expected rate of return on assets, future salary increases and mortality rates. Due to the long-term nature of these plans such estimates are subject to significant uncertainty.
Fair value of financial instruments Management uses valuation techniques in measuring the fair value of financial instruments where active market
quotes are not available. Details of the assumptions used are given in the notes regarding financial assets and liabilities. In applying the valuation techniques, management makes maximum use of market inputs and uses estimates and assumptions that are, as far as possible, consistent with observable data that market participants would use in pricing the instrument. Where applicable data is not observable, management uses its best estimate about the assumptions that market participants would make. These estimates may vary from the actual prices that would be achieved in an arm’s length transaction at the reporting date.
Impairment An impairment loss is recognised for the amount by which an asset’s or cash-generating unit’s carrying amount
exceeds its recoverable amount. To determine the recoverable amount, management estimates expected future cash flows from each asset or cash-generating unit and determines a suitable interest rate in order to calculate the present value of those cash flows. In the process of measuring expected future cash flows, management makes assumptions about future operating results. These assumptions relate to future events and circumstances. The actual results may vary, and may cause significant adjustments to the Group’s assets.
In most cases, determining the applicable discount rate involves estimating the appropriate adjustment to market risk and the appropriate adjustment to asset-specific risk factors.
5. Standards and Interpretations not yet applied
The following new Standards and Interpretations have not been applied in Glenmark’s consolidated financial statements for the year ended 31 March 2012.
Standard or Interpretation Effective dateIFRS 9: Financial Instruments – Recognition and Measurement 1 January 2015IFRS 10: Consolidated Financial Statements 1 January 2013IFRS 11: Joint Arrangements 1 January 2013IFRS 12: Disclosure of Interests in Other Entities 1 January 2013IFRS 13: Fair Value Measurements 1 January 2013Amendments to IAS 1 1 July 2012Amendments to IAS 19 1 January 2013
Notes to Consolidated Financial Statements(All amounts in millions of Indian Rupees, unless otherwise stated)

90 Glenmark Pharmaceuticals Limited
IFRS 9: Financial Instruments – Recognition and Measurement
The IASB aims to replace IAS 39 Financial Instruments - Recognition and Measurement in its entirety by the end of 2011, with the replacement standard to be effective for annual periods beginning 1 January 2015. IFRS 9 is the first part of Phase 1 of this project. The main phases are:
Phase 1: Classification and Measurement
Phase 2: Impairment methodology
Phase 3: Hedge accounting
In addition, a separate project is dealing with de-recognition. Management is yet to assess the impact that this amendment is likely to have on the financial statements of the Group. However, they do not expect to implement the amendments until all chapters of the IAS 39 replacement have been published and they can comprehensively assess the impact of all changes.
IFRS 2: Group Cash Settled Share Based Transactions (Amendments to IFRS 2)
The Group does not currently have any cash settled transactions and the Management does not expect material impact on Glenmark’s Group Financial Statements when the interpretation becomes effective.
IFRS 10 Consolidated Financial Statements
IFRS 10 supersedes IAS 27 Consolidated and Separate Financial Statements (IAS 27) and SIC 12 Consolidation – Special Purpose Entities. It revised the definition of control together with accompanying guidance to identify an interest in a subsidiary. However, the requirements and mechanics of consolidation and the accounting for any non-controlling interests and changes in control remain the same.
IFRS 11 Joint Arrangements
IFRS 11 supersedes IAS 31 Interests in Joint Ventures. It aligns more closely the accounting by the investors with their rights and obligations relating to the joint arrangement. In addition, IAS 31’s option of using proportionate consolidation for joint ventures has been eliminated. IFRS 11 now requires the use of the equity accounting method, which is currently used for investments in associates.
IFRS 12 Disclosure of Interests in Other Entities
IFRS 12 integrates and makes consistent the disclosure requirements for various types of investments, including unconsolidated structured entities. It introduces new disclosure requirements about the risks to which an entity is exposed from its involvement with structured entities.
Consequential amendments to IAS 27 and IAS 28 Investments in Associates and Joint Ventures (IAS 28)
IAS 27 now only deals with separate financial statements. IAS 28 brings investments in joint ventures into its scope. However, IAS 28’s equity accounting methodology remains unchanged.
IFRS 13 Fair Value Measurement
IFRS 13 does not affect which items are required to be fair-valued, but clarifies the definition of fair value and provides related guidance and enhanced disclosures about fair value measurements. It is applicable for annual periods beginning on or after 1 January 2013. The Group’s management have yet to assess the impact of this new standard on the Group’s consolidated financial statements.
Amendments to IAS 1 Presentation of Financial Statements
The IAS 1 Amendments require an entity to group items presented in other comprehensive income into those that, in accordance with other IFRSs: (a) will not be reclassified subsequently to profit or loss and (b) will be reclassified subsequently to profit or loss when specific conditions are met. It is applicable for annual periods beginning on or after 1 July 2012. The Group’s management expects this will change the current presentation of items in other comprehensive income; however, it will not affect the measurement or recognition of such items.
Amendments to IAS 19 Employee Benefits
The IAS 19 Amendments include a number of targeted improvements throughout the Standard. The main changes relate to defined benefit plans. They:
• eliminate the ‘corridor method’, requiring entities to recognise all actuarial gains and losses arising in the reporting period
• streamline the presentation of changes in plan assets and liabilities
• enhance the disclosure requirements, including information about the characteristics of defined benefit plans and the risks that entities are exposed to through participation in them.
The amended version of IAS 19 is effective for financial years beginning on or after 1 January 2013. The Group’s management have yet to assess the impact of this revised standard on the Group’s consolidated financial statements.
Notes to Consolidated Financial Statements(All amounts in millions of Indian Rupees, unless otherwise stated)

91Annual Report 2011 - 2012
NOTE B - BASIS OF CONSOLIDATION
The subsidiaries which consolidate under Glenmark Pharmaceuticals Limited (‘GPL’) comprise the entities listed below:
Name of the Entity Year end DateCountry of
IncorporationHolding
Company
Effective Group
Shareholding (%)
Glenmark Pharmaceuticals Europe Ltd. 31 March 2012 United Kingdom GHSA 100%Glenmark Generics (Europe) Ltd. 31 March 2012 United Kingdom GGL 100%Glenmark Pharmaceuticals S.R.O. (GP S.R.O.) 31 March 2012 Czech Republic GHSA 100%Glenmark Pharmaceuticals SK, S.R.O. 31 March 2012 Slovak Republic GP S.R.O. 100%Glenmark Pharmaceuticals S. A. 31 March 2012 Switzerland GHSA 100%Glenmark Holding S. A., (GHSA) 31 March 2012 Switzerland GPL 100%Glenmark Generics Holding S. A. (GGHSA) 31 March 2012 Switzerland GGFSA 100%Glenmark Generics Finance S. A. (GGFSA) 31 March 2012 Switzerland GGL 100%Glenmark Pharmaceuticals S.R.L. 31 March 2012 Romania GHSA 100%Glenmark Pharmaceuticals Eood 31 March 2012 Bulgaria GHSA 100%Glenmark Distributors SP z.o.o. 31 March 2012 Poland GHSA 100%Glenmark Pharmaceuticals SP z.o.o. 31 March 2012 Poland GHSA 100%Glenmark Generics Inc. 31 March 2012 USA GGHSA 100%Glenmark Therapeutics Inc. 31 March 2012 USA GHSA 100%Glenmark Farmaceutica Ltda 31 March 2012 Brazil GHSA 100%Glenmark Generics SA 31 March 2012 Argentina GGHSA 100%Glenmark Pharmaceuticals Mexico, S.A. DE C.V. 31 March 2012 Mexico GU S.A. 100%Glenmark Pharmaceuticals Peru SAC 31 March 2012 Peru GU S.A. 100%Glenmark Pharmaceuticals Colombia Ltda 31 March 2012 Colombia GU S.A. 100%Glenmark Uruguay S.A. (GU S.A.) 31 March 2012 Uruguay GHSA 100%Glenmark Pharmaceuticals Venezuela, C.A. 31 March 2012 Venezuela GU S.A. 100%Glenmark Dominicana SRL 31 March 2012 Dominican Republic GPL 100%Glenmark Pharmaceuticals Egypt S.A.E. 31 March 2012 Egypt GPL 100%Glenmark Pharmaceuticals FZE 31 March 2012 United Arab Emirates GPL 100%Glenmark Impex L.L.C 31 March 2012 Russia GPL 100%Glenmark Philippines Inc. 31 March 2012 Philippines GPL 100%Glenmark Pharmaceuticals (Nigeria) Ltd. 31 March 2012 Nigeria GPL 100%Glenmark Pharmaceuticals Malaysia Sdn Bhd 31 March 2012 Malaysia GPL 100%Glenmark Pharmaceuticals (Australia) Pty. Ltd. 31 March 2012 Australia GPL 100%Glenmark South Africa (pty) Ltd (GSAPL) 31 March 2012 South Africa GHSA 100%Glenmark Pharmaceuticals South Africa (pty) Ltd. 31 March 2012 South Africa GSAPL 100%Glenmark Pharmaceuticals (Thailand) Co. Ltd. 31 March 2012 Thailand GPL 49%Glenmark Access Ltd. (Formerly Glenmark Exports Ltd.) 31 March 2012 India GPL 100%Glenmark Generics Ltd. (GGL) 31 March 2012 India GPL 97.95%Glenmark Generics B.V. 31 March 2012 Netherlands GGHSA 100%Glenmark Arzneimittel Gmbh 31 March 2012 Germany GGHSA 100%Glenmark Generics Canada, Inc. 31 March 2012 Canada GGHSA 100%
Notes to Consolidated Financial Statements(All amounts in millions of Indian Rupees, unless otherwise stated)

92 Glenmark Pharmaceuticals Limited
NOTE C - CASH AND CASH EQUIVALENTSCash and cash equivalents comprise the following:Particulars As at
31 March 2012As at
31 March 2011Cash in hand 5.58 4.82 Balances with banks in current /cash credit accounts and deposit accounts 3,195.18 1,943.90
TOTAL 3,200.76 1,948.72
NOTE D - RESTRICTED CASHRestricted cash comprise the following:Particulars As at
31 March 2012As at
31 March 2011CurrentDividend accounts 3.68 3.66 Time deposits 14.77 5.92
TOTAL 18.45 9.58 Non-currentTime deposits 34.25 27.96
TOTAL 34.25 27.96
Dividend accounts represent balances maintained in specific bank accounts for payment of dividends. The use of these funds is restricted and can only be used to pay dividends. The corresponding liability for payment of dividends is included in ‘Other Current Liabilities’. Time deposits represent fixed deposits placed with banks and deposits under lien for bank guarantees and margin deposits. Most of these deposits have been placed for a one-year period, and are automatically renewed.
NOTE E - ACCOUNTS RECEIVABLE, NETParticulars As at
31 March 2012As at
31 March 2011Accounts receivables 12,711.79 11,695.63 Provision for doubtful debts (275.72) (387.49)
TOTAL 12,436.07 11,308.14
Trade receivables are usually due within 60-180 days. Generally and by practise most customers enjoy a credit period of approximately 180 days and are not interest bearing. All trade receivables are subject to credit risk exposure. However, the Group does not identify specific concentrations of credit risk with regard to trade and other receivables, as the amounts recognised represent a large number of receivables from various customers.Given below is ageing of accounts receivable spread by period of six months:Particulars As at
31 March 2012As at
31 March 2011Outstanding for more than 6 months 1,466.93 3,094.39 Others 10,969.14 8,213.75
TOTAL 12,436.07 11,308.14
The trade receivables have been recorded at their respective carrying amounts and are not considered to be materially different from their fair values as these are expected to realise within a short period from the date of statement of financial position. All of the Group’s trade receivables have been reviewed for indicators of impairment. Certain trade receivables were found to be impaired and an allowance for credit losses of ` 13.35 (P.Y. ` 152.56) has been recorded. The movement in the allowance for credit losses can be reconciled as follows:Particulars As at
31 March 2012As at
31 March 2011Opening balance 387.49 234.93 Amounts written off (125.12) - Impairment loss 13.35 152.56 Impairment loss reversed - - Closing balance 275.72 387.49
Notes to Consolidated Financial Statements(All amounts in millions of Indian Rupees, unless otherwise stated)

93Annual Report 2011 - 2012
NOTE F - INVENTORIESInventories comprise the following:Particulars As at
31 March 2012As at
31 March 2011Raw materials 1,917.30 1,837.33 Packing material 626.77 502.74 Work-in-progress 1,236.16 1,345.01 Stores and spares 71.03 71.29 Finished goods 4,025.44 4,313.75
TOTAL 7,876.70 8,070.12 No reversal of previous write-downs was recognised as a reduction of expense in the year ended 31 March 2012. Inventories at certain locations are pledged as securities for borrowings used for financing the working capital requirements.
NOTE G - OTHER CURRENT ASSETSOther current assets comprise the following:Particulars As at
31 March 2012As at
31 March 2011Input taxes receivables 661.83 822.05 Advance to vendors 1,266.48 406.96 Short term deposits 109.13 109.00 Other receivables 88.69 605.16 Deposits and advances receivable in cash and kind 3,245.35 2,029.48
TOTAL 5,371.48 3,972.65
Notes to Consolidated Financial Statements(All amounts in millions of Indian Rupees, unless otherwise stated)
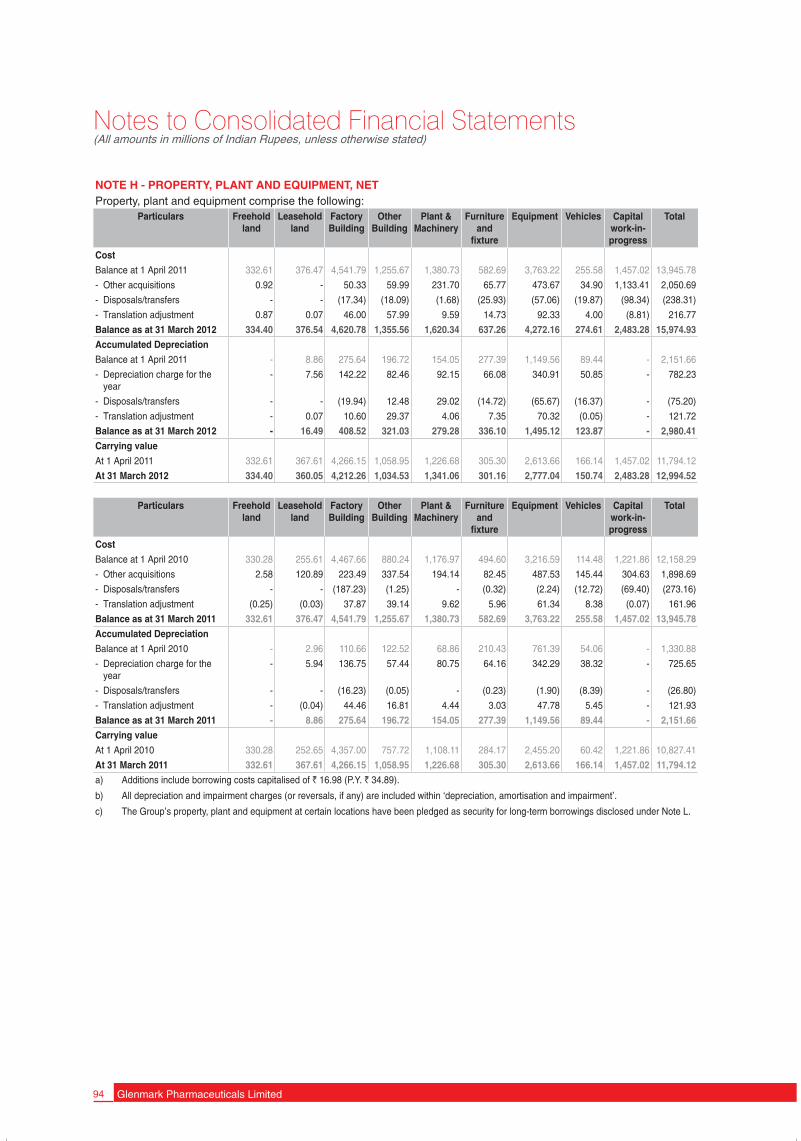
94 Glenmark Pharmaceuticals Limited
NOTE H - PROPERTY, PLANT AND EQUIPMENT, NETProperty, plant and equipment comprise the following:
Particulars Freehold land
Leasehold land
Factory Building
Other Building
Plant & Machinery
Furniture and
fixture
Equipment Vehicles Capital work-in- progress
Total
Cost
Balance at 1 April 2011 332.61 376.47 4,541.79 1,255.67 1,380.73 582.69 3,763.22 255.58 1,457.02 13,945.78
- Other acquisitions 0.92 - 50.33 59.99 231.70 65.77 473.67 34.90 1,133.41 2,050.69
- Disposals/transfers - - (17.34) (18.09) (1.68) (25.93) (57.06) (19.87) (98.34) (238.31)
- Translation adjustment 0.87 0.07 46.00 57.99 9.59 14.73 92.33 4.00 (8.81) 216.77
Balance as at 31 March 2012 334.40 376.54 4,620.78 1,355.56 1,620.34 637.26 4,272.16 274.61 2,483.28 15,974.93
Accumulated Depreciation
Balance at 1 April 2011 - 8.86 275.64 196.72 154.05 277.39 1,149.56 89.44 - 2,151.66
- Depreciation charge for the year
- 7.56 142.22 82.46 92.15 66.08 340.91 50.85 - 782.23
- Disposals/transfers - - (19.94) 12.48 29.02 (14.72) (65.67) (16.37) - (75.20)
- Translation adjustment - 0.07 10.60 29.37 4.06 7.35 70.32 (0.05) - 121.72
Balance as at 31 March 2012 - 16.49 408.52 321.03 279.28 336.10 1,495.12 123.87 - 2,980.41
Carrying value
At 1 April 2011 332.61 367.61 4,266.15 1,058.95 1,226.68 305.30 2,613.66 166.14 1,457.02 11,794.12
At 31 March 2012 334.40 360.05 4,212.26 1,034.53 1,341.06 301.16 2,777.04 150.74 2,483.28 12,994.52
Particulars Freehold land
Leasehold land
Factory Building
Other Building
Plant & Machinery
Furniture and
fixture
Equipment Vehicles Capital work-in- progress
Total
Cost
Balance at 1 April 2010 330.28 255.61 4,467.66 880.24 1,176.97 494.60 3,216.59 114.48 1,221.86 12,158.29
- Other acquisitions 2.58 120.89 223.49 337.54 194.14 82.45 487.53 145.44 304.63 1,898.69
- Disposals/transfers - - (187.23) (1.25) - (0.32) (2.24) (12.72) (69.40) (273.16)
- Translation adjustment (0.25) (0.03) 37.87 39.14 9.62 5.96 61.34 8.38 (0.07) 161.96
Balance as at 31 March 2011 332.61 376.47 4,541.79 1,255.67 1,380.73 582.69 3,763.22 255.58 1,457.02 13,945.78
Accumulated Depreciation
Balance at 1 April 2010 - 2.96 110.66 122.52 68.86 210.43 761.39 54.06 - 1,330.88
- Depreciation charge for the year
- 5.94 136.75 57.44 80.75 64.16 342.29 38.32 - 725.65
- Disposals/transfers - - (16.23) (0.05) - (0.23) (1.90) (8.39) - (26.80)
- Translation adjustment - (0.04) 44.46 16.81 4.44 3.03 47.78 5.45 - 121.93
Balance as at 31 March 2011 - 8.86 275.64 196.72 154.05 277.39 1,149.56 89.44 - 2,151.66
Carrying value
At 1 April 2010 330.28 252.65 4,357.00 757.72 1,108.11 284.17 2,455.20 60.42 1,221.86 10,827.41
At 31 March 2011 332.61 367.61 4,266.15 1,058.95 1,226.68 305.30 2,613.66 166.14 1,457.02 11,794.12
a) Additions include borrowing costs capitalised of ` 16.98 (P.Y. ` 34.89).
b) All depreciation and impairment charges (or reversals, if any) are included within ‘depreciation, amortisation and impairment’.
c) The Group’s property, plant and equipment at certain locations have been pledged as security for long-term borrowings disclosed under Note L.
Notes to Consolidated Financial Statements(All amounts in millions of Indian Rupees, unless otherwise stated)
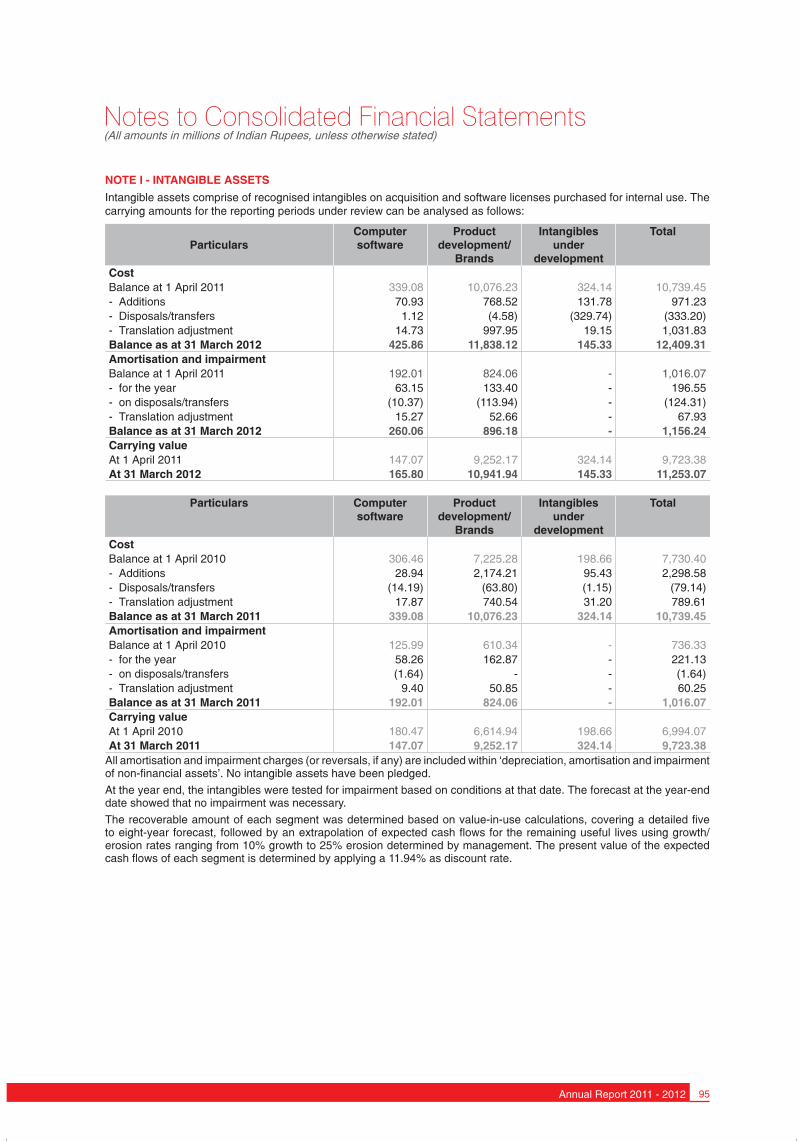
95Annual Report 2011 - 2012
NOTE I - INTANGIBLE ASSETS
Intangible assets comprise of recognised intangibles on acquisition and software licenses purchased for internal use. The carrying amounts for the reporting periods under review can be analysed as follows:
ParticularsComputer software
Product development/
Brands
Intangibles under
development
Total
CostBalance at 1 April 2011 339.08 10,076.23 324.14 10,739.45 - Additions 70.93 768.52 131.78 971.23 - Disposals/transfers 1.12 (4.58) (329.74) (333.20)- Translation adjustment 14.73 997.95 19.15 1,031.83 Balance as at 31 March 2012 425.86 11,838.12 145.33 12,409.31 Amortisation and impairmentBalance at 1 April 2011 192.01 824.06 - 1,016.07 - for the year 63.15 133.40 - 196.55 - on disposals/transfers (10.37) (113.94) - (124.31)- Translation adjustment 15.27 52.66 - 67.93 Balance as at 31 March 2012 260.06 896.18 - 1,156.24 Carrying valueAt 1 April 2011 147.07 9,252.17 324.14 9,723.38 At 31 March 2012 165.80 10,941.94 145.33 11,253.07
Particulars Computer software
Product development/
Brands
Intangibles under
development
Total
CostBalance at 1 April 2010 306.46 7,225.28 198.66 7,730.40 - Additions 28.94 2,174.21 95.43 2,298.58 - Disposals/transfers (14.19) (63.80) (1.15) (79.14)- Translation adjustment 17.87 740.54 31.20 789.61 Balance as at 31 March 2011 339.08 10,076.23 324.14 10,739.45 Amortisation and impairmentBalance at 1 April 2010 125.99 610.34 - 736.33 - for the year 58.26 162.87 - 221.13 - on disposals/transfers (1.64) - - (1.64)- Translation adjustment 9.40 50.85 - 60.25 Balance as at 31 March 2011 192.01 824.06 - 1,016.07 Carrying valueAt 1 April 2010 180.47 6,614.94 198.66 6,994.07 At 31 March 2011 147.07 9,252.17 324.14 9,723.38
All amortisation and impairment charges (or reversals, if any) are included within ‘depreciation, amortisation and impairment of non-financial assets’. No intangible assets have been pledged.
At the year end, the intangibles were tested for impairment based on conditions at that date. The forecast at the year-end date showed that no impairment was necessary.
The recoverable amount of each segment was determined based on value-in-use calculations, covering a detailed five to eight-year forecast, followed by an extrapolation of expected cash flows for the remaining useful lives using growth/ erosion rates ranging from 10% growth to 25% erosion determined by management. The present value of the expected cash flows of each segment is determined by applying a 11.94% as discount rate.
Notes to Consolidated Financial Statements(All amounts in millions of Indian Rupees, unless otherwise stated)

96 Glenmark Pharmaceuticals Limited
NOTE J - GOODWILLThe net carrying amount of goodwill can be analysed as follows:Particulars As at
31 March 2012As at
31 March 2011Gross carrying amountOpening balance 605.70 660.57 Acquired through business combination - - Impairment loss recognised - - Net exchange difference 2.94 (54.87)
TOTAL 608.64 605.70 Impairment testingFor the purpose of annual impairment testing, goodwill is allocated to the operating segments expected to benefit from the synergies of the business combinations in which the goodwill arises, as follows:Particulars As at
31 March 2012As at
31 March 2011Europe & ROW 523.89 521.36Latin America 84.75 84.34
TOTAL 608.64 605.70 At the year end, the Goodwill was tested for impairment based on conditions at that date. The forecast at the year-end date showed that no impairment was necessary. The recoverable amount of each segment was determined based on value-in-use calculations, covering a detailed five-year forecast, followed by an extrapolation of expected cash flows for the remaining useful lives using growth rates determined by management. The present value of the expected cash flows of each segment is determined by applying a suitable discount rate.
Growth Rates Discount RatesParticulars 31 March 2012 31 March 2011 31 March 2012 31 March 2011Europe & ROW 15% 15% 5.50% 5.50%Latin America 15% 15% 5.50% 5.50%
Growth rates
The growth rates reflect the long-term average growth rates for the product lines and industries of the segments. The growth rate is in line with the overall long-term average growth rates because this sector is expected to continue to grow at above average rates for the foreseeable future.
Discount rates
The discount rates reflect appropriate adjustments relating to market risk and specific risk factors of each segment.
Cash flow assumptions
Management’s key assumptions include stable profit margins, based on past experience in this market. The Management believes that this is the best available input for forecasting.
Apart from the considerations in determining the value-in-use of the segments, management is not currently aware of any other probable changes that would necessitate changes in its key estimates. However, the estimates of recoverable amount are particularly sensitive to the discount rate. If the discount rate used is increased by 1%, it would have no impact on the impairment testing.
Notes to Consolidated Financial Statements(All amounts in millions of Indian Rupees, unless otherwise stated)
Growth/erosion ratesThe growth rates reflect the long-term average growth rates for the product lines and industries of the segments. The growth rate is in line with the overall long-term average growth rates because this sector is expected to continue to grow at above average rates for the foreseeable future.
Discount ratesThe discount rates reflect appropriate adjustments relating to market risk and specific risk factors of each segment.
Cash flow assumptionsManagement’s key assumptions include stable profit margins, based on past experience in this market. The Management believes that this is the best available input for forecasting.
Apart from the considerations in determining the value-in-use of the segments, management is not currently aware of any other probable changes that would necessitate changes in its key estimates. However, the estimates of recoverable amount for are particularly sensitive to the discount rate. If the discount rate used is increased by 1%, it would have no impact on the impairment testing.

97Annual Report 2011 - 2012
NOTE K - OTHER LIABILITIES AND PROVISIONS
Non current - Other liabilityParticulars As at
31 March 2012As at
31 March 2011Income received in advance 743.89 - Security deposit 35.93 31.83
TOTAL 779.82 31.83
Current
Other liabilities comprise the following:Particulars As at
31 March 2012As at
31 March 2011Statutory dues 179.02 147.24 Employee dues 130.64 117.34 Accrued expenses 509.10 365.63 Other liabilities 623.49 286.01 Unclaimed dividend 3.68 3.66
TOTAL 1,445.93 919.88
Other provisions comprise the following:Particulars As at
31 March 2012As at
31 March 2011Provision for compensated absences 72.44 45.14 Provision for gratuity benefit plan 33.82 26.86 Others - 44.24
TOTAL 106.26 116.24
NOTE L - LONG-TERM BORROWINGS/SHORT-TERM BORROWINGSNon-current portion of borrowingsParticulars As at
31 March 2012As at
31 March 2011Notes payable 1.70 3.24Term loan from banks 15,568.74 6,279.12Total Long-term liabilities 15,570.44 6,282.36 Less Current portion of borrowings (2,445.74) (111.70)
TOTAL 13,124.70 6,170.66 Term loans are secured by way of exclusive charge, as the case may be, at certain locations, on Group’s fixed assets both present and future.Maturity profile of long-term borrowingsYear ending 31 March 2013 2,445.74 2014 3,834.90 2015 2,067.08 2016 and thereafter 7,222.72
TOTAL 15,570.44 The fair value of long-term debt is estimated by the management to be approximate to their carrying value, since the average interest rate on such debt is within the range of current interest rates prevailing in the market.
Short-term borrowingsParticulars As at
31 March 2012As at
31 March 2011Short-term borrowings 6,874.57 13,548.78Sale of receivables - 1,250.00Notes payable - 3.48
TOTAL 6,874.57 14,802.26
Working Capital Facilities is secured by hypothecation of stocks of raw materials, packing materials, finished goods,work-in-progress, receivables and equitable mortgage on fixed assets of certain locations.
Notes to Consolidated Financial Statements(All amounts in millions of Indian Rupees, unless otherwise stated)

98 Glenmark Pharmaceuticals Limited
NOTE N - TAXESTaxes for the year comprise the following:Particulars 2011-2012 2010-2011Current income tax expense 1,345.91 504.75 Deferred income tax benefit (1,108.07) (267.72)
TOTAL 237.84 237.03
The relationship between the expected tax expense based on the applicable tax rate of the Group and the tax expense actually recognised in the income statement can be reconciled as follows:Particulars 2011-2012 2010-2011Expected tax expense at prevailing tax rate 1,583.61 1,599.61 Tax adjustment for tax-exempt income- Income exempt from tax (757.05) (1,320.66)Other tax adjustments- Additional deduction for R & D Expenditure (323.90) (95.60)- Unrecognised tax benefit on losses of subsidiaries (140.35) 285.54 - Disallowance under income tax 1.65 98.56 - Tax Effect of Non-allowable expenses (0.66) - - Disallowed expenditure on share based payments - 16.94 - Taxes for previous periods (59.31) (140.58)- Impact on account of rate change on deferred tax for future years 12.65 (40.80)- Impact of tax rate difference in subsidiaries (194.98) (165.52)- Others 116.18 (0.46)Actual tax expense net 237.84 237.03
No temporary differences resulting from investments in subsidiaries or associates qualified for recognition as deferred tax assets or liabilities. The tax effect of significant temporary differences that resulted in deferred income tax assets and liabilities and a description of the items that create those differences are given below:Particulars As at
31 March 2012As at
31 March 2011Deferred income tax assets - Non-currentProvision for credit losses 73.04 72.59Unused tax losses 2,364.87 1,358.05Minimum Alternative Tax Credit entitlement 1,586.29 1,057.19Other financial assets 148.63 58.41Employee Benefits 1.37 11.42
TOTAL 4,174.20 2,557.66Deferred income tax liabilities - Non-currentOther current assets 43.36 25.14Difference in depreciation on Property, Plant and Equipment 1,456.92 1,451.16
TOTAL 1,500.28 1,476.30Net deferred income tax asset 2,673.92 1,081.36
In assessing the reliability of deferred income tax assets, management considers whether it is more likely than not that some portion or all of the deferred income tax assets will be realised. The ultimate realisation of deferred income tax assets is dependent upon the generation of future taxable income during the periods in which the temporary differences become deductible. The amount of the deferred income tax assets considered realisable, however, could be reduced in the near term if estimates of future taxable income during the carry forward period are reduced.
NOTE O - EQUITY AND RESERVES
a) Ordinary shares
The Company presently has only one class of ordinary shares. For all matters submitted to vote in the shareholders meeting, every holder of ordinary shares, as reflected in the records of the Company on the date of the shareholders’
Notes to Consolidated Financial Statements(All amounts in millions of Indian Rupees, unless otherwise stated)
NOTE M - EMPLOYEE OBLIGATIONSEmployee obligations comprise the following:Particulars As at
31 March 2012As at
31 March 2011Provision for gratuity benefit plan 145.77 59.41 Others - 9.61
TOTAL 145.77 69.02

99Annual Report 2011 - 2012
meeting, has one vote in respect of each share held. All shares are equally eligible to receive dividends and the repayment of capital in the event of liquidation of the Company.
The Company has an authorised share capital of 350,000,000 equity shares of ` 1 each.b) Dividends Indian statutes mandate that dividends be declared out of distributable profits only after the transfer of up to 10
percent of net income computed in accordance with regulations to a general reserve. Should the Company declare and pay dividends, such dividends are required to be paid in INR to each holder of equity shares in proportion to the number of shares held.
The Company had declared dividend payout of ` 2/- per share. c) Reserves Additional paid-in capital – The amount received by the Company over and above the par value of shares issued
(share premium) is shown under this head. Statutory reserves – The Capital redemption reserve has been created as per the requirement of Section 80 of
Indian Companies Act, 1956. Such reserve is not currently available for distribution to the shareholders. Currency translation reserve – Assets and liabilities of foreign subsidiaries are translated into INR at the rate of
exchange prevailing as at date of Statement of Financial Position. Revenue and expenses are translated into INR by averaging the exchange rates prevailing during the period. The exchange difference arising out of the year-end translation is being debited or credited to Currency translation reserve account.
Accumulated earnings – Accumulated earnings include all current and prior period results as disclosed in the income statement.
Stock compensation reserve – Stock compensation reserve consists of employee compensation cost allocated over the vesting period of options granted to employees. Such cost is recognised in income statement and is credited to the reserve. Upon exercise of options, such reserves are reclassified to other components of equity.
NOTE P - OPERATING REVENUEOperating revenue comprises the following:Particulars Year ended
31 March 2012Year ended
31 March 2011Sale of goods and out licensing of intangible assets 40,188.55 29,473.98 Income from services 17.88 16.72
TOTAL 40,206.43 29,490.70
NOTE Q - OTHER INCOMEOther income comprises the following:Particulars Year ended
31 March 2012Year ended
31 March 2011Profit on sale of property, plant and equipment - 3.52 Exchange gain, others - 1,300.47 Lease rent - 2.20 Others 92.61 98.99
TOTAL 92.61 1,405.18
NOTE R - MATERIALS CONSUMEDMaterials consumed for the year comprise the following:Particulars Year ended
31 March 2012Year ended
31 March 2011Consumption of raw material and packing material 9,343.98 7,680.29 Consumption of stores and spares 544.00 407.59 Purchase of finished goods 3,168.83 2,387.70 (Increase)/Decrease in stock of finished goods 397.16 (557.26)
TOTAL 13,453.97 9,918.32
NOTE S - EMPLOYEE COSTSEmployee costs comprise the following:Particulars Year ended
31 March 2012Year ended
31 March 2011Salaries, wages and bonus 5,759.62 4,663.55Retirement benefits 65.19 73.34Contribution to provident and other funds 348.76 255.01Welfare expenses 115.38 109.75
TOTAL 6,288.95 5,101.65
Notes to Consolidated Financial Statements(All amounts in millions of Indian Rupees, unless otherwise stated)

100 Glenmark Pharmaceuticals Limited
NOTE T - EMPLOYEE POST- RETIREMENT BENEFITS
The following are the employee benefit plans applicable to the employees of the Group.
a) Defined benefit plan
In accordance with applicable laws, the Group provides for gratuity, a defined benefit retirement plan (“the Gratuity Plan”) covering eligible employees. The Gratuity Plan provides for a lump sum payment to vested employees on retirement, death, incapacitation or termination of employment of amounts that are based on salary and tenure of employment. Liabilities with regard to the Gratuity Plan are determined by actuarial valuation.
The following table sets out the funded status of the Gratuity Plan and the amounts recognised in the Group’s consolidated financial statements:
Particulars 2011-2012 2010-2011Change in Benefit ObligationPresent Benefit Obligation (‘PBO’) at the beginning of the year 343.69 291.53 Interest cost 20.91 13.99 Service cost 64.44 51.30 Unrecognised past service cost (8.95) - Benefits paid (0.21) (8.33)Actuarial (gain)/loss on obligations 52.87 (12.27)Translation adjustment 57.00 7.47 PBO at the end of the year 529.75 343.69 Change in Fair Value of AssetsOpening fair value of plan assets 257.42 224.79 Expected return on plan assets 17.62 11.69 Actuarial gain/(loss) (15.10) (4.62)Contributions by employer 71.28 33.89 Benefits paid (0.21) (8.33)Translation adjustment 19.15 - Closing fair value of Plan Assets 350.16 257.42 Actual Return on Plan AssetsExpected return on Plan Assets 17.62 11.69 Actuarial gain/(loss) on Plan Assets (15.10) (4.62)Actual Return on Plan Assets 2.52 7.07 Liability recognisedPresent value of obligation 529.75 343.69 Fair value of Plan Assets (350.16) (257.42)Liability recognised in the statement of financial position 179.59 86.27 Net gratuity cost for the year ended includes the following components:Particulars 2011-2012 2010-2011Current service cost 64.44 51.30 Interest cost 20.91 13.99 Expected return on plan assets (13.57) (11.69)Net actuarial (gain)/loss recognised in the year (6.84) (7.65)Expenses recognised in the income statement 64.94 45.95 The movement of the net liability can be reconciled as follows:Particulars 2011-2012 2010-2011Movements in the liability recognisedOpening net liability 86.27 66.74 Expense as above 64.94 45.95 Contribution paid (71.28) (33.89)Translation adjustment 99.66 7.47 Closing net liability 179.59 86.27 For determination of the liability, the following actuarial assumptions were used:Particulars 2011-2012 2010-2011Discount rate 2.25%-8.50% 3.75% - 8.30%Expected return on Plan Assets 2.50%-9.00% 2.50%-9.00%
Current service cost and interest cost are included in employee costs. The Group has availed the exemption under IFRS 1 for not presenting the experience adjustment on retirement benefits.
Notes to Consolidated Financial Statements(All amounts in millions of Indian Rupees, unless otherwise stated)
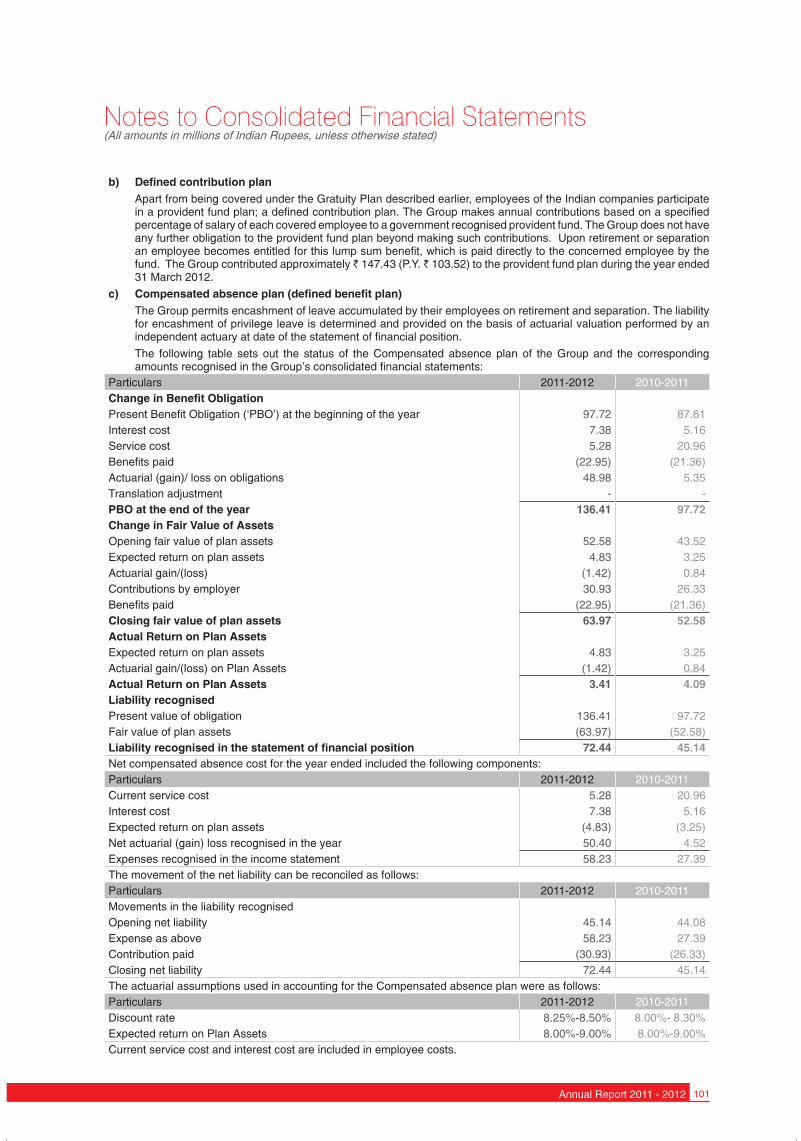
101Annual Report 2011 - 2012
b) Defined contribution plan Apart from being covered under the Gratuity Plan described earlier, employees of the Indian companies participate
in a provident fund plan; a defined contribution plan. The Group makes annual contributions based on a specified percentage of salary of each covered employee to a government recognised provident fund. The Group does not have any further obligation to the provident fund plan beyond making such contributions. Upon retirement or separation an employee becomes entitled for this lump sum benefit, which is paid directly to the concerned employee by the fund. The Group contributed approximately ̀ 147.43 (P.Y. ̀ 103.52) to the provident fund plan during the year ended 31 March 2012.
c) Compensated absence plan (defined benefit plan) The Group permits encashment of leave accumulated by their employees on retirement and separation. The liability
for encashment of privilege leave is determined and provided on the basis of actuarial valuation performed by an independent actuary at date of the statement of financial position.
The following table sets out the status of the Compensated absence plan of the Group and the corresponding amounts recognised in the Group’s consolidated financial statements:
Particulars 2011-2012 2010-2011Change in Benefit ObligationPresent Benefit Obligation (‘PBO’) at the beginning of the year 97.72 87.61 Interest cost 7.38 5.16 Service cost 5.28 20.96 Benefits paid (22.95) (21.36)Actuarial (gain)/ loss on obligations 48.98 5.35 Translation adjustment - - PBO at the end of the year 136.41 97.72 Change in Fair Value of AssetsOpening fair value of plan assets 52.58 43.52 Expected return on plan assets 4.83 3.25 Actuarial gain/(loss) (1.42) 0.84 Contributions by employer 30.93 26.33 Benefits paid (22.95) (21.36)Closing fair value of plan assets 63.97 52.58 Actual Return on Plan AssetsExpected return on plan assets 4.83 3.25 Actuarial gain/(loss) on Plan Assets (1.42) 0.84 Actual Return on Plan Assets 3.41 4.09 Liability recognisedPresent value of obligation 136.41 97.72 Fair value of plan assets (63.97) (52.58)Liability recognised in the statement of financial position 72.44 45.14 Net compensated absence cost for the year ended included the following components:Particulars 2011-2012 2010-2011Current service cost 5.28 20.96 Interest cost 7.38 5.16 Expected return on plan assets (4.83) (3.25)Net actuarial (gain) loss recognised in the year 50.40 4.52 Expenses recognised in the income statement 58.23 27.39 The movement of the net liability can be reconciled as follows:Particulars 2011-2012 2010-2011Movements in the liability recognisedOpening net liability 45.14 44.08 Expense as above 58.23 27.39 Contribution paid (30.93) (26.33)Closing net liability 72.44 45.14 The actuarial assumptions used in accounting for the Compensated absence plan were as follows:Particulars 2011-2012 2010-2011Discount rate 8.25%-8.50% 8.00%- 8.30%Expected return on Plan Assets 8.00%-9.00% 8.00%-9.00%Current service cost and interest cost are included in employee costs.
Notes to Consolidated Financial Statements(All amounts in millions of Indian Rupees, unless otherwise stated)

102 Glenmark Pharmaceuticals Limited
NOTE U - RESEARCH AND DEVELOPMENT EXPENDITURE
During the year, the Group expensed ` 2,916.25 (P.Y. ` 1,380.47) as research and development costs.
NOTE V - SHARE BASED EMPLOYEE REMUNERATION
ESOP 2003
The Group has formulated an Employee Stock Option Plan (‘ESOP’) scheme namely ESOP 2003 under which it has made grants on various dates from time to time. Each grant has a vesting period which varies from 1 - 2 years and up to 4 - 6 years from the date of grant depending on the terms of the grant. The grants are made at the market price of the equity shares of the Company on either the date or the closing price of the date prior to day of the grant.The aggregate share options and weighted average exercise price under all the above mentioned plans are as follows:
2012 2011Number* Price* (`) Number* Price* (`)
Outstanding at 1 April 1,937,700 112.05 - 356.15 2,633,500 34.06 - 356.15Granted 25,000 319.25 227,000 275.90 - 281.30Forfeited/cancelled (279,950) 120.85 - 356.15 (488,300) 131.28 - 356.15Exercised (263,450) 112.05 - 300.23 (434,500) 34.06 - 356.15Outstanding as at 31 March 1,419,300 120.85 - 356.15 1,937,700 112.05 - 356.15
* All figures have been accordingly adjusted for - Split of face value from ` 10 to ` 2 in October 2003- 1:1 bonus issue in April 2005 and Split of face value from ` 2 to ` 1 in September 2007.All share based employee remuneration would be settled in equity. The group has no legal or constructive obligation to repurchase or settle the options.The fair values of options granted are determined using the Black-Scholes valuation model. Significant inputs into the calculation are:
2011-2012 2010-2011Weighted average share price (`)* 120.85 - 356.15 34.06 - 356.15Exercise price (`)* 112.05 - 300.23 34.06 - 356.15Weighted average volatility rate 40% - 60% 40% - 60%Dividend pay outs 40% 40%Risk free rate 5.15% - 8.78% 5.15% - 8.78%Average remaining life 1- 60 months 1- 60 months
* All figures have been accordingly adjusted for
- Split of face value from ` 10 to ` 2 in October 2003
- 1:1 bonus issue in April 2005 and Split of face value from ` 2 to ` 1 in September 2007.
The underlying expected volatility was determined by reference to historical data, adjusted for unusual share price movements. No special features inherent to the options granted were incorporated into measurement of fair value.
In total, ` 63.98 (P.Y. ` 82.71) of employee remuneration expense has been included in the consolidated income statement for 31 March 2012. The stock compensation reserve has been credited by an equivalent amount and reduced by ` 12.99 (P.Y. ̀ 16.28) for ESOPs converted to shares. This amount has been transferred to ‘Additional Paid-in Capital’. No liabilities were recognised due to share-based payment transactions as at the end of the year.
Notes to Consolidated Financial Statements(All amounts in millions of Indian Rupees, unless otherwise stated)

103Annual Report 2011 - 2012
NOTE W - RELATED PARTY TRANSACTIONS
Related parties with whom the Group has transacted during the year
Key Management PersonnelMr. Gracias SaldanhaMrs. B. E. SaldanhaMr. Glenn SaldanhaMrs. Cherylann PintoMr. R. V. Desai (Appointed w.e.f. 9 November 2011)Mr. A. S. Mohanty (Up to 10 May 2011)
Enterprises over which significant influence exercised by key management personnel/directors
Glenmark Foundation India
Summary of transactions with related parties during the yearNature of Transaction Year ended
31 March 2012Year ended
31 March 2011Transactions with key management personnelRemuneration 95.45 54.43 Amount payable at the year end - - Share based payments - - Transactions with enterprises over which significant influence exercised by key management personnel/directorsAdvances given and outstanding - 0.04
The directors are covered under the Group’s gratuity policy and ESOP scheme along with other employees of the Group. Proportionate amount of gratuity and stock compensation expense is not included in the aforementioned disclosures as it cannot be separately ascertained.
NOTE X - DERIVATIVES DISCLOSURE a) Derivatives outstanding as at the reporting dateParticulars Purpose Currency 31 March 2012 31 March 2011Forward contract Hedging USD 47.00 -
b) Particulars of unhedged foreign currency exposures as at the reporting dateParticulars Currency 31 March 2012 31 March 2011Trade receivable, loans & advances USD 118.02 243.83
EUR 1.62 1.72 Trade payable & loans from banks USD 94.26 184.10
c) Mark-to-Market losses Particulars 31 March 2012 31 March 2011Mark-to-market losses provided for 81.36 -
NOTE Y - EARNINGS PER SHARE (EPS)
The basic earnings per share for the year ended 31 March 2012 has been calculated using the net results attributable to shareholders of Glenmark as the numerator.
Calculation of basic and diluted EPS is as follows:Particulars 31 March 2012 31 March 2011Profit attributable to shareholders of Glenmark, for basic and dilutive 4,603.48 4,532.08 Weighted average number of shares outstanding during the year for Basic EPS 270,383,075 270,041,025 Effect of dilutive potential ordinary shares:Employee stock options 257,141 417,789 Weighted average number of shares outstanding during the year for dilutive EPS 270,640,216 270,458,814 Basic EPS, in ` 17.03 16.78Diluted EPS, in ` 17.01 16.76
Notes to Consolidated Financial Statements(All amounts in millions of Indian Rupees, unless otherwise stated)

104 Glenmark Pharmaceuticals Limited
NOTE Z - COMMITMENTS AND CONTINGENCIESParticulars 31 March 2012 31 March 2011Bank Guarantees 39.03 68.62Letters of Credit issued by Bankers 763.61 323.08Guarantees given to third party for Office rentals 11.01 8.59Indemnity Bond 287.73 260.25Corporate Guarantees - 1,206.36Disputed Income tax/Excise duty/Sales tax 212.16 47.06Estimated amount of contracts remaining to be executed on capital account and not provided for (net of advances)
288.87 295.98
Others - 0.15During the year, the Glenmark Generics Inc., U.S.A (GGI) has paid Paul Royalty Fund Holdings II (PRF) an amount of ` 1,316.80 (USD 28.8 million) pursuant to its contractual obligation and the same has been charged to the Income Statement.
NOTE AA - SEGMENT REPORTING
The Chief Operating Decision Maker (“CODM”) evaluates the Group’s performance and allocates resources based on an analysis of various performance indicators by reportable segments. The Group’s reportable segments are as follows:
1. India
2. USA
3. Latin America
4. Europe
5. Rest of the World
The CODM reviews revenue as the performance indicator, and does not review the total assets and liabilities for each reportable segment.
The measurement of each segment’s revenues, expenses and assets is consistent with the accounting policies that are used in preparation of the Group’s consolidated financial statements.
Information about reportable segments
Segmental Revenue Year ended 31 March 2012
Year ended 31 March 2011
India 11,273.11 9,931.68USA 12,846.49 8,779.16Latin America 3,291.81 2,490.04Europe 6,365.63 3,719.86Rest of the world (ROW) 6,429.39 4,569.96
TOTAL 40,206.43 29,490.70Analysis of revenue by Category Specialty: This segment includes manufacture and distribution of branded products of the Group. The Specialty business in focused on several therapeutic segments such as Dermatology, Internal medicine, Respiratory, Pediatrics, Diabetes, Gynecology, Oncology etc. It also includes the discovery of new chemical entities for subsequent commercialisation and out-licensing. This segment also includes contract research services in accordance with the specific customer requirements.
Generics: This segment consists of finished pharmaceutical products ready for consumption by the patient, marketed under as generic finished dosages with therapeutic equivalence to branded formulations (generics).
Year ended 31 March 2012 Year ended 31 March 2011Revenues Gross Less Inter
SegmentNet Gross Less Inter
SegmentNet
Specialty 23,418.93 91.26 23,327.67 16,925.59 67.44 16,858.15 Generics 17,462.53 583.77 16,878.76 12,864.48 231.93 12,632.55
TOTAL 40,881.46 675.03 40,206.43 29,790.07 299.37 29,490.70
Notes to Consolidated Financial Statements(All amounts in millions of Indian Rupees, unless otherwise stated)

105Annual Report 2011 - 2012
Analysis of assets by reportable segments31 March 2012
India USA Latin America
Europe ROW Total
Tangible Assets 11,315.67 25.43 1,092.53 530.89 30.00 12,994.52 Intangible Assets 1,741.17 854.42 2,856.62 5,705.83 95.03 11,253.07
TOTAL 13,056.84 879.85 3,949.15 6,236.72 125.03 24,247.59 31 March 2011
India USA Latin America
Europe ROW Total
Tangible Assets 10,181.67 34.42 1,080.33 468.91 28.79 11,794.12Intangible Assets 1,698.84 740.39 2,772.67 4,450.35 61.13 9,723.38
TOTAL 11,880.51 774.81 3,853.00 4,919.26 89.92 21,517.50
NOTE BB - OTHER FINANCIAL ASSETS
Trade receivables comprise amounts receivable from the sale of goods and services. Other current assets include prepayments, input taxes, advances to vendors, accrued interest and deposits and advances receivable in cash and kind.
The management consider that the carrying amount of trade and other receivables approximates their fair value.
Bank balances and cash comprise cash and short-term deposits held by the group treasury function. The carrying amount of these assets approximates their fair value.
Available-for-Sale investments – Non-current represent investments in preferred stock of other pharmaceutical companies which present the Group with opportunity for return through dividend income and security deposits for operating leases and other services.
The investment in equity and preference shares amounting to ` 298.06 (P.Y. ` 281.26) been stated at cost less impairment charges as these are unlisted and therefore the fair value of the Group’s equity investment in this entity cannot be reliably measured.
Given below is the summary of financial assets as categorised in IAS 39:
Particulars As at31 March 2012
As at31 March 2011
Non-current assetsAvailable for sale 298.06 281.26
298.06 281.26 Current assetsAvailable for sale - - Loans and receivables (including Cash and cash equivalents) 21,008.31 17,229.51
NOTE CC - OTHER FINANCIAL LIABILITIESTrade and other payables principally comprise amounts outstanding for trade purchases and on-going costs. The management consider that the carrying amount of trade payables approximates to their fair value.Given below is the summary of financial liabilities as categorised in IAS 39:Particulars As at
31 March 2012As at
31 March 2011Non-current liabilitiesBorrowings:Financial liabilities at amortised cost 13,124.70 6,170.66Current liabilitiesBorrowings:Financial liabilities at amortised cost 9,320.31 14,913.96Trade and other payables:Financial liabilities at amortised cost 9,334.22 7,493.94
Notes to Consolidated Financial Statements(All amounts in millions of Indian Rupees, unless otherwise stated)

106 Glenmark Pharmaceuticals Limited
NOTE DD - FAIR VALUE HIERARCHY
The following table presents financial assets and liabilities measured at fair value in the statement of financial position in accordance with the fair value hierarchy. This hierarchy groups financial assets and liabilities into three levels based on the significance of inputs used in measuring the fair value of the financial assets and liabilities. The fair value hierarchy has the following levels:
- Level 1: quoted prices (unadjusted) in active markets for identical assets or liabilities;
- Level 2: inputs other than quoted prices included within Level 1 that are observable for the asset or liability, either directly (i.e. as prices) or indirectly (i.e. derived from prices); and
- Level 3: inputs for the asset or liability that are not based on observable market data (unobservable inputs).
The level within which the financial asset or liability is classified is determined based on the lowest level of significant input to the fair value measurement. The financial assets and liabilities measured at fair value in the consolidated statement of financial position are grouped into the fair value hierarchy as follows:
Particulars Level 1 Level 2 Level 3 TotalAssetsAvailable-for-sale financial assets – Investment in unlisted securities - - 298.06 298.06 Liabilities - - - -
Measurement of fair value
The methods and valuation techniques used for the purpose of measuring fair value are unchanged from the previous year.
Investments in unlisted securities
The fair value of the investment cannot be determined as there are no quoted market prices at the reporting date for unlisted securities and hence they have been valued at cost. Such investments have been categorized in Level 3.
NOTE EE - OTHER EVENTS
Sanofi-Aventis filed a patent infringement action before the US District Court, Eastern District Court of New Jersey against the Company’s subsidiary Glenmark Generics Inc., U.S.A (GGI) pertaining to its marketing of the product Trandolapril-Verapamil (“Tarka”). Tarka is owned and manufactured by the Company’s subsidiary, Glenmark Generics Limited, which is headquartered in India, and is marketed and distributed in the USA by the GGI, under a sales and marketing agreement. A Jury trial was held in early January 2011 and on 14 January, 2011, the jury returned a verdict that the patent held by Sanofi-Aventis was valid and infringed and ordered the GGI to pay damages of approximately $16 million. The GGI has filed a post trial motion seeking a judgement in its favour notwithstanding the Jury’s verdict, and the court has not ruled on that motion, nor has it entered a final judegement. The Company believes that is has meritorious defenses to plaintiff’s infringement claim.
NOTE FF - RISK MANAGEMENT OBJECTIVES AND POLICIES
The Group is exposed to a variety of financial risks which results from the Group’s operating and investing activities. The Group’s risk management is coordinated by its parent company, in close co-operation with the board of directors and the core management team of the subsidiaries, and focuses on actively securing the Group’s short to medium term cash flows by minimising the exposure to financial markets.
The Group does not actively engage in the trading of financial assets for speculative purposes nor does it write options.
Financial assets that potentially subject the Group to concentrations of credit risk consist principally of cash equivalents, accounts receivables, other receivables, investment securities and deposits. By their nature, all such financial instruments involve risk including the credit risk of non-performance by counter parties.
The Group’s cash equivalents and deposits are invested with banks.
The Group’s trade and other receivables are actively monitored to review credit worthiness of the customers to whom credit terms are granted and also avoid significant concentrations of credit risks.
The Group’s interest-rate risk arises from long-term borrowings. Borrowings obtained at variable rates expose the Group to cash flow interest-rate risk. Borrowings issued at fixed rates expose the Group to fair value interest-rate risk.
Foreign Currency sensitivity
The overseas entities of the Group operate in different countries. The functional currency of such entities is the currency being used in that particular country. The bulk of contributions to the Group’s assets, liabilities, income and expenses in foreign currency are denominated in US Dollar and EURO. Apart from US Dollar, foreign currency transactions are entered into by entities in GBP, Swiss Francs and several other currencies as applicable in the country in which the particular entity operates. However, the size of these entities relative to the total Group and the volume of transactions in such currencies are not material.
Thus, the foreign currency sensitivity analysis has been performed in relation to US Dollar (USD) and Euro (EUR).
US Dollar conversion rate was ` 45.21 at the beginning of the year and scaled to a high of ` 55.24 and to low of ` 44.31. The closing rate is ` 50.87. Considering the volatility in direction of strengthening dollar upto 5%, the sensitivity analysis has been disclosed at 5% movements on strengthening and weakening effect for presenting comparable movement due to currency fluctuations.
Notes to Consolidated Financial Statements(All amounts in millions of Indian Rupees, unless otherwise stated)

107Annual Report 2011 - 2012
Foreign currency denominated financial assets and liabilities, translated into USD at the closing rate, are as follows.
Nominal amounts As at 31 March 2012 As at 31 March 2011USD INR USD INR
Short-term exposure (Net)Financial assets 18.50 941.00 39.08 1,745.87Financial liabilities (191.74) (9,753.88) (236.69) (10,575.15)
TOTAL (173.24) (8,812.88) (197.61) (8,829.28)Long-term exposure (Net)Financial assets - - - - Financial liabilities (255.00) (12,971.85) (116.45) (5,202.96)
TOTAL (255.00) (12,971.85) (116.45) (5,202.96)If the INR had strengthened against the US Dollar by 5% then this would have the following impact:
Year ended 31 March 2012 Year ended 31 March 2011USD INR USD INR
Net results for the year 21.41 1,089.24 15.70 701.60 Equity - - - -
If the INR had weakened against the US Dollar by 5% then this would have the following impact:Year ended 31 March 2012 Year ended 31 March 2011
USD INR USD INRNet results for the year (21.41) (1,089.24) (15.70) (701.60)Equity - - - -
EUR conversion rate was ` 64.07 at the beginning of the year and scaled to a high of ` 71.82 and to low of ` 62.96. The closing rate is ` 69.47. Considering the volatility in direction of strengthening EUR up to 5%, the sensitivity analysis has been disclosed at 5% movements on strengthening and weakening effect for presenting comparable movement due to currency fluctuations.
Foreign currency denominated financial assets and liabilities, translated into EUR at the closing rate, are as follows:
Nominal amounts As at 31 March 2012 As at 31 March 2011EUR INR EUR INR
Short-term exposure (Net)Financial assets 1.17 81.02 1.63 103.25 Financial liabilities (9.09) (631.59) (9.79 ) (619.22)
TOTAL (7.92) (550.57) (8.16) (515.97)
Long-term exposure (Net)Financial assets - - - - Financial liabilities - - (8.93) (564.46)
TOTAL - - (8.93) (564.46)If the INR had strengthened against the EUR by 5% then this would have the following impact:
Year ended 31 March 2012 Year ended 31 March 2011EUR INR EUR INR
Net results for the year 0.40 27.53 0.85 54.02 Equity - - - -
If the INR had weakened against the EUR by 5% then this would have the following impact:Year ended 31 March 2012 Year ended 31 March 2011
EUR INR EUR INRNet results for the year (0.40) (27.53) (0.85) (54.02)Equity - - - -
Interest rate sensitivity
The Group’s policy is to minimise interest rate cash flow risk exposures on long-term borrowing. The Group has taken several short term borrowings on fixed rate of interest. Since, there is no interest rate cash outflow associated with such fixed rate loans; an interest rate sensitivity analysis has not been performed.
Notes to Consolidated Financial Statements(All amounts in millions of Indian Rupees, unless otherwise stated)

108 Glenmark Pharmaceuticals Limited
The Group has also borrowed USD 415 millions (P.Y. USD 165 millions) and EUR 6.75 millions (P.Y. EUR 18 millions). In case of LIBOR/Benchmark prime lending rate (BPLR) increases by 25 basis points then such increase shall have the following impact on:
Year ended31 March 2012
Year ended31 March 2011
Net results for the year (51.48) (21.29)Equity - -
In case of LIBOR/Benchmark prime lending rate (BPLR) decreases by 25 basis points then such decrease shall have the following impact on:
Year ended31 March 2012
Year ended31 March 2011
Net results for the year 51.48 21.29Equity - - The bank deposits are placed on fixed rate of interest of approximately 7% to 9%. As the interest rate does not vary unless such deposits are withdrawn and renewed, sensitivity analysis is not performed.Credit risk analysis The Group’s exposure to credit risk is limited to the carrying amount of financial assets recognised at the date of statement of financial position, as summarised below:
As at31 March 2012
As at31 March 2011
Cash and cash equivalents 3,200.76 1,948.72Restricted Cash 52.70 37.54Trade receivables 12,436.07 11,308.14Other financial assets 5,371.48 3,972.65Long term financial assets 298.06 281.26
TOTAL 21,359.07 17,548.31The Group continuously monitors defaults of customers and other counterparties, identified either individually or by the Group and incorporates this information into its credit risk controls. The Group’s policy is to deal only with creditworthy counterparties.
The Group’s management considers that all the above financial assets that are not impaired for each of the reporting dates under review are of good credit quality, including those that are past due. None of the Group’s financial assets are secured by collateral or other credit enhancements.
In respect of trade and other receivables, the Group’s exposure to any significant credit risk exposure any single counterparty or any groups of counterparties having similar characteristics is considered to be negligible. The credit risk for liquid funds and other short-term financial assets is considered negligible, since the counterparties are reputable banks with high quality external credit ratings.
Liquidity risk analysis
The Group manages its liquidity needs by carefully monitoring scheduled debt servicing payments for long-term financial liabilities as well as cash-outflows due in day-to-day business. Liquidity needs are monitored in various time bands, on a day-to-day and week-to-week basis, as well as on the basis of a rolling 30-day projection. Long-term liquidity needs for a 180-day and a 360-day lookout period are identified monthly.
The Group maintains cash and marketable securities to meet its liquidity requirements for up to 30-day periods. Funding in regards to long-term liquidity needs is additionally secured by an adequate amount of committed credit facilities and the ability to sell long-term financial assets.
As at 31 March 2012, the Group’s liabilities have contractual maturities which are summarised below:
Current Non-CurrentWithin 6 months
6 to 12 months 1 to 5 years More than5 years
Trade payable 7,888.29 Other short-term liabilities 1,445.93 Employee benefit obligations 106.26 145.77 Provisions - - - -
The above contractual maturities reflect the gross cash outflows, not discounted at the current values thereby these values will differ to the carrying values of the liabilities at the date of the statement of financial position.
Notes to Consolidated Financial Statements(All amounts in millions of Indian Rupees, unless otherwise stated)
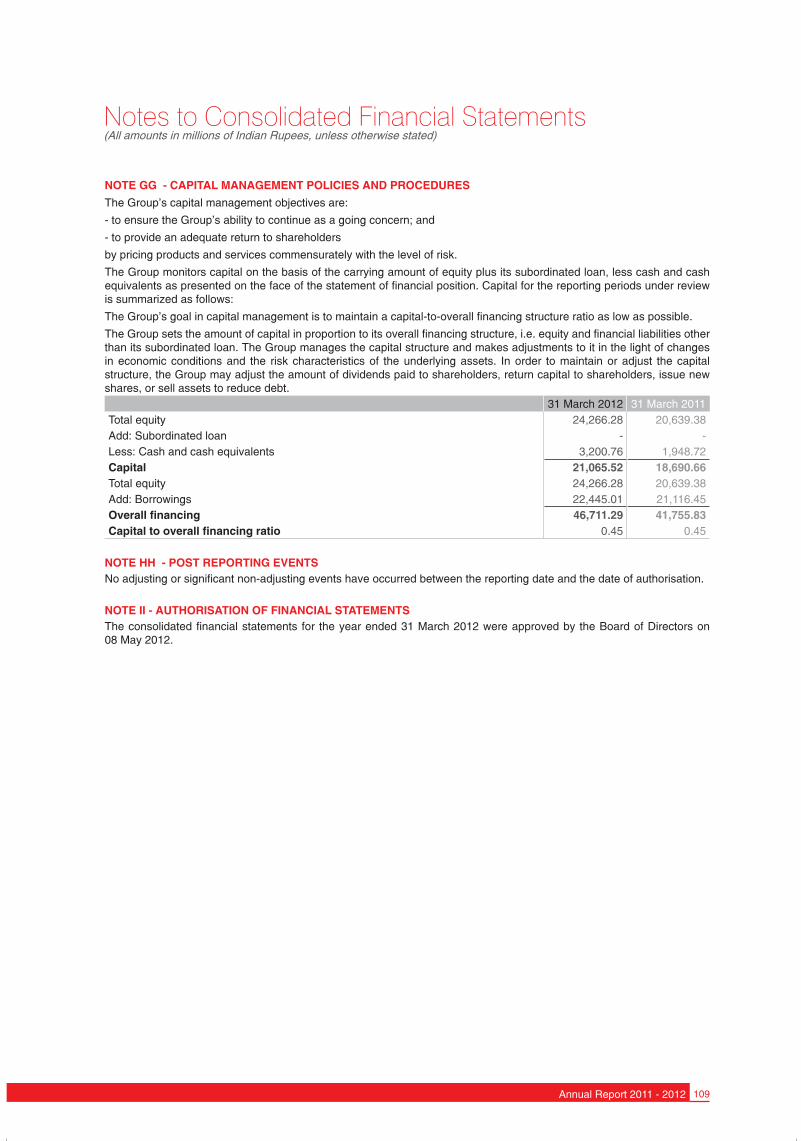
109Annual Report 2011 - 2012
NOTE GG - CAPITAL MANAGEMENT POLICIES AND PROCEDURES
The Group’s capital management objectives are:
- to ensure the Group’s ability to continue as a going concern; and
- to provide an adequate return to shareholders
by pricing products and services commensurately with the level of risk.
The Group monitors capital on the basis of the carrying amount of equity plus its subordinated loan, less cash and cash equivalents as presented on the face of the statement of financial position. Capital for the reporting periods under review is summarized as follows:
The Group’s goal in capital management is to maintain a capital-to-overall financing structure ratio as low as possible.
The Group sets the amount of capital in proportion to its overall financing structure, i.e. equity and financial liabilities other than its subordinated loan. The Group manages the capital structure and makes adjustments to it in the light of changes in economic conditions and the risk characteristics of the underlying assets. In order to maintain or adjust the capital structure, the Group may adjust the amount of dividends paid to shareholders, return capital to shareholders, issue new shares, or sell assets to reduce debt.
31 March 2012 31 March 2011Total equity 24,266.28 20,639.38Add: Subordinated loan - - Less: Cash and cash equivalents 3,200.76 1,948.72Capital 21,065.52 18,690.66 Total equity 24,266.28 20,639.38Add: Borrowings 22,445.01 21,116.45Overall financing 46,711.29 41,755.83Capital to overall financing ratio 0.45 0.45
NOTE HH - POST REPORTING EVENTSNo adjusting or significant non-adjusting events have occurred between the reporting date and the date of authorisation.
NOTE II - AUTHORISATION OF FINANCIAL STATEMENTSThe consolidated financial statements for the year ended 31 March 2012 were approved by the Board of Directors on 08 May 2012.
Notes to Consolidated Financial Statements(All amounts in millions of Indian Rupees, unless otherwise stated)
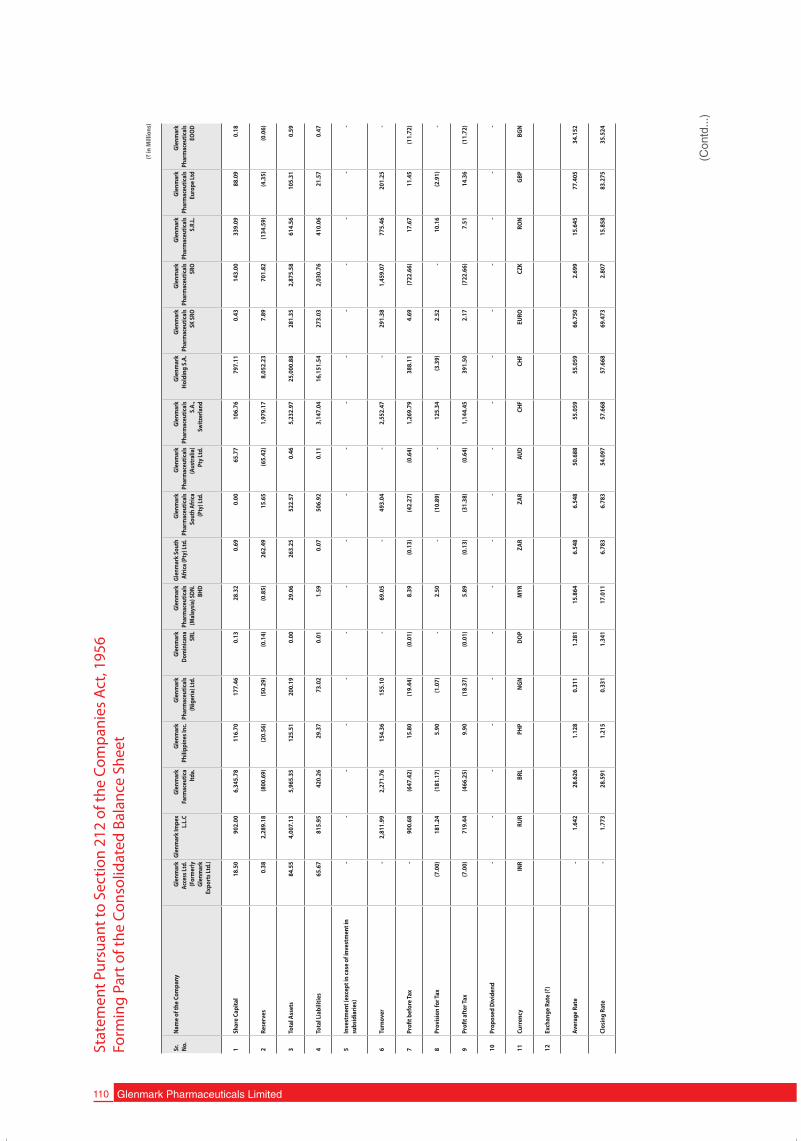
110 Glenmark Pharmaceuticals Limited
Stat
emen
t Pur
suan
t to
Sect
ion
212
of th
e Co
mpa
nies
Act
, 195
6 Fo
rmin
g Pa
rt o
f the
Con
solid
ated
Bal
ance
She
et
(` in
Mill
ions
)
Sr.
No.
Nam
e of
the
Com
pany
Glen
mar
k Ac
cess
Ltd.
(F
orm
erly
Gl
enm
ark
Expo
rts L
td.)
Glen
mar
k Im
pex
L.L.
CGl
enm
ark
Farm
aceu
tica
ltda.
Glen
mar
k Ph
ilipp
ines
Inc.
Glen
mar
k Ph
arm
aceu
tical
s (N
iger
ia) L
td.
Glen
mar
k Do
min
ican
a SR
L
Glen
mar
k Ph
arm
aceu
tical
s (M
alay
sia) S
DN.
BHD
Glen
mar
k So
uth
Afric
a (P
ty) L
td.
Glen
mar
k Ph
arm
aceu
tical
s So
uth
Afric
a (P
ty) L
td.
Glen
mar
k Ph
arm
aceu
tical
s (A
ustr
alia
) Pt
y Lt
d.
Glen
mar
k Ph
arm
aceu
tical
s S.
A.,
Switz
erla
nd
Glen
mar
k H
oldi
ng S
.A.
Glen
mar
k Ph
arm
aceu
tical
s SK
SRO
Glen
mar
k Ph
arm
aceu
tical
s SR
O
Glen
mar
k Ph
arm
aceu
tical
s S.
R.L.
Glen
mar
k Ph
arm
aceu
tical
s Eu
rope
Ltd
Glen
mar
k Ph
arm
aceu
tical
s EO
OD
1Sh
are
Capi
tal
18.5
0 90
2.00
6,
345.
78
116.
70
177.
46
0.13
28
.32
0.69
0.
00
65.7
7 10
6.76
79
7.11
0.
43
143.
00
339.
09
88.0
9 0.
18
2Re
serv
es0.
38
2,28
9.18
(8
00.6
9)(2
0.56
)(5
0.29
)(0
.14)
(0.8
5)26
2.49
15
.65
(65.
42)
1,97
9.17
8,
052.
23
7.89
70
1.82
(1
34.5
9)(4
.35)
(0.0
6)
3To
tal A
sset
s84
.55
4,00
7.13
5,
965.
35
125.
51
200.
19
0.00
29
.06
263.
25
522.
57
0.46
5,
232.
97
25,0
00.8
8 28
1.35
2,
875.
58
614.
56
105.
31
0.59
4To
tal L
iabi
litie
s65
.67
815.
95
420.
26
29.3
7 73
.02
0.01
1.
59
0.07
50
6.92
0.
11
3,14
7.04
16
,151
.54
273.
03
2,03
0.76
41
0.06
21
.57
0.47
5In
vest
men
t (ex
cept
in ca
se o
f inv
estm
ent i
n su
bsid
iarie
s) -
- -
- -
- -
- -
- -
- -
- -
- -
6Tu
rnov
er-
2,8
11.9
9 2
,271
.76
154
.36
155
.10
- 6
9.05
-
493
.04
- 2
,552
.47
- 2
91.3
8 1
,459
.07
775
.46
201
.25
-
7Pr
ofi t
befo
re Ta
x-
900
.68
(647
.42)
15.
80
(19.
44)
(0.0
1) 8
.39
(0.1
3) (4
2.27
) (0
.64)
1,2
69.7
9 3
88.1
1 4
.69
(722
.66)
17.
67
11.
45
(11.
72)
8Pr
ovis
ion
for T
ax (
7.00
) 1
81.2
4 (1
81.1
7) 5
.90
(1.0
7) -
2.5
0 -
(10.
89)
- 1
25.3
4 (3
.39)
2.5
2 -
10.
16
(2.9
1) -
9Pr
ofi t
afte
r Tax
(7.0
0) 7
19.4
4 (4
66.2
5) 9
.90
(18.
37)
(0.0
1) 5
.89
(0.1
3) (3
1.38
) (0
.64)
1,1
44.4
5 3
91.5
0 2
.17
(722
.66)
7.5
1 1
4.36
(1
1.72
)
10Pr
opos
ed D
ivid
end
- -
- -
- -
- -
- -
- -
- -
- -
-
11Cu
rren
cy IN
R R
UR
BRL
P
HP
NGN
D
OP
MYR
Z
AR
ZAR
A
UD
CH
F C
HF
EUR
O
CZK
R
ON
G
BP
BGN
12Ex
chan
ge R
ate
(`)
Aver
age
Rate
- 1
.642
2
8.62
6 1
.128
0
.311
1
.281
1
5.86
4 6
.548
6
.548
5
0.68
8 5
5.05
9 5
5.05
9 6
6.75
0 2
.699
1
5.64
5 7
7.40
5 3
4.15
2
Clos
ing
Rate
- 1
.773
2
8.59
1 1
.215
0
.331
1
.341
1
7.01
1 6
.783
6
.783
5
4.09
7 5
7.66
8 5
7.66
8 6
9.47
3 2
.807
1
5.85
8 8
3.27
5 3
5.52
4
(Con
td...
)

111Annual Report 2011 - 2012
Stat
emen
t Pur
suan
t to
Sect
ion
212
of th
e Co
mpa
nies
Act
, 195
6 Fo
rmin
g Pa
rt o
f the
Con
solid
ated
Bal
ance
She
et (C
ontd
.)
F
or a
nd o
n be
half
of th
e B
oard
of D
irect
ors
G
len
n S
ald
anh
a C
her
ylan
n P
into
R
ajes
h V
Des
ai
Cha
irman
& M
anag
ing
Dire
ctor
E
xecu
tive
Dire
ctor
E
xecu
tive
Dire
ctor
& C
FO
Pla
ce: M
umba
i
Mar
shal
l Men
do
nza
Dat
e: 0
8 M
ay 2
012
V
ice
Pre
side
nt &
Com
pany
Sec
reta
ry
(` in
Mill
ions
)
Sr.
No.
Nam
e of
the
Com
pany
Glen
mar
k Ph
arm
aceu
tical
s Co
lom
bia
Ltda
Glen
mar
k Ph
arm
aceu
tical
s Pe
ru S
.A.C
.
Glen
mar
k Th
erap
eutic
s In
c., U
SA
Glen
mar
k Ph
arm
aceu
tical
s Eg
ypt S
.A.E
.
Glen
mar
k Ph
arm
aceu
tical
s SP
Z.O
.O.
Glen
mar
k D
istr
ibut
ors S
P Z.
O.O.
Glen
mar
k Ph
arm
aceu
tical
s F.
Z.E.
Glen
mar
k Ph
arm
aceu
tical
s M
exic
o, S
A D
E CV
Glen
mar
k Ph
arm
aceu
tical
s Ve
nezu
ela,
CA
Glen
mar
k Ur
ugua
y SA
Glen
mar
k Ge
neric
s Li
mite
d
Glen
mar
k Ge
neric
s (E
urop
e) L
td.
Glen
mar
k Ge
neric
s Inc
., US
A
Glen
mar
k Ge
neric
s S.A
. Ar
gent
ina
Glen
mar
k Ge
neric
s H
oldi
ng S
.A.
Glen
mar
k Ge
neric
s Fi
nanc
e S.
A.
Glen
mar
k Ge
neric
s B.V
Gl
enm
ark
Arzn
eim
ittel
Gm
BH
Glen
mar
k Ge
neric
s Ca
nada
, Inc
.
1Sh
are
Capi
tal
14.2
4 10
8.94
36
8.60
11
9.56
39
.42
27.5
0 12
.92
453.
21
243.
87
1,02
4.62
1,
503.
25
518.
09
1,92
5.94
1,
624.
47
9,79
3.80
5,
214.
26
1.15
3.
19
0.00
2Re
serv
es0.
11
59.2
1 (3
63.0
6)(7
0.66
)11
4.51
13
.95
16.2
8 (3
85.5
9)(1
42.5
3)11
.80
13,6
75.0
913
3.80
(1
42.8
4)(4
33.4
4)2,
641.
40
145.
52
0.76
16
.73
0.00
3To
tal A
sset
s14
.87
189.
91
25.9
2 61
.47
227.
79
267.
90
38.4
0 19
7.07
29
2.61
1,
036.
71
29,1
71.3
31,
442.
73
11,5
45.1
3 1,
347.
21
19,3
71.4
1 18
,481
.05
33.5
0 39
.54
0.00
4To
tal L
iabi
litie
s0.
52
21.7
6 20
.38
12.5
7 73
.86
226.
45
9.20
12
9.45
19
1.27
0.
29
13,9
92.9
9 79
0.84
9,
762.
03
156.
18
6,93
6.21
13
,121
.27
31.5
9 19
.62
0.00
5In
vest
men
t (ex
cept
in ca
se o
f in
vest
men
t in
subs
idia
ries)
- -
- -
- -
- -
- -
0.0
1 -
- -
- -
- -
-
6Tu
rnov
er -
50.
86
111
.26
66.
36
446
.33
498
.94
11.
41
52.
35
283
.00
- 1
2,90
1.53
1,
022.
65
12,8
04.0
6 35
3.35
0.
00
0.00
37
.15
9.30
0.
00
7Pr
ofi t
befo
re Ta
x (0
.43)
(54.
82)
(2.8
8) (2
8.74
) 1
9.62
3
.25
10.
36
(146
.24)
(58.
98)
2.3
5 2
,649
.23
109.
08
38.6
9 (2
16.8
4)(2
5.54
)55
.78
0.10
(3
8.30
)0.
00
8Pr
ovis
ion
for T
ax -
(30.
12)
0.2
1 -
3.2
1 0
.62
- (2
2.05
) (3
2.59
) 0
.21
399
.50
0.81
(2
87.2
3)(7
5.85
)0.
30
(0.8
1)0.
02
(10.
17)
0.00
9Pr
ofi t
afte
r Tax
(0.4
3) (2
4.70
) (3
.09)
(28.
74)
16.
41
2.6
3 1
0.36
(1
24.1
9) (2
6.39
) 2
.14
2,2
49.7
3 10
8.28
32
5.93
(1
40.9
9)(2
5.84
)56
.59
0.08
(2
8.13
)0.
00
10Pr
opos
ed D
ivid
end
- -
- -
- -
- -
- -
- -
- -
- -
- -
-
11Cu
rren
cy C
OP
PEN
U
SD
EGY
P
LN
PLN
A
ED
MXN
V
EF
UYU
IN
R G
BP
USD
A
RS
CH
F C
HF
EUR
O
EUR
O
-
12Ex
chan
ge R
ate
(`)
-
Aver
age
Rate
0.0
27
17.
999
48.
530
8.1
42
15.
971
15.
971
13.
215
3.8
39
11.
321
2.5
80
- 7
7.40
5 4
8.53
0 1
1.53
7 5
5.05
9 5
5.05
9 6
6.75
0 6
6.75
0 -
Clos
ing
Rate
0.0
29
19.
574
50.
870
8.6
51
16.
732
16.
732
14.
182
4.0
75
12.
143
2.7
44
- 8
3.27
5 5
0.87
0 1
1.91
5 5
7.66
8 5
7.66
8 6
9.47
3 6
9.47
3 -

Notes

Notes

Notes

Notes

Notes

Safe Harbour Statement
This report has been prepared by Glenmark Pharmaceuticals Ltd. The information, statements and analysis made in this report describing the Company’s
objectives, projections and estimates are forward looking statements and progressive within the meaning of applicable security laws and Regulations.
Forward-looking statements may include words or phrases such as “believes”, “expects”, “anticipates”, “intends”, “plans”, “foresees” or other words or phrases of
similar import. Similarly, statements that describe objectives, plans or goals both for itself and for any of its business components also are forward-looking
statements.
All such forward looking statements are subject to certain risks and uncertainties that could cause actual results to differ materially from those contemplated.
The analysis contained herein is based on numerous assumptions. Actual result may vary from those expressed or implied depending upon economic conditions,
government policies and other incidental factors. No representation or warranty, either expressed or implied, is provided in relation to this report. This report
should not be regarded by recipients as a substitute for the exercise of their own judgment.

www.glenmark pharma.com