Embed Size (px)
Citation preview

1
Stability of PbTe Quantum Dots
Glen Junor
Department of Chemistry
Senior Thesis
University of California Irvine 2015
2
Abstract
Lead telluride quantum dots (PbTe QDs) exhibit promising electronic properties for use
in next-generation optoelectronic and photovoltaic devices. Unfortunately, the rapid oxidation of
PbTe in air impedes the development of this material in favor of the less labile lead
chalcogenides PbSe and PbS. In the reduction half reaction of O2 to H2O (½ O2 + 2H+ +2e
-
H2O) the reduction potential is 1.23 V; the corresponding reactions for S, Se, and Te have
potentials of 0.17, -0.37, and -0.72 V, respectively. The systematic decrease in reduction
potential explains the decreasing stability of PbX (X=S, Se, Te) in the presence of oxygen, where
Te2-
is unable to maintain a 2- oxidation state for any appreciable time, when compared to Se2-
and especially S2-
.
Various sizes of PbTe and PbSe QDs are measured over several days in air and nitrogen
by optical absorption spectroscopy and transmission electron microscopy (TEM). Upon air
exposure, PbTe exhibits blue-shifting and broadening of its first exciton absorption peak;
suggesting non-homogeneous oxidation of PbTe into PbO and other oxidized species over time.
The oxygen exposure results in complete loss of the PbTe characteristic UV/Vis absorption
feature after only 2 hours when in solution. On the other hand, PbSe exhibits appreciable blue-
shifting only after 48 hours of air exposure and does not show significant peak broadening even
after 100 hours in air, indicating a slower oxidation of all QDs in solution. Neither PbTe nor
PbSe showed visible changes by TEM, indicating that exposure to oxygen does not destroy the
QD structure. Films of PbTe QDs were studied at each stage of processing: “as-made” QDs with
oleate ligands; 1,2-ethanedithiol (EDT) ligand exchanged QDs; and an Al2O3 (alumina) over-
coated, EDT exchanged film. The alumina overcoated PbTe QDs showed no discernable change

3
over 3.5 months in air, thus providing a means to protect these labile PbTe QDs and lead to more
development of this promising material.
Introduction
Quantum dot (QD) semiconductors have unique optical and electrical properties that
make them promising for use in many applications, such as high-performance field-effect
transistors (FETs)1,2
and solar cells.3,4
Quantum dots are particles with quantum confinement in
three dimensions, resulting in a quantized density of states.1-5
One effect of such quantization is a
size-tunable semiconductor band gap.1-5
As the QD continues to get smaller with respect to the
material’s exciton Bohr radius, the band gap widens. Such freedom allows a chemist to choose
synthetic conditions to grow a QD with the optimal band gap for a given device application.
Quantum confined particles, like QDs, have unique properties allowing them to exhibit
Multiple Exciton Generation (MEG) more efficiently than bulk semiconductors. 3,4,7,8,10
MEG,
also called inverse Auger recombination, occurs when an electron absorbs a photon that is an
integer multiple of the semiconductor band gap. For example, an electron absorbs a photon with
energy just above twice the band gap. This highly excited electron can transfer the additional
kinetic energy to another electron through a Coulombic interaction; resulting in two carriers at
the band edge rather than one carrier excited to twice the band edge.10
Thus, MEG enhances
photocurrents by using the high energy photons of the solar spectrum to produce multiple
electrons.10
In bulk semiconductors, crystal momentum must be accounted for, increasing the
energy required to produce multiple electrons from a single photon, and greatly limiting the
wavelengths that can produce multiple carriers.3,4,6,10
However, the strong confinement of charge
carriers in QDs allows Auger processes, MEG and Auger recombination, to begin taking place
when the incident energy is only slightly more than twice the band gap.

4
MEG allows for a single-junction solar cell to surpass the theoretical maximum
efficiency of 33%; making the new single-junction limit 44% .3,4,6,10
The combination of higher
efficiency from MEG enhanced photocurrents and size tunable band gaps makes the realization
of near-ideal photocells a more attainable reality. Quantum dot solar cells have been termed
Third-Generation or Next-Generation photovoltaics due to such unique properties.
Lead (II) chalcogenide (PbX, X = S, Se, Te) quantum dots have shown particular promise
for use in photovoltaic applications. The large exciton Bohr radii for the lead chalcogenide QDs
allows for particularly strong confinement when compared to other QDs of similar sizes.9 It has
also been shown that PbX QDs have exhibited the first and most efficient observable MEG
processes.3,4,7,8,10
When engineering a new photovoltaic technology, large-scale device properties must also
be taken into account, rather than just the properties of the individual building blocks. Important
from the device perspective, the lead chalcogenide QDs have high dielectric constants, reducing
the effective masses for charge carriers in QD solids.3,4
High dielectrics and large exciton Bohr
radii make for strongly coupled, electrically conductive films needed for use in photovoltaics and
field-effect transitors (FETs).4
Additionally, PbX quantum dots can be synthesized through
colloidal chemistry; allowing for solution-based processing, cheapening film production. Finally,
the strong absorption coefficients of PbX QDs allow for the creation of thin-film solar cells.
These solar cells can be made where only a few hundred nanometers of material are required to
absorb more than 99% of incident light.
Lead (II) telluride (PbTe) quantum dots were recently shown to have the highest MEG
efficiencies of all lead chalcogenide QDs to date.8 PbTe also has the highest exciton Bohr radius
(152 nm) and dielectric constant compared to other lead chalcogenides.4 These properties
5
suggest the possibility of superior coupling of PbTe QD films for use in FETs and solar devices.
If PbTe QDs exhibit superior coupling, conduction, and MEG efficiencies the successful creation
of a PbTe photovoltaic cell is essential to pushing the limits of QD solar devices.
In literature, PbTe QDs have not only been successfully synthesized but have also been
attributed with the highest MEG efficiencies, yet there is no literature at this time employing
PbTe QDs in an actual solar cell device. Here the stability characteristics of PbTe QDs are
investigated both as thin films and in solution to shed light on some possible issues to overcome
before employing PbTe in electronic devices and testing possible solutions. We explore the
general stability of three sizes of PbTe QDs with diameters of 3.1 nm, 5.5 nm, and 7.1 nm in
solution and the stability of 5.5 nm QDs during each stage of thin film creation in both air and
nitrogen. Finally, we applied a protective overcoat of Al2O3 (alumina) by atomic layer deposition
(ALD). Alumina was able to protect the film from oxidation for 3.5 months and still counting.
Materials and Methods
Materials: Trioctylphospine (TOP, 97%) was purchase from Strem Chemical. Lead (II)
oxide (PbO, 99.9999%) was purchased from Alfa Aesar. Oleic acid (OA, technical grade 90%),
Tellurium and Selenium shot, 1-Octadecene (ODE, technical grade 90%), and anhydrous ethanol
(200 proof), hexanes (mixture of isomers, 99%), and tetrachloroethylene (TCE, 99%) were
purchased from Sigma-Aldrich.
Synthesis of 3.1 nm Diameter Oleate-Capped PbTe Nanocrystals: The synthesis of small
PbTe nanocrystals was performed in a three-neck round bottom flask. The reaction involved
Pb:OA ratios of 1:2 and Pb:Te ratios of 1:3. First, PbO and OA was stirred in ODE under
vacuum at 120 ̊C to form a lead (II) oleate solution. After degasing for an additional hour, to
ensure a dry solution, the solution was placed under Argon and heated to 140 ̊C. At 140 ̊C

6
trioctylphosphine telluride (TOPTe) was rapidly injected into the mixture. The quantum dots
nucleate instantly, turning the solution black, so a rapid injection was important to obtain a
narrow size distribution. After growing 3 minutes, the QDs were quenched in a liquid nitrogen
bath and 10 mL of hexanes was added to assist initial cooling from high temperatures. Hexanes
must be injected slowly to avoid bumping and loss of NCs. PbTe is air-sensitive so all
subsequent purification was performed in a glovebox with anhydrous reagents.
A typical synthesis mixed 3 mmol PbO and 6 mmol oleic acid in 20 mL of 1-Octadecene.
At 140 ̊C, 12 mL of 0.75 M TOPTe was injected. After 3 minutes, the reaction vessel was placed
in liquid nitrogen and frozen to -10 ̊C before the round-bottom was removed from the Schlenk
line and brought into the glovebox. Purification involved three sequences of QD precipitation by
ethanol, decanting the supernatant, and re-suspending the QDs in hexanes. All optical
characterization was carried out while the dots were dissolved in TCE. Typical yield is roughly
70 mg (5%). See below for description of the calculation of theoretical yield.
Synthesis of 5.5 nm Diameter Oleate-Capped PbTe Nanocrystals: The synthesis of
medium sized PbTe quantum dots was carried out using the same methods as the small PbTe
quantum dots but with a few specific changes. The Pb:OA ratio was 1:2.6 and the Pb:Te ratio
was 1:5. Additionally, the TOPTe injection temperature was 180 ̊ C and the growth time was 30
seconds. Also, all precursors were more concentrated, see below.
A typical synthesis mixed 6.7 mmol PbO and 17.6 mmol oleic acid in 12.7 mL of 1-
Octadecene. At 180 ̊C, 10 mL of 1.5 M TOPTe was injected. After 30 seconds, the reaction
vessel was placed in liquid nitrogen and frozen to -10 ̊C before the round-bottom was removed
from the Schlenk line and brought into the glovebox. Purification followed the methods used on

7
the small quantum dots. Yield was roughly 175 mg (7%). See below for description of the
calculation of theoretical yield.
Synthesis of 7.1 nm Diameter Oleate-Capped PbTe Nanocrystals: The synthesis of large
sized PbTe quantum dots was carried out using the same methods as the medium PbTe quantum
dots besides a few specific changes. The Pb:OA ratio remained1:2.6 and the Pb:Te ratio
remained 1:5. However, the TOPTe injection temperature was 200 ̊ C and the growth time was
45 seconds. The precursors were in the same concentrations as 5.5 nm PbTe synthesis.
A typical synthesis mixed 6.7 mmol PbO and 17.6 mmol oleic acid in 12.7 mL of 1-
Octadecene. At 200 ̊C, 10 mL of 1.5 M TOPTe was injected. After 45 seconds, the reaction
vessel was placed in a pool of liquid nitrogen until the temperature reached 50 ̊C before the
round-bottom was removed from the Schlenk line and brought into the glovebox. Purification
followed the methods used on the medium quantum dots. Yield is roughly 97 mg (4%). See
below for description of the calculation of theoretical yield.
Synthesis of 5 nm Diameter Oleate-Capped PbSe Nanocrystals: The synthesis of medium
sized PbSe quantum dots was carried out in an attempt to create the same QD-ligand
environment as the PbTe counterparts, to make comparison more reasonable. The Pb:OA mole
ratio for PbSe reactions was 1:2.46 and the Pb:Se ratio changed to 1:3.74. The TOPSe injection
temperature was 165 ̊C and the growth time was 2 minutes. The concentration of TOPSe was 2
M.
A typical synthesis mixed 4.48 mmol PbO and 11.0 mmol oleic acid in 14.0 mL of 1-
Octadecene. At 165 ̊C, 8.4 mL of 2 M TOPSe was injected. After 2 minutes, the reaction vessel
was placed in a pool of liquid nitrogen until the temperature reached -10 ̊C before the round-
bottom was removed from the Schlenk line and brought into the glovebox. Purification followed

8
the methods used on the PbTe quantum dots. Yield is roughly 25 mg (1%). See below for
description of the calculation of theoretical yield.
Synthesis of 7 nm Diameter Oleate-Capped PbSe Nanocrystals: The synthesis of large
PbSe was carried out in a similar fashion to the synthesis of 5 nm PbSe. The Pb:OA mole ratio
for PbSe reactions was 1:2.46 and the Pb:Te ratio changed to 1:3.74. The TOPSe injection
temperature was 165 ̊C and the growth time was 4.5 minutes. The concentration of TOPSe was
2 M.
A typical synthesis mixed 4.48 mmol PbO and 11.0 mmol oleic acid in 14.0 mL of 1-
Octadecene. At 165 ̊C, 8.4 mL of 2 M TOPSe was injected. After 4.5 minutes, the reaction vessel
was placed in a pool of liquid nitrogen until the temperature reached -10 ̊C before the round-
bottom was removed from the Schlenk line and brought into the glovebox. Purification followed
the methods used on the PbTE quantum dots. Yield is roughly 17 mg (1%). See below for
description of the calculation of theoretical yield.
Synthesis of 3 nm Diameter Oleate-Capped PbSe Nanocrystals: Attempts were made to
synthesize 3 nm PbSe QDs using the same reagents and methods as described for 7 nm and 5 nm
PbSe but yields were less than 3 mg. Sufficient UV/Vis samples could not be made from one
synthesis with yields so low and thus the material was not characterized.
Calculation of Theoretical Yield for QDs: A rough model was used to approximate the
theoretical yield of the various QD syntheses. The following model was used to estimate the
mass of PbTe or PbSe present in one QD.
𝑚𝑎𝑠𝑠 𝑃𝑏𝑇𝑒 = 𝑉𝑄𝐷 ∙ 𝐷𝑃𝑏𝑇𝑒
Where VQD is the volume of the quantum dot in units of nm3 calculated by assuming the
QDs were spherical and all QDs in a sample had the same radius (i.e. 5 nm). DPbTe was the

9
density of PbSe or PbTe found in the Sigma-Aldrich catalogue, but converted into g/nm3.11
Ligands are also present on each quantum dot and the mass was accounted for according to the
following.
𝑚𝑎𝑠𝑠 𝑂𝐴 = (𝐴𝑄𝐷
12
𝐴𝑃𝑏𝑇𝑒
) ∙ (𝑚𝑜𝑙𝑒𝑐. 𝑚𝑎𝑠𝑠 𝑂𝐴)
AQD is the area of the, presumably, spherical QD. APbTe is the area of a single unit of
PbTe or PbSe calculated with ionic radii reported elsewhere12
. APbTe was halved under the
assumption that each surface-occupying formula unit would contribute half its surface area to the
surface of the quantum dot. The ratio of the areas was multiplied by the mass of a single
molecule of oleic acid (in grams), assuming one OA molecule per formula unit on the surface.
The percent yield can be estimated using the previous two models.
%𝑦𝑖𝑒𝑙𝑑 =(𝑚𝑎𝑠𝑠 𝑦𝑖𝑒𝑙𝑑) −
𝑚𝑎𝑠𝑠 𝑂𝐴𝑚𝑎𝑠𝑠 𝑃𝑏𝑇𝑒 (𝑚𝑎𝑠𝑠 𝑦𝑖𝑒𝑙𝑑)
𝑚𝑜𝑙𝑎𝑟 𝑚𝑎𝑠𝑠 𝑃𝑏𝑇𝑒 ∙
1
𝑚𝑜𝑙 𝑃𝑏𝑂 ∙ 100%
“mass yield” is the mass of QDs purified from the reaction. “mass OA” and “mass PbTe”
are calculated according to the procedures above. “mol PbO” was calculated from the reagents
used in the reaction.
Preparation of PbTe QD thin films: To study the stability of PbTe QD thin films, samples
were made at every stage of processing and studied using FTIR or UV/Vis spectroscopy. PbTe
QDs were applied to cleaned glass and double-sided polished silicon substrates by spin coating.
A typical film was made by placing 2 drops of an octane solution of PbTe QDs with
concentration 100 mg/mL. The substrate was spun at 600 rpm for 2 minutes then 2000 rpm for 5
seconds. Oleate-capped films are 160 nm thick on average. If ligand exchange was performed,
the substrate was placed in a solution of 1,2-ethanedithiol (0.1 M) in acetonitrile for 15 minutes
to ensure complete ligand exchange. After ligand exchange, film thicknesses shrunk to 125 nm.

10
Since films are made by spin coating one layer, rather than layer-by-layer dip coating, ligand
exchange causes extensive cracking of the film due to film contraction. If the film was infilled
and over-coated with protective Al2O3, atomic layer deposition was performed until the overcoat
reached 20 nm.
Absorption Spectroscopy: Absorption spectroscopy measurements were performed with a
PerkinElmer Lambda 950 UV/Vis Spectrometer. Scans were performed between 2000 nm and
800 nm at rates of approximately 289 nm/min. Air-exposed measurements were performed at six
minute intervals for the first 1.5 hours, then at increasingly long intervals, up to once per day, for
the remainder of the week. Air-free samples were measured from every few hours to once a day
over the course of the week.
Transmission Electron Microscopy: Transmission electron microscopy (TEM) images of
PbTe QDs were taken with a Philips CM 20 at a 200 kV accelerating voltage. The samples were
prepared by drop casting a dilute solution of QDs dissolved in TCE onto the amorphous carbon-
coated side of copper grids purchased from Ted Pella, Inc. The films were allowed to dry and
organize in the glovebox. QD diameters were measured with the “measuring tool” of GIMP 2.8
image manipulation software.
Analysis of UV/Vis Absorption spectra: All quantitative measurements of UV/Vis
absorption features (i.e. position and full-width at half maximum), were done with Igor Pro 6.36
Multi-peak fitting software.
Results and Discussion
Stability of 5.5 nm Diameter Oleate-capped PbTe QDs in Solution: After synthesis and
thorough drying, the QDs were suspended in enough TCE to create a 0.6 mg/mL stock solution.
11
The stock solution was split into two samples, one meant for air exposure and one meant to be
stored in N2 conditions.
Both samples were placed in pyrex glass cuvettes having a 1 cm path length with a
Teflon-lined screw-cap lid. The cuvette was capped and never opened for the duration of the
study in the case of the QDs stored in nitrogen. The nitrogen sample remained inside the
glovebox for the entire study, except for 12 minute intervals required to measure the sample in
the UV/Vis spectrometer. The air exposed sample was stored in air with the cap off. A solvent
line was marked at the top of the cuvette so the TCE could be replenished before each
measurement to compensate for solvent evaporation.
To allow for TEM study of aged air-free QDs, a sample was stored in a glass vial with a
plastic screw cap lid alongside the cuvette. This sample was only opened after three days of
storage to create a TEM sample. This sample was never removed from the glovebox.
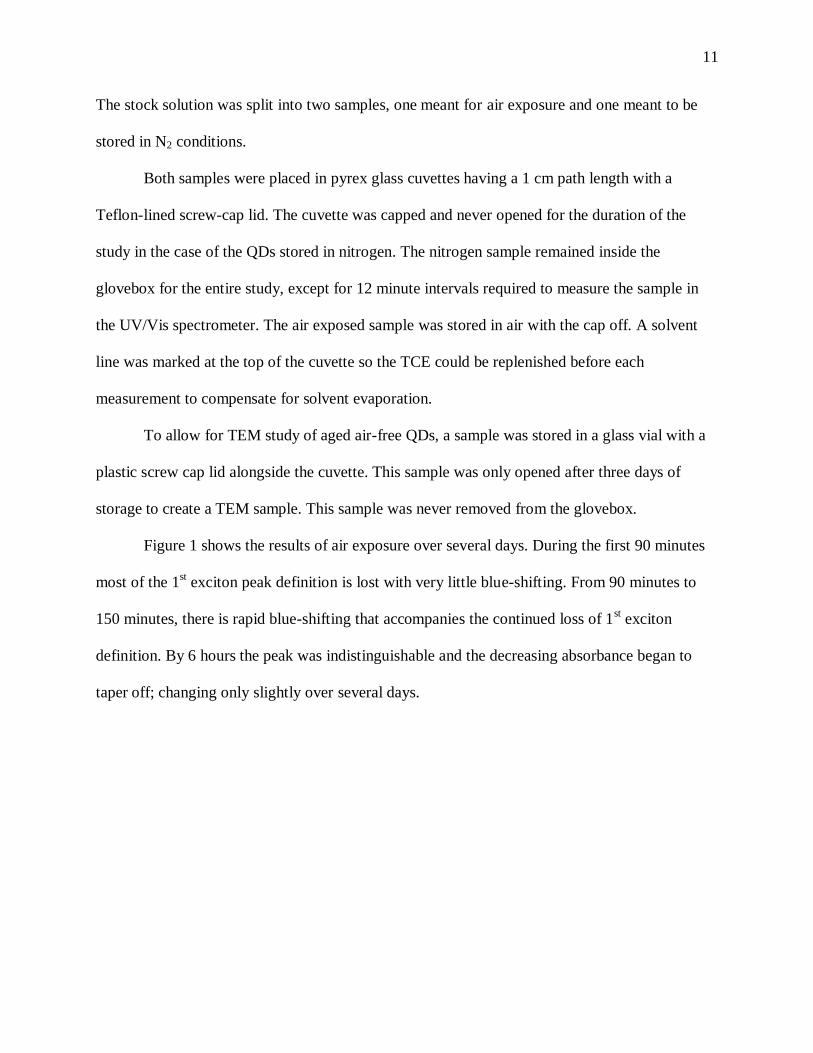
Figure 1 shows the results of air exposure over several days. During the first 90 minutes
most of the 1st exciton peak definition is lost with very little blue-shifting. From 90 minutes to
150 minutes, there is rapid blue-shifting that accompanies the continued loss of 1st exciton
definition. By 6 hours the peak was indistinguishable and the decreasing absorbance began to
taper off; changing only slightly over several days.

12
Figure 1: Absorbance spectra of Air-exposed 5nm diameter PbTe QDs over time
Figure 2: As made QDs (top left), After 3 days of air-exposure (top right), 3 days in nitrogen
(bottom)

13
Figure 1 suggests that the PbTe QDs are oxidizing in a non-uniform fashion. The
hypothesized mechanism can be visualized by imagining that the reaction rate is faster than the
rate that O2 can dissolve in the solvent. As a result, the PbTe QDs at the top of the cuvette
oxidize immediately partially turning into PbO or other oxidized species, preventing O2 from
reaching the rest of the sample. As a result, the uniform QD size distribution is lost because a
large amount of PbTe QDs have been oxidized while significant amounts remain purely PbTe, or
nearly so. Since the oxidation causes blue-shifting, as the effective size of PbTe begins to
decrease throughout the QDs, the UV/Vis features begin to broaden as some QDs retain their
original features while others shift towards higher energies. To test this hypothesis, the process
was repeated with the less labile PbSe. PbSe oxidation was hypothesized to be a slower process,
allowing the O2 to nearly saturate the solution before changes were observed. If this was true, not
only would we see slower oxidation rates, but the peaks would not broaden significantly because
QDs at all depths would have ample O2 to react with. Figure 2 contains TEM images of O2
exposed PbTe QDs. The images show that air exposed and non-exposed PbTe have no visible
differences. This figure confirms expectations that the UV/Vis blue-shifting is caused by the
decrease in effective size of PbTe by formation of PbO and other species rather than actual
destruction of the QD structure itself.

14
Figure 3: PbSe QDs exposed to air (Left) and stored in TCE. (Right) Stored in N2
Figure 3 shows the expected result for oxidation of PbSe. First, no noticeable blue-
shifting occurred until 48 hours of air exposure. Second, measurements of the full-width at half-
maximum values for the peaks show that there is no significant feature broadening in the PbSe
samples. Similar to PbTe, PbSe QDs stored in nitrogen exhibit no significant changes. Another
important test was to repeat this measurement with PbTe QDs while stirring. Unfortunately, our
setup is not yet equipped to do this measurement. Future studies interested in testing the
hypothesis that PbTe reaction with O2 is faster than the diffusion rate of O2 into TCE may
consider stirring the sample during the UV/Vis measurement with a small stir bar and plate fixed
inside the spectrometer.
The decrease in absorption over time is difficult to explain due to confounding of
variables. To measure the sample over several days while exposed to air, the cuvette was left
open to the atmosphere allowing solvent evaporation. A line was carefully drawn on the cuvette
beforehand so TCE could be replenished before each measurement. UV/Vis is very sensitive to
concentration, so perhaps the line was drawn slightly inaccurate. More exploration is necessary

15
to determine if the decrease in absorbance was due to measurement error or if another
mechanism is occurring.
Figure 4: Absorbance spectrum of air-free samples over time.
Figure 3 shows the effect of storing QDs in TCE under air-free conditions. The change is
minimal but there is small blue-shifting, increasing absorbance at higher energies, and decreasing
absorbance at lower energies. The behavior of the air-free QDs also indicates a small amount of
QD shrinking over time. The air-free shrinking appears to be more uniform than the air-exposed
samples since the peak does not appear to broaden, thus the size distribution does not seem to
increase. The oxidation could be due to a slow etching of the QDs in TCE rather than a rapid,
non-uniform oxidation in air, or some other more-controlled mechanism. The air-free samples
also show no significant differences from the “as made” samples by TEM. To test the hypothesis
that the QDs undergo a small amount of etching over time in TCE, the experiment was
performed in a different solvent.
Stability of 5 nm Diameter QDs Stored in Octane: To confirm the etching of QDs when
stored in TCE, QDs were also stored in octane both in air and in nitrogen. Since octane absorbs
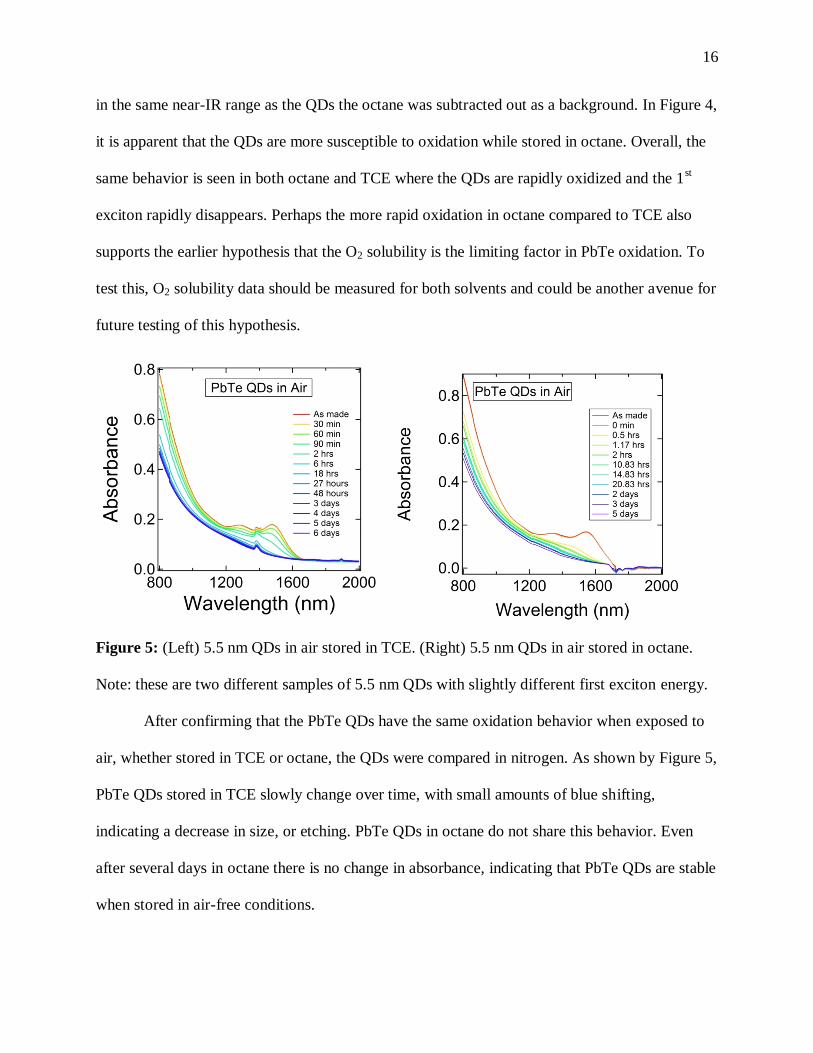
16
in the same near-IR range as the QDs the octane was subtracted out as a background. In Figure 4,
it is apparent that the QDs are more susceptible to oxidation while stored in octane. Overall, the
same behavior is seen in both octane and TCE where the QDs are rapidly oxidized and the 1st
exciton rapidly disappears. Perhaps the more rapid oxidation in octane compared to TCE also
supports the earlier hypothesis that the O2 solubility is the limiting factor in PbTe oxidation. To
test this, O2 solubility data should be measured for both solvents and could be another avenue for
future testing of this hypothesis.
Figure 5: (Left) 5.5 nm QDs in air stored in TCE. (Right) 5.5 nm QDs in air stored in octane.
Note: these are two different samples of 5.5 nm QDs with slightly different first exciton energy.
After confirming that the PbTe QDs have the same oxidation behavior when exposed to
air, whether stored in TCE or octane, the QDs were compared in nitrogen. As shown by Figure 5,
PbTe QDs stored in TCE slowly change over time, with small amounts of blue shifting,
indicating a decrease in size, or etching. PbTe QDs in octane do not share this behavior. Even
after several days in octane there is no change in absorbance, indicating that PbTe QDs are stable
when stored in air-free conditions.
17
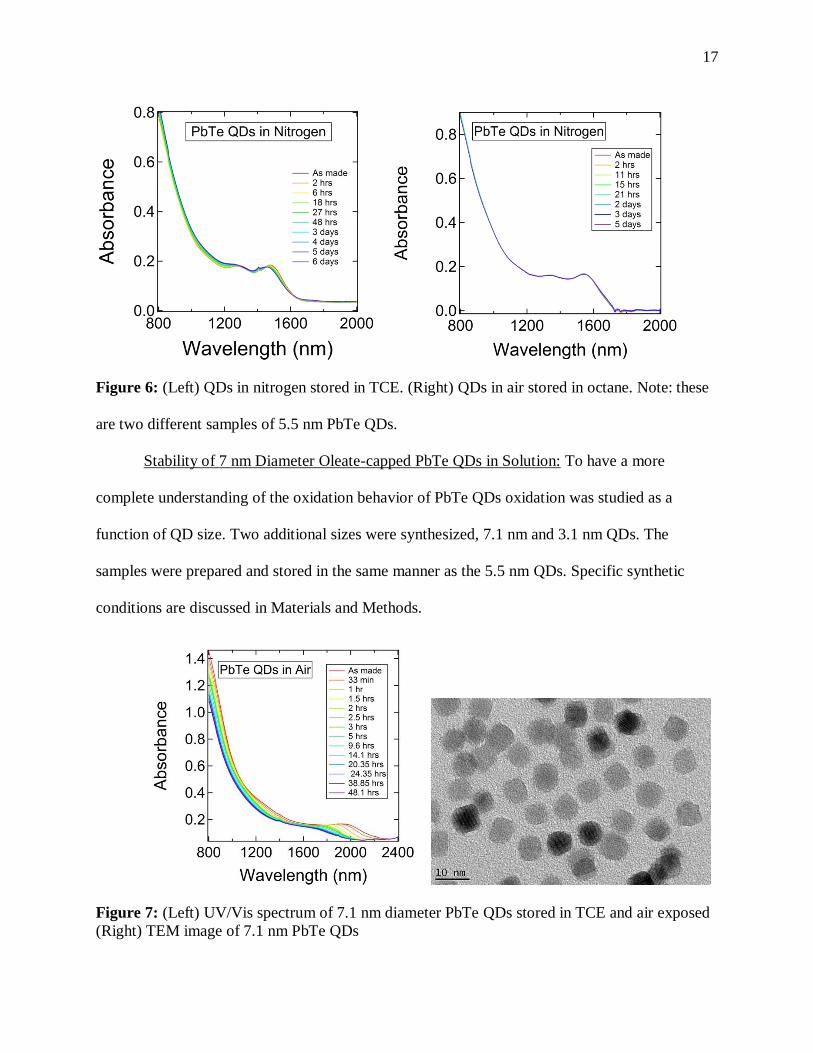
Figure 6: (Left) QDs in nitrogen stored in TCE. (Right) QDs in air stored in octane. Note: these
are two different samples of 5.5 nm PbTe QDs.
Stability of 7 nm Diameter Oleate-capped PbTe QDs in Solution: To have a more
complete understanding of the oxidation behavior of PbTe QDs oxidation was studied as a
function of QD size. Two additional sizes were synthesized, 7.1 nm and 3.1 nm QDs. The
samples were prepared and stored in the same manner as the 5.5 nm QDs. Specific synthetic
conditions are discussed in Materials and Methods.
Figure 7: (Left) UV/Vis spectrum of 7.1 nm diameter PbTe QDs stored in TCE and air exposed
(Right) TEM image of 7.1 nm PbTe QDs

18
Figure 7 shows that 7.1 nm QDs oxidize in a similar fashion as 5.5 nm QDs. The 1st
exciton features in the UV/Vis rapidly blue shift and broaden. To compare the oxidation
behavior of PbTe to that of PbSe, 7 nm PbSe QDs were studied as well.
Figure 8: 7 nm PbSe QDs stored in air (left) and nitrogen (right)
Similar to 5 nm PbSe, 7 nm PbSe QDs oxidize more slowly in air than their PbTe
counterparts. Interestingly, 7 nm PbSe QDs oxidize faster than 5 nm PbSe and have a much more
pronounced decrease in absorbance over time. The decrease in absorbance is not accompanied by
a broadening, since the full width at half maximum does not change significantly, and appears to
level off after two days of air-exposure. The sudden increase in absorbance may be due to
measurement error when refilling solvent after 20 days of evaporation. It is also important to
note that no significant changes in the absorbance spectrum occurred when 7 nm PbSe QDs were
stored in nitrogen.
Stability of 3 nm Diameter Oleate-capped PbTe QDs in Solution: The absorbance
spectrum and TEM images for the 3 nm diameter QDs were prepared in the same manner as the
5.5 nm diameter ones.

19
Figure 9: Absorbance of air-exposed 3 nm diameter PbTe QDs over time.
Figure 10: As made 3 nm diameter QDs (Left) 3 days in nitrogen (Right)
Quantum dots with 3 nm diameters show similar behaviors to the 5.5 nm QDs. First,
there is a loss in 1st exciton definition and decrease in absorbance. It is difficult to see any
definitive blue-shifting since the 1st exciton is close to the absorption take-off at the edge of the
visible spectrum.
Unlike the 5.5 nm QDs, the 3 nm diameter QDs showed a partial precipitation after
several hours of air-exposure as indicated by a black powder at the bottom of the cuvette after 9
hours of exposure. The absorbance drop is noticeably different than the normal drop caused by
oxidation because the y-intercept changes more than it did at previous intervals. Due to the

20
sudden precipitation, TEM samples made from the air-exposed samples after 3 days of exposure
would not show the precipitate and would not be indicative of the true effect of air-exposed
aging. Thus, a TEM sample was not created for 3 days of air-exposure.
Air-free samples exhibited slow blue-shifting and an increase in absorbance similar to the
5.5 nm QDs, in Figure 8. The peak width does not appear to broaden, similar to the etching of
5.5 nm QDs in TCE. A change in this manner would likely not be visible by TEM on such a
short time interval, again confirmed by TEM in Figure 7.
Figure 11: Absorbance of 3 nm QDs stored under nitrogen over time.
For comparison of PbTe QDs to PbSe QDs, 3 nm PbSe syntheses were attempted but
offered no significant yields under similar reaction conditions. Many QD studies use small doses
of highly reactive phosphine precursors (i.e. diphenylphosphine) to increase the yields of PbSe.1,2
Since the use of diphenylphospine causes uncontrolled growth of PbTe, diphenylphospine was
avoided for all synthesis procedures to allow PbTe and PbSe to be compared in similar ligand
environments. Unfortunately, the lack of diphenylphosphine during the small PbSe QD synthesis
prevented yields from being significant enough to facilitate measurement.

21
Figure 12 contains a quantitative summary of the results of the solution phase stability
studies. PbTe (Blue) is compared with PbSe (Red) as a function of QD diameter. Additionally,
Figure 12 contains plots of the 1st exciton absorption maximum position as a function of air
exposure. The full-width at half maximum (FWHM) for the 1st exciton feature was measured as a
function of air exposure. Here, FWHM is a measure of the size distribution for each type of QD.
It is important to note that the last values of FWHM calculated for PbTe samples have somewhat
erratic behavior because the program used for peak analysis (Igor Pro 6.36 Multi-Peak fitting)
had great difficulty identifying the peak after significant air exposure. Due to the erratic behavior
quantitative measurements of PbTe samples could no longer be performed after relatively short
air exposure times.
Figure 12: (Left) Plot of 1st exciton peak position vs time in air (Right) Plot of full-width at half
maximum values for 1st exciton features vs time in air. Both plots contain comparisons of PbTe
(Blue) to PbSe (Red) and contain all available sizes for each QD. PbTe plots have fewer points in
regions of long air exposure because the 1st exciton features become very broad and difficult to
identify, preventing accurate measurement.
Stability of PbTe QD thin films: The goal of research of PbTe QDs is to explore their
viability as solar cells, field-effect transistors (FETs), and other solid-state electronics. Thus, it is
paramount to characterize the stability of this material in the solid state in addition to the solution

22
phase. Stability in the solution phase allows us to understand the decay mechanisms that will be
faced by solutions of PbTe QDs that are likely to be used for roll-to-roll printing and other
manufacturing techniques so that proper precautions may be taken to protect the material during
pre-manufacturing stages. Similarly, it is important to understand the decay that thin films may
experience during the manufacturing process. Understanding the sensitivity of each stage can
provide guidance towards what stages must be protected and how much. Our current method of
field-effect transistor production involves three stages: spin coating of oleate-capped QDs, ligand
exchange with 1,2-ethanedithiol (EDT), and atomic layer deposition of Al2O3 to infill and
overcoat the thin film.
To study each stage of manufacturing with fresh, non-air-exposed samples seven films
were made from the same batch of PbTe QDs (all QDs were made during the same synthesis).
Two films were made on double-sided polished silicon and five were made on glass. All seven
substrates were spin-coated with the same conditions. A few samples were removed at each stage
of processing for air-exposure and characterization, resulting in one sample continuing through
all stages. It should be noted that the entire yield of the reaction was used to make all seven films
from one synthesis and no solution phase UV/Vis was taken. As made QD size was determined
using the 1st exciton absorption peak of an oleate-capped film stored in nitrogen.
Stability of 5 nm Diameter Oleate-capped PbTe QD thin films: Optical characterization
and film stability was measured using UV/Vis absorption spectroscopy by simple absorption
measurements. Integrating sphere was not used to determine reflectance changes. Oleate-capped
PbTe films prepared in this manner are 160 nm thick, see Figure 15.

23
Figure 13: (Left) Absorption spectrum of Oleate-capped PbTe thin film stored in nitrogen
(Right) Image of film. The coloring is a result of the angle when the picture was taken. Straight-
on views show the film is black.
Figure 13 shows the stability of oleate-capped PbTe thin films stored in nitrogen. The
film was made in the glovebox and sealed in a conflat flange and never removed for the
remainder of the study to prevent air exposure. As expected, the films do not appear to change
significantly during the course of the study. Taking a careful look at the traces, it is clear that
there is no pattern to the changing spectra over time. Since the film had to be carefully
repositioned for every measurement, the random changes in the spectrum can be attributed to
small deviations in film position. For convenience, the full-width at half-maximum (FWHM) and
peak position are noted in eV on the figure for quick comparison to other films.
Time 0: Position: 0.826 eV
FWHM: 62.3 meV

24
Figure 14: (Left) Absorption spectrum of Oleate-capped PbTe thin-film exposed to air.
During the measurement of air exposed films, the films were not moved for the first hour.
Thus, the relative peak positions are accurate for at least those time frames. The oleate-capped
thin films appear to degrade in the presence of air in the same manner as the QDs in solution.
The films decay significantly faster, showing appreciable changes to the absorption features after
only 6 minutes of air exposure. Six minutes is the fastest spectra can be taken using this
spectrometer in this wavelength range. Faster oxidation is expected because the solubility and
diffusion rate of O2 in various solvents is no longer a factor and films are exposed directly to
atmospheric levels of oxygen. It is important to notice the shape of the UV/Vis 1st exciton feature
in these films. The spectra resemble the solution phase spectra because the QDs are capped with
insulating ligands, preventing electronic communication of QDs and giving rise to spectra that
are similar to a collection of isolated QDs in solution. Notice that though the peak position did
not change significantly, the air exposure during the 10 second sample transfer, from the
glovebox to the spectrometer, caused peak broadening of 20.21 meV. It is clear that PbTe QD
thin films are significantly more susceptible to oxidation than solutions.
Time 0: Position: 0.827 eV
FWHM: 84.4 meV

25
Figure 15: Scanning electron microscope images of PbTe QD thin films. (Top Left) Top-down
image zoomed out. (Top Right) Top-down image zoomed in. (Bottom) Cross-section with
average thickness of 160 nm
Stability of 5 nm Diameter 1,2-ethanedithiol-capped PbTe QD thin films: The next stage
of processing, ligand exchange, was explored after soaking fresh oleate-capped thin films in a
0.1 M solution of 1,2-ethanedithiol (EDT).
26
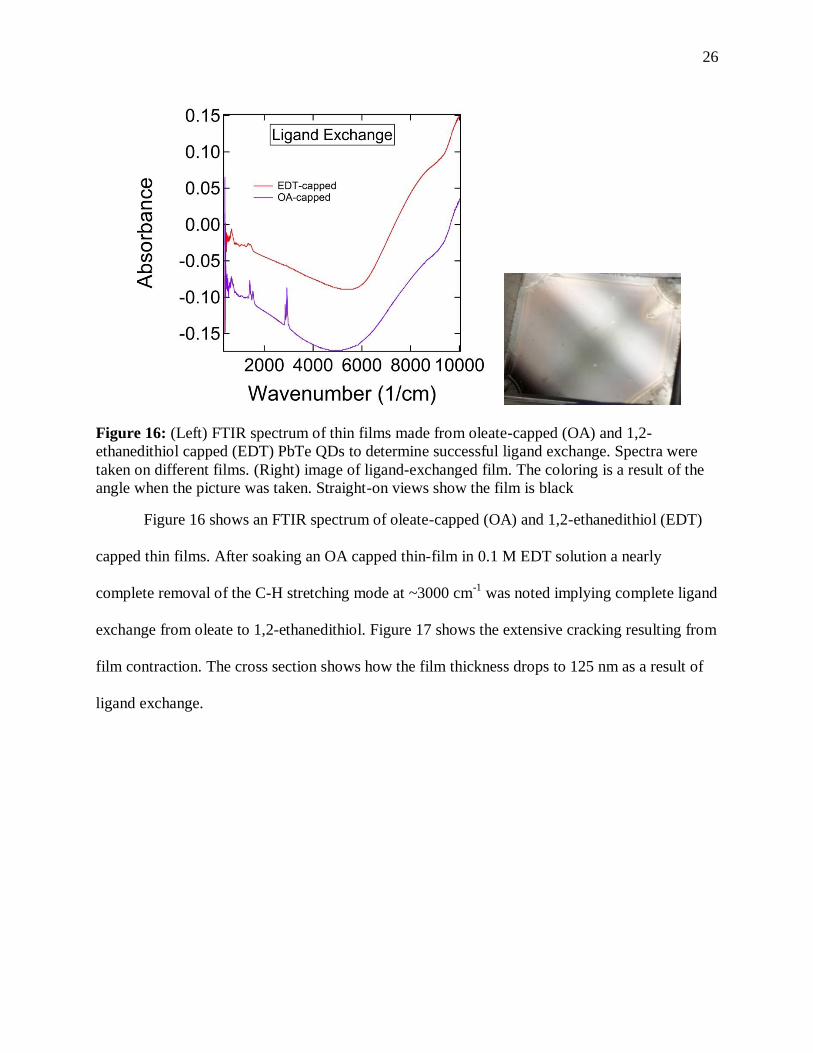
Figure 16: (Left) FTIR spectrum of thin films made from oleate-capped (OA) and 1,2-
ethanedithiol capped (EDT) PbTe QDs to determine successful ligand exchange. Spectra were
taken on different films. (Right) image of ligand-exchanged film. The coloring is a result of the
angle when the picture was taken. Straight-on views show the film is black
Figure 16 shows an FTIR spectrum of oleate-capped (OA) and 1,2-ethanedithiol (EDT)
capped thin films. After soaking an OA capped thin-film in 0.1 M EDT solution a nearly
complete removal of the C-H stretching mode at ~3000 cm-1
was noted implying complete ligand
exchange from oleate to 1,2-ethanedithiol. Figure 17 shows the extensive cracking resulting from
film contraction. The cross section shows how the film thickness drops to 125 nm as a result of
ligand exchange.

27
Figure 17: (Top Left) Zoomed out Top-down image. (Top Right) zoomed in Top-down image.
(Bottom Left) closer look at cracking Top-down image. (Bottom Right) Cross section with
average film thickness of 125 nm.
The UV/Vis spectra of films of EDT-capped PbTe QDs exhibit some interesting changes
when compared to solution phase and thin films of QDs with insulating ligands. Inspection of the
UV/Vis spectra of EDT-capped films stored in nitrogen show that ligand exchange causes
significant red shifting (70 meV) and broadening (8.7 meV) of the 1st exciton compared to OA-
capped films. Since EDT is a very short ligand, it allows the PbTe QDs to couple to each other
electronically. This coupling may cause the observed red shifting because the electron can now
sample a larger amount of semiconductor material. Broadening can be explained by the
distribution of nearest neighbors in the disordered arrays of QDs that form during the ligand
exchange. Since not all QDs have coupling to the same number of neighbors, due to the long-

28
range film disorder, the 1st exciton feature broadens. Currently, further experiments are being
pursued to be certain that red shifting is caused by coupling and not something else, like fusing
of neighboring QDs.
Another interesting feature comes from the comparison of air exposed and non-exposed
EDT-capped films in Figure 18. The 10 seconds of air exposure during sample transfer from the
glovebox to the spectrometer caused a blue shifting of 65 meV and broadening of 28.1 meV.
This change is significantly larger than the difference between oleate-capped films that were and
were not exposed to air. It is evident that PbTe QD thin films that are capped with 1,2-
ethanedithiol are much more sensitive to oxidation that their oleate-capped counterparts. Once
again, it is important to note that variation in absorbance for EDT-capped films stored in nitrogen
is likely due to small deviations in the position of the sample between measurements. Air
exposed samples were not moved for the first hour, and thus the relative positions are accurate.
Normalizing the spectra at 1600 nm is evidence since all spectra lay on top one another,
indicating no significant changes over time, see Figure 18 below.
Time 0: Position: 0.757 eV
FWHM: 93.1 meV
Time 0: Position: 0.822 eV
FWHM: 122 meV

29
Figure 18: (Left) UV/Vis spectra of air exposed EDT-capped PbTe. (Right) EDT-capped PbTe
stored in nitrogen. (Bottom) Normalized EDT-capped stored in nitrogen
Stability of 5 nm Diameter Al2O3-infilled and overcoated PbTe QD thin films: One film
was carrier through the entire manufacturing process: deposition of oleate-capped film, ligand
exchange with 1,2-ethanedithiol to remove the insolating oleate ligands, and atomic layer
deposition of Al2O3 to infill and overcoat with a protective oxide layer. After using atomic layer
deposition to infill the PbTe QD thin film and provide a 20 nm overcoat, the film was
characterized in the same UV/Vis spectrometer over the course of several months, and is
continuing to be measured at the time of this writing.
Figure 19 exhibits several interesting features. Most importantly, the thin film of PbTe
QDs has remained optically stable over the course of 3.5 months, and counting. The application
of a 20 nm overcoat of Al2O3 has managed to stabilize the film against oxidation. It has now
been shown that PbTe films, similar to PbSe devices1, can be made air stable by atomic layer
deposition, a technique already used in industry.
It is also notable that the peak red shifted by 21 meV but did not broaden significantly
(1.9 meV) by simple infilling and overcoating with Al2O3. Perhaps filling the space between

30
quantum dots with an inorganic matrix in addition to an organic matrix increased the coupling
between PbTe quantum dots, or some other effect could have occurred as the result of the atomic
layer deposition technique. More tests would be necessary to determine the cause definitively.
Figure 19: (Left) UV/Vis spectra of EDT-capped ALD-overcoated PbTe QD film stored in air
for 3.5 months. (Right) Image of film. The gold color is a result of the angle when the picture
was taken. Straight-on views show the film is black.
Conclusions
This study sought to expand the knowledge of the PbTe quantum dot stability by
characterizing three sizes of PbTe quantum dots with 3.1 nm, 5.5 nm, and 7.1 nm diameters. All
PbTe quantum dots exhibit blue-shifting, loss in absorbance, and broadening of the 1st exciton
peak upon air exposure. This behavior indicates rapid oxidation kinetics comparable to the rate
of O2 diffusion into the solution or, in the solid state, diffusion through the thin film. These
oxidation reactions occurred more rapidly than the oxidation of similar PbSe samples in solution.
All QDs show little change when stored in nitrogen. Most changes can be attributed to slow
etching of QDs by particular solvents or small measurement errors during the analysis of films.
Thus, PbTe QD stability is significantly improved in the absence of air.
Time 0: Position: 0.736 eV
FWHM: 95.0 meV

31
As PbTe films proceed through various processing conditions, the air stability and overall
optical characteristics of these films change. After the film is freshly made the optical spectra
look similar to QDs in solution, due to the large insolating oleate ligands preventing coupling of
neighboring QDs. Oleate-capped QDs exhibit appreciable oxidation through changes in the
optical spectra after 6 minutes in air.
Exchanging oleate ligands for 1,2-ethanedithiol (EDT) is the next step in device creation.
These films are soaked in 0.1 M EDT solution for 15 minutes, ligand exchange is confirmed by
FTIR. Ligand exchange creates large cracks in the film, visible by electron microscopy. These
films exhibit 70 meV red shifting and 8.7 meV increase in full-width at half-maximum upon
ligand exchange, suggesting increased coupling between QDs in the film. Air stability is greatly
reduced after ligand exchange and significant changes in optical spectra are seen immediately
upon air exposure (at least 10 seconds).
Infilling and overcoating a 1,2-ethanedithiol capped film with 20 nm of Al2O3 further
changes the properties of the film. The 1st exciton peak red shifts by 21 meV and broadens by 1.9
meV, again suggesting increased coupling of the QDs in the film. Additionally, the film shows
stability against oxidation, measured over 3.5 months and counting. Atomic layer deposition of
Al2O3 is now a viable option to stabilize PbTe QD thin films for long-term use.
Future Studies
Since the goal is to use PbTe QDs for high performance field-effect transistors and solar
cells, future studies will explore the electrical properties of these films through the various
processing stages to determine carrier type, carrier density, carrier mobility, and other important
properties for electronic devices. These electrical studies will determine if PbTe maintains its

32
unique and promising properties throughout the stages of film production; and if so, lead us
towards the next step in the use of this promising material.
Acknowledgements
I would like to express my gratitude towards all the members of my group for the
contributions they have made towards the progress of my project. First and foremost, I would
like to thank my principal investigator Professor Matt Law for allowing me to join the group and
providing me with an interesting and fulfilling project along with the freedom to explore the
aspects I found most interesting. I would also like to thank Juliette Micone, who is currently
focusing on the electrical characterization of these PbTe QD thin films. We have worked
extensively together on the synthesis of high quality PbTe QDs with usable yields. She
discovered the key to synthesis of 3.1 nm PbTe QDs was the rapid cooling of the reaction vessel
with liquid nitrogen. I would also like to thank Jason Tolentino, Sam Keene, and Juliette Micone
for taking the SEM and TEM images of my QDs. I would like to thank all present and former
members of the Law group for our valuable discussions. Finally, I would like to thank the
University of California Leadership Excellence through Advanced Degrees scholarship program
for funding me and allowing me to focus and pursue this fascinating research.
References
1. Liu, Y., Tolentino, J., Gibbs, M., Ihly, R., Perkins, C. L., Liu, Y., Crawford, N.,
Hemminger, J. C., Law, M. PbSe quantum dot field-effect transistors with air-stable
electron mobilities above 7 cm2 V-1 s-1. Nano Letters, 13, 1578-1587 (2013).
2. Otto, T., Miller, C., Tolentino, J., Liu, Y., Law, M., Yu, D. Gate-dependent carrier
diffusion length in lead selenide quantum dot field-effect transistors. Nano Letters, 13,
3463-3469 (2013).
3. Nozik, A. Quantum dot solar cells. Physica E. 2002, 14, 115-120.
4. Nozik, A.; Beard, M.; Luther, J.; Law, M.; Ellingson, R.; Johnson, J. Semiconductor
Quantum Dots and Quantum Dot Arrays and Applications of Multiple Exciton
Generation to Third-Generation Photovoltaic Solar Cells. Chem. Review. 2010, 110, 6873
– 6890.
5. Ozin, G.; Arsenault, A. Nanochemistry; RSC Publishing, 2005.

33
6. Shockley, W.; Queisser, H.; Detailed Balance Limit of Efficiency of p-n Junction Solar
Cells. Journal of Applied Physics. 1961, 32, 510-519.
7. Wise, F. Lead Salt Quantum Dots: the Limit of Strong Quantum Confinement. Acc.
Chem. Res. 2000, 33, 773-780
8. Stewart, J.; Padilha, L.; Bae, W.; Koh, W.; Pietryga, J.; Klimov, V. Carrier Multiplication
in Quantum Dots within the Framework of Two Competing Energy Relaxation
Mechanisms. J. Phys. Chem. Lett. 2013, 4, 2061-2068.
9. Choi, J.; Luria, J.; Hyun, B.; Bartnik, A.; Sun, L.; Lim, Y.; Marohn, J.; Wise, F.; Hanrath,
T. Photogenerated Exciton Dissociation in Highly Coupled Lead Salt Nanocrystal
Assemblies. Nano Letters. 2010, 10, 1805-1811.
10. Luque, A.; Marti, A.; Nozik, A. Solar Cells based on Quantum Dots: Multiple Exciton
Generation and Intermediate Bands. MRS Bulletin. 2007, 32, 236-241
11. Sigma-Aldrich Chemical Catalogue Accessed 5-30-2015
12. Yoder, Claude. Metallic, Covalent, and Ionic Radii(r)*
http://www.wiredchemist.com/chemistry/data/metallic-radii Accessed 5-30-2015