Embed Size (px)
Citation preview

Dr Katie Medcalf CEnv
Environment Director: Environment Systems
www.envsys.co.uk
GIS, Remote Sensing and
Ecosystem Service Modelling –useful tools for the ecologist.
CIEEM Welsh Section Meeting Aberystwyth University
24th February 2014

Leading edge environmental & geographic information consultancy & services
The Issue
More need for complete habitat / land cover data than ever before
Wales
Environment
White Paper
Biodiversity 20/20 Targets
NEA Ecosystem Approach
More pressure on our land

Leading edge environmental & geographic information consultancy & services
Knowledge of our habitats and how they function
Making EO work for UK biodiversity
http://jncc.defra.gov.uk/page-5563

Leading edge environmental & geographic information consultancy & services
Ecosystems approach?
$Economic
SocietyEnvironment
The ecosystem approach
© CoPE
Pro
vis
ion
ing
Cu
ltu
ral
Reg
ula
tin
g
Supporting

Leading edge environmental & geographic information consultancy & services
• Place based approach to ecosystem service mapping and opportunities analysis
looking at the contribution of each individual area of land.
SENCE: Our ApproachSpatial Evidence for Natural Capital Evaluation
• Use expert knowledge and local knowledge to weight data layers, which
combined characterise a service. (Rule base)
http://jncc.defra.gov.uk/page-6241

Leading edge environmental & geographic information consultancy & services
Regulation of Water Runoff and Flow
Leading edge environmental & geographic information consultancy & services
Using satellite imagery and air
photography to map habitats
• Remote sensing and
habitat mapping can
be traditional – using
aerial photographs
maps.google.co.uk
• But there is much
more information in
satellite images

Leading edge environmental & geographic information consultancy & services
How does Remote Sensing work
- Electromagnetic radiation from the Sun is reflected off the
surface, straight to the sensor
1000 w/m2
267 w/m2
Surface Reflectance = 1000 / 267
= 0.267 %
- Measured radiance at sensor = percentage of
reflectance by surface material

Leading edge environmental & geographic information consultancy & services
Productivity is related to NIR light and leaf
properties
0
10
20
30
40
50
60
70
80
90
100
400 500 600 700 800 900%
Re
fle
cta
nc
e
Wavelength (nm)
Health
y Leaf
Leaf
With
Rust
Soil

Leading edge environmental & geographic information consultancy & services
Seeing the world differently
Ref: Lillesand and Kiefer, 2004

Satellite resolution images slide
SPOT NIR/SWIR/Green (10m resolution)Landsat NIR/SWIR/Green (30m resolution)
World View RGB 1.84 m resolution bands

Data used
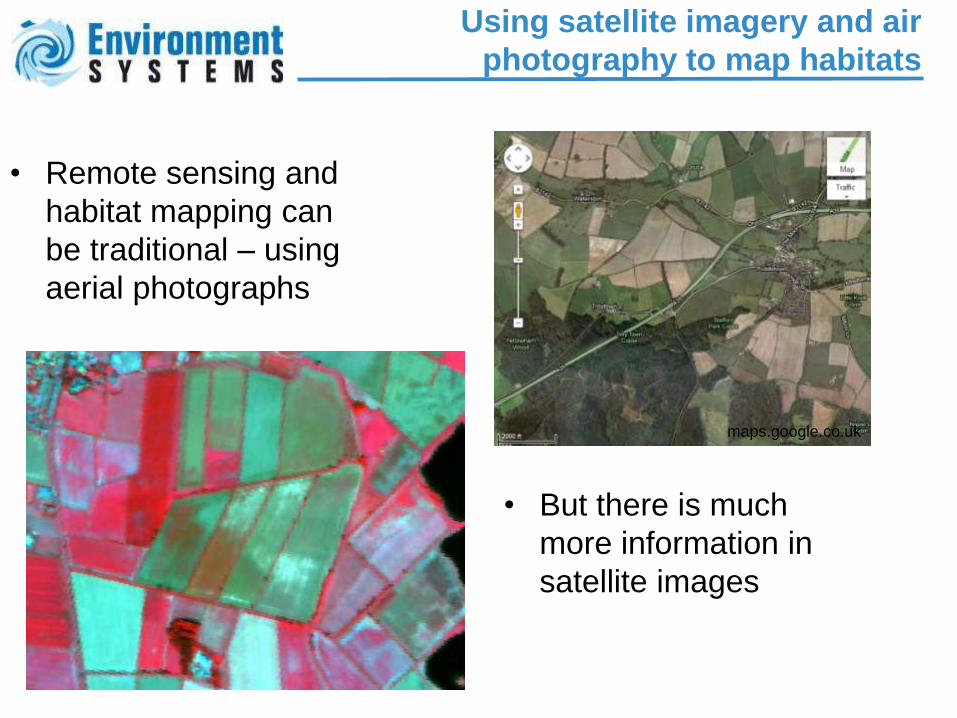
Anguilla classification
Urban maskHabitat
Main Habitats
Sub-Types
Fuzzy Gradations
Subdivide bySoil Type
Imagery
BeachHigh NIRHigh RedMed NDVI
IronshoreMed-High NIRHigh RedMed-Low NDVI
PondLow NIRLow SWIRLow NDVI
MangroveMed-Low SWIRMed-Low RedNDVI range
Limestone ScrubMed SWIR
Limestone ThicketHigh SWIR
Dry ForestMed-High ShadeNDVI differenceHigh SWIR/NIR
Scrub w. CactiHigh SWIRMed NDVIMed NIR
Scattered ScrubHigh StDev Red
Limestone PmentLow ShadeMid-High RedLow SWIR/NIR
Dune ScrubProximity to Beach
Dune ThicketProximity to Beach
Scrub with Thicket CharacteristicsFuzzy
Thicket with Dry Forest CharacteristicsRelaxed thresholds
Dune Scrub with Thicket CharacteristicsFuzzy
Agriculture &Bare Ground
AgricultureMed-High RedMed NDVILow SWIR/NIR
Bare GroundHigh RedHigh NIRMed NDVI
AnthropogenicVery High RedLow NDVI
Overlap with thematic layer: mineral soils
Coast

Habitat Map

Leading edge environmental & geographic information consultancy & services
Habitat mapping in Wales: Gwylio Project
Wales mapping• Wales wide coverage
• Uses an image stack of satellite imagery
• CIR aerial photography
• Existing habitat data to update the Phase 1 habitat map (137 classes)
Original Phase 1 data set from field work in the 1990’s
New Phase 1 data set from satellite imagery

Leading edge environmental & geographic information consultancy & services
Updating the Phase 1 habitat Map
Merging the new data and the old to get the
best possible project
Understanding
The context of the habitats,
their plant assemblages and
characteristic appearance in
remote sensing terms
Object Based Image Analysis (OBIA) Productivity,
heterogeneity, seasonal change, position in landscape,
characteristic reflectance values

Leading edge environmental & geographic information consultancy & services
CHECKS AND ADJUSTMENTS
Checking conifer v broadleaved woodland
Checking scarce habitats
Producing thematic layer
Separating of map and boundary layers
Review by CCW staff
Simplifying and streamlining output
Adopting old lowland grassland boundaries
Comparing habitat distribution with Phase 1
MAP PREPARATION
Satellite Map
Cleaning up hedges
Checking steep north-facing slopes
Checking cloud shadows
Checking project edges
Stitching 49 projects into 15 blocks
DELIVERABLES
GIS Data
Sample stack
Web Mapping
Posters
Cu
sto
me
rs
& P
art
ners
Map
Data Fusion
Iteration 1
Map
Data Fusion
Iteration 2
Map
Data Fusion
Iteration 3
Minimising habitat mosaic labels
Manual edits
Contracted out

Leading edge environmental & geographic information consultancy & services
TRADITIONAL SURVEY METHOD SATELLITE - SURVEY METHOD
Image Stack
March 2014
July 2014
April 2015
Planning field visit
Field survey
Digitising map
Planning field visit
Field survey
Digitising map
Planning field visit
Field survey
Digitising map
Planning field visit
Field survey
Digitising map
Expert checking (entire map)
Mosaicing sheets from different surveyors
Publication
Customers
& Partners
Satellite Image Analysis
Map data fusion
Updating GIS / web
Customers
& Partners
Feedback / Citizen science
Map Evidence Base
Image – Image
Change detection
Field survey
LANDSAT 8 (NASA),
Sentinel (ESA)
+ other sensors
Expert checking (field)
Possibly contracted out
FR
EE

Leading edge environmental & geographic information consultancy & services
MA
P (
PO
INT,V
EC
TO
R)
DA
TA
IMA
GE
(R
AS
TE
R)
DA
TA
Map Evidence Base
Customers
& Partners
Map data fusion
Updating GIS / web
NRW expert quality control
Image – Image
Change detection
Image Analysis
Optical Imagery
March 2014
July 2014
April 2015
EnMAP
Hyperspectral
Air Photos
2006
2008
2014
UAV Imagery
NEXTmap
Height Data
Radar Imagery
March 2014
July 2014
April 2015
Habitat
Field Survey
Habitat
Monitoring
OS Mastermap,
Soils, Geology
Landmap
Monitoring
Open Access
Updates
Glastir
Monitoring
Airborne
Hyperspectral
Airborne
LIDAR
FR
EE
sate
llit
e d
ata
FE
ED
BA
CK
via
we
b m
ap
pin
g t
oo
ls /
ap
ps
FR
EE
fro
m w
ale
s P
SM
A
NFI Forest
Inventory
Harvesting and
Planting data

Leading edge environmental & geographic information consultancy & services
Conclusions
EO is a useful part of the environmental analysis tool box.
But:
It is not magic and we should not be treated as a total solution
• Habitat maps from remote sensing cannot be produced without field work
• Habitats maps from remote sensing cannot be produced without ecologist / a great understanding of ecological and habitat processes
• We need to build a knowledgeable user base rather than over promise
• RS products are not direct equivalent of field work products – they need to be understood and used well
Gwylio data Making EO Work for UK
Biodiversity Phase 3
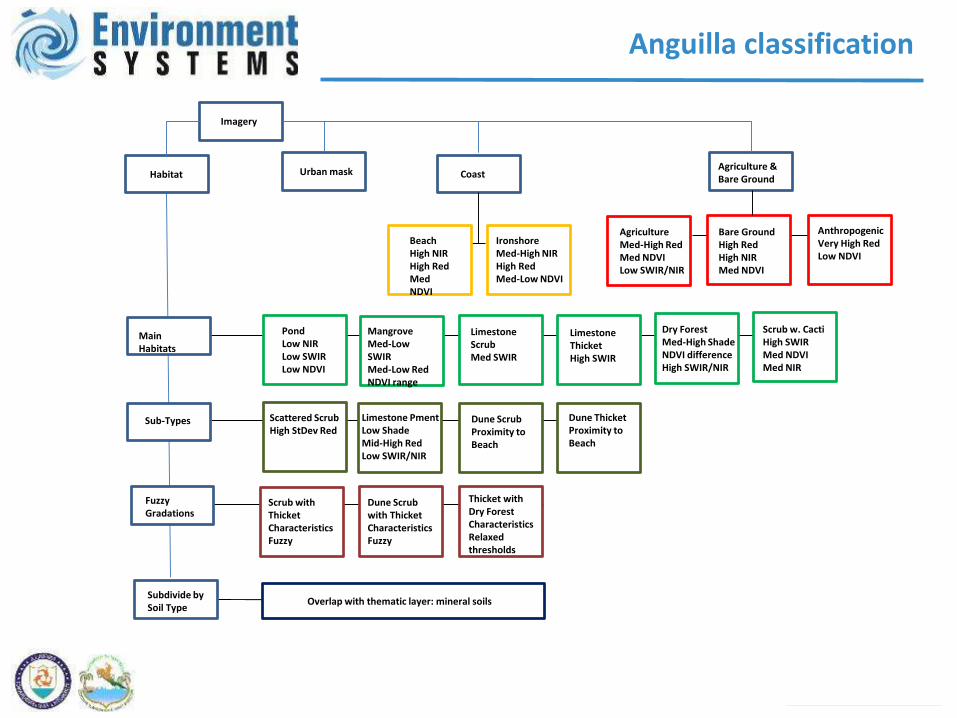
Opportunities
• EO is already a useful tool, as future data
availability increases (e.g. the Sentinel
satellites) potential for its use is going to
grow
• We as field ecologist need to accept the
challenge of these methods and use them
to increase efficiency – the ecosystem
approach calls for more and better data in
order to help preserve the environment,
our culture and our economy
• Remote Sensing is a Useful tool which
will help us map, monitor and model our
habitats into the future

Leading edge environmental & geographic information consultancy & services
Thank You