Embed Size (px)
Citation preview
GIS
Matthew RosencransTom DiLiberto
Outline
• What is GIS?• What can we do with it?• What data can we work with?

GIS
• Geospatial Information System– Computer-based GIS dates to the 1960s-1970s– Had advanced greatly with increased computer-
power.– Very popular across a spectrum of groups• Governments, Scientists, NGOs, For-Profit, Media

GIS
• Geospatial Information System– Computer system that allows user to:
• Analyze, organize, manipulate and disseminate geographic data.
– System – Collection to Analysis to Mapping– 3 parts
• Data to digitize• Computer hardware to store data• Computer software
• Pay and FREE GIS software available– Microsoft ArcGIS ($$)– Quantum GIS (Free)

GIS
• Collection– Many different types of data ingestible.• Vector data (will describe later)

GIS• Collection– Many different types of data ingestible.• Raster data (will describe later)
GIS
• Analysis:– Take different geospatial (and not) data>>>
perform analysis>>> develop NEW geospatial information
GIS
• Mapping–Turn new information into new
geospatial products•Maps, reports, statistics
GIS
–What type of groups would find GIS useful?•…….
–Why?
GIS
–What types of maps are there?•Literal•Generalized•Personal
GIS
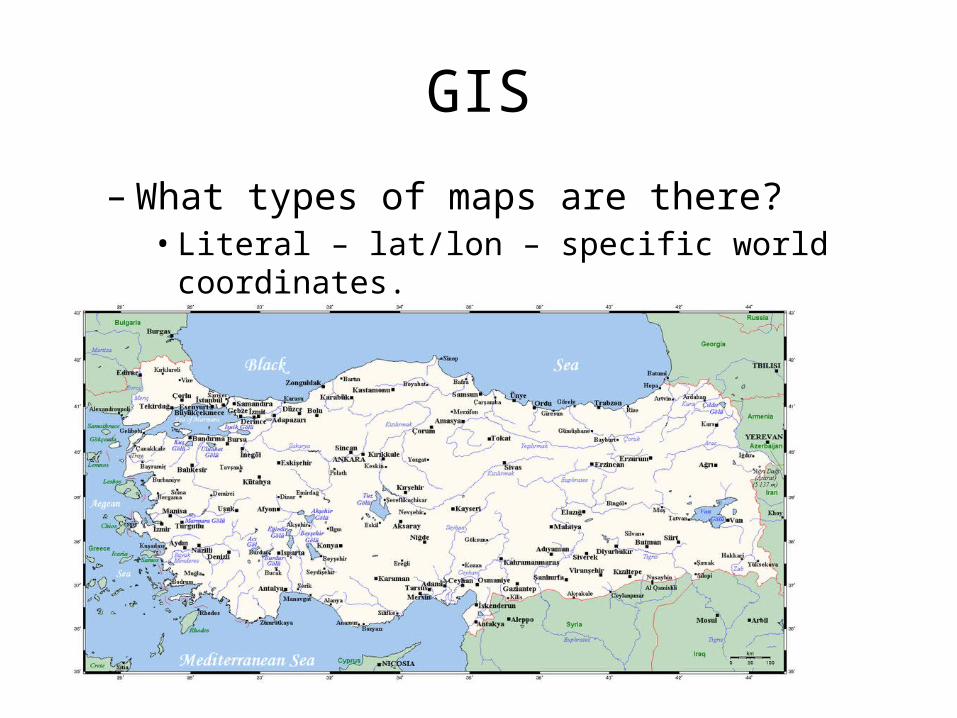
– What types of maps are there?• Literal – lat/lon – specific world coordinates.
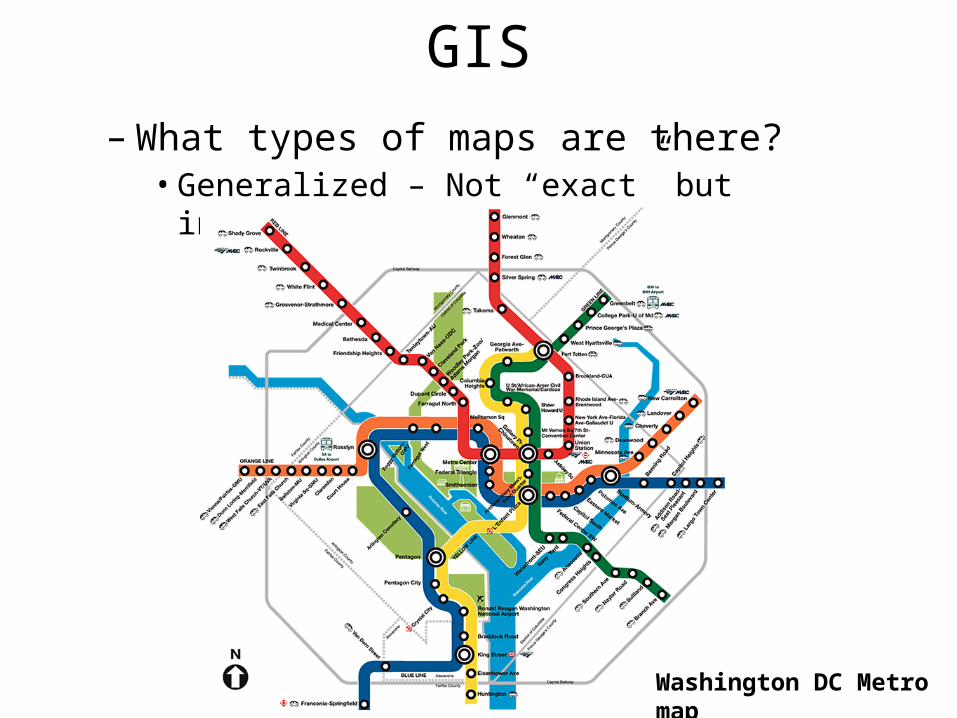
GIS– What types of maps are there?• Generalized – Not “exact” but informative
Washington DC Metro map
GIS
– What types of maps are there?• Personal
– Based on memories and experiences– Differ between users

What can we do with GIS?
• Mapping and analysis software– Easy mapping– In-depth spatial analysis– Mix geographic and NON-geographic data.– Provide insight into spatial data.
• But importantly, GIS is mapping– Need to know how GIS “sees the world”
Projections/Datum
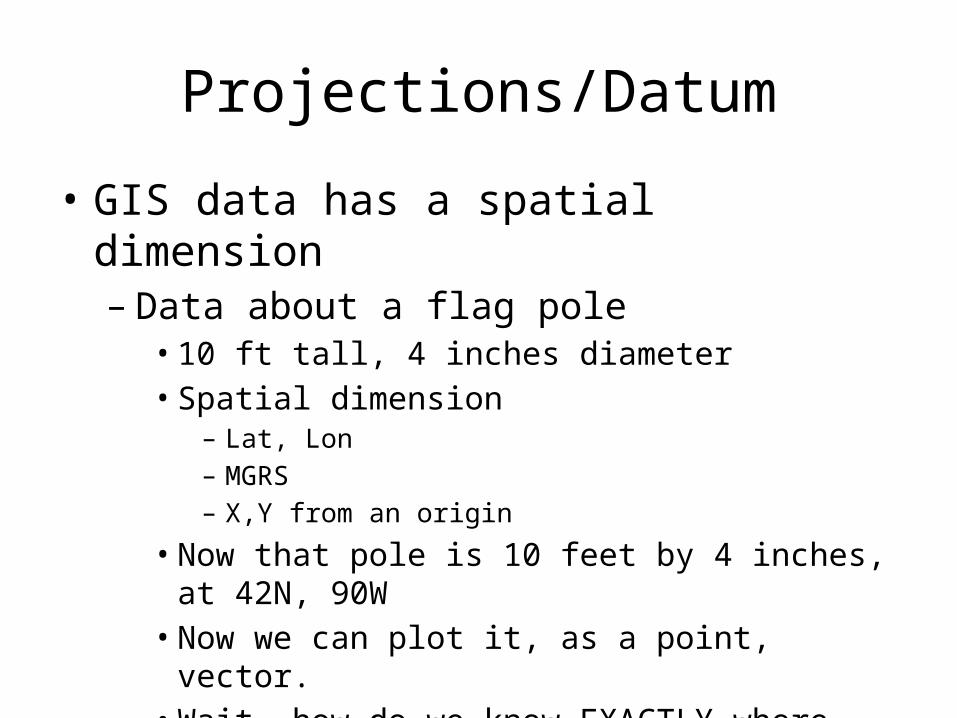
• GIS data has a spatial dimension– Data about a flag pole• 10 ft tall, 4 inches diameter• Spatial dimension
– Lat, Lon– MGRS– X,Y from an origin
• Now that pole is 10 feet by 4 inches, at 42N, 90W• Now we can plot it, as a point, vector.• Wait, how do we know EXACTLY where 42N, 90W is?
Datum
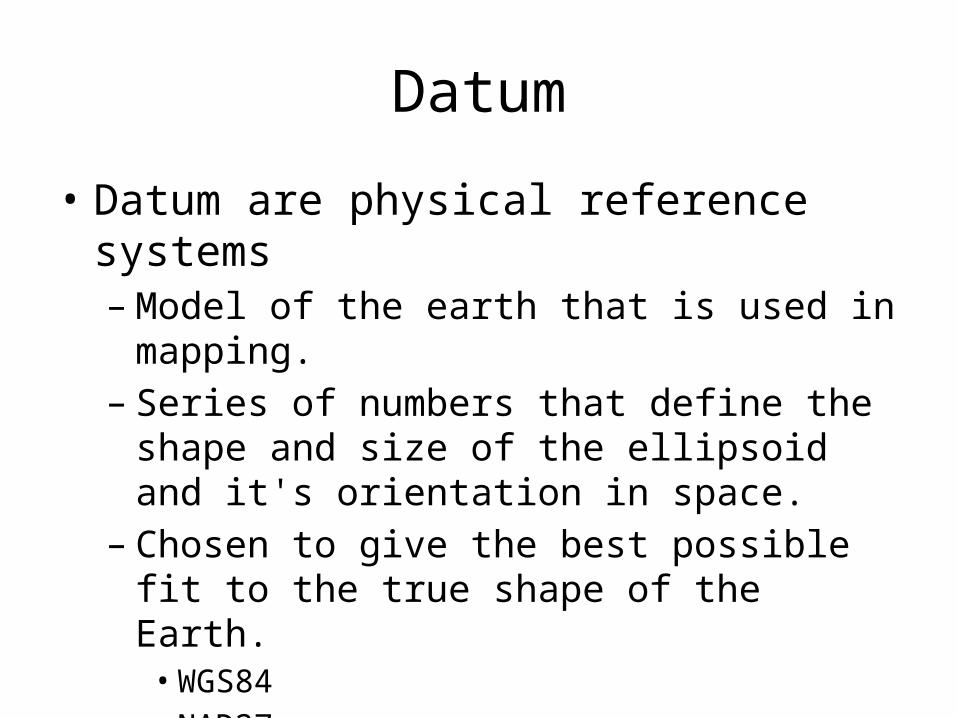
• Datum are physical reference systems– Model of the earth that is used in mapping.– Series of numbers that define the shape and size
of the ellipsoid and it's orientation in space. – Chosen to give the best possible fit to the true
shape of the Earth. • WGS84• NAD27• NAD83
Datum
• Cathedral in central Christchurch is at 172.63658E, 43.53103S in WGS-84 coordinates and 172.36344E, 43.53270S in Geodetic 1949 coordinates.
• US – Hawaiian islands had their own Datum for years.
Datum
• QGIS has transformation methods to go between datum.
• Make sure of your GeoDatum.
• All data transformed the same Datum before processing or analysing.
Projections
• The Earth is curved, maps are flat. 3-D 2-D
• The process of flattening out the Earth onto a flat piece of paper or computer screen is a mathematical process called a projection.
• Can distort certain elements of the map
Projections
• Conformality - are the shapes accurate• Distance - are the distances accurate• Area - are the areas represented on the map
proportional to their true area on the Earth• Direction - are directions between points on
the map accurately

Projections
• General interest Maps– Preserve area

Projections
azimuthal equidistant
MercatorMollweide
Further Training
• http://www.csc.noaa.gov/digitalcoast/training/datums
• http://csc.noaa.gov/digitalcoast/training/list/

Data Types
• Vector– Points, Lines, Polygons– Shapefiles, KML/KMZ
• Raster– Gridded Data• netCDF, Grib2, GeoTIFF, KMZ

Data Types
• Vector– Illustrate “features”• Roads, rivers, lakes, houses, urban areas etc.
– Features have “attributes”• Additional information on the “features”
– Text or numerical information
– Vector shape – represented by geometry and nodes.
– Can even load Excel data (if in csv format).

Vector Types
• Vector Geometry– Points, Lines, Polygons.– Points – Cities, towns, hospitals, rain gauges– Lines – roads, rivers, Cyclone track, ITCZ location– Polygons – Urban areas, Countries, Continents, Weather
forecast areas, Flooding, drought, Weather Hazards, Climate Hazards
– All represented by Nodes• 1 node = Point• Multiple Nodes that do not touch = Line• Multiple Nodes that connect = Polygon
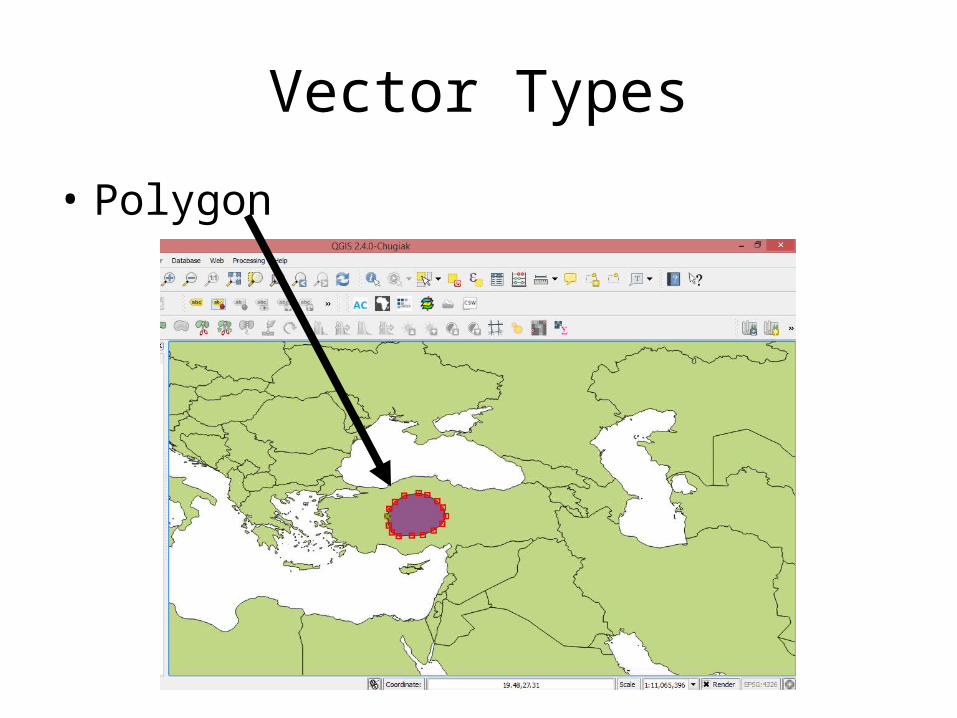
Vector Types
• Polygon
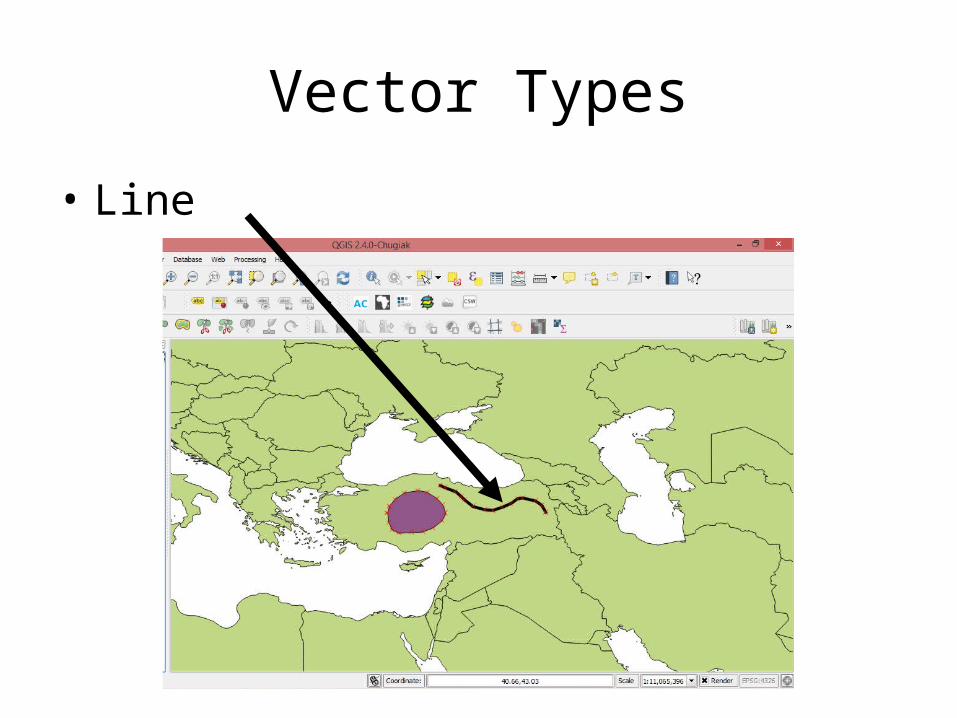
Vector Types
• Line
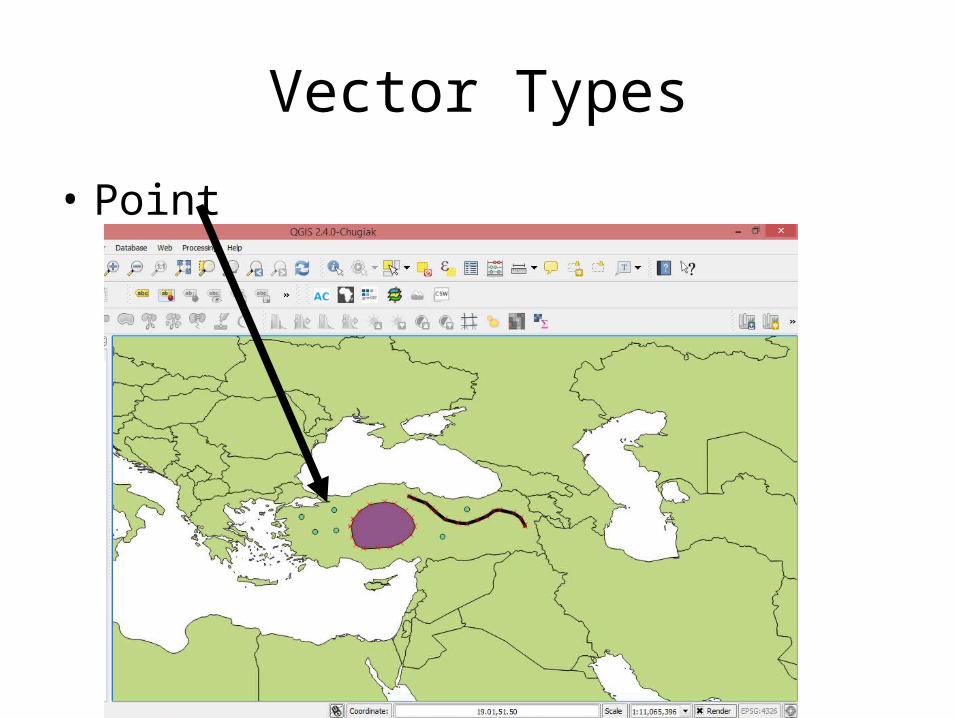
Vector Types
• Point
Data Types
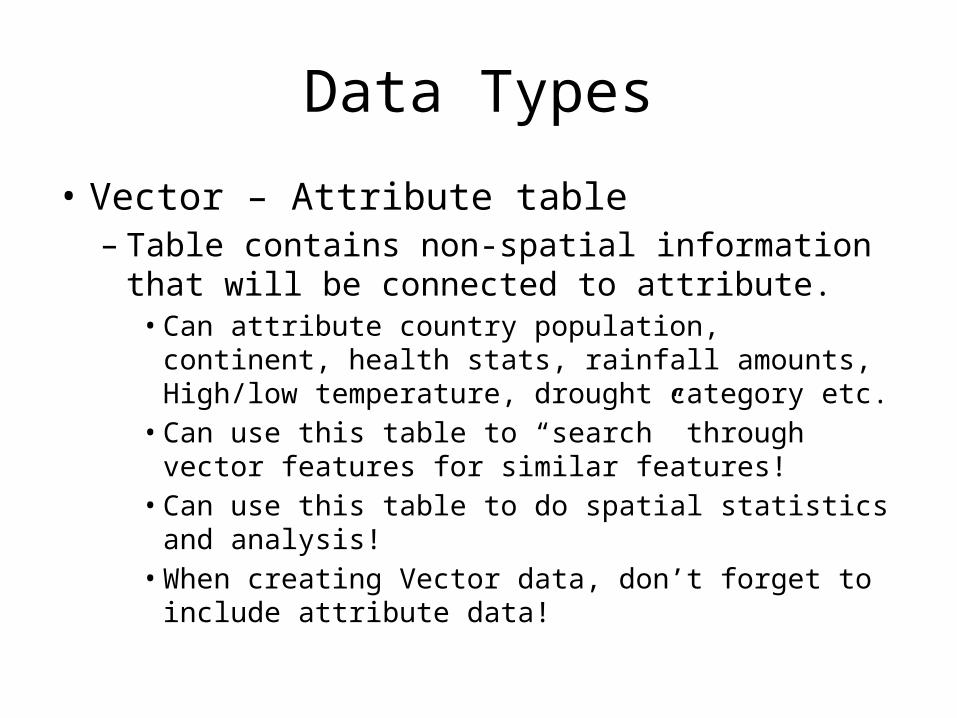
• Vector – Attribute table– Table contains non-spatial information that will be
connected to attribute.• Can attribute country population, continent, health
stats, rainfall amounts, High/low temperature, drought category etc.• Can use this table to “search” through vector features
for similar features!• Can use this table to do spatial statistics and analysis!• When creating Vector data, don’t forget to include
attribute data!

Data Types
• Rasters– Gridded data
• Each “cell” has a value
– GIS can handle various types – binary, ASCII, netcdf, KML, CSV, Geotiff (many additional options)
Image from ESRI
Data Types
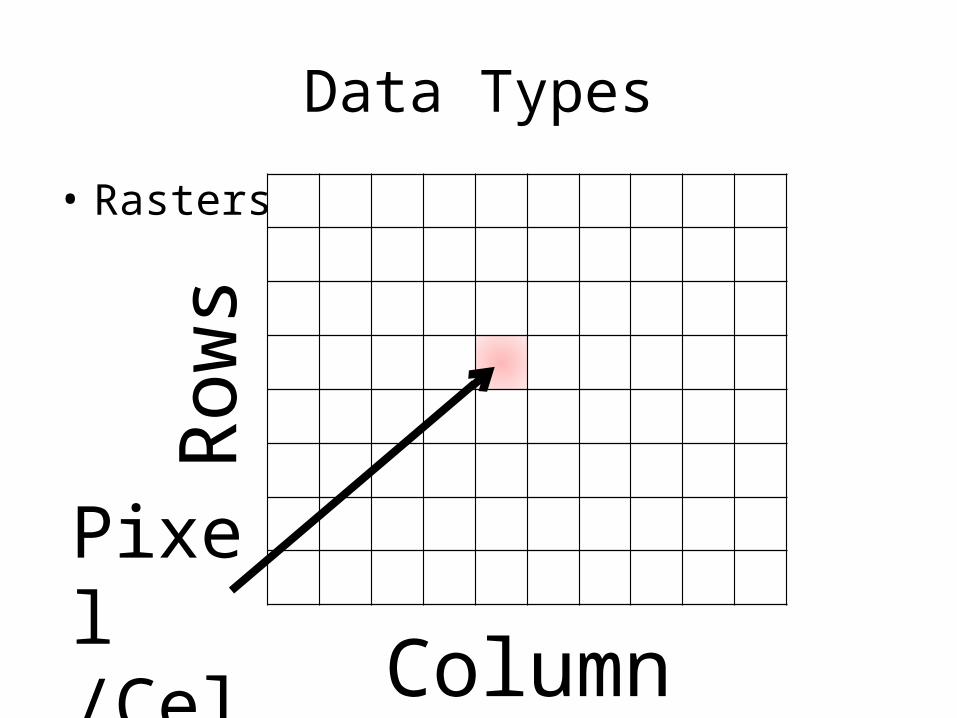
• RastersRo
ws
Columns
Pixel /Cell

Data Types
• Rasters – what type of data lends itself to raster format?• Satellite imagery, Land-use/agricultural data,
Weather/climate data (what types?)
– Uses?• Base map for other layers
– Elevation maps, terrain, bathymetry
• Be used to analyze- combining multiple rasters
Data Types
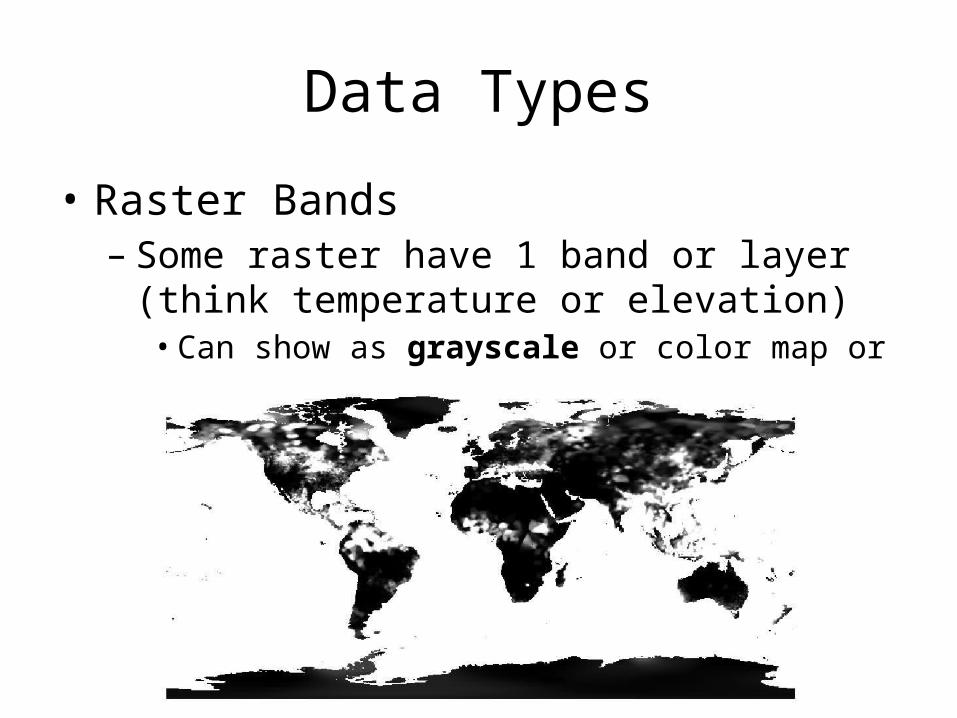
• Raster Bands– Some raster have 1 band or layer (think
temperature or elevation)• Can show as grayscale or color map or two colors

Data Types
• Raster Bands– Some raster have 1 band or layer (think
temperature or elevation)• Can show as grayscale or color map or two colors
Data Types
• Raster Bands– Some raster have multiple bands• Every cell has more than one value associated
– Each band focuses on different part of spectrum.
• Can display all bands together as RGB composite.• Popular in satellite data.
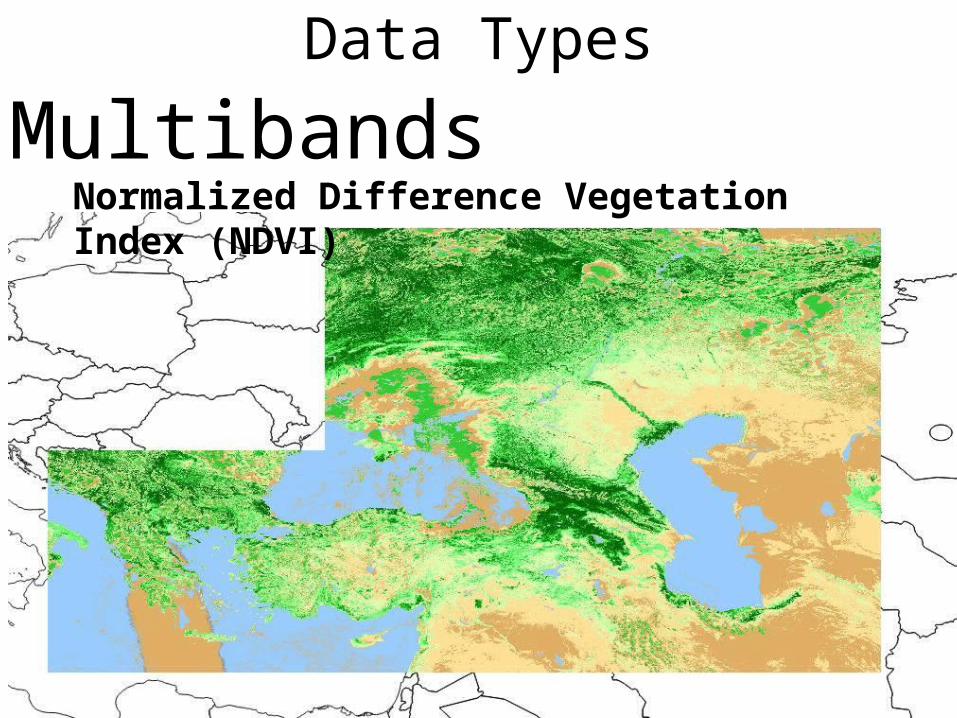
Data Types
MultibandsNormalized Difference Vegetation Index (NDVI)

Data Types
Multibands
Data Types
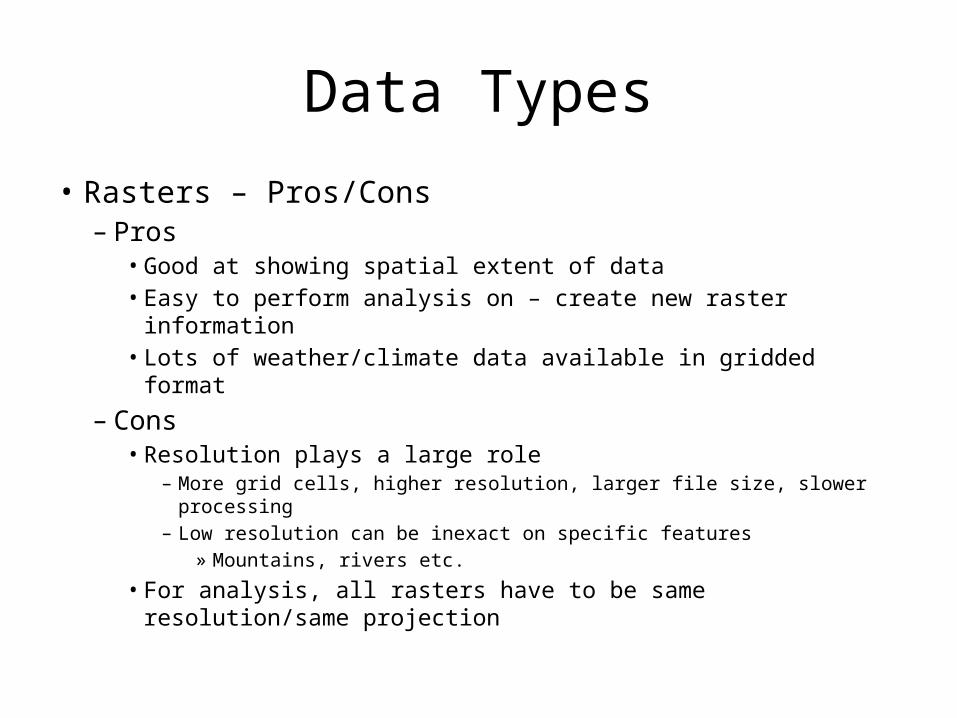
• Rasters – Pros/Cons– Pros
• Good at showing spatial extent of data• Easy to perform analysis on – create new raster information• Lots of weather/climate data available in gridded format
– Cons• Resolution plays a large role
– More grid cells, higher resolution, larger file size, slower processing– Low resolution can be inexact on specific features
» Mountains, rivers etc.
• For analysis, all rasters have to be same resolution/same projection