Embed Size (px)
Citation preview

1
GIS-BASED FUTURE LAND USE HURRICANE STORM SURGE HAZARD ANALYSIS: A CASE STUDY FOR VOLUSIA COUNTY, FLORIDA
By
YUYANG ZOU
A THESIS PRESENTED TO THE GRADUATE SCHOOL OF THE UNIVERSITY OF FLORIDA IN PARTIAL FULFILLMENT
OF THE REQUIREMENTS FOR THE DEGREE OF MASTER OF ARTS IN URBAN AND REGIONAL PLANNING
UNIVERSITY OF FLORIDA
2011

2
© 2011 Yuyang Zou

3
To my dearest family and friends

4
ACKNOWLEDGMENTS
I would like to show the deepest and most grateful appreciation to my parents for
their endless support. I also would like to express my sincere thanks to my committee
members Dr. Paul Zwick and Dr. Dawn Jourdan. I am greatly indebted to my advisor
and committee chair Dr. Paul Zwick, for his support, guidance and encouragement all
the time. I thank my committee co-chair Dr. Jourdan who was also my professor mentor
when I first came here, a complete new place from my home country China, for her
passion, patience, advice and support during my study here.
Many thanks to my dearest LUCIS group members, Dr. Abdulnaser Arafat and
Elizabeth Thompson for their technical support, constructive criticism of my work and
companionship back up.
Special thanks should go to the entire lovely colleagues from the Shimberg Center
for Housing Studies at the University of Florida for their care and support.
Finally, I would like to thank all my friends that without you I could never get this
far.

5
TABLE OF CONTENTS
page
ACKNOWLEDGMENTS .................................................................................................. 4
LIST OF TABLES ............................................................................................................ 7
LIST OF FIGURES .......................................................................................................... 8
LIST OF ABBREVIATIONS ........................................................................................... 10
ABSTRACT ................................................................................................................... 11
CHAPTER
1 INTRODUCTION .................................................................................................... 13
Overview ................................................................................................................. 13 Study Area .............................................................................................................. 13 Study Objectives ..................................................................................................... 15
2 LITERATURE REVIEW .......................................................................................... 16
HAZUS-MH Model .................................................................................................. 16 Overview .......................................................................................................... 16 Coastal Flood Hazard Modeling ....................................................................... 19 Flood Insurance Study ..................................................................................... 20
Depth-Damage Curves and Functions .................................................................... 20 Depth-Frequency Curve ................................................................................... 20 Depth-Damage Functions ................................................................................. 21 The Definition of Vulnerability ........................................................................... 23
The Case Study with GIS Analysis in Florida’s Coastal Area ................................. 24 Theories and Research on Sea Level Rise ............................................................. 24
3 DATA AND METHODOLOGY ................................................................................ 26
Data ........................................................................................................................ 26 Census 2000 .................................................................................................... 26 Property Tax Parcel Data ................................................................................. 26 DEM (Digital Elevation Model) .......................................................................... 26
Methodology Overview ........................................................................................... 27 Base Scenario ........................................................................................................ 29 Alternative Scenario I .............................................................................................. 34
Step One .......................................................................................................... 34 Step Two .......................................................................................................... 34 Step Three ........................................................................................................ 36 Step Four .......................................................................................................... 36
6
Alternative Scenario II ............................................................................................. 36
4 FINDINGS AND RESULTS ..................................................................................... 38
Base Scenario ........................................................................................................ 38 Alternative Scenarios .............................................................................................. 38
Define Building Loss ......................................................................................... 39 Comparison: Alternative Scenario I - Base Scenario ........................................ 39 Comparison: Alternative Scenario I - Alternative Scenario II ............................ 40
Alternative scenario I: 100-yr storm surge.................................................. 47 Alternative scenario II: 100-yr storm surge and a 1.5m sea level rise ........ 49
5 DISCUSSION ......................................................................................................... 56
Discussion of Findings and Methods ...................................................................... 56 Future Research Opportunities ............................................................................... 57
6 CONCLUSION ........................................................................................................ 59
APPENDIX
A VOLUSIA 100-YR COASTAL FLOOD EVENT SUMMARY REPORT .................... 62
B VOLUSIA 100-YR COASTAL FLOOD EVENT QUICK ASSESSMENT REPORT .. 73
LIST OF REFERENCES ............................................................................................... 74
BIOGRAPHICAL SKETCH ............................................................................................ 76

7
LIST OF TABLES
Table page 1-1 Projections of population – Volusia vs. Florida ................................................... 14
4-1 Parameters for depth-damage equitation for estimating building losses ............ 39
4-2 Total building damage due to 100-yr SS by year 2010 parcel, Volusia, Florida (thousand dollars) ............................................................................................... 40
4-3 Total Building damage due to 100-yr SS and 1.5m SLR by 2010 Parcel, Volusia, Florida (thousand dollars) ..................................................................... 41
4-4 Original table by depth, loss and land use type for 100-yr storm surge (thousand dollars) ............................................................................................... 47
4-5 Normalized table by depth, loss and land use type for 100-yr storm surge ........ 48
4-6 Normalized table by depth, loss and land use type for 100-yr storm surge and a 1.5m sea level rise (thousand dollars) ...................................................... 49
4-7 Normalized table by depth, loss and land use type for 100-yr storm surge and 1.5m sea level rise .............................................................................................. 50
4-8 Controlled building damage between WS/WO SLR by 2010 parcel, inundation between 0 - 1ft (thousand dollars) ..................................................... 51
4-9 Controlled building damage between WS/WO SLR by 2010 parcel, inundation between1 - 4ft (thousand dollars) ...................................................... 52
4-10 Controlled building damage between WS/WO SLR by 2010 parcel, inundation between 4- 8ft (thousand dollars) ...................................................... 53
4-11 Controlled building damage between WS/WO SLR by 2010 parcel, inundation between 8 -12ft (thousand dollars) .................................................... 54
4-12 Controlled building damage between WS/WO SLR by 2010 parcel, inundation above 12ft ......................................................................................... 55

8
LIST OF FIGURES
Figure page 1-1 Study area location of Volusia County ................................................................ 14
2-1 Create study region ............................................................................................ 17
2-2 Define flood hazard type ..................................................................................... 18
2-3 Steps in acquiring user’s data............................................................................. 19
2-4 General model of structure depth-damage function.(Willett, 1996)..................... 22
3-1 Diagram of study methodology. .......................................................................... 28
3-2 Overview of HAZUS-MH coastal flood hazard modeling process ....................... 29
3-3 Create Volusia County study region ................................................................... 30
3-4 Shoreline characteristic inputs ............................................................................ 31
3-5 Hazard model analysis type and cell size ........................................................... 31
3-6 The delineated floodplain by coastal flood hazard modeling .............................. 32
3-7 Base Scenario of 100-yr storm surge hazard, Volusia County, Florida .............. 33
3-8 Flowcharts for steps of GIS methodology ........................................................... 35
4-1 Land use map for Alternative Scenario I of SS hazard, Volusia, Florida ............ 42
4-2 Land Use Map for Alternative Scenario II of SS and a 1.5M SLR hazard, Volusia, Florida ................................................................................................... 43
4-3 Inundation depth map for Alternative Scenario I of SS hazard, Volusia, Florida ................................................................................................................ 44
4-4 Inundation depth map for Alternative Scenario II of 100-yr SS and a 1.5m SLR hazard, Volusia, Florida .............................................................................. 45
4-5 Pie Charts for total percentage losses of building damage by 100-yr SS, Volusia, Florida ................................................................................................... 46
4-6 Pie Charts for total percentage losses of building damage by 100-yr SS and 1.5m SLR, Volusia, Florida ................................................................................. 46
4-7 Building Loss by different land use type in the function of inundation depth for 100yr storm surge ............................................................................................... 47

9
4-8 Building Loss Normalized by different land use type in the function of inundation depth for 100yr storm surge .............................................................. 48
4-9 Building Loss by different land use type in the function of inundation depth for 100yr Storm Surge and a 1.5m sea level rise ..................................................... 49
4-10 Building Loss Normalized by different land use type in the function of inundation depth for 100yr storm surge and a 1.5m sea level rise ..................... 50

10
LIST OF ABBREVIATIONS
BEBR Bureau of Economic and Business Research at University of Florida
CDMS Comprehensive Data Management System
DEM Digital Elevation Model
DOR Department of Revenue
ESRI Environmental Systems Research Institute
FDOR Florida Department of Revenue
FEMA Federal Emergency Management Agency
FGDL Florida Geographic Data Library
FIS Flood Insurance Study
GIS Geographic Information System
SLR Sea Level Rise
SS Storm Surge
SWEL Still Water Elevation
USACE United States Army Corps of Engineers
USGS United States Geological Survey

11
Abstract of Thesis Presented to the Graduate School of the University of Florida in Partial Fulfillment of the
Requirements for the Degree of Master of Arts in Urban and Regional Planning
GIS-BASED FUTURE LAND USE HURRICANE STORM SURGE HAZARD ANALYSIS: A CASE STUDY FOR VOLUSIA COUNTY, FLORIDA
By
Yuyang Zou
December 2011
Chair: Paul Zwick Cochair: Dawn Jourdan Major: Urban and Regional Planning
In recent years, the damage caused by the hazards of flooding has increased in
Florida. That increase may be the result of many factors but paramount among those
factors is the continued development of urban land use within flood damage areas
adjacent to the Florida coastline. Planners with their role as protectors of public health
and safety must work with emergency managers to develop and implement disaster
plans, mitigation plans and to assist with disaster response activities.
The objective of this thesis is to explore a methodology to understand the
implication of hurricane hazard analysis for future land use planning in coastal areas of
Florida in an attempt to answer the following questions. First, how do we best
implement quantitative hurricane hazard models for future land use decision making in
coastal Florida? Next, will a quantitative hurricane hazard model (HAZUS-MH)
integrated with a future land use model be helpful for planning in coastal Florida?
Finally, how do we quantify the effects of sea level rise using hurricane hazard models
for future land use planning?
To answer these questions, an approach using storm surge (SS) models by
HAZUS-MH that incorporate the presence or absence of a 1.5 meter (approximately 4.9
12
feet) sea level rise was developed and three projected scenarios are created for further
analysis. Volusia County, Florida is selected as a case study.
The study results show a number of parcels that would be lost in certain land use
categories. Tables are generated indicating the current assessed market value for
parcels inundated by the scenarios. More stress caused by sea level rise according to
the result of Alternative Scenario II shows, that the coastline would be retracted by
losing large amounts of land. This research is not intended to specifically represent the
inundation risk due to a probabilistic 100-year SS and sea level rise for any specific
building or land parcel. However, this is a good indication for what may occur. The
methodology could also be used as a supplementary for forecasting economic analysis
and future land use planning or county resilience planning.

13
CHAPTER 1 INTRODUCTION
Overview
One of the components related to the study of natural hazards is the recognition of
land use vulnerability. With an understanding that certain land use categories are more
vulnerable to natural hazards, planners could make better development decisions based
on the knowledge of the future impacts caused by those hazards. As a result, HAZUS-
MH models are widely accepted and applied by disaster management researchers, and
should be employed to a greater extent by urban and regional planners. With the
application of the model, the long-term impacts of SS and sea level rise on
infrastructures, property parcels, and other public and private resources could be
visualized. And this could help local governments to think seriously about if the
development in the certain coastal areas is valuable and the appropriate property tax
increasing with the worry about the liability associated with those future limitations.
Study Area
Volusia County is located on the northeast coast of the state of Florida (Figure 1-
1). The County lies on the coastline by the Atlantic Ocean. Coastal areas are
particularly vulnerable to several of nature hazards, such as hurricanes, tropical storms,
flooding, and sea level rise, etc. These natural hazards would threaten the safety of
coastal residents and would cause damages and the loss of both public and private
properties. According to Year 2010 property tax parcel data provided by Florida
Department of Revenue (FDOR) and updated in Florida Geographic Data Library
(FGDL) in February 2011, Volusia County covers an area of 759,743 acres, among
which, 172,734 acres are residential land.

14
Figure 1-1. Study area location of Volusia County
According to the research of bureau of economic and business research at
University of Florida (BEBR), Volusia County comprises approximately 3% of the state
of Florida’s population. Their medium projection of population growth in Volusia County
increases every decade by 55,330 people (Table 1-1).
Table 1-1. Projections of population – Volusia vs. Florida Year Volusia Florida
CENSUS 2000 443,343 15,982,824
PROJECTIONS(Medium) 2010 510,300 18,881,400 2020 565,600 21,417,500 2030 620,900 23,979,000

15
Study Objectives
The purpose of this study is to examine the GIS-based hurricane hazard analysis
model (HAZUS-MH), to assess if it is helpful for enhancing future land use planning in
Florida coastal areas. The study includes three parts. First, a base loss will be
estimated by incorporating 2000 Census data with a flood hazard model within HAZUS-
MH. Second, since HAZUS-MH uses estimations based on Census 2000 data rather
than actual land use property parcel data, 2010 land use parcel data will be introduced
to see how different between the results generated by HAZUS–MH and the results
obtained using parcel data . The last part is to incorporate the same flood hazard model
with a 1.5 meter sea level rise and 2010 land use parcel data to see how much of the
county is affected and to inspect the increased damage due to the sea level rise. Three
projected scenarios are created as follows: (1) Base Scenario by HAZUS-MH with its
default 2000 Census data, (2) Alternative Scenario I: Base scenario by HAZUS- MH and
2010 land use parcel data, (3) Alternative Scenario II: incorporates Alternative Scenario
I with a 1.5 meter sea level rise.

16
CHAPTER 2 LITERATURE REVIEW
HAZUS-MH Model
Overview
The Hazards U.S. Multi- Hazard (HAZUS-MH) was developed by the Federal
Emergency Management Agency (FEMA) with state-of-the-art geographic information
systems (GIS) as its running platform in Spring 2004 (FEMA,2011). The application
includes models of flood, hurricane (wind), and earthquake.
HAZUS-MH models produce loss estimates in planning for multiple hazards risk
mitigation, emergency preparedness, response and recovery. The estimation
methodology adopted in HAZUS-MH deals with a wide range of different types of
losses.
The HAZUS-MH flood model is aimed at helping with decision-making in certain
areas that are prone to flooding risk. It is a state-of-the-art analysis for identifying and
quantifying risks by flood hazard and loss estimation. The analysis includes three levels.
HAZUS-MH model Level 1 is based on default data provided with the software and the
most updated default inventory data is based on Census 2000. To accomplish this level
requires minimum technical knowledge other than knowing about basic analytical
methods with GIS. The loss estimation through Level1 is due to depth of flooding. Level
2 is improved by inputting more relevant parameters which meet all the methodology
used in the Level 1. Level 3, the most detailed data analysis, requires more advanced
information and measurement of the flood. The methodology to finish the data
acquisition might be newer and more accurate by experts and engineers who are

17
required to put extensive effort into the process. Much more time is therefore needed to
sum up and prove results compared to previous Level1 and Level 2 (FEMA, 2011).
The Major steps for Level 1 analysis in the HAZUS-MH flood model are described
below.
Figure 2-1. Create study region

18
1. Define the study region with hazard type.
The hazards to be investigated are determined in this stage with no restriction on
the amount of hazard types at a time. However, once the study region with certain
hazard is built, no other hazard type can be added in. other than create another new
region (Figure 2-1).
2. Input Inventory data
The HAZUS-MH flood model includes two types of flooding models, a coastal and
a riverine model. Before inventory data is inputted, the type of the flood hazard is
determined according to the characteristic of the study area.
Figure 2-2. Define flood hazard type
The user data, in terms of the regional DEM data, is downloaded from the United
States Geological Survey (USGS) web site.

19
Figure 2-3. Steps in acquiring user’s data
3. Damage estimations, which include direct and induced damage
4. Losses estimations, which include social and economic losses
(Source: Adapted from HAZUS-MH flood user manual)
Coastal Flood Hazard Modeling
Coastal flood hazards are calculated by HAZUS-MH and it requires the user to
define certain information according to each specific county. The required inputs are
listed below:
• Study region • Shorelines • Wave exposure • Shore type • 100-yr Flood Stillwater Elevation (SWEL) • 100-yr wave set up which might be given in Flood Insurance Study Report (FIS). • Coastal flood return period
For the rest of the data, the coastal model will default to the user’s inputs.
(Source: Adapted from HAZUS-MH flood technical manual)
20
Flood Insurance Study
This FIS report is provided by FEMA with the aim of helping local and regional
planners to further promote land use and floodplain development. According to the
report for Volusia County, Florida, the 1-percent Annual Chance Stillwater elevation for
the Atlantic Ocean is not revised, which is 6.9 feet using the North American Vertical
Datum of 1988(NAVD88) as the referenced vertical datum. At the same time, “the 1-
Percent Annual Chance Stillwater Elevations for the open area along the Atlantic Ocean
were not modified to include the effects of wave setup” (FEMA, 2011) which indicates
that wave setup was not a necessary input for the coastal flood model by HAZUS-MH
for Volusia County.
Depth-Damage Curves and Functions
Depth is usually the primary parameter when estimating the damages due to flood.
Depth-Frequency Curve
Depth-frequency curve represents the relationship between the depth of flooding
and the annual chance of inundation greater than the depth. The methodology adopted
in HAZUS to estimate the direct economic losses is based on this curve, compiled from
a variety of sources including the Federal Insurance and Mitigation Administration
(FIMA) “credibility weighted” depth-damage curves, and selected curves developed by
the U.S. Army Corps of Engineers (USACE), and the USACE Institute for Water
Resources (USACEIWR) (FEMA, 2011).
The frequency of flood hazard varies over time measuring the risk of it occurring is
difficult to predict. Also, flood hazard represents only one type of sources of natural
hazards. For example, the flood hazard may be that an area is inundated about once
every 100 years by the risk of storm surge or it may be that an area is subject to flood

21
depths ranging from 0.5 to 1.5 meters. Flood frequency curves define flood hazard by
showing the relationship between depth of flooding and the annual chance of inundation
greater than that depth of flooding in the particular year. (FEMA, 2011) (Titus, 2001)
Depth-Damage Functions
The methodology of the HAZUS-MH flood model for estimating direct physical
damage, such as the repair cost, replacement cost etc. to the general building stock, is
relatively straightforward and easy to understand and to apply in the models. Usually,
for a given Census 2000 block, each occupancy type of the construction has an
appropriate damage function assigned to it. For instance, functions may vary for a one-
story building without basement and a one-story building with basement. Different
inundation depths leading to different extents of flooding are used to determine the
associated percentage damage of the buildings and constructions. Generally, this
percentage damage is multiplied by the replacement value to produce an estimate of
total dollar loss. Conceptually, a 1-10% damage is considered to be a slight loss, a 11-
50% damage is considered to be moderate loss, and more than 50% damage is
considered as substantial loss (FEMA, 2011) (Davis, 1985).
Detailed contents damage functions are applied within different cases all over the
US by the USACE. For example in New Orleans District, a number of structures without
basements were reviewed to form the exact functions for this area by two categories,
which are one-story and two-story buildings. A 5 feet water depth indicates a substantial
loss of its maximum to a one-story building, while it could be less for a two-story building
at the water level of 5 feet. In this particular function, a 14 feet water depth results in the
substantial loss of its maximum to a two-story building in that area(FEMA, 2011) (Davis,
1985).

22
For all the functions, due to limited claims data, it is assumed that all depth-
damage curves developed by the USACE represent structures with no basement for
Atlantic coastal area (FEMA, 2011).
In Willett and Kiefer’s research, (Willet, 1996) hypothetical damages were obtained
for several levels of flooding depth, which are 0 to 1 feet, 1 to 4 feet, 4 to 8 feet, 8 to 12
feet, and above 12 feet. A series of linear models were tested and a structure damage
equation was generated from the models to estimate the loss percentage of the
structures. The equation could be applied to buildings with and without basements. The
expression for building with basement is simplified as: % structure damage
= . And the expression for buildings without basement s
is simplified as: % structure damage = .
Figure 2-4. General model of structure depth-damage function.(Willett, 1996)

23
Figure 2-4 shows the plotted results of damage-functions of both with basement
and with no basement. The damage increased fast when inundation depth was below 4
feet for both conditions. The percentages of damages were gradually level off at the
inundation depth around 12 feet for both situations.
The Definition of Vulnerability
Climate Change 2007, the fourth assessment report from Intergovernmental Panel
on Climate Change has noted that “The term ‘vulnerability’ may therefore refer to the
vulnerable system itself”(IPCC, 2007) (Matisziw, 2011). To be more specific, “Disaster
proneness and insufficient capability” (Pinkowaski, 2008,) are two main concerns for
researchers and scholars to investigate in for the vulnerability caused by hurricane. The
former is examined by the physical condition of an area according to its topography
(Simpson, 1998). For instance, coastal cities are more sensitive than inland cities which
are why some scholars note that most of Florida’s coastal residents are prone to
disaster caused by hurricane (Pinkowski, 2008). The latter is of more concerned to
geographers, ecologists, economists, humanist as well as urban planners where the
post-effects of hurricanes which exceed the capability of an area to adapt itself to the
situation (Puszkin, et al., 2006) (McLeod, et al., 2010).
Seven criteria used to define main vulnerabilities are(IPCC, 2007):
• magnitude of impacts,
• timing of impacts,
• persistence and reversibility of impacts,
• likelihood (estimates of uncertainty) of impacts and vulnerabilities, and confidence in those estimates,
• potential for adaptation,

24
• distributional aspects of impacts and vulnerabilities,
• Importance of the system(s) at risk.
The Case Study with GIS Analysis in Florida’s Coastal Area
In Murley , Chevlin and Esnard ’s research, (Murley, 2004) three coastal Florida
counties, Martin, St. Lucie and Indian River are selected as the study area. The
researcher mapped old and new geographic delineations for the study area. Also the
amount of land and number of parcels were compared, aiming to find out the difference
between tax parcels and land acres and the relationship between the existing acreage
of land parcels and the number of improved real estate assets on a certain parcel of
land.
Theories and Research on Sea Level Rise
Sea level rise not only could make an area of coastal land inundated and increase
coastal erosion, but it could also makes events such as tsunamis, storm surges and
other marine hazards more likely to occur, causing flooding and saltwater intrusion
which could result in greater loss. (Oliver, 2010) (Darwin, 2001) Sea level rise issues
threaten most of the U.S. coast areas. The entire Atlantic Coast is subsiding. According
to Vivien’s research, an area of 89.0% of the Atlantic Coast region are affected by
varies of rates of sea level rise exceeding 2 mm/yr (Vivien, 1991). Nearly half of the Gulf
Coast is eroding, with 40% retreating at rates greater than 2 mm/yr. The Gulf Coast
west of the Florida Panhandle displays the highest rates of relative sea level rise in the
U.S. Sea level trends over the period 1931-1988 had an average value of 8.1 mm/yr
(Cushman, et al., 1991) (Nicholls,1999). An estimation of a global sea level rise that
provided by the International Panel on Climate Change (IPCC) was between 0.6 and 2

25
feet (0.18 to 0.59 meters) in the next century (IPCC, 2007). The climate change should
be the one of the main reasons that caused sea level rise.
The effects of the global sea level rise in the coastal areas will be spatially non-
uniform. The impacts of this accelerated sea level rise (SLR) are replete with gloom
which include shoreline retreat, mainland inundation, saltwater intrusion, inland
population density increasing, shortage of fresh water resources and agricultural lands
(McLeod, 2010). Certain areas of coastal zones will be permanently inundated to a
depth equivalent to the vertical rise in sea level. Meanwhile, episodic flooding from
storm surges could penetrate much further inland. Beaches and coastal structures are
threatened without doubt. Increasing salinization caused by sea level rise could pollute
drinking water supplies and be extremely harmful to crops and soil of agriculture land.
(Cushman, et al., 1991)

26
CHAPTER 3 DATA AND METHODOLOGY
Data
Census 2000
Census 2000 represents the 22nd US census by the US Census Bureau
conducted in April 1st, 2000 (http://en.wikipedia.org/wiki/Census_2000). A Census block
is the smallest geographic unit used by the US Census Bureau to generate all housing
information within a region. This suggests the data might be the most complete at the
time but is an average value. HAZUS-MH has adopted Census 2000 as the basis
inventory data for hazards analysis.
Property Tax Parcel Data
The parcel data shapefile needed for analysis are retrieved from the Florida
Geographic Digital Library (FGDL) which is Year 2010 tax parcel data updated in March
2010. The parcel data is used for Volusia County, Florida for the case study.
All the tax parcel data have the following horizontal coordinate system and no
projections are needed. The source descriptions are listed below.
• Projected coordinate system name: Albers Conical Equal Area • Geographic coordinate system name: GCS_North_American_1983_HARN • Linear Units: meter
DEM (Digital Elevation Model)
The U.S. Geological Survey (USGS) produces a digital elevation model (DEM)
from terrain data. DEM represents only the height information. The grid cells of a DEM
raster data are equal sized. HAZUS-MH uses the 1-degree DEM from USGS with the
source descriptions listed below.
• Coordinate system name: Albers Conical Equal Area

27
• Datum: D_North_Amarican_1983 • Angular Units: Degree
The HAZUS-MH model developed for this thesis is implemented in Arc View 9.3.1,
the geographic information systems (GIS) software package released by the
Environmental Systems Research Institute (ESRI).
Methodology Overview
The purpose of this study was to examine the GIS-based hurricane hazard
analysis model (HAZUS-MH), and to assess if it is helpful for enhancing future land use
planning in Florida coastal areas.
The study included three parts. First, a base loss would be estimated by
incorporating Census 2000 data with coastal flood hazard model. Second, since
HAZUS-MH has its estimation on Census 2000 data rather than actual land use
property parcel data, Year 2010 property land use parcel data would be introduced to
examine how close the results generated by HAZUS-MH were to those obtained with
parcel data . The last part was to incorporate the same storm surge (SS) model with a
1.5 meter sea level rise (SLR) and Year 2010 land use parcel data to see how much of
the county was influenced and understand the increased damage due to the sea level
rise.
Three projected scenarios were created as follows (1) The Base Scenario by
HAZUS-MH with its default Census 2000 Data, (2) Alternative Scenario I: Base scenario
by HAZUS- MH and Year 2010 Land use parcel data, (3) Alternative Scenario II:
incorporate Alternative Scenario I with 1.5 meter SLR. Figure 3-1 is a diagram of the
research methodology used in this study that would be discussed in detail in the
following sections of this chapter.

28
Figure 3-1. Diagram of study methodology.

29
Base Scenario
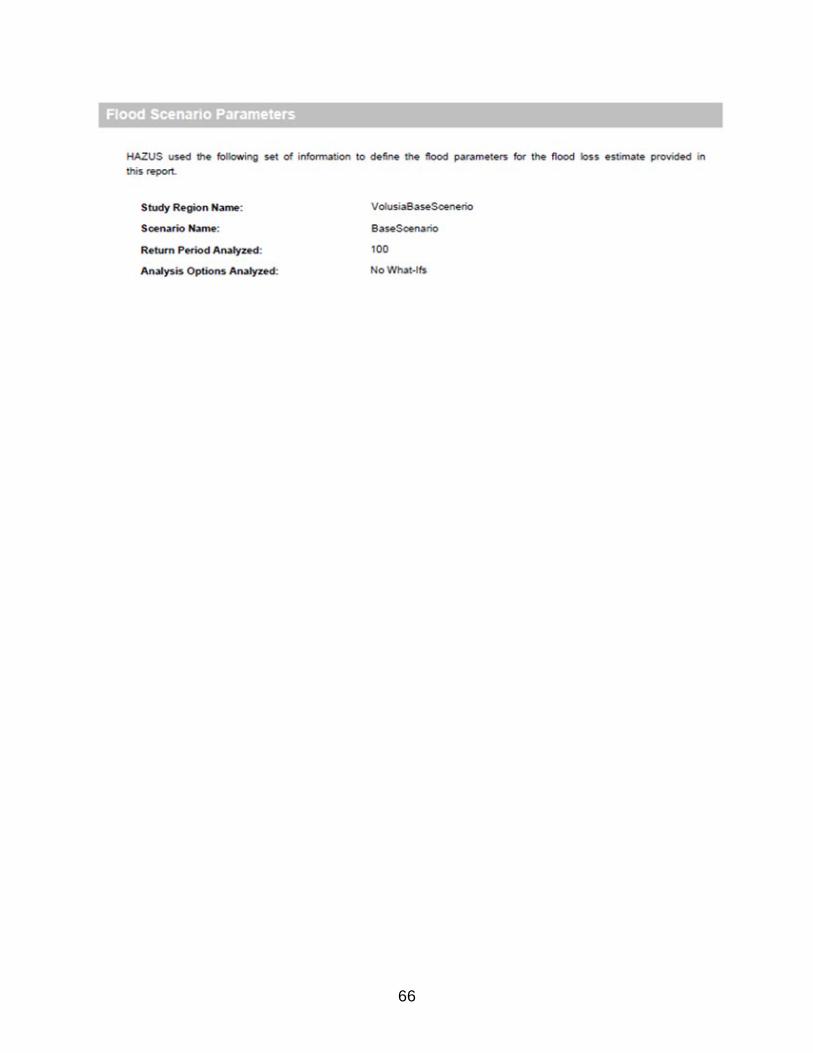
The base scenario is for storm surge hazard of Volusia County. It was generated
by the coastal flood model with HAZUS-MH. The objective of the base disaster scenario
aimed not only to examine the accuracy of the default database in HAZUS-MH model
according to the summary report created during the modeling process, but also to
obtain the 100-yr floodplain boundary as well as the related Digital Elevation Model for
Volusia County. This study estimated the potential losses under a presumed ideal
condition that no sea level rise occurred from the 100-yrs returned storm surge.
The modeling processes to delineate floodplain by HAZUS-MH are included in the
Figure 3-2 below, as an overview.
Figure 3-2. Overview of HAZUS-MH coastal flood hazard modeling process
(Source Adapted from HAZUS-MH flood Technical manual)
Certain GIS steps were taken as described below.

30
Create a new region. In HAZUS-MH, a study region was created for Volusia
County, Florida with a specified hazard type of flood, identified state and county names.
The HAZUS-MH used its default database to generate the analysis (Figure 3-3).
Figure 3-3. Create Volusia County study region
Defining the flood hazard.
• Opened the study region in HAZUS-MH, chose flood hazard type on the Hazard menu by coastal only.

31
• Obtained data in the study region. The regional DEM data was downloaded from USGS web site using the NAVD88 vertical datum and the DEM file should be feet for USGS NED data.
• Created new scenario. The shoreline for Volusia County was selected for analysis using a default national shoreline which was delineated by county in HAZUS-MH. The parameters were full wave exposure and sandy beach, large dunes.
• According to the FIS Report for Volusia County, the still water elevation level (SWEL) was 6.9 feet using NAVD88 as the reference vertical datum (Figure 3-4). The Scenario report was named Base Scenario, which would be seen in the summary report as appendix A.
Figure 3-4. Shoreline characteristic inputs
Figure 3-5. Hazard model analysis type and cell size
32
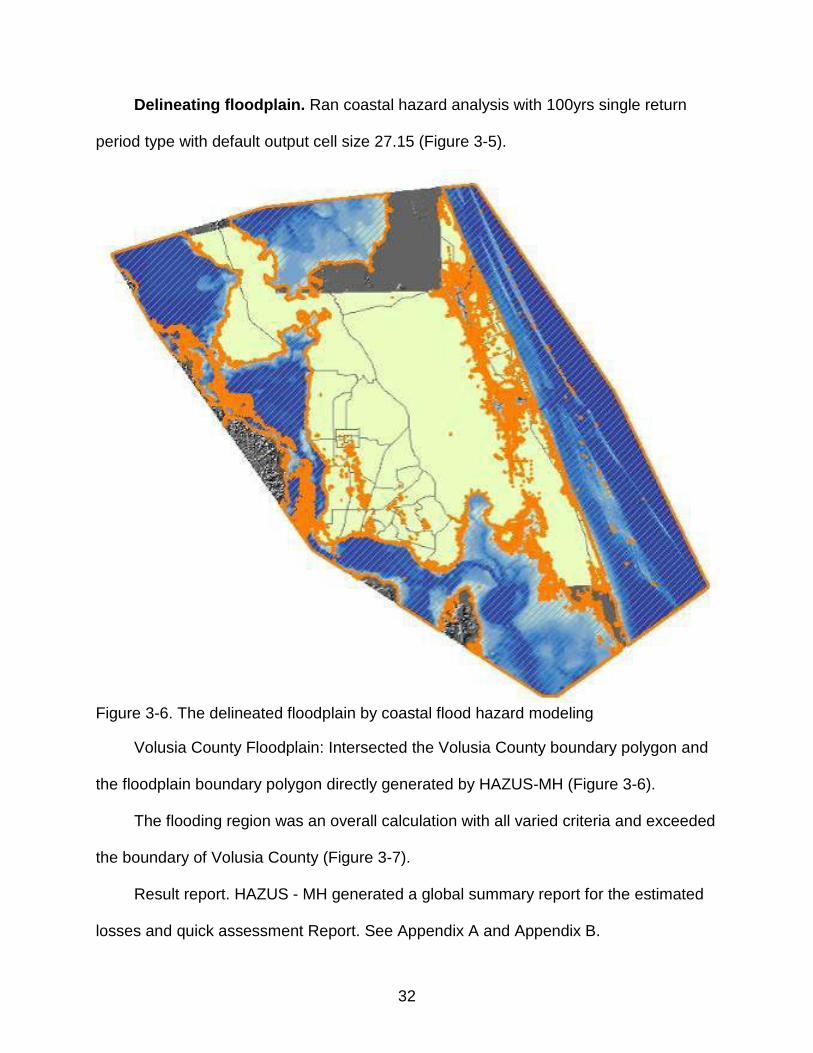
Delineating floodplain. Ran coastal hazard analysis with 100yrs single return
period type with default output cell size 27.15 (Figure 3-5).
Figure 3-6. The delineated floodplain by coastal flood hazard modeling
Volusia County Floodplain: Intersected the Volusia County boundary polygon and
the floodplain boundary polygon directly generated by HAZUS-MH (Figure 3-6).
The flooding region was an overall calculation with all varied criteria and exceeded
the boundary of Volusia County (Figure 3-7).
Result report. HAZUS - MH generated a global summary report for the estimated
losses and quick assessment Report. See Appendix A and Appendix B.

33
Figure 3-7. Base Scenario of 100-yr storm surge hazard, Volusia County, Florida

34
Alternative Scenario I
The Alternative Scenario I, which was a storm surge only scenario, was originally
from the Base Scenario incorporating Year 2010 land use tax parcel data, obtained from
Florida Geographic Digital Library (FGDL). HAZUS-MH estimated the loss by Census
block with data from year 2000 which was obtained by averaging the percentage of the
block filled by water. The methodology adopted here was to create a storm surge (SS)
polygon, which was based on the parcel polygon of Volusia County. In the polygon, a
depth was given for each grid raster, followed by calculating the specific flooded area
for each parcel of the county. The DEM model that HAZUS-MH provided for this stage
was roughly at a cell size of 30 meters. In order to get more accurate result, the raster
would need to be converted to a 5-meter cell size for further analysis.
Figure 3-8 was the flowchart for the methodology of the case study of Volusia
County, Florida.
The main steps taken to quantify the loss of the SS hazard by land use were
explained in the list below.
Step One
• “Clip” Volusia 2010 parcel data by floodplain boundary from the Base Scenario
• “Add a Field” in the attribute table, for flooded area
• “Export Data” as the primary parcel data and get a second copy. One is for convert feature to raster in step two; the other is for projection in step three. The order of step 2 and step 3 can be switched.
Step Two
Bring up a blank ArcMap map document with the DEM raster data, which was an
inundation depth based on 100-yr single return period flooding chance for Volusia
County. It could be directly used for Alternative Scenario I. Whenever doing the raster

35
analysis, “Environment Setting” is very important. Here, the 5-cell-size DEM raster is
applied for both “Extent” in the “General Setting” and the “Cell Size” in the “Raster
Analysis”.
Figure 3-8. Flowcharts for steps of GIS methodology
• Spatial Analysis for Regional DEM raster data with Spatial Analysis Tools- “Times”, to change the cell size from roughly 30 to 5
• “Single Output Map Algebra” with the equation, INT ( rpd100_c_5 * 12 ), to get the DEM model by inch.
36
• Extract data from the primary parcel data for water body and data with no value, and use the rest for further analysis.
• Convert the newer parcel data with “Polygon to Raster”
• Add a field for user defined ID, which in field calculator expression is “FID + 1” with the type of long integer.
• “Zonal Statistics By Table” for the raster attribute data
Step Three
• Project the primary parcel data copy from step one. • Calculate geometry for the field of flooded area in the attribute table by US acres • Join the output zonal stats data with parcel data by value and user defined ID.
Step Four
Summarize tables, statistic analysis and further analysis. Detailed analysis and
description is shown in the Chapter 4.
Alternative Scenario II
The Alternative Scenario II is a storm surge simulated with 1.5m sea level rise
scenario. Sea level rise is one of the natural hazards that will cause tremendous loss of
land along the coastline. The phenomenon of global sea level rise is caused by many
factors, such as global warming, upper ocean thermal expansion, etc. Although the
research results by different researchers and scientists may vary, sea level rise is an
unquestionable fact over the past century. Since the late 19th century, sea level has
risen more than 10 centimeters (IPCC, 2007). Sea level rise will have severe impacts.
The previous two scenarios are ideally projected without the variable of sea level
rise. In the third scenario, 1.5-meter (approximately 4.9 feet) sea level rise is taken into
consideration.
One effective way to achieve the goal of bringing the SS analysis on top of the
projected sea level is to subtract a certain height or depth from the DEM model

37
produced by HAZUS-MH, which was used in the former two scenarios. The
methodology to maintain the loss estimation is the same as the one used in Alternative
Scenario I.
38
CHAPTER 4 FINDINGS AND RESULTS
Base Scenario
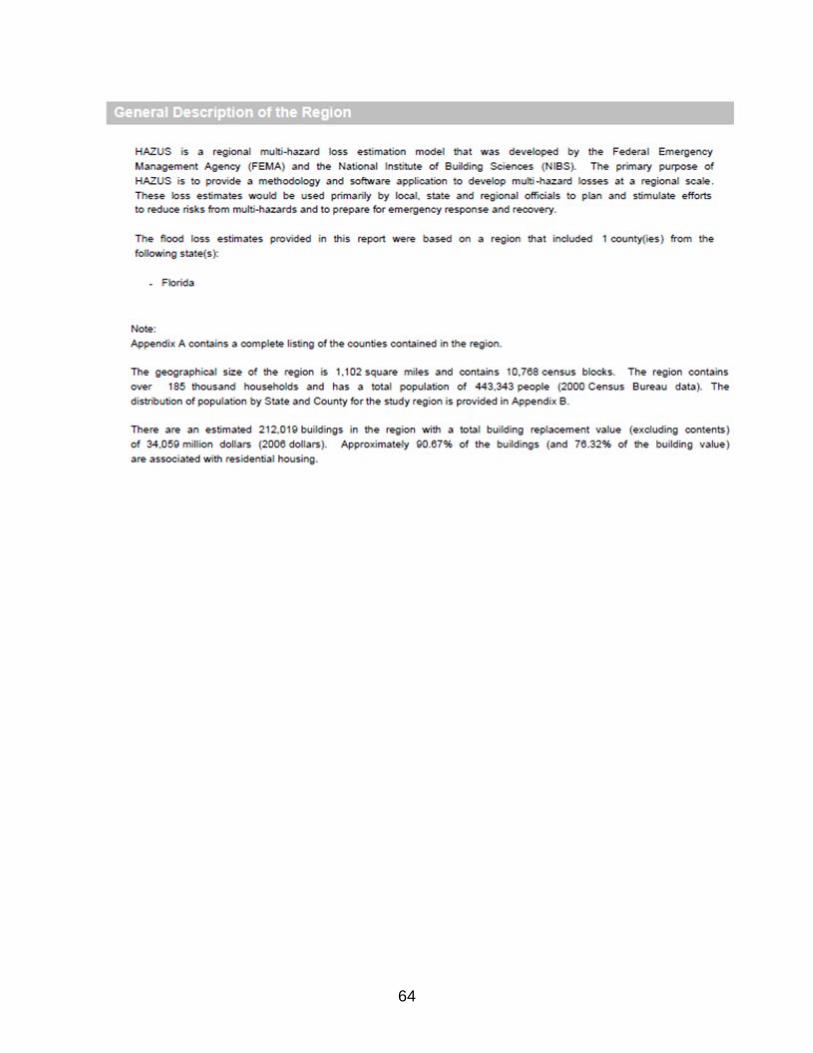
As shown in table of building exposure by occupancy in Appendix A, the global
summary report produced by HAZUS-MH indicated that: there are about 2 million
buildings affected by the hazard with a loss of value in 2006 dollars of 34 thousand
million. The majority of the damaged buildings were residential ones accounting for
76.3% of the total loss, while commercial building damage was one fifth of that for the
residential ones.
A comparison building loss by different land use types in Appendix A, shows that
the content of the building losses were weighted differently by land use type. For
residential uses the building losses were weighted more than the loss for content.
Conversely for all other uses the building losses were weighted lower than the content
loss.
Alternative Scenarios
Both the alternative scenarios were applied with Year 2010 tax parcel data. The
latest inventory data for HAZUS-MH is for Year 2000.Cencus data. Census 2010 data
has been recently released. Once it has been updated for HAZUS-MH, the process for
Base Scenario could be run again and may produce more proximal results.
The parcel data is categorized by the description accomplished with a certain land
use code according to the code from the Florida Department of Revenue. For instance,
land use codes from number 000 to 009 are residential, 010 to 039 are commercial, 040
to 049 are industrial, 50 to 69 are agricultural, 070 to 079 are institutional, and 080 to
089 are governmental (FDOR, 2011).
39
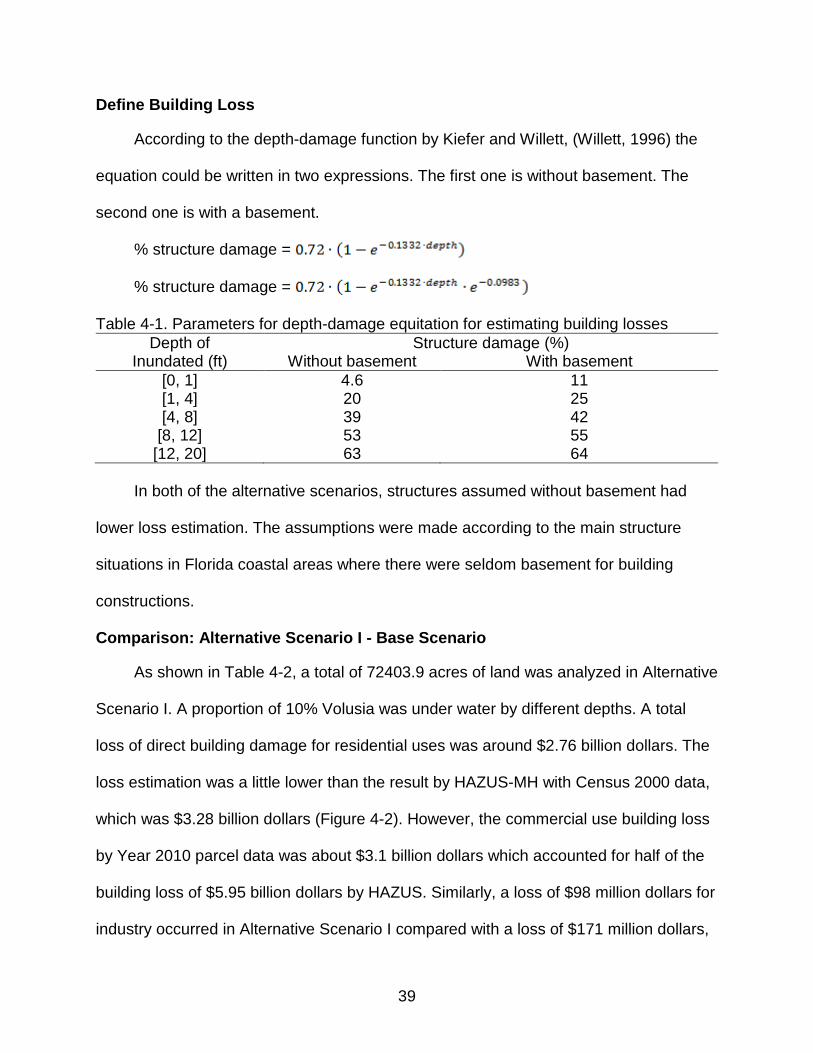
Define Building Loss
According to the depth-damage function by Kiefer and Willett, (Willett, 1996) the
equation could be written in two expressions. The first one is without basement. The
second one is with a basement.
% structure damage =
% structure damage =
Table 4-1. Parameters for depth-damage equitation for estimating building losses Depth of
Inundated (ft) Structure damage (%)
Without basement With basement [0, 1] 4.6 11 [1, 4] 20 25 [4, 8] 39 42
[8, 12] 53 55 [12, 20] 63 64
In both of the alternative scenarios, structures assumed without basement had
lower loss estimation. The assumptions were made according to the main structure
situations in Florida coastal areas where there were seldom basement for building
constructions.
Comparison: Alternative Scenario I - Base Scenario
As shown in Table 4-2, a total of 72403.9 acres of land was analyzed in Alternative
Scenario I. A proportion of 10% Volusia was under water by different depths. A total
loss of direct building damage for residential uses was around $2.76 billion dollars. The
loss estimation was a little lower than the result by HAZUS-MH with Census 2000 data,
which was $3.28 billion dollars (Figure 4-2). However, the commercial use building loss
by Year 2010 parcel data was about $3.1 billion dollars which accounted for half of the
building loss of $5.95 billion dollars by HAZUS. Similarly, a loss of $98 million dollars for
industry occurred in Alternative Scenario I compared with a loss of $171 million dollars,

40
for industry structure damage loss from HAZUS-MH default data inventory. A total loss
for Alternative Scenario I of $2.76 billion dollars occurred compared to the total loss of
$3.99 billion dollars from the Base Scenario (Figure 4-2). The lower loss in the
Alternative Scenario I may due to the changes during the10 years’ time frame or an
error when taking different depth- damage function into the calculation.
Table 4-2. Total building damage due to 100-yr SS by year 2010 parcel, Volusia, Florida (thousand dollars)
Major use Sum_Blgs Inundated area Dollar loss Percent Agriculture 186 4733.4 $8,595 0.24% Commercial 5771 5199.2 $309,982 8.65% Entertainment 824 2128.7 $61,471 1.72% Government 1681 14266.1 $194,549 5.43% Industry 1839 1696.9 $98,305 2.74% Institutional 1052 1558.4 $128,200 3.58% Miscellaneous 357 1315.0 $15,705 0.44% Not zoned agriculture 99 2566.5 $1,949 0.05% Residential 98348 38939.8 $2,763,893 77.15% Total 110157 72403.9 $3,582,654 100.00%
As a result, a lower than average estimation of loss was obtained in the analysis
for the 100-yr storm surge with Year 2010 parcel data for Volusia County, except for the
loss estimation for residential building loss. Based on the same consideration, the result
from Alternative Scenario II, which took sea level rise risk into consideration, could also
be a lower estimation as well.
Comparison: Alternative Scenario I - Alternative Scenario II
With 1.5m sea level rise (Table 4-3), an additional area of 229,551 acres would be
under water and additional $1.52 billion dollars of real property. Under a conservative
estimation, a 1.5m sea level rise could cause 30% more of Volusia County to be under
water. Of the inundated land, 4% would be residential uses and 24% would be
agricultural uses. The additional 4% loss of residential land would account for more than

41
15% of all residential area in Volusia County, creating a short-term housing crisis and a
need for permanent housing relocation in the long-term.
Table 4-3. Total Building damage due to 100-yr SS and 1.5m SLR by 2010 Parcel, Volusia, Florida (thousand dollars)
Major use Sum_Blgs Inundated area Dollar loss Percent Agriculture 435 184619.5 $27,679 0.50% Commercial 6667 6748.1 $442,565 7.988% Entertainment 881 3013.8 $82,808 1.49% Government 2126 23839.3 $333,271 6.02% Industry 2012 2271.8 $134,161 2.42% Institutional 1351 2647.2 $192,635 3.48% Miscellaneous 388 2745.4 $22,163 0.40% Not zoned agriculture 230 9294.4 $6,958 0.13% Residential 125306 66775.4 $4,298,139 77.58% Total 139396 301954.9 $5,097,915 100.00%
A set of data points for main land use types were selected from Table 4-8 to Table
4-11 at the end of this chapter. The summarizations of the data are represented in
Table 4-4 to Table4-7. An analysis for the relationship between the losses of building
value, the land use type and inundation depth was developed.
Figure 4-1 shows the inundated area of Volusia County would be by land use type
if the 0.01 chance of flooding had happened. Figure 4-2 shows the inundated area of
Volusia County would be by land use type if both the coastal flood hazard and the sea
level rise threat were considered. With the consideration of a 1.5m SLR, much more
residential and agriculture land would be under water. With the SLR, the county would
lose most of its land, and the coastline would significantly move inland.
Comparing the inundation maps in Figure 4-3 and Figure 4-4, there is only an area
of central land would remain above the water including a certain area of existing water
bodies, such as rivers, lakes, and wetlands. The more direct loss from sea level rise
could be visualized through the comparison.

42
Figure 4-1. Land use map for Alternative Scenario I of SS hazard, Volusia, Florida

43
Figure 4-2. Land Use Map for Alternative Scenario II of SS and a 1.5M SLR hazard, Volusia, Florida

44
Figure 4-3. Inundation depth map for Alternative Scenario I of SS hazard, Volusia, Florida

45
Figure 4-4. Inundation depth map for Alternative Scenario II of 100-yr SS and a 1.5m SLR hazard, Volusia, Florida

46
Figure 4-5 and Figure 4-6 show the pie charts for total percentage losses with and
without sea level rise. The percentage loss of each land use type changed very little
after taking sea level rise into consideration. This indicated that a 1.5m sea level rise
proportionally induced additional loss for each land use type, while the difference would
only be the total loss from the hazards. It was apparent that more damage was induced
with sea level rise.
Figure 4-5. Pie Charts for total percentage losses of building damage by 100-yr SS,
Volusia, Florida
Figure 4-6. Pie Charts for total percentage losses of building damage by 100-yr SS and
1.5m SLR, Volusia, Florida
47
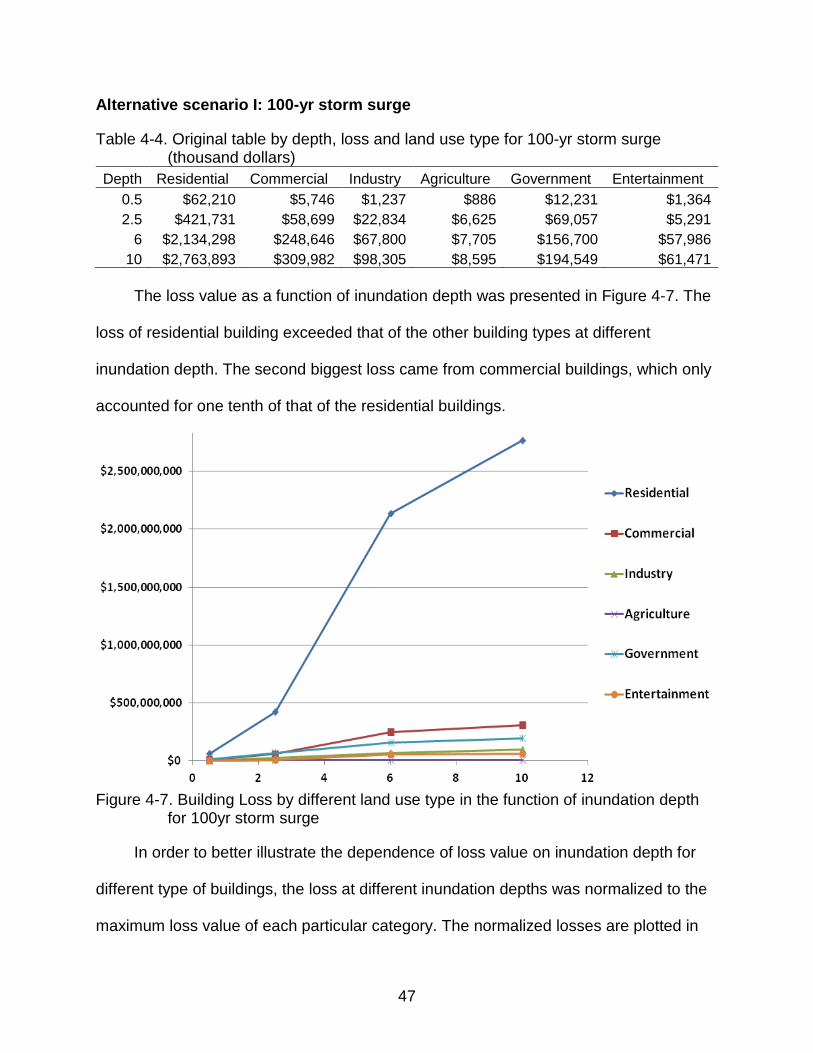
Alternative scenario I: 100-yr storm surge
Table 4-4. Original table by depth, loss and land use type for 100-yr storm surge (thousand dollars)
Depth Residential Commercial Industry Agriculture Government Entertainment 0.5 $62,210 $5,746 $1,237 $886 $12,231 $1,364 2.5 $421,731 $58,699 $22,834 $6,625 $69,057 $5,291
6 $2,134,298 $248,646 $67,800 $7,705 $156,700 $57,986 10 $2,763,893 $309,982 $98,305 $8,595 $194,549 $61,471
The loss value as a function of inundation depth was presented in Figure 4-7. The
loss of residential building exceeded that of the other building types at different
inundation depth. The second biggest loss came from commercial buildings, which only
accounted for one tenth of that of the residential buildings.
Figure 4-7. Building Loss by different land use type in the function of inundation depth
for 100yr storm surge
In order to better illustrate the dependence of loss value on inundation depth for
different type of buildings, the loss at different inundation depths was normalized to the
maximum loss value of each particular category. The normalized losses are plotted in
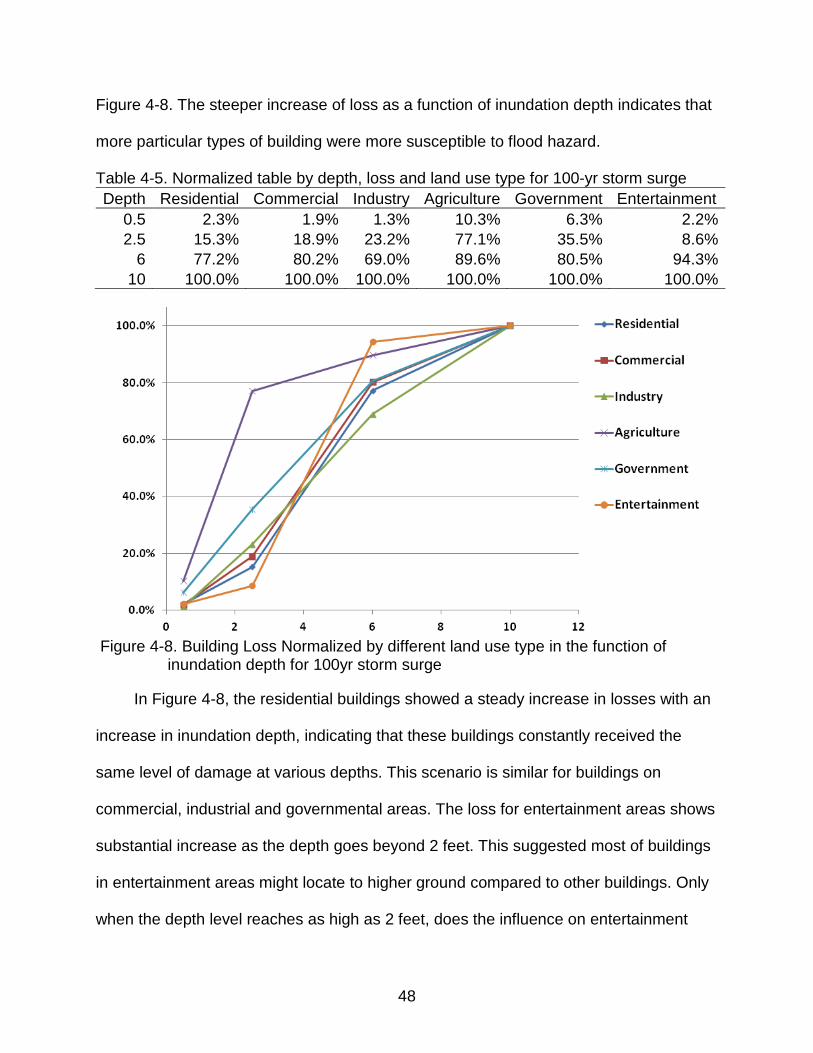
48
Figure 4-8. The steeper increase of loss as a function of inundation depth indicates that
more particular types of building were more susceptible to flood hazard.
Table 4-5. Normalized table by depth, loss and land use type for 100-yr storm surge Depth Residential Commercial Industry Agriculture Government Entertainment
0.5 2.3% 1.9% 1.3% 10.3% 6.3% 2.2% 2.5 15.3% 18.9% 23.2% 77.1% 35.5% 8.6%
6 77.2% 80.2% 69.0% 89.6% 80.5% 94.3% 10 100.0% 100.0% 100.0% 100.0% 100.0% 100.0%
Figure 4-8. Building Loss Normalized by different land use type in the function of
inundation depth for 100yr storm surge
In Figure 4-8, the residential buildings showed a steady increase in losses with an
increase in inundation depth, indicating that these buildings constantly received the
same level of damage at various depths. This scenario is similar for buildings on
commercial, industrial and governmental areas. The loss for entertainment areas shows
substantial increase as the depth goes beyond 2 feet. This suggested most of buildings
in entertainment areas might locate to higher ground compared to other buildings. Only
when the depth level reaches as high as 2 feet, does the influence on entertainment

49
areas become apparent. The loss for agricultural area exhibits differently. More than
80% of the loss occurred when the depth level increased from 0 to 3ft, indicating that
most of the agricultural areas were distributed at lower ground levels.
Alternative scenario II: 100-yr storm surge and a 1.5m sea level rise
The same process was done for the Alternative Scenario II.
Table 4-6. Normalized table by depth, loss and land use type for 100-yr storm surge and a 1.5m sea level rise (thousand dollars)
Depth Residential Commercial Industry Agriculture Government Entertainment 0.5 $29,293 $3,325 $665 $834 $4,770 $117 2.5 $515,312 $71,698 $16,516 $6,077 $89,953 $6,070
6 $1,812,096 $161,239 $49,365 $22,518 $186,715 $54,989 10 $4,298,119 $442,468 $134,161 $27,679 $333,271 $82,808
Figure 4-9. Building Loss by different land use type in the function of inundation depth
for 100yr Storm Surge and a 1.5m sea level rise
Figure 4-9 shows the loss of different buildings with the consideration of a storm
surge plus a 1.5m sea level rise. More loss occurs when 1.5m sea level rise is
considered. The loss from residential buildings is almost twice that of the scenario

50
without sea level rise. Different levels of increased loss are observed in other type of
buildings.
Table 4-7. Normalized table by depth, loss and land use type for 100-yr storm surge and 1.5m sea level rise
Depth Residential Commercial Industry Agriculture Government Entertainment 0.5 0.7% 0.8% 0.5% 3.0% 1.4% 0.1% 2.5 12.0% 16.2% 12.3% 22.0% 27.0% 7.3%
6 42.2% 36.4% 36.8% 81.4% 56.0% 66.4% 10 100.0% 100.0% 100.0% 100.0% 100.0% 100.0%
Figure 4-10. Building Loss Normalized by different land use type in the function of
inundation depth for 100yr storm surge and a 1.5m sea level rise
As shown in Figure 4-10, the dependence of loss on inundation depth shows less
variation for different types of buildings compared to those of the scenario without sea
level rise. All types of building show a relatively linear increase of loss with depth level.
Deviation from such linearity is only observed in agricultural and entertainment buildings.
This may attributed to the non-uniform distribution of the particular buildings along the
altitude. All these indicate the loss pattern will change with the sea level rise and
additional care should be taken.

51
Table 4-8. Controlled building damage between WS/WO SLR by 2010 parcel, inundation between 0 - 1ft (thousand dollars)
Inundated between 0 to 1 feet W/o sea level rise 1.5 m (4.9 feet) sea level rise
Major use Sum_Blgs Inundated area Dollar loss Percent Sum_Blgs Inundated area Dollar loss Percent Agriculture 79 1424.9 $886 0.99% 109 17680.7 $834 1.96% Commercial 489 446.8 $5,746 6.40% 414 130.3 $3,325 7.81% Entertainment 62 308.1 $1,364 1.52% 27 55.6 $117 0.28% Government 237 620.9 $12,231 13.62% 276 965.9 $4,770 11.21% Industry 86 91.5 $1,237 1.38% 89 44.5 $665 1.56% Institutional 224 241.0 $4,764 5.30% 220 367.8 $2,863 6.73% Miscellaneous 50 114.1 $1,031 1.15% 8 8.7 $466 1.09% Not zoned agriculture 40 226.6 $354 0.39% 49 571.0 $228 0.54% Residential 11511 4411.1 $62,210 69.26% 8707 4856.9 $29,293 68.82% Total 12778 7885.0 $89,828 100.00% 9899 24681.3 $42,564 100.00%

52
Table 4-9. Controlled building damage between WS/WO SLR by 2010 parcel, inundation between1 - 4ft (thousand dollars)
Inundated between 1 to 4 feet W/o sea level rise 1.5 m (4.9 feet) sea level rise
Major use Sum_Blgs Inundated area Dollar loss Percent Sum_Blgs Inundated area Dollar loss Percent Agriculture 78 3054.5 $5,739 1.09% 137 51889.7 $5,243 0.74% Commercial 586 1243.9 $52,952 10.09% 1072 1431.5 $68,373 9.67% Entertainment 111 948.1 $3,926 0.75% 100 1059.2 $5,953 0.84% Government 392 4606.6 $56,826 10.83% 468 4201.6 $85,183 12.05% Industry 333 563.7 $21,596 4.12% 221 687.0 $15,851 2.24% Institutional 169 416.6 $14,222 2.71% 261 799.8 $25,925 3.67% Miscellaneous 230 968.0 $8,951 1.71% 230 652.0 $11,966, 1.69% Not zoned agriculture 30 1201.3 $965 0.18% 88 3638.0 $2,530 0.36% Residential 16972 10602.1 $359,520 68.52% 26083 17243.6 $486,018 68.74% Total 18901 23604.7 $524,701 100.00% 28660 81602.4 $707,047 100.00%

53
Table 4-10. Controlled building damage between WS/WO SLR by 2010 parcel, inundation between 4- 8ft (thousand dollars)
Inundated between 4 to 8 feet W/o sea level rise 1.5 m (4.9 feet) sea level rise
Major use Sum_blg Inundated area Dollar loss Percent Sum_blg Inundated area Dollar loss Percent Agriculture 19 193.8 $1,079 0.05% 151 90533.9 $16,441 1.01% Commercial 3528 2614.3 $189,946 8.75% 1032 1738.5 $89,540 5.50% Entertainment 561 608.2 $52,695 2.43% 285 1091.5 $48,918 3.00% Government 738 7584.4 $87,642 4.04% 405 5598.6 $96,761 5.94% Industry 912 703.8 $44,966 2.07% 398 559.2 $32,848 2.02% Institutional 478 632.8 $79,849 3.68% 271 680.3 $39,842 2.45% Miscellaneous 46 139.9 $2,499 0.12% 88 1750.5 $4,052 0.25% Not zoned agriculture 25 942.5 $449 0.02% 60 3758.6 $3,258 0.20% Residential 56448 17970.6 $1,712,567 78.86% 31114 21302.9 $1,296,784 79.63% Total 62755 31390.3 $2,171,697 100.00% 33804 127013.9 $1,628,448 100.00%

54
Table 4-11. Controlled building damage between WS/WO SLR by 2010 parcel, inundation between 8 -12ft (thousand
dollars)
Inundated between 8 to 12 feet W/o sea level rise 1.5 m (4.9 feet) sea level rise
Major use Sum_Blgs Inundated area Dollar loss Percent Sum_Blg Inundated area Dollar loss Percent Agriculture 10 60.2 $890 0.11% 38 24515.2 $5,160 0.16% Commercial 1168 894.2 $61,336 7.70% 4145 3443.5 $281,228 8.89% Entertainment 90 264.3 $3,484 0.44% 469 807.6 $27,818 0.88% Government 314 1454.2 $37,848 4.75% 977 13073.2 $146,556 4.63% Industry 508 337.9 $30,504 3.83% 1304 981.1 $84,795 2.68% Institutional 181 268.0 $29,363 3.69% 599 799.3 $124,003 3.92% Miscellaneous 31 93.0 $3,223 0.40% 62 334.2 $5,678 0.18% Not zoned agriculture 4 196.2 $180 0.02% 33 1326.8 $941 0.03% Residential 13417 5956.0 $629,594 79.05% 59401 23369.6 $2,486,022 78.62% Total 15723 9523.8 $796,427 100.00% 67028 68650.4 $3,162,207 100.00%
55
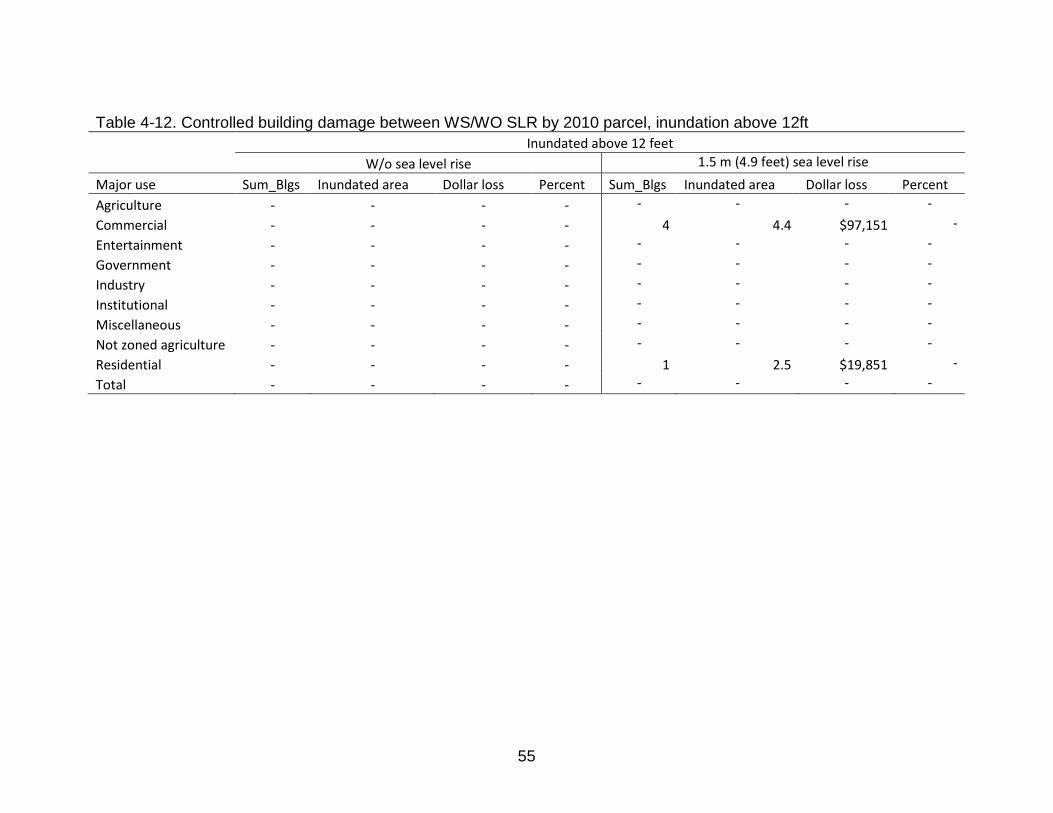
Table 4-12. Controlled building damage between WS/WO SLR by 2010 parcel, inundation above 12ft
Inundated above 12 feet W/o sea level rise 1.5 m (4.9 feet) sea level rise
Major use Sum_Blgs Inundated area Dollar loss Percent Sum_Blgs Inundated area Dollar loss Percent Agriculture - - - - - - - -
Commercial - - - - 4 4.4 $97,151 -
Entertainment - - - - - - - -
Government - - - - - - - -
Industry - - - - - - - -
Institutional - - - - - - - -
Miscellaneous - - - - - - - -
Not zoned agriculture - - - - - - - -
Residential - - - - 1 2.5 $19,851 -
Total - - - - - - - -

56
. CHAPTER 5 DISCUSSION
Discussion of Findings and Methods
To calculate the losses due to flood is a complicated and comprehensive work.
Many factors could add up to the sum of the loss. Both direct loss and indirect loss
should be considered. Direct loss includes the physical damages of the building, the
direct economic loss, the crop loss, shelter for people. Indirect loss includes the
upcoming wildfire, removal of debris, people’s relocation or the area’s redevelopment
(Zhang, et al., 2011).
There are particular damage functions for different categories suffered from
flooding. For example, the loss of building content is usually calculated by correlating
the characteristics of the buildings by weight to a certain percentage of the building
value. For the Volusia case study, further in-depth research should be carried out to
define those certain parameters.(Davis, 1992) Other than that, a more accurate
conclusion could be drawn. However, debates come up in some specific field. The
damage function for agricultural land needs to be discussed because some research
shows that after certain intense floods might even bring benefits to the agriculture land,
as the soil becomes more fertile after the flood.
However, efficient evaluation of the criteria is of critical importance in the process
of comparing the results of projected scenarios. A good evaluation should be
comprehensive enough to clarify the results of the associated objectives as well as be
measurable for a more convincible quantitative analysis. At last, it should be
representative, which means it could fully cover certain aspects of the situation and

57
would not be confusing to cause double-counting either for further analysis , for
conclusion drawing-out, or for decision- making.(Rashed & Weeks, 2003)
Other than depth, some other primary factors such as velocity of water during the
flooding period and how long it takes for water to recede the after the flooding period
are also contributing to flood losses. (Bullock, et al. 2008) Some other type of hazards
associated with flooding could also contribute to flood losses, suggesting, more damage
functions needs to be figured out through future research.
On the other hand, the data used in this research is the best available data in
reach. Nevertheless, the method in data inventory could be improved. HAZUS- MH level
2 provide a platform which is Comprehensive Data Management System (CDMS) tool.
By exploring this, more updated date from the newest census or curves on site could be
processed in the software, such as the population, numbers and types of the buildings,
and other related parameters.
Future Research Opportunities
R. Klein and R. Nicholls proposed three level of assessment to the vulnerability of
coastal area by the limited available data. Planning assessment (PA) is considered to
be the in-depth criticism with the suitability analysis. The other two levels in order are
screening assessment (SA) to get a facade view to the vulnerability and then
vulnerability assessment (VA) to have a comprehensive consideration to effects from
various aspect might lead to vulnerability.(Nicholls, 1999) In that case, further study on
suitability and sustainability analysis in planning scope and appropriate implementation
might be formed base on this. Since this type of research could visualize the future
possible hazards, with more specific and accurate input, the relative scenarios might be
created and analyzed to help planners work with emergency managers to develop and

58
implement disaster plans and mitigation plans and to assist with disaster response
activities. On the other hand, planning strategies development may also take the
visualized results into consideration to make mitigation plans and evacuation plans for
short-term use, and land use adaptation plans, and population reallocation plans for
long-term use.

59
CHAPTER 6 CONCLUSION
In this study, the “Base Scenario” is ideally static with variables including
population growth, land use change, socio-economic status, and changes in the natural
environment are not taken into account. This scenario, however, is necessary to
compare future possibilities. The “Alternative Scenario I” uses Year 2010 tax parcel data
and a Volusia County DEM raster to estimate building loss by land use types with Kiefer
and Willett’s depth-damage function. The estimation was with an acceptable error and
lower than the loss in the Base Scenario. The “Alternative Scenario II” is based on
“Alternative Scenario I” by incorporating a modified Volusia County DEM raster, which
was subtracted by 1.5m (4.9 feet). This approach intends to simulate a situation with a
1.5m sea level rise. The loss was dramatically increased by this which indicated that
sea level rise can hardly be ignored for an efficient land use planning.
Therefore, it is important to create an appropriate model and fully evaluate the
results in order to determine whether the data is reasonable and ready to be used for
decision‐making. The decision-maker should also carefully interpret the results and
provide their own inputs when it is necessary. (Darwin & Tol, 2001) In addition, it would
be helpful to have comparisons between the real events that take place and historical,
documented losses, as well as the existing potential losses to examine the validity of
the model.
Considering the factors that can impact the study region, the results can be re-run
and documented to support mitigation strategies.(Davis, 1985) At this stage one can
identify the assets that are subject to the greatest potential damage (FEMA 2004).

60
Not only the direct economic losses, but also the indirect loss of the agriculture
land products output, industrial products output and damage of the infrastructure are
expected to cause more severe economic losses due to flooding by sea level rise and
storm surge. (McLeod, et al., 2010) This also greatly increases the possibility of
bankruptcy of various entities involved due to limited coverage of FEMA’s mitigation
plan and insurance companies. Moreover, the extra expense on post-disaster resilience
will increase the financial burden of local and federal governments, which will lead to
potential budget-cuts in education, health care and other social benefits. The
government should not only keep the above fact in mind but also that it is important to
remind individuals of these risks so that they are willing to spend more on flood
insurance. Many people do not pay attention to the threat of such infrequent risk to their
properties. If people could understand that the risks exist, they will be more cooperative
and supportive toward the implementation of revised future land use and/or evacuation
plans in certain areas. However, the extra expense of these plans has to be afforded by
someone, which needs to be further discussed.
Human-caused environmental deterioration caused by flooding has been well
documented. (Cushman, et al., 1991) On the contrary, wetlands, swamps, mangroves
are ecologically positive with water drainage capacity and they are important in terms of
flood prevention. Since these risks of nature disasters are inevitable, we should prepare
to face the challenges by keeping up the related systems in pace with that of climate
change. The HAZUS-MH model should be employed to a greater extent by urban and
regional planners. With the application of the model, the long-term impacts of storm
61
surge and sea level rise on infrastructure, property parcels, and other public and private
resources may be visualized.
This research eschews the typical science or engineering schemes to help or
prevent inevitable hazards and to offer visualized scenarios to help related
organizations to make more serious decisions to reduce the hazards damage.
According to the results of the hypothesis of the research, more rational and appropriate
coastal county planning implementation should be seriously considered in the future
with regard to aspects such as conditional developments caused by climate change, in
terms of sea level rise. This is likely to be a reasonable approach to allocating limited
resources. From a societal perspective, all qualifying proposals are worth pursuing. This
type of analysis should help politicians to begin to seriously think about whether
development within coastal areas is appropriate and what might be the liability
associated with those decisions for Florida.

62
APPENDIX A VOLUSIA 100-YR COASTAL FLOOD EVENT SUMMARY REPORT

63
64

65
66

67
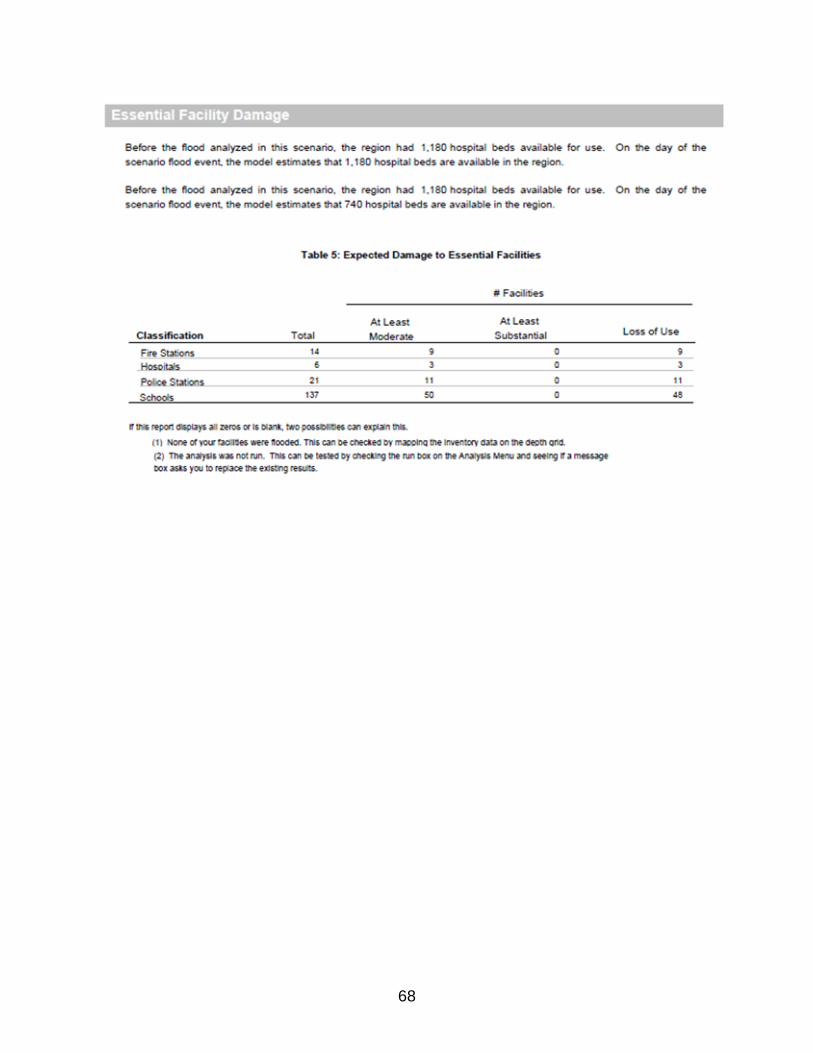
68

69
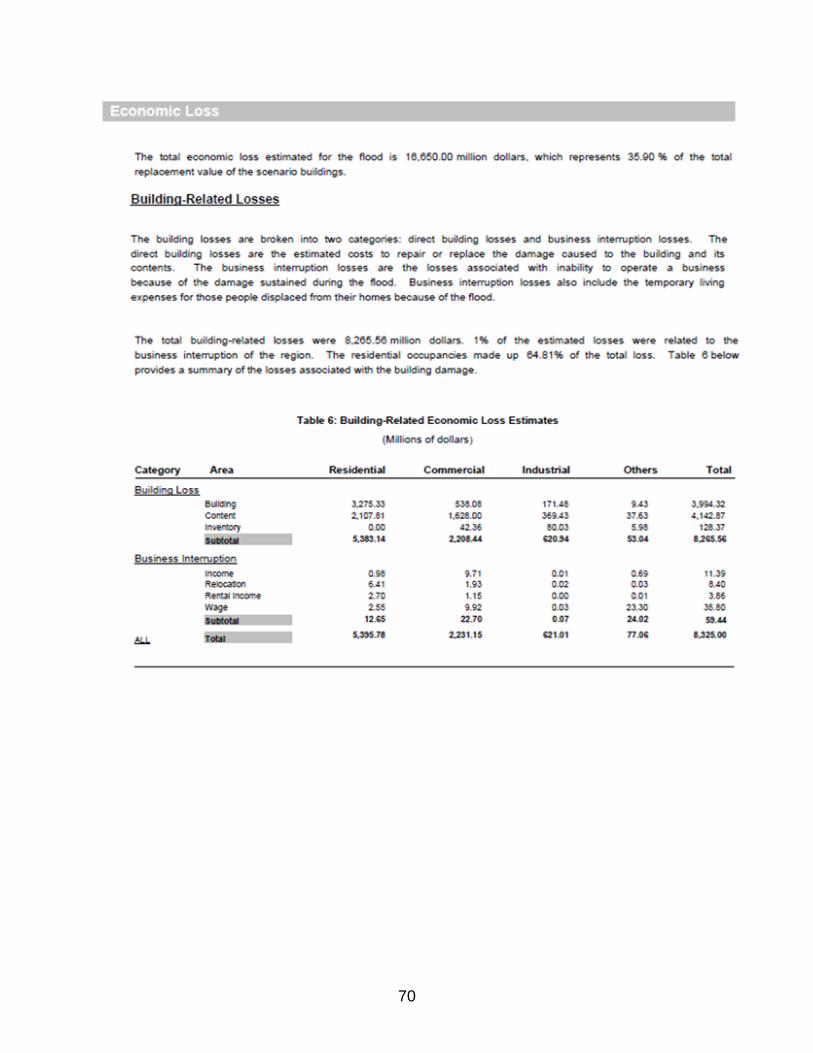
70
71

72

73
APPENDIX B VOLUSIA 100-YR COASTAL FLOOD EVENT QUICK ASSESSMENT REPORT

74
LIST OF REFERENCES
Bullock, J. A., Haddow, G. D., & Haddow, K. S. (2008). Global Warming, Natural Hazards, and Emergency Management. Boca Raton: CRC Press
Cushman, R. M., Gornitz, V. G., & White, T. W. (1991). In Oak Ridge National Laboratory., United States. Dept. of Defense., United States. Dept. of Energy. and United States. Dept. of Energy. Office of Scientific and Technical Information. (Eds.), Vulnerability of the US to future sea level rise [electronic resource]. Washington, D.C. : Oak Ridge, Tenn: United States. Dept. of Defense ; distributed by the Office of Scientific and Technical Information, U.S. Dept. of Energy. Online at: http://www.osti.gov/bridge/servlets/purl/5875484-vJgAJI/
Darwin, R. F., & Tol, R. S. J. (2001). Estimates of the Economic Effects of Sea Level Rise. Environmental and Resource Economics, 19(2), 113-129.
Davis, S. A., Skaggs, L. L., & U.S. Army Engineer Institute for Water Resources. (1992). Catalog of residential depth-damage functions used by the Army Corps of Engineers in flood damage estimations. Ft. Belvoir, Va: U.S. Army Corps of Engineers, Water Resources Support Center, Institute for Water Resources.
Davis, S. A., & U.S. Army Engineer Institute for Water Resources. (1985). Business depth-damage analysis procedures. Ft. Belvoir, Va: US Army Corps of Engineers, Engineer Institute for Water Resources.
FDOR. (2011). 2011 production guide and data record layout for the comma delimited file format. Online at: ftp://sdrftp03.dor.state.fl.us/Tax%20Roll%20Data%20Files/About%202011%20NAL-SDF-TPP%20Files/2011%20production%20guide%20and%20data%20record%20layout.pdf
FEMA. (2011). Flood insurance study: Volusia County, Florida and incorporated areas. Washington, D.C.: Federal Emergency Management Agency.
FEMA. (2011) Hazus®-MH MR5 multi-hazard loss estimation methodology flood information tool user manual. Online at: http://www.fema.gov/library/viewRecord.do?id=4454 Accessed (05.07.11)
FEMA. (2011) Hazus®-MH MR5 multi-hazard loss estimation methodology flood model technical manual. Online at: http://www.fema.gov/library/viewRecord.do?id=4454 Accessed (05.07.11)
FEMA. (2011) Hazus®-MH MR5 multi-hazard loss estimation methodology flood model user manual. Online at: http://www.fema.gov/library/viewRecord.do?id=4454 Accessed (05.07.11)

75
IPCC. (2007). Climate change 2007: impacts, adaption and vulnerability.Online at: http://www.ipcc.ch/publications_and_data/publications_ipcc_fourth_assessment_report_wg2_report_impacts_adaptation_and_vulnerability.htm Accessed (08.08.11)
Matisziw, T., & Grubesic, T. H. (2011). Geographic perspectives on vulnerability analysis. GeoJournal. Online at: http://www.springerlink.com/content/y67288739t348w47/fulltext.pdf Accessed (09.10.11)
McLeod, E., Hinkel, J., Vafeidis, A., Nicholls, R., Harvey, N., & Salm, R. (2010). Sea-level rise vulnerability in the countries of the Coral Triangle. Sustainability Science, 5(2), pp207-222.
Murley, J. F. (2004). Assessment of Redefining Florida's Coastal High Hazard Area. Online at: http://docs.cdsi.fau.edu/cues/CHHAFINALREPORT-MAY212008.pdf Accessed (05.07.11)
Nicholls, R. J. (1999). Assessment of Coastal Vulnerability to Climate Change. Ambio, 28(2), pp182 - 187.
Oliver, C. E. (2010). Catastrophic disaster planning and response. Boca Raton: CRC Press.
Puszkin, C. A., Hernandez, D., & Murley, J. (2006). Land use planning and its potential to reduce hazard vulnerability: Current practices and future possibilities. Marine Technology Society Journal, 40(4), pp7-15.
Rashed, T., & Weeks, J. (2003). Assessing vulnerability to earthquake hazards through spatial multicriteria analysis of urban areas. International Journal of Geographical Information Science, 17(6), pp547-576.
Simpson, D. M. (1998). Risk and disaster: Arguments for a community-based planning approach. Berkley Planning Journal, 7.
Titus, J. G., & Richman, C. (2001). Maps of lands vulnerable to sea level rise: modeled elevations along the US Atlantic and Gulf coasts. Climate research, 18(3), pp205-228.
Vivien, G. (1991). Global coastal hazards from future sea level rise. Global and Planetary Change, 3(4), pp379-398.
Willett, J. C. (1996). Analysis of Non-Residential Content Value and Depth-Damage Data for Flood Damage Reduction Studies. Online at: http://www.iwr.usace.army.mil/docs/iwrreports/96-R-12.pdf Accessed (09.10.11)
Zhang, K., Ross, M & Bergh, C. (2011). Assessment of sea level rise impacts on human population and real property in the Florida Keys. Climatic Change, 107, pp129 -146.

76
BIOGRAPHICAL SKETCH
Yuyang Zou was born in 1984 in Hubei, China. She has a degree of Bachelor of
Architecture from Huazhong University of Science and Technology. She is pursuing her
degree of Master of Arts in Urban and Regional Planning at University of Florida. She
has worked as a research assistant for Dr. Paul Zwick since 2009. Her master’s studies
are focused on GIS-based analysis for nature hazards and land use suitability models.
She has also been a research assistant at in the Shimberg center for Housing Studies
since May 2011. Her research at the Shimberg Center involves the development of the
Affordability Housing Suitability Model. She will continue the research her after
graduation.