Embed Size (px)
Citation preview

Clark UniversityClark Digital CommonsInternational Development, Community andEnvironment (IDCE) Master’s Papers
5-2016
GIS and Spatial Analysis: Summer Internship withthe Center for Health and Global Environment atthe Harvard T.H. Chan School of Public HealthWensi [email protected]
Follow this and additional works at: https://commons.clarku.edu/idce_masters_papers
Part of the Environmental Studies Commons, International and Area Studies Commons, and theUrban Studies and Planning Commons
This Thesis is brought to you for free and open access by the Master’s Papers at Clark Digital Commons. It has been accepted for inclusion inInternational Development, Community and Environment (IDCE) by an authorized administrator of Clark Digital Commons. For more information,please contact [email protected], [email protected].
Recommended CitationHu, Wensi, "GIS and Spatial Analysis: Summer Internship with the Center for Health and Global Environment at the Harvard T.H.Chan School of Public Health" (2016). International Development, Community and Environment (IDCE). 71.https://commons.clarku.edu/idce_masters_papers/71

1
GIS and Spatial Analysis:
Summer Internship with the Center
for Health and Global Environment
at the Harvard T.H. Chan School of Public Health
Wensi Hu
Degree will be conferred May 2015
A MASTER’S PROJECT
submitted to the faculty of Clark University, Worcester, Massachusetts,
in partial fulfillment of the requirements for the degree of
Masters of Arts in Geographic Information Sciences for Development and Environment
in the Department of International Development, Community, and Environment
Accepted on the recommendation of
Jie Tian, Ph.D., Project Advisor

2
ABSTRACT
GIS and Spatial Analysis:
Summer Internship with the Center for Health and Global Environment
At the Harvard T.H. Chan School of Public Health
Wensi Hu
The objective of the report is to introduce and discuss my internship at the
Center for Health and Global Environment at the Harvard T.H. Chan School of Public
Health, in Boston, MA. The internship lasted four months from the middle of May to the
middle of September, with 15 hours each week. My tasks included geocoding,
developing GIS-calculated variables, data visualization/mapping and documentation.
Creation of variables was vital as it included air quality data, land use map, greenness
(NDVI), roads data as well as parks data.
I am happy that I have a chance to work under a professional environmental with
talented students and professors. I gained quantities of knowledge about both
geospatial data and non-geospatial data. Overall, I am very satisfied with my summer
internship, and I encourage everyone who is interested in public health to apply for
internships like this.
Jie Tian, Ph.D., Project Advisor

3
ACADEMIC HISTORY
Name: Wensi Hu
Place of Birth: Dazhou, China Date: August 9th, 1991
Baccalaureate School: Date: June, 2014
Chengdu University of Technology
Baccalaureate Subject: Geospatial Information & Digital Technique

4
DEDICATION
I would like to thank my parents for supporting me to pursue the academic goals in
America. I would also like to thank the GISDE communities and IDCE staff who help me
to adept the new environment and acquaint with the Clark University.

5
ACKNOWLEDGEMENTS
I would like to thank Gary Adamkiewicz who offered me the opportunity to work at the
Center for Health and Global Environment at the Harvard T.H. Chan School of Public
Health. I would also like to thank Linyan, a Ph.D. student of Public Health. We worked
together in a same project. She was in charge of the statistics analysis section and I was
responsible for the GIS section. She guided me to complete the whole research project
and let me acquainted with the working condition. After the internship, we continued
contacting each other and she gave me a lot of useful advice when I faced statistics
problems in the class of Intermediate Quantitative Methods. My thanks as well to my
professors, Yelena Ogneva-Himmelberger and Jie Tian. Without the class of Advanced
Vector taught by Yelena, I would not have been mastered spatial analysis and mapping
using ArcMap. Without Jie’s helps, I could not solve technical problems in the summer
internship.

6
TABLE OF CONTENTS
Chapter 1. INTRODUCTION.............................................................................................................. 7
CHAPTER 2: DESCRIPTION OF ORGANIZATION ............................................................................... 8
2.1 Organization Introduction ..................................................................................................... 8
2.2 Location ................................................................................................................................. 8
2.3 Area of Expertise ................................................................................................................... 9
2.4 Organization Structure ........................................................................................................ 10
CHAPTER 3: INTERNSHIP DESCRIPTION ......................................................................................... 11
3.1 Project Introduction ............................................................................................................ 11
3.2 Internship Responsibility ..................................................................................................... 11
3.2.1 Geocoding ..................................................................................................................... 11
3.2.2 Air Quality Data ............................................................................................................ 12
3.2.3 Land Use ....................................................................................................................... 13
3.2.4 NDVI .............................................................................................................................. 13
3.2.5 Roads Data .................................................................................................................... 13
3.2.6 Parks Data ..................................................................................................................... 13
3.3 Support of Organization’s Project ....................................................................................... 14
CHAPTER 4. INTERNSHIP ASSESSMENT ......................................................................................... 15
4.1 Skills Required ..................................................................................................................... 15
4.2 Skills Learned ....................................................................................................................... 16
4.3 Relation to Career Goal ....................................................................................................... 16
4.4 Recommendation ................................................................................................................ 17
CHAPTER 5. CONCLUSION ............................................................................................................. 18
GLOSSARY ...................................................................................................................................... 19
BIBLOGRAPHY ................................................................................................................................ 20
Figures ........................................................................................................................................... 21

7
CHAPTER 1. INTRODUCTION
The seminar of Geographic Information Science for Development and
Environment (GISDE) program, held by Professor Yelena, provided GIS information and
helped us plan a career path. The requirement of graduation not only include courses,
but also a fulfilment of a track that could be the Internship track, Research track or
Portfolio track. I chose the internship track because I wanted to work directly after my
graduation next year. The internship would definitely rich my professional work
experience and allow me to be more competitive in job hunting. Through one year study
at Clark, I was equipped with more professional GIS knowledge and skills. The internship
could be a best way to practice and improve myself.
In the summer of 2015, I got an internship in Harvard School of Public Health and
as a GIS specialist to focus on a project that explored the associations between the
public health and built environment in Suzhou, China. It was a perfect working and
learning experience for me to apply GIS spatial analysis to a real research project. During
the internship at Harvard, I devoted to GIS-based variables creation and map design
using ArcGIS software. The internship also provided me the chance to meet with many
well-known professors in public health field.
The internship paper has 5 chapters in total. Chapter 2 provides details on the
Harvard school of public health and the research center. Chapter 3 introduces the
responsibility of the internship, which includes specific works I did and the methodology
I used. Chapter 4 is the internship assessment, which mainly describes the skills required
and skills learned. The end of the report includes a conclusion, figures and literatures
sources.

8
CHAPTER 2: DESCRIPTION OF ORGANIZATION
2.1 Organization Introduction
Harvard University was established in 1636 and is the oldest institute of higher
education in the United States. The University has grown from 9 students at first, to
more than 20,000 degree candidates now, including professional, undergraduate and
graduate students. Plus, there are more than 360,000 living alumni in the United States
and over 190 countries all over the world. Harvard is honored for its great
achievements, including 47 Nobel Laureates, 32 heads of state, 48 Pulitzer Prize
Winners. “The mission of Harvard University College is to educate the citizens and
citizen-leaders for our society. We do this through our commitment to the
transformative power of a liberal arts and sciences education”. (Harvard website 2015)
Harvard School of Public Health is the first graduate training program in public
health in United States, and definitely The Harvard-MIT School of Health Officers is the
predecessor in the field of public health. It was founded in 1913, school of health office
separated from MIT as an affiliate of medical school of Harvard in 1922 and finally
became an independent school in 1946. As of January 2015, Harvard School of Public
Health officially was renamed as Harvard T.H Chan School of Public Health in
appreciation of Mr. T.H Chan through The Morningside Foundation for his largest single
donation, $350 million. Since established, the School has been devoted to the mission of
advancing worldwide public’s health. To achieve this mission, the School provides the
excellent education to students who are future scientists, practitioners and leaders,
research new discoveries to promote public’s health in whole world, enhance health
capacity and offer best services for public, and inform public of health information and
let people realize health itself as a fundamental right of every human being.
2.2 Location
The Harvard T. H Chan School of Public Health is comprised of two parts. The
main buildings is located at 651 and 677 Huntington Avenue on the Harvard Longwood
Campus in Boston, which are used to teach and research. A second part of the school is

9
located in the Landmark Center Building on the corner of Brookline Avenue, which
maintains offices and is also used for teaching and research.
2.3 Area of Expertise Harvard University is a well-known university, their main area of work and
expertise is to foster excellent talents to the society and contribute to the society. In
addition to the education, research is as an important role. Professors and students
discover and do researches together to make landmark contribution for public health
worldwide.
The field of public health is an inter-discipinary as well as a multidiscipline, so the
school’s faculty and students specialize in several disciplines, for example biology,
quantitative science, social science, statistics, environmental science, genetics, policy
making, nutrition and behavior science. The biological, chemical and genetic knowledge
in biology field help them to confront the urgent diseases, such as AIDS and many types
of cancer, and for providing treatment. For the quantitative science, the most important
disciplines are Epidemiology and Biostatistics. Biostatistics involves many statistical
science that allow them to explore the underlying impacts of health problems and
examine the relations between health problems and different factors. In addition,
disease prevention is the core mission of public health, social science lets them better
understand societal influences of health-related behaviors and inform public of policy to
prevent disease.
Geographic Information System (GIS) may be not a core discipline, but GIS
techniques could support public health in different way. GIS as a useful tool can develop
GIS-calculated variables. Taking my summer internship as an example, the research
explored the associations between attributes of the built environment on resident
health. We required variables that is related to locations, like distance to roads,
greenness, and air pollution for each resident. Using GIS techniques, we can relatively
easy to get these variables. In addition, geographic visualizing could inform of proper

10
understanding and lead best decisions, geospatial tools could reveal spatial
autocorrelation between causes and factors.
2.4 Organization Structure The Harvard T, H Chan School of Public Health has eight departments, including
Biostatistics, Environmental Health, Epidemiology, Genetics and Complex Disease,
Global Health and Population, Health Policy and Management, Immunology and
Infectious Diseases, Nutrition as well as Social and Behavior Science. There are total
1251 students and 476 faculty in 2014. 838 students are U.S citizens and permanent
residents and 413 students are international students. In the School, 60% of students
are females and rest of 40% students are males. The School of Public Health faculty
include 187 primary appointments and 88 tenured. In the School history, they have
received two Nobel Prize, five MacArthur Awards, the National Medal of Science, etc.
The acting dean now is David Hunter.

11
CHAPTER 3: INTERNSHIP DESCRIPTION
3.1 Project Introduction
The urbanization is increasing rapidly in the current time. Factors such as air
pollution, lack of greenness and high population density from the result of excessive
urbanization affects people’s lives, the Center for Health and Global Environment at the
Harvard T.H. Chan School of Public Health is tasked with designing health buildings that
promote human health. Working with the largest construction company in China,
researchers conducted a study to investigate the associations between attributes of
residential housing, neighborhoods and other elements of the built environment on
resident health in Suzhou, China. The study area is shown in Figure 1.This project is
under the program of Nature, Health & Built Environment and led by program leader,
Gary Adamkiewicz. Linyan Li who is a PHD student in Harvard School of Public Health
was primarily responsible for the whole project and built statistical models. I was hired
as the GIS research assistant.
3.2 Internship Responsibility As the GIS research Assistant, my tasks included geocoding, developing GIS-
calculated variables, data visualization/mapping and documentation. Creation of
variables was vital as it included air quality data, land use map, greenness (NDVI), roads
data as well as parks data.
3.2.1 Geocoding
When I accessed the project, they researchers collected over 8,000 residents’
information in Suzhou, including addresses and public health information via surveys.
The surveys were conducted in schools in Suzhou, including kindergartens and middle
schools shown in Figure 1. About 2,000 residents’ data came from 12 kindergartens and
about 6,000 residents data came from 12 middle schools. My first work was to geocode
these residents’ points on the map.
I used a free geocoding software called XGocoding to automatically convert
addresses to points of latitude and longitude. The XGeocoding specializes in geocoding

12
Chinese addresses whose format is different from English addresses because it uses
Baidu Map as address resolution server. Baidu Map is more accurate than Google Maps
in China. After automatic geocoding, each address in the result table has an accuracy
index ranging from 1 to 5. 1 represents high accuracy and 5 represents low accuracy. I
manually geocoded the addresses that had an accuracy index greater than 2 and
ensured the geocoding quality.
So far, the geocoding work did not finish yet. In meeting the security
requirement from Chinese government, the Baidu Map Geocoding API applies the BD-09
instead of normal WGS-1984 as their coordinate system, so the latitude and longitude
cannot display in ArcMap with WGS-1984 coordinate system. The parameters of BD-09
coordinate system are not open to the public but I found an approximate formula that
converts latitude and longitudes under BD-09 to under WGS-1984. After the coordinate
conversion, the geocoding work was finished.
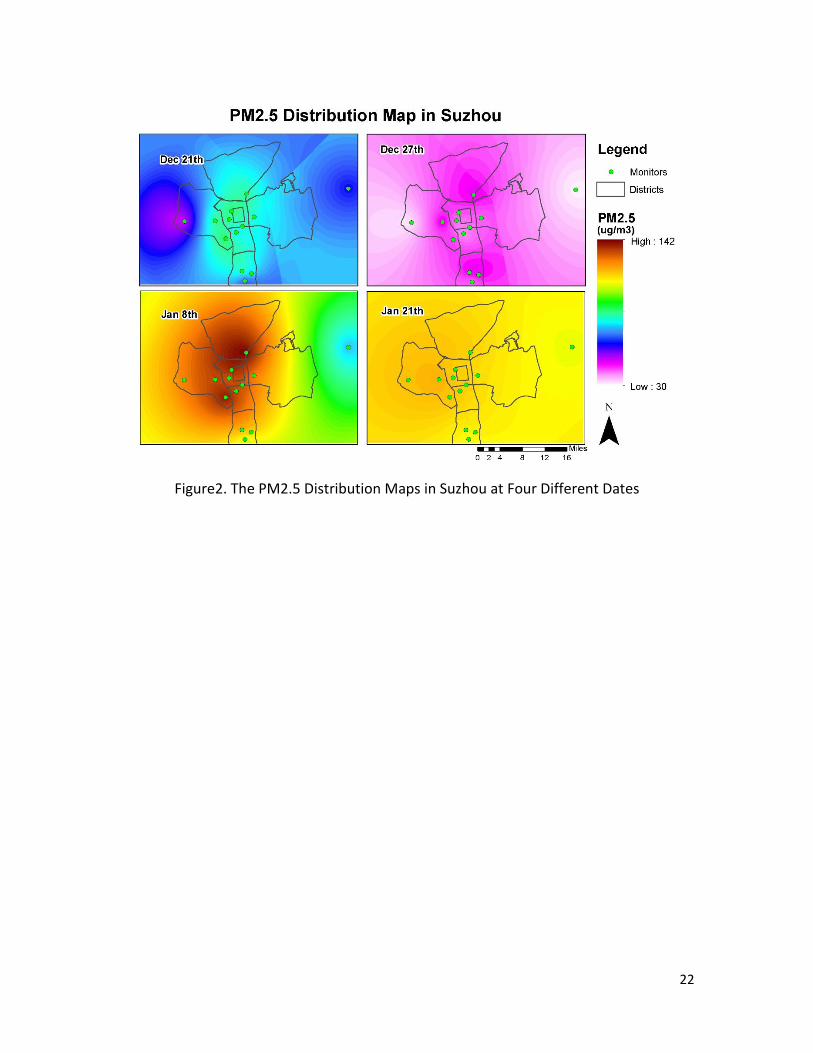
3.2.2 Air Quality Data
The center provided daily air quality data from December of 2014 recorded by
92 monitors in Suzhou. Each monitor included average concentration of PM 2.5, SO2,
NO, O3, NO2 and CO every day. In order to know the effect of air pollution on eight
thousand residents, one of method was to assign the closest monitor’s value to each
resident. However, as here are over 8,000 thousand residents and only 92 monitors, it is
not an ideal method.
Another method was to employ interpolation to make continuous maps for each air
pollutant. Based on the literature (Wong, David W., Lester Yuan, and Susan A. Perlin,
2004), I chose Kriging method to do interpolations by using the GeoSpatial Wizard in
ArcMap. The Kriging regression model was adjusted according to different air pollutants.
For example, the recorded CO data had several outliers and in order to promote the fit
of the model, I eliminated samples that are outside of three standard deviation from the
mean.

13
3.2.3 Land Use
Land types are found around residents is also a key factor affect human’s life.
Our project planned to do ‘Land Use Regression’ to analyze the influence of land use on
public health. So, my work is to make land use map of Suzhou.
I downloaded the remote sensing image of Suzhou in Jul 24, 2014 from Landsat 8
on USGS website. I then classified the imagery using ‘Maxlike’ and ‘Unmixing’ modules
in TerrSet. My classification map is shown in Figure 3 and includes five categories, water,
residential, industry, vegetation and roads. In order to calculate the percentage of land
use types for each resident at final step, I broke them into five individual Boolean
images and one image corresponded to a land use type.
3.2.4 NDVI
Greenness for public health is evaluated by NDVI, which stands for Normalization
Difference Vegetation Index. The pixels with values greater than 0 are regarded as
vegetation. The NDVI maps could be obtained by using VegIndex module in TerrSet or
calculation with the formula (Infrared – red) / (Infrared – red). The NDVI maps for
Suzhou are shown in the Figure 4, 5, 6, 7.
3.2.5 Roads Data
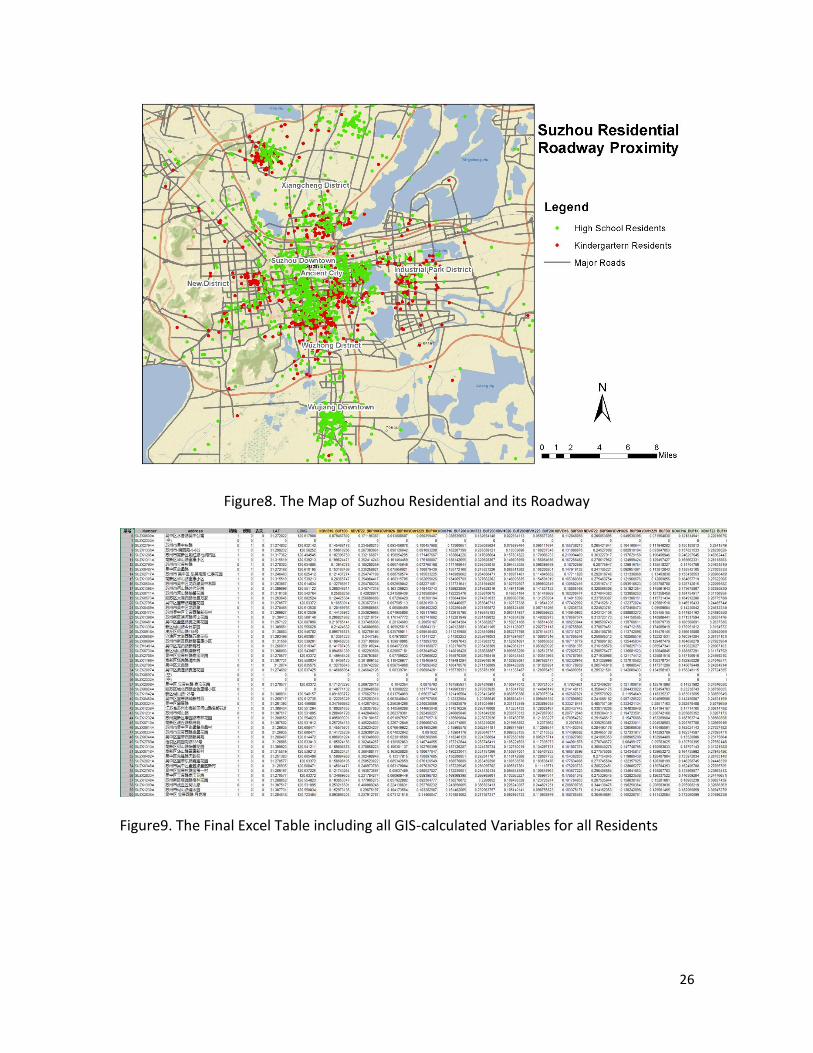
Referring to Figure 8, red and green points are residents in Suzhou and grey lines
are major roads. I used these data to create GIS variables including distances from
nearest major roads to each resident and lengths of major roads in different buffers for
each resident. Buffer distance was set at 200 meters. I achieved them using the tools of
‘Near’, ‘Select By Location’ and ‘Summarize’ in ArcMap.
3.2.6 Parks Data
Based on the literature, parks play important roles in people’s life and the easy
access to park promotes the public health. However, the complete parks data in Suzhou
with usable formats, like Excel were not available and I could only find the results in
Google Maps or Baidu Maps through searching key word “Parks”, which can be
displayed online but cannot be downloaded. Faced this problem, I searched the solution
online that used the VBA code to extract searching results from Google Maps in Excel. I

14
copied and adjusted the code and finally obtained the 230 parks data with addresses
that could be used to geocode parks in Goggle Maps.
3.3 Support of Organization’s Project The organizations project aimed to explore the relations between the public
health and urban environment. Researchers already had the survey data of public health
for each resident, so what I need to provide are the GIS-based data of built environment
for every resident. Air quality maps, land use map and NDVI maps were all continuous
raster maps that should be converted to point data for each resident. I employed a very
useful tool, ‘Zonal Stats Over Lapping Polys’ which calculates Zonal Stats using Zonal
Statistics as table with an overlapping polygon feature class, as total residents were up
to 8000 points in a city, their buffer polygons would have many overlaps that could not
be solved by the normal Zonal Statistics as table in ArcMap. For example, I created NDVI
data of residents’ points with three different buffer distances, including 200m, 500m
and 1000m. In term of roads and parks data, they were easy to be converted to data for
residents’ point using tools in ArcMap. Overall, I provided them an Excel table with all
variables data for residents, which could be analyzed by their workers without GIS
experience. Figure 9 is a part of the excel table I finally created that contains all the
information they needed.

15
CHAPTER 4. INTERNSHIP ASSESSMENT
4.1 Skills Required
My internship was to create GIS calculated variables for a public health project in
China, so the main skills required included Geo-Spatial analysis using ArcMap,
processing remote sensing images, collecting data from China-based GIS sources (e.g.
ChinaMap) and programming.
I was very familiar with the GIS analysis using ArcMap because I took both Intro
to GIS and Advanced Vector taught by Professor Yelena Ogneva-Himmelberger, giving
me much practice to do GIS work including Geo-Spatial analysis and mapping. This skill
was involved in my internship everywhere. For instance, I created the variable that
estimated distances from residents to major roads using the ‘Near’ tool in ArcMap. I
calculated the number of parks within a certain buffer distance using the tools of
‘Buffer’ and ‘Select by Location’ in ArcMap.
Remote sensing expertise learned from Intro to Remote Sensing was useful
when I developed the NDVI data and Land Use data. I downloaded the remote sensing
images from USGS and processed them in TerrSet.
The study area of the project was Suzhou, China. Data Collection, like the shape
file of administer boundary and major roads, needed China-based GIS sources and
fluency of Chinese language. I did not know many China-based GIS sources at beginning
of the intern but knew a lot during this summer.
Programming is the last but not least. Much of the work was duplicate works,
such as performing Zonal Statistics for different buffer distances, and I used Python and
Model Builder in ArcMap to reduce my work load. In addition, I learned JavaScript in the
internship and help me a lot as well.

16
4.2 Skills Learned
As I mention before, collecting data and programming languages are the critical
skills I learned from this intern. I collected the county boundaries from China Map,
collected the major roads from OpenStreetMap, got the parks data from Baidu Map and
obtained the air quality data from the local government website. Data collection was a
hard work and I learned how to use internet to find resources from the internship.
I learned Python in the class of Python and GIS Programming last semester,
which was helpful to perform GIS operations with Arcpy library, but it did not help when
I wanted to use web API, like Baidu Map API and ArcGIS API. Baidu Map is a mapping
service for Chinese, which can interpret Chines addresses more correctly than Google
Maps. In my work, I needed geocoding over 8000 addresses. It was not possible to
geocode them by hands, so I learned JavaScript and employed Baidu Map Geocoding
API to automatically geocode the addresses.
I also learned VBA, which is short for Visual Basic for Applications, to program in
Excel. One of variables I created is parks data, which were not available online but could
be searched in Baidu Maps. However, Baidu Maps does not provide the download
function for searching results. The way I found was to extract the search results using
VBA in Excel.
Besides the hard power above, I also learned some soft power, like independent
working, cooperation and communication. I was an only GIS assistant there and had to
cope any GIS problems by myself. The group work brought more inspirations and ideas.
The communication let me fully understand thinking of co-workers and supervisor, so as
to offer a better result.
4.3 Relation to Career Goal My internship role was a research assistant to help a PHD student to do a
research about public health in Harvard. The working environment was still an
education organization that was same as the situation I have been in and it is relative

17
easy when compared with most companies. I like the relaxing working environment, so I
hope I can work at education organizations after the graduation.
4.4 Recommendation I recommend this internship to other students if they like GIS analysis, self-study
and handling problems. In addition, the center I worked at a sub-organization of Harvard
School of Public Health and staff and students there are not familiar with GIS, so I met
many well-known professors and smart students who are expert in Public Health. If
someone interests in the field of public health, this internship was a good chance to
learn more knowledge about public health and meet more professionals in this field.
However, this internship may not be offered in next summer because GIS internships
depend on the demand of GIS knowledge of their projects.

18
CHAPTER 5. CONCLUSION
Harvard school of public health is one of the best education organizations in
public health field and I was honored to work with talented students and professors. I
was the only GIS specialist on this Suzhou project and the independent work gave me
both the responsibility and freedom to perform GIS-related data processing and data
analysis. I am happy that I have a chance to work under a professional environmental
with professional people. One of the most important thing is the independence and
space the work gives to me, and I received good results with the minimum supervision. I
also gained quantities of knowledge about non-geospatial data, for instance, health-
related data, population, air pollution, etc. Moreover, I went through the whole process
of searching for non-geospatial data, processing data and applying those non-geospatial
data to the geospatial database. Overall, I am very satisfied with my summer internship,
and I encourage everyone who is interested in public health to apply for internships like
this.
19
GLOSSARY
GIS – Geographic Information Science/System
GISDE – Geographic Information Science for Development and Environment

20
BIBLOGRAPHY
The Center for Health and Global Environment, 2015
http://www.chgeharvard.org/
Harvard website, 2015
http://www.harvard.edu/
Wong, David W., Lester Yuan, and Susan A. Perlin. "Comparison of spatial interpolation
methods for the estimation of air quality data." Journal of Exposure Science and
Environmental Epidemiology 14.5 (2004): 404-415

21
FIGURES
Figure1. The Study Area and the School Distribution in Suzhou HAPI Study
22
Figure2. The PM2.5 Distribution Maps in Suzhou at Four Different Dates

23
Figure3. The Land Use Map of Suzhou in 2014

24
Figure4. The NDVI of Suzhou in 16 March 2014
Figure5. The NDVI of Suzhou in 22 July 2014

25
Figure6. The NDVI of Suzhou in 26 October 2014
Figure7. The NDVI of Suzhou in 29 December 2014
26
Figure8. The Map of Suzhou Residential and its Roadway
Figure9. The Final Excel Table including all GIS-calculated Variables for all Residents