Embed Size (px)
Citation preview
To: Robert Forrest, METRO
From: Alec More, HDR
Date: November 13, 2012
Re: Gilbert Road Extension: Park-and-Ride Facility Size Recommendations
1. Introduction
As a component of the Gilbert Road Extension (GRE) project, Valley Metro and the City of Mesa will be developing a park-and-ride facility adjacent to the proposed Gilbert Road Station at Main Street and Gilbert Road. At the same time, a park-and-ride facility at the future Mesa Drive Station has been programmed as a component of the Central Mesa Extension (CME) project (currently under construction). The CME project is scheduled for completion in 2016, with the GRE project scheduled for completion in late 2017. The two stations are separated by a distance of approximately 2 miles.
Valley Metro and the City of Mesa determined the need for the Gilbert Road station park-and-ride facility based on strong demand of existing LRT line riders who use the Sycamore Station park-and-ride lot to access LRT at Sycamore. License plate survey’s conducted periodically continue to demonstrate park-and-rider demand at the Sycamore LRT Station originate from zip codes in central and east Mesa, and the East Valley region collectively. The development of park-and-ride facilities at both the Mesa Drive and Gilbert Road stations will allow surrounding neighborhood residents and persons traveling from points east to access the LRT more proximate.
This memorandum discusses the short- and long-term parking needs within the corridor and specifically at the Mesa Drive and Gilbert Road stations. Supplementing previous memorandums detailing park-and-ride facility sizing, design, and joint development potential, this memorandum specifies the minimum number of parking stalls required for each facility to satisfy projected demand. It is important to recognize that the estimates of parking capacity recommended in this memorandum are based on travel demand forecasts, and it is therefore possible that actual parking demand may be more or less than the estimates provided herein.
2. Park-and-Ride Facility Locations Considered
According to current travel forecasts of drive access and parking demand, both the Mesa Drive and Gilbert Road stations are anticipated to attract park-and-riders from points in central and east Mesa, including drivers as far away as Apache Junction. Results of travel demand model runs already suggest that the demand for parking at stations will increase in the future as the region’s light rail system extends further east beyond Gilbert Road. However, as parking supply is provided at future stations further east of existing parking facilities, it is anticipated that park-and-ride travelers will seek to connect with rail transit at the closest location approximate to their origin point. Current travel forecasts and license plate survey data suggest that as future park-and-ride facilities are implemented east of the Sycamore Station, the heavy demand for access to rail transit and parking facilities – especially from points in the East Valley region – will shift to stations that provide parking further east of the Sycamore Station.

Gilbert Road Extension: Park-and-Ride Facility Size November 13, 2012 Page 2 The Mesa Drive Station park-and-ride facility will be located on the northeast corner of Main Street and Mesa Drive, adjacent to the Mesa Drive Station. Property acquisition for this facility has already begun, with construction expected to begin in 2016.
Two park-and-ride locations were considered for the proposed Gilbert Road Station, both at the intersection of Main Street and Gilbert Road. Each location is described as follows:
North Option: On the northwest quadrant of the intersection, the North Option is comprised of 7 parcels (approximately 10.2 acres), a land area currently occupied by an existing parking lot serving a mixture of retail commercial businesses.
South Option: On the southwest quadrant of the intersection, the South Option is comprised of 3 parcels (approximately 7.0 acres), used by a recreational vehicle sales and service business and an automobile resale dealership.
To date, the number of parking stalls needed at the proposed Gilbert Road Station has been estimated at between 500 and 700 spaces. This memorandum seeks to refine these parking space estimates.
3. Analysis Methods
This analysis was conducted using regional travel demand forecast model run results completed for the CME project in 2009 using the MAG regional travel demand model. Model year 2015 was used for this analysis as it was the closest model year available to the potential CME and GRE project opening dates. During the CME project, a series of model runs were completed to determine park-and-ride trips and parking demand within the Main Street corridor. Model runs were conducted separately for park-and-rides located at Mesa Drive and Gilbert Road, which allowed project planners to evaluate park-and-ride demand at both stations. However, each model run conducted assumed that a park-and-ride facility would be available at the Mesa Drive Station. Therefore, the question as to what the parking demand would be at the Gilbert Road Station without a Mesa Drive Station cannot be answered with available data.
4. Analysis Results
The analysis yielded the following findings:
In 2015, park-and-ride demand at the Mesa Drive Station is anticipated to be 584 vehicles without a park-and-ride at the Gilbert Road Station.
In 2015, park-and-ride demand at the Mesa Drive Station drops by 247 vehicles (a 42% difference) with the addition of a park-and-ride at the Gilbert Road Station. This results in an anticipated total park-and-ride demand at the Mesa Drive Station of 337 vehicles.
Total park-and-ride demand at the Gilbert Road Station is anticipated to be 556 vehicles in 2015.
In 2015, the total corridor park-and-ride vehicle demand is approximately 1,000 (between the Sycamore and Mesa Drive stations), and 1,350 (between the Sycamore and Gilbert Road stations). The data suggest there is demand for parking between Mesa Drive and Sycamore however these riders could be accommodated at the Sycamore Station park-and-ride facility as total estimated demand at Sycamore with these additional riders would be approximately 450 vehicles.

Gilbert Road Extension: Park-and-Ride Facility Size November 13, 2012 Page 3 Between 2015 and 2031, park-and-ride demand in the corridor is expected to increase by
60%, from 1,350 vehicles to 2,150 vehicles. Park-and-ride demand at the Gilbert Road Station is anticipated to increase by 87%, and park-and-ride demand at the Mesa Drive Station is estimated to increase by 56%, assuming the Gilbert Road Station is the end-of-line station.
Estimates of parking demand and park-and-ride trips derived from the regional travel demand model did not determine the number parking spaces required for each lot. The estimates provided are for total vehicles. The number of parking spaces required should be less than total estimated vehicle demand to account for shared parking or parking space turn over in a 24-hour time frame.
To identify the number of parking spaces necessary at each facility planned, a parking factor was developed based on the estimated number of vehicle trips made to each station. Because the travel demand model outputs represent the total number of vehicles, this does not equate to the number of spaces that may or may not be necessary. Typically, the travel demand model assumes one person in each vehicle; however, there may be multiple persons in one vehicle that are all considered park-and-riders. A vehicle occupancy factor was applied to account for both single occupant and multi-occupant vehicles.
Additionally, vehicle turnover should also be accounted for. According to current Valley Metro statistics and travel survey information, a 25% turnover rate was assumed for both park-and-ride facilities. This turnover rate is based on the observed rate of turnover at existing park-and-rides and the travel patterns and trip characteristics of current LRT riders. Specifically, a relatively low proportion of trips currently made are for commuting purposes during normal weekday hours. According to current Valley Metro and MAG regional travel survey information, a significant number of rail transit trips that involve parking-and-riding are for entertainment purposes or traveling to school. A strong proportion of East Valley residents use light rail to access Arizona State University, or to attend concerts, sporting events, or local festivals in Tempe and central Phoenix. As a result, the short-term duration of these trips leads to a more frequent rate of turnover at park-and-ride facilities.
Applying Valley Metro’s current parking factors for a variety of trip-making purposes, the total number of vehicle trips made to both the Mesa Drive and Gilbert Road stations in 2015 was divided by a shared parking factor of 1.25 to determine the approximate number of spaces needed. The estimated number of parking spaces was rounded to the nearest hundred spaces. For the Mesa Drive station, this equates to approximately 500 spaces in 2015 without a park-and-ride at Gilbert Road. However, assuming that parking demand shifts to the Gilbert Road Station park-and-ride (once operational), applying this same factor to the new demand estimated at the Mesa Drive Station suggests that approximately 300 spaces are necessary in 2015 at the Mesa Drive Station. With the parking demand projected to increases at the Gilbert Road Station, it is anticipated that 500 spaces at the Gilbert Road Station are necessary in 2015.
Recognizing that parking demand at each station is anticipated to increase by 2031 (56% at Mesa Drive and 87% at Gilbert Road), the project team sought to estimate planning horizon year parking supply needs for 2031. It was assumed that both stations would be open and operational in 2031. Applying the parking demand growth percentages to the total number of vehicles in 2015, it is estimated that 525 vehicles would seek parking at the Mesa Drive park-and-ride. Dividing this number by the shared parking factor of 1.25, it is estimated that 425 spaces would be necessary at Mesa Drive Station. Comparatively, a growth in parking demand at Gilbert Road of 87% above the

Gilbert Road Extension: Park-and-Ride Facility Size November 13, 2012 Page 4 current forecast of 556 vehicles suggests that over 1,000 vehicles would seek parking at the Gilbert Road Station. Applying the shared parking ratio of 1.25 suggest that approximately 850 spaces would be necessary at the Gilbert Road Station in year 2031.
Table 1 displays the results of the parking space requirement analysis conducted and outlined in this memorandum.
Table 1. Summary of Parking Space Requirements by LRT Station
Station Estimated Parking Spaces
(2015) Estimated Parking Spaces
(2031)a
Mesa Drive (w/out Gilbert Road) 500 N/A
Mesa Drive (w/Gilbert Road) 300 425
Gilbert Road 500 850 Source: HDR, Inc. 2012 a The estimate of parking spaces in 2031 assumes both the Mesa Drive and Gilbert Road stations are operational and
include parking capacity. N/A – Not Applicable
5. Recommendations
Based upon anticipated park-and-ride utilization, the findings of this analysis suggest that a park-and-ride facility at Mesa Drive should be sized to accommodate 300 vehicles in year 2015. Comparatively, a park-and-ride facility at Gilbert Road should be sized to accommodate 500 vehicles in year 2015. However, assuming that parking demand will increase at both stations by 2031 (56% for Mesa Drive and 87% for Gilbert Road), it is assumed that the Mesa Drive park-and-ride should be sized to accommodate up to 425 vehicles, while the Gilbert Road park-and-ride be capable of serving up to 850 vehicles. It is important to note that the 850 parking spaces required at the Gilbert Road Station park-and-ride by 2031 assumes that the Gilbert Road Station is the end-of-line station for LRT, without extensions further east. If LRT is extended further east by 2031, and future stations include parking, then park-and-ride demand at the Gilbert Road Station will decrease accordingly.
It is important to remember that these estimates of facility size are based on travel demand forecasts that are also predicated on a number of planning assumptions. Increases in transit service frequencies, population and/or employment densities, or other changes to corridor characteristics that could affect transit ridership or the demand for trips to the east side of downtown Mesa will undoubtedly influence parking demand.
Since the Mesa Drive Station will be a temporary end-of-line station until the Gilbert Road Extension project is completed (approximately 1 year), parking demand at Mesa Drive could be satisfied through the negotiation of a temporary shared use agreement.


Page Intentionally Left Blank

Transportation Technical Report Page 1 December 2012
Environmental Assessment
Gilbert Road Extension
Gilbert Road Extension
Environmental Assessment
Draft Transportation Technical Report
By
Grijalva Engineering
and HDR, Inc.
December 2012
Transportation Technical Report Page 2 December 2012
Environmental Assessment
Gilbert Road Extension
TABLE OF CONTENTS
SECTION PAGE
1.0 INTRODUCTION .................................................................................................. 4
1.1 2031 No-Build Alternative .................................................................................... 5
1.2 2031 Build Alternative (4-Lane) ............................................................................ 5
1.3 2031 Build Alternative (2-Lane) ............................................................................ 5
1.4 2031 Build Alternative (2-Lane Roundabouts) ...................................................... 5
1.5 End-of-Line Park and Ride ................................................................................... 6
2.0 2012 EXISTING CONDITIONS ............................................................................ 6
2.1 Roadway Characteristics ...................................................................................... 6
2.2 Land Use ............................................................................................................ 11
2.3 Roadway Classification ...................................................................................... 13
2.4 Traffic Volume .................................................................................................... 15
2.5 Transit Service .................................................................................................... 16
2.6 Bicycle Facilities ................................................................................................. 19
2.7 Pedestrian Facilities ........................................................................................... 21
3.0 TRAFFIC OPERATIONS ANALYSIS ................................................................ 21
3.1 Methodology ....................................................................................................... 22
3.2 Transportation Operations Analysis and Approach ............................................ 23
3.3 Traffic Operations Analysis Results .................................................................... 41
3.4 Traffic Operations Key Findings and Suggested MIitigation ............................... 42
4.0 OTHER TRANSPORTATION IMPACTS ASSESSMENTS................................ 47
4.1 Impacts to Signalization ...................................................................................... 47
4.2 Impacts Due to Traffic Diversion ......................................................................... 48
4.3 Turning Movements ............................................................................................ 49
4.4 Design and Operating Speeds............................................................................ 49
4.5 Impacts to Transit ............................................................................................... 50
4.6 Impacts to On-Street Parking ............................................................................. 50
4.7 Impacts to Bicycle Facilities ................................................................................ 51
4.9 Impacts to Freight Mobility .................................................................................. 55
4.10 Impacts to Emergency Services and Vehicles Access ....................................... 55
5.0 IMPACTS ANTICIPATED DURING CONSTRUCTION ................................................ 57

Transportation Technical Report Page 3 December 2012
Environmental Assessment
Gilbert Road Extension
TABLE OF FIGURES
Figure 1: Gilbert Road Extension Study Area .................................................................. 4
Figure 2: Intersections Studied, 2031 Build Alternatives (4-Lane) and (2-Lane) ............. 7
Figure 3: Intersections Studied, 2031 Build Alternative (2-Lane Roundabouts) .............. 8
Figure 4: 2012 Existing Signalized Intersections ............................................................. 9
Figure 5: Street Character Designations – Central Main Plan, 2012 ............................. 12
Figure 6: Arterial Functional Classification .................................................................... 13
Figure 7: Street Character Designations – Central Main Plan, 2012 ............................. 15
Figure 8: Valley Metro LINK Main Street Route ............................................................ 17
Figure 9: Bicycle Master Plan Ultimate Citywide Bicycle Network ................................. 19
Figure 10: Bicycle Facilities and Arterial Sidewalks ...................................................... 20
Figure 11: PM Peak North PNR Trip Distributions ........................................................ 37
Figure 12: PM Peak South PNR Trip Distributions ........................................................ 37
Figure 13: Bicycle Route Through a Roundabout (WSDOT) ......................................... 52
Figure 14: Bicycle Ramps at a Roundabout (FHWA) .................................................... 52
Figure 15: Typical Roundabout Design, May 2012 Concept Plan ................................. 54
TABLE OF TABLES
Table 1: Main Street Existing Roadway Characteristics at a Glance ............................. 10
Table 2: Average Weekday 24-Hour Traffic Volume ..................................................... 16
Table 3: Existing Transit Service Summary ................................................................... 18
Table 4: Signalized Intersection Level of Service Definitions ........................................ 23
Table 5: Unsignalized Intersection Level of Service Definitions .................................... 23
Table 6: 2012 Existing PM Peak Turning Movement Counts ........................................ 26
Table 7: 2031 No Build PM Peak Turning Movement Counts ....................................... 28
Table 8: 2031 Build Alt. (4-Lane) PNR South PM Peak Turning Movement Counts ..... 30
Table 9: 2031 Build Alt. (4-Lane) PNR North PM Peak Turning Movement Counts ...... 31
Table 10: 2031 Build Alternative (2-Lane) PNR South PM Peak Turning Movement
Counts also the Counts for (2-Lane Roundabouts) ...................................................... 33
Table 11: 2031 Build Alternative (2-Lane) PNR North PM Peak Turning Movement
Counts also the Counts for (2-Lane Roundabouts) ...................................................... 34
Table 12: PNR PM Peak Hour Vehicle Trips: North and South PNR ............................ 36
Table 13: PNR and KNR PM Peak Hour Volumes: North and South PNR .................... 37
Table 14: Intersection Level of Service Results – PM Peak Hour ................................. 43
Table 15: Intersection LOS Results – AM Peak Hr at Gilbert Rd PNR .......................... 44
Table 16: LOS Comparison of 2031 Build Alternatives ................................................. 45
Table 17: On-Street Parking Impacts ............................................................................ 51

Transportation Technical Report Page 4 December 2012
Environmental Assessment
Gilbert Road Extension
1.0 INTRODUCTION
This Transportation Technical Report has been prepared in support of the Gilbert Road
Extension Environmental Assessment (EA) for Light Rail Transit (LRT) improvements
along Main Street from east of Mesa Drive to Gilbert Road. This report provides an
assessment of the 2031 No-Build and 2031 Build Alternatives for the Gilbert Road
Extension (GRE) project on the following transportation system components: traffic
operations, on-street parking, transit, pedestrian and bicycle facilities, and vehicular
access within the project study area, including freight mobility and emergency services.
Figure 1 depicts the GRE project study area, and shows where the project connects to
the Central Mesa LRT Extension at its terminus station and park and ride east of Mesa
Drive.
FIGURE 1: GILBERT ROAD EXTENSION STUDY AREA
The information provided in this report is intended to assist Valley Metro and the City of
Mesa in understanding the transportation-related differences between the proposed
alternatives and to assist with a selection of a preferred alternative. This report
describes potential transportation impacts for each of the proposed project alternatives,
and develops appropriate design strategies, where needed, to avoid or minimize
impacts.
Full definitions of the 2031 No-Build, Build Alternatives and Design Option, may be
found in Chapter 2 of the Environmental Assessment (EA), and are summarized as
follows:

Transportation Technical Report Page 5 December 2012
Environmental Assessment
Gilbert Road Extension
1.1 2031 NO-BUILD ALTERNATIVE
The 2031 No-Build Alternative serves as the basis for comparison of effects with the
“build” alternatives. The No-Build Alternative includes all roadway and bus system
improvements for which funding has been committed in the appropriate agency
Transportation Improvement Programs (TIPs) and the Maricopa Association of
Governments (MAG) 2031 Regional Transportation Plan (RTP). In this alternative, Main
Street retains the existing four-lane configuration with a raised median divider, on-street
parking, bus transit stops, bicycle lanes and sidewalks. Local transit and LINK bus rapid
transit continue to serve the Main Street corridor. This scenario also includes the
Central Mesa Extension LRT project expected to be operational in 2016.
1.2 2031 BUILD ALTERNATIVE (4-LANE)
Light rail would be developed in a semi-exclusive, center-running guideway, retaining
two-travel lanes in each direction, with bicycle and pedestrian facilities; on-street
parking would be removed. Local bus service would continue to operate along Main
Street, providing transit service to bus stops between LRT stations. Two LRT stations
are proposed, located east of Stapley Drive and west of Gilbert Road. A park and ride
facility is proposed at the Gilbert Road Station with two site options; one on the north
side of Main Street and one on the south side. The Main Street LINK would terminate at
the proposed new Gilbert Road Station. Figure 2 shows the intersections to be studied
and includes three new proposed signalized intersections as well as one additional
proposed pedestrian signal along the corridor. Lindsay Road is also included in the
2031 traffic analysis performed but it is outside of the EA GRE Study Area.
1.3 2031 BUILD ALTERNATIVE (2-LANE)
Light rail would be developed in a semi-exclusive, center-running guideway. Main Street
would be narrowed to one lane in each direction. Bicycle lanes would be retained. Local
bus service would continue to operate along Main Street, providing transit service to bus
stops between LRT stations. A park and ride facility is proposed at the Gilbert Road
Station with two site options; one on the north side of Main Street and one on the south
side. The Main Street LINK would terminate at the proposed new Gilbert Road Station.
Figure 2 shows the intersections to be studied and includes three new proposed
signalized intersections as well as one additional proposed pedestrian signal along the
corridor. Lindsay Road is also included in the 2031 traffic analysis performed but it is
outside of the EA GRE Study Area.
1.4 2031 BUILD ALTERNATIVE (2-LANE ROUNDABOUTS)
This design option to the 2031 Build Alternative (2-Lane) would provide modern
roundabouts rather than signalized intersections along Main Street at Horne, Miller

Transportation Technical Report Page 6 December 2012
Environmental Assessment
Gilbert Road Extension
Street, North Lazona Drive, North Harris Drive, and South Williams. Unlike typical
modern roundabouts, those along Main Street would have gate operations actuated by
an approaching train, and would include pedestrian actuated signals for Main Street
crossings east and west of the intersection. Figure 3 shows the intersections to be
studied and includes seven signalized and five roundabout intersections along the
corridor. The design would add one new traffic signal at the proposed Gilbert Road
Station Park and Ride (PNR) and remove three existing traffic signals and replace them
with roundabouts. Roundabouts would also be added at two locations that are not
currently controlled by traffic signals. New pedestrian signals would generally be placed
on each side of the roundabouts.
1.5 END-OF-LINE PARK AND RIDE
For this traffic analysis, a 500–850 space PNR facility would be developed at the east
end of the light rail corridor at the Gilbert Road Station. The PNR could include surface
parking or a structure may be built. The type and capacity of facility will be determined
as design advances and estimates of demand are better known. There are two PNR
options. One option is a PNR facility on the north side of Main Street, and the other
option is a PNR facility on the south side of Main Street. In each option, the PNR access
from Main Street would be at a new signalized intersection with left turn lanes. Access
from Gilbert Road is proposed as “uncontrolled” access either north or south of Main
Street, respectively. A full description of the PNR facility may be found in Section 2 in
the EA.
2.0 2012 EXISTING CONDITIONS
2.1 ROADWAY CHARACTERISTICS
Table 1 documents the 2012 existing roadway conditions along Main Street between
Mesa Drive and Gilbert Road. Included in the documentation of existing conditions is
the current Main Street travel lane configuration, the configuration of turn lanes at all
signalized and unsignalized intersections, transit service, on-street parking quantities
and locations, and bicycle and pedestrian facilities. Information in Table 1 is grouped
according to Main Street “segments”; these are related to the roadway segments
between the existing signalized intersections. Figure 4 shows the seven existing
signalized intersections within the study area, data for which is included in Table 1.

Transportation Technical Report Page 7 December 2012
Environmental Assessment
Gilbert Road Extension
FIGURE 2: INTERSECTIONS STUDIED, 2031 BUILD ALTERNATIVES (4-LANE) AND (2-LANE)

Transportation Technical Report Page 8 December 2012
Environmental Assessment
Gilbert Road Extension
FIGURE 3: INTERSECTIONS STUDIED, 2031 BUILD ALTERNATIVE (2-LANE ROUNDABOUTS)

Transportation Technical Report Page 9 December 2012
Environmental Assessment
Gilbert Road Extension
FIGURE 4: 2012 EXISTING SIGNALIZED INTERSECTIONS

Transportation Technical Report Page 10 December 2012
Environmental Assessment
Gilbert Road Extension
TABLE 1: MAIN STREET EXISTING ROADWAY CHARACTERISTICS AT A GLANCE
MAIN STREET
SEGMENT
TRAVEL
LANES
SIGNALIZED
INTERSECTIONS
UNSIGNALIZED
INTERSECTIONS
DRIVEWAYS/
CURB CUTS*
2010 Traffic
Volume
vehicles/day
SPEED
LIMIT TRANSIT
ON-STREET
PARALLEL
PARKING
BICYCLE PEDESTRIAN
Mesa Drive to
Horne Street
Main Street has
two travel lanes
each direction
(three lanes in
short segment
just west of
Gilbert Road)
Raised median
with gaps for left
turn lanes to
streets and
driveways
Hobson
EB and WB left turn lanes
Horne Street
EB and WB left turn lanes
EB and WB right turn lanes
NB and SB left turn lanes
S. Udall: EB/WB left
Lesueur: EB/WB left
S. Olive: EB/WB left
N. Edgemont: RIRO
N/S Ashland: EB/WB left
N. Bellview: EB left
North side: 6
South side: 5
24,805
EB: 12,495
WB: 12,310
Count location:
800 block
Main Street
35 mph
Local Route 40
30-minute service weekday/weekend
WB stop at Horne
LINK- Main Street BRT
Stations at Mesa Drive with connection to
Route # 120 on Mesa Drive
North side
7 spaces
South side
0 spaces
There are
continuous
striped bicycle
lanes in each
direction on Main
Street.
Bicycle lanes are
located next to
the curb or to the
on-street parallel
parking where
parking exists.
Sidewalks are
continuous on both
sides of Main
Street.
Sidewalks are
located adjacent to
the back of curb
with no landscape
strip.
Sidewalk width
varies, generally
about 6-feet
Horne Street to
Stapley Drive
Horne Street
EB and WB left turn lanes
EB and WB right turn lanes
NB and SB left turn lanes
Stapley Drive
EB and WB left turn lanes
EB and WB right turn lanes
NB and SB left turn lanes
N. Frasier Dr: EB left
S. Temple St: WB left
Miller St: EB/WB left
Matlock St: EB/WB left
N. Spencer St: EB left
N. Parsell St: EB left
North side: 19
South side: 21
Local Route 40
30-minute service weekday/weekend
EB stops at Horne and Miller
WB stop at Matlock
Stations at Stapley Drive
LINK- Main Street BRT
15-minute peak service
30-minute service weekday only
Stations at Stapley Drive with connection to
Route #128 on Stapley Drive
North side
33 spaces
South side
37 spaces
Stapley Drive to
N. Lazona Drive
Stapley Drive
EB and WB left turn lanes
EB and WB right turn lanes
NB and SB left turn lanes
N. Lazona Drive (T)
EB and WB left turn lanes
SB left turn lane
S. Allen St: WB left
S. Lazona Dr: WB left
North side: 5
South side: 10
25,943
EB: 13,304
WB: 12,639
Count location:
1600 block
Main Street
40 mph
Local Route 40
30-minute service weekday/weekend
WB stop at N. Lazona
LINK- Main Street BRT
No LINK stations in this segment
North side
27 spaces
South side
11 spaces
N. Lazona Drive to
S. Williams
N. Lazona Drive (T)
EB and WB left turn lanes
SB left turn lane
S. Williams (T)
EB and WB left turn lanes
EB right turn lane
NB left turn lane
S. Barkley: EB/WB left
N. Hunt Dr: EB/WB left
N. Harris Dr: EB/WB left
North side: 16
South side: 16
Local Route 40
30-minute service weekday/weekend
EB stop at N. Lazona and Harris
WB stops at Harris
LINK- Main Street BRT
No LINK stations in this segment
North side
31 spaces
South side
30 spaces
Williams to
Gilbert Road
S. Williams (T)
EB and WB left turn lanes
EB right turn lane
NB left turn lane
Gilbert Road
Dual EB/WB left turn lanes
WB right turn lane
EB through/right lane
Dual NB/SB left turn lanes
NB right turn lane
N. Guthrie St: EB/WB left
Driveways: EB/WB left
North side: 12
South side: 16
Local Route 40
30-minute service weekday/weekend
EB/WB stops at Guthrie
Stations at Gilbert Road
LINK- Main Street BRT
15-minute peak service
30-minute service weekday only
Stations at Gilbert Road with connection to
Route #136 on Gilbert Road
North side
9 spaces
South side
19 spaces
* Most driveways are right-in/right-out due to the raised median, except where a left-turn lane and median break enables left turns into and out of the driveway 2010 Traffic Volume: City of Mesa Transportation Division, 2012 Traffic Volume Map 2012 Draft Mesa Bicycle Master Plan: Bicycle lanes are planned on Main Street west of Gilbert Road – currently no bicycle lanes Abbreviations: Eastbound (EB), Westbound (WB); right-in-right-out (RIRO); T intersection at Main Street (T)

Transportation Technical Report Page 11 December 2012
Environmental Assessment
Gilbert Road Extension
2.2 LAND USE
Along Main Street, land use between Mesa Drive and Gilbert Road is typical of auto-
oriented, suburban development, with low-scale single use commercial buildings the
dominant land use feature. Although no single family residential neighborhoods are
located adjacent to Main Street, neighborhoods border the commercial strip to the north
and south, and they also abut strip commercial development along University Drive and
Broadway Road.
The City of Mesa’s Central Main Plan
(January 2012) supplements the adopted
Mesa 2025 Land Use Plan and prepares the
community to take advantage of the public
investment in light rail. The Central Main
Plan is intended to facilitate redevelopment
along Main Street into a mixed-use, higher
intensity, transit-oriented development pattern, as shown in Figure 5. The Central Main
Planning Area is situated generally between University Drive and Broadway Road and
between Country Club Drive and Gilbert Road. Light rail is viewed as a catalyst for
change from the auto-oriented development pattern, toward a mixed-use, pedestrian
friendly urban environment. The Plan acknowledges that while improvements to the
pedestrian and bicycling environment may reduce vehicular mobility, the grid street
system will continue to provide reasonable vehicular access through the Central Main
Area.

Transportation Technical Report Page 12 December 2012
Environmental Assessment
Gilbert Road Extension
FIGURE 5: STREET CHARACTER DESIGNATIONS – CENTRAL MAIN PLAN, 2012

Transportation Technical Report Page 13 December 2012
Environmental Assessment
Gilbert Road Extension
2.3 ROADWAY CLASSIFICATION
The arterial pattern east of Downtown Mesa consists of a grid system, typically with one
mile spacing on surveyed section lines between arterial streets such as the east-west
running University Drive and Broadway Road, and the north-south arterials: Mesa Drive,
Stapley Drive, and Gilbert Road. Formerly designated as US Highway 60, Main Street
runs on a mid-section line between University Drive and Broadway Road. It continues to
serve as a regional route while it also provides local access. The regional freeway
system, including the Superstition Freeway (US 60) is to the south and the Red
Mountain Freeway (US 202) is to the north, see Figure 6.
In the City of Mesa 2025 Transportation Plan (2002), Main Street is designated a
“Transit Priority” corridor, and it has a “Town Center/Main Street Corridor” overlay, both
of which provide guidance for the preferred use and development of the street. Table 1
provides details of the existing roadway characteristics.
Sidewalks are located on both sides of Main Street and on the intersecting arterials, and
there are bicycle lanes on Main Street, University Drive, Broadway Road and Lindsay
Road; see Figure 10.
FIGURE 6: ARTERIAL FUNCTIONAL CLASSIFICATION
MESA 2025 TRANSPORTATION PLAN

Transportation Technical Report Page 14 December 2012
Environmental Assessment
Gilbert Road Extension
Referred to in Section 2.2 of this report, the Central Main Plan updates the Mesa 2025
Transportation Plan in consideration of the regional light rail investment and the urbanist
vision for Downtown and the Main Street Corridor. New “street character” designations
apply according to Figure 7. Within the study area along Main Street and intersecting
streets, the following street character designations apply:
Village Connector: Intended to create walkable segments that will encourage
pedestrian and bicycle use, with light rail accommodated in a center median (Main
Street).
Downtown/Village Main Street: Intended to create short walkable segments of Main
Street that will help identify the commercial center of Transit Village areas – the
areas around planned light rail stations.
Urban Connector: Intended to create walkable segments of local major streets in
areas less influenced by light rail (Mesa Drive and Stapley Drive).
Regional Arterial: Intended to create walkable segments of regional major streets
that intersect with Main Street, but in areas less influenced by light rail (Gilbert
Road).
Collector Street: Intended to create walkable segments of local streets that should
help encourage safe pedestrian and bicycle use from residential areas to the light
rail system (Horne).

Transportation Technical Report Page 15 December 2012
Environmental Assessment
Gilbert Road Extension
FIGURE 7: STREET CHARACTER DESIGNATIONS – CENTRAL MAIN PLAN, 2012

Transportation Technical Report Page 16 December 2012
Environmental Assessment
Gilbert Road Extension
2.4 TRAFFIC VOLUME
Table 2 provides the current (2010) and historical measured average number of
weekday vehicle trips along the study corridor on Main Street at 2 to 3 measurement
points between Mesa Drive and Gilbert Road. Traffic volume data was obtained from
the City of Mesa Traffic Counts maps.
An observed long-range trend in traffic volume is perhaps counter-intuitive in that the
volume is not on a trajectory of year-over-year increases. While some peaking of traffic
volume is observed in 2005/2006, volumes in 2010 are less than that in the late 1990’s.
This is not only occurring on a local basis, but on a regional and national level as well.
This historic trend will help inform traffic projections to the 2031 No-Build and the 2031
Build alternatives.
TABLE 2: AVERAGE WEEKDAY 24-HOUR TRAFFIC VOLUME
MAIN STREET
TRAFFIC COUNT LOCATION
1996 1998 2000 2002 2005 2006 2008 2010
Mesa – Horne* 28,300 31,000 26,200 29,200 30,200 27,700 25,297 24,805
Horne – Stapley 28,700 31,000
Stapley – Gilbert 27,800 29,700 24,400 31,700 35,800 34,400 26,247 25,943
Source of traffic counts 1996 – 2010: City of Mesa Traffic Counts Map
*Mesa/Horne traffic counts discontinued after 1998
2.5 TRANSIT SERVICE
Existing transit service along Main Street and on the major intersecting streets of Mesa
Drive, Stapley Drive and Gilbert Road is noted in Table 1 and more fully documented in
Table 3. The transit routes that serve Main Street are the traditional local transit service,
route 40 operated by Valley Metro, and a new bus rapid transit-like service provided by
Valley Metro LINK – Main Street, initiated in 2008. Local Valley Metro routes 120, 128
and 136 serve the north-south intersecting streets, Mesa Drive, Stapley Drive and
Gilbert Road, respectively. Running parallel to Main Street are routes 30, that runs on
University Drive to the north and
route 45 that runs on Broadway
Road to the south.
All Valley Metro buses are
equipped with front-mounted
bicycle racks that hold up to 3
bicycles. These bicycle racks are
available on a first-come, first-
served basis. If the bicycle rack is

Transportation Technical Report Page 17 December 2012
Environmental Assessment
Gilbert Road Extension
full, accommodations cannot be made onboard buses for the bicycle, and the bicyclist
will have to wait for the next bus.
Valley Metro operates the Main Street LINK bus rapid transit service traveling between
the Superstition Springs Park-and-Ride and the Sycamore Transit Center where it
connects to METRO light rail, as shown in Figure 8. This is a state-of-the-art bus service
in Mesa that provides rail-like comfort, and better speeds and reliability. LINK stations
are generally spaced at one-mile intervals in association with major intersecting
arterials.
All LINK vehicles provide wireless connectivity, allowing passengers to connect to the
internet with a smartphone or laptop. LINK vehicles employ traffic signal priority, a
technology that communicates with traffic signals to provide reliable travel time along
the route. The LINK route features a real time bus tracker system that communicates
bus location to riders when buses can be expected to arrive at specific stations along
Main Street and Power Road.
FIGURE 8: VALLEY METRO LINK MAIN STREET ROUTE
Main St

Transportation Technical Report Page 18 December 2012
Environmental Assessment
Gilbert Road Extension
TABLE 3: EXISTING TRANSIT SERVICE SUMMARY
Transit
Route
Roadway
Corridor
Transit Stops and LINK
Station Locations within
study area*
Transit Route
Span of Service
Transit Route
Frequency
LINK
BRT
Main Street:
Sycamore to
Superstition
Springs
Main Street at:
Mesa Drive
Stapley Drive WB station near side
Gilbert Road
Lindsay Road WB station near side
Weekday
4 AM – 10 PM
30 Minute Off-Peak
15 Minute Peak
Saturday: No Service
No service
Sunday: No Service
Local
# 40
Main Street:
Price to
Superstition
Springs
Main Street at:
Mesa Drive
Hobson
Horne
S. Miller St./ N. Matlock Stapley Dr. WB near side
North Lazona Drive
North Harris Drive
North Guthrie Street
Gilbert Road
Chesnut
Windsor
Lindsay Rd. WB near side
Weekday
5 AM – 10 PM
30 Minute service
all day every day
Saturday
6 AM – 10 PM
Sunday
6 AM – 10 PM
Local
# 30
University
Drive South
Mtn. CC to
Sossaman
University Drive
Route #30 bus stops @
major arterials and
intermediate streets
Weekday: 5 AM-12 AM 30 Minute service
Saturday: 5 AM-12 AM 60 Minute service
Sunday: 6 AM-10 PM
(SMCC to Price only) 60 Minute service
Local
# 45
Broadway
Road
19th/Southern
to Superstition
Springs
Broadway Road
Route #45 bus stops @
major arterials and
intermediate streets
Weekday: 5 AM-11 PM 30 Minute service
Saturday: 6 AM-11 PM 60 Minute service
Sunday: No service in study area
Local
# 120
Mesa Drive:
Fitch Park to
Lewis/Coury
Mesa Drive at
Main Street
Weekday: 9 AM – 9 PM 30 Minute service
Saturday: 9 AM-9 PM
Sunday: No Service No Service
Local
# 128
Stapley Drive:
Inverness to
McKellips
Stapley Drive at
Main Street
Weekday
6 AM – 6 PM 30 Minute service
Saturday 6 AM – 7 PM
60 Minute service
Sunday: No Service No Service
Local
# 136
Gilbert Road:
Germann Road
to Boeing
Gilbert Road at
Main Street
Weekday 5 AM – 7 PM
30 Minute service
Saturday
8 AM – 7 PM 60 Min. at Main St.
Sunday: No Service No Service
Source: ValleyMetro.org
* Station and stop locations are at the far side of intersections unless noted

Transportation Technical Report Page 19 December 2012
Environmental Assessment
Gilbert Road Extension
2.6 BICYCLE FACILITIES
Bicycle lanes exist in both directions on Main Street next to the curb or to on-street
parallel parking. The draft Mesa Bicycle Master Plan (August 2012) defines the future
bicycle network vision for the city. When adopted, the Bicycle Master Plan will update
the Bicycle component of the Mesa 2025 Transportation Plan (2002). The “Ultimate
Bicycle Network” envisioned in the Plan, is shown in Figure 9. For the Gilbert Road
Extension study area, the existing and planned bicycle facilities are shown in Figure 10.
The Bicycle Master Plan includes design guidelines for bicycle lane widths on Main
Street. The existing five-foot wide bicycle lanes along Main Street would be extended
east of Gilbert Road. Bicycle lanes on Gilbert Road would intersect with bicycle lanes on
Main Street. University Drive east of Stapley Drive, and Broadway Road east of Gilbert
Road also have bicycle lanes. The complete network of bicycle facilities will provide
non-motorized access to transit, employment, schools, shopping, recreation and
regional destinations.
FIGURE 9: BICYCLE MASTER PLAN ULTIMATE CITYWIDE BICYCLE NETWORK

Transportation Technical Report Page 20 December 2012
Environmental Assessment
Gilbert Road Extension
FIGURE 10: BICYCLE FACILITIES AND ARTERIAL SIDEWALKS
Source: Mesa Draft Bicycle Master Plan (2012), aerial photography and field reconnaissance

Transportation Technical Report Page 21 December 2012
Environmental Assessment
Gilbert Road Extension
2.7 PEDESTRIAN FACILITIES
Sidewalks along Main Street are continuous on both sides. They are located at the back
of the curb with no intervening landscape strip. On-street parked cars and/or bicycle
lanes provide a buffer between pedestrians and vehicles traveling the posted speed
limit between 35 and 40 miles per hour. Existing sidewalks are generally 6 feet wide or
greater, although some locations have narrower sidewalks. The travel speeds of
vehicles, coupled with the narrow sidewalk design and lack of pedestrian separation
creates an environment not conducive to regular pedestrian activity. Sloping driveway
ramps across sidewalks are common but this design is not consistent with current City
of Mesa M-42 Driveway Detail (City of Mesa Public Street Access Guidelines, February
15, 2005). Standard Detail M-43 requires a separation from the curb of sidewalks along
arterials, with the width of separation and the landscape to be determined by the City.
The City of Mesa Design Guidelines, Section 261 (Pedestrian Facilities) requires a
minimum of 6-foot wide sidewalks on collector and arterial streets.
At signalized intersections, standard crosswalk striping is provided and pedestrian
signal heads inform pedestrians of crossing opportunities. Section 501 of the City of
Mesa Traffic Signal Manual (October 2009) requires countdown pedestrian signals to be
installed at new signal locations and with all signal replacements. Sidewalk design and
other pedestrian considerations are included in the Pedestrian Plan section of the Mesa
2025 Transportation Plan.
3.0 TRAFFIC OPERATIONS ANALYSIS
This section summarizes the traffic operations analysis conducted for the Gilbert Road
Extension study. Traffic analysis was conducted for the PM peak hour traffic conditions
at the study intersections shown in Figures 2, 3 and 4 for the following alternatives:
2012 Existing Conditions
2031 No-Build
2031 Build Alternative (4-Lane) – with north and south PNR options
2031 Build Alternative (2-Lane) – with north and south PNR options
2031 Build Alternative (2-Lane Roundabouts)– with north and south PNR options
This traffic operations analysis is based on the conceptual designs prepared by HDR
dated May 2012 for this phase of the study. At this level, the traffic operations analysis
will assist staff in understanding the relative impacts of the alternatives on a
comparative basis. Future detailed traffic operational analysis using more advanced
traffic analysis software, such as VISSIM, will be conducted in the design phase of the
project.

Transportation Technical Report Page 22 December 2012
Environmental Assessment
Gilbert Road Extension
3.1 METHODOLOGY
Traffic analysis of roadway and intersection operational performance for the study
scenarios was performed using the Synchro/SimTraffic simulation analysis package
(version 7, Build series 755) developed by Trafficware, Ltd, which evaluates intersection
delay and congestion based on procedures similar to those given in the 2000 Highway
Capacity Manual (Chapters 16 and 17). Basic inputs used for Synchro relate primarily to
traffic data including traffic volumes, lane geometry (i.e., number of lanes, lane widths,
and turn-lane storage lengths), signal timing data, heavy vehicle traffic levels, on-street
parking, bus blockage and a variety of other data items.
It should be noted that Synchro is limited when assessing light rail operations. Since
light rail will operate in semi-exclusive right of way and will be in coordination with auto
traffic operations, the Synchro model will consider light rail as part of progressive auto
traffic operations and with protected auto and pedestrian movements across the light
rail tracks at all crossings. This was agreed to be a sufficient method by City of Mesa
and Valley Metro staff and that results obtained for each alternative can be compared
relative to each other and to the 2031 No-Build scenario. As mentioned, more
sophisticated traffic software will be used in Final Design of the project.
The methodology used in this study was based on the 2000 Highway Capacity Manual
(HCM), for the determination of Level of Service (LOS) for existing and future traffic
conditions. Analysis results are expressed as LOS and Intersection Delay.
For the 2031 Build Alternative (2-Lane Roundabouts), in addition to Synchro, RODEL 1,
release 1.9.7, was used to provide roundabout intersection delay and level of service
anticipated for this option. Basic inputs used for RODEL include traffic volumes, and
effective roundabout geometry including roundabout lane widths, entry and exit widths
and flare lengths. The analysis results for the roundabout intersections are expressed
using average delays calculated and associated LOS for unsignalized intersections, see
Table 5.
Level of Service (LOS) is a quantitative measure of intersection delay and capacity.
LOS is frequently expressed in qualitative terms as LOS A (free-flow) to LOS F
(congested). Tables 4 and 5 provide LOS descriptions for signalized and unsignalized
intersections; respectively. The “Description” column qualitatively describes the
perception of traffic conditions by motorists and passengers, while the “Average Delay”
column quantitatively describes the number of seconds of delay per vehicle associated
with each LOS.

Transportation Technical Report Page 23 December 2012
Environmental Assessment
Gilbert Road Extension
TABLE 4: SIGNALIZED INTERSECTION LEVEL OF SERVICE DEFINITIONS
Level
of
Service
Description Average Delay
(second/vehicle)
A Operations with very low delay occurring with favorable progression
and/or short cycle length. ≤ 10
B Operations with low delay occurring with good progression and/or
short cycle lengths. > 10 – 20
C
Operations with average delays resulting from fair progression
and/or longer cycle lengths. Individual cycle failures begin to
appear.
> 20 – 35
D
Operations with longer delays due to a combination of unfavorable
progression, long cycle lengths, or high V/C ratios. Many vehicles
stop and individual cycle failures are noticeable.
> 35 – 55
E
Operations with high delay values indicating poor progression, long
cycle lengths, and high V/C ratios. Individual cycle failures are
frequent occurrences. This is considered to be the limit of
acceptable delay.
> 55 – 80
F Operations with delays unacceptable to most drivers occurring due
to over saturation, poor progression, or very long cycle lengths. > 80
Source: Highway Capacity Manual, Transportation Research Board, 2000
TABLE 5: UNSIGNALIZED INTERSECTION LEVEL OF SERVICE DEFINITIONS
Level of
Service Description
Average Delay (second/vehicle)
A Little or no delay 0 – 10
B Minor delay > 10 – 15
C Average delay > 15 – 25
D Moderate delay > 25 – 35
E Lengthy delay > 35 – 50
F Excessive delay/gridlock > 50
Source: Highway Capacity Manual, Transportation Research Board, 2000
3.2 TRANSPORTATION OPERATIONS ANALYSIS AND APPROACH
This traffic operations analysis employed a conventional approach that included basic
data collection, investigation of existing roadway and traffic conditions, utilizing the 2031
Build alternative design concepts dated May 2012, and then analysis of the above
mentioned study scenario operational impacts.

Transportation Technical Report Page 24 December 2012
Environmental Assessment
Gilbert Road Extension
Available historical traffic volumes were collected from City of Mesa data base (years
2007, 2008 and 2009) and new traffic counts (auto, pedestrian and bicycle) were
performed at all signalized intersections within the study area, including University Drive
and Broadway Road. Traffic counts were performed in April and May of 2012. Due to
construction that was underway along Main Street at that time, traffic counts were found
not to be indicative of actual travel patterns and were not used in this traffic analysis –
refer to section 3.2.1.2.
Signal timings and phasings were obtained from the 2011 City of Mesa Synchro model
provided by the City of Mesa.
The traffic operations study analyzed the PM peak hour traffic conditions, as the
evening peak period is expected to generate the most congested traffic conditions
during a weekday.
Additional intersections were added to the study area as the project progressed. For
the North and South PNR’s - Gilbert Road/North PNR Access and Gilbert Road/South
PNR Access intersections were added. These were studied as unsignalized
intersections. The City also requested to study three intersections during the AM peak
period for both the 2031 Build Alternative (4-Lane) (north and south PNR options) and
the 2031 Build Alternative (2-Lane) (north and south PNR options) at Main Street/PNR
Access intersection, Main Street/Gilbert Road intersection and Gilbert Road/PNR
Access intersection. These locations were thought to be impacted, especially Main
Street and Gilbert Road, by the additional traffic volumes generated by the PNR in the
AM Peak period. These will be further studied in the project design phases based on a
selection of the PNR location.
3.2.1 Traffic Volume Development
3.2.1.1 MAG Travel Demand Models (TDM’s)
Development of the traffic volumes/turning movement counts for each of the 2031 No-
Build and 2031 Build Alternatives and Build Option required review, understanding and
in some cases interpretation of the MAG Travel Demand Models developed for this
study.
Comparing the TDM 2031 No-Build and 2031 Build Alternative (4-Lane) volumes found
little change between the two and at many locations the 2031 Build Alternative (4-Lane)
volumes were less than the 2031 No-Build. This was due mainly to the introduction of
the Central Mesa Extension LRT project which reduces Main Street to 2 travel lanes
between Country Club Drive and Mesa Drive and also due to a travel mode shift that
includes more rail transit ridership and reduced auto traffic volumes.
The TDM’s were also used as a basis of volume development for pedestrians, transit
boardings and alightings and the Gilbert Road PNR volume development.
Transportation Technical Report Page 25 December 2012
Environmental Assessment
Gilbert Road Extension
3.2.1.2 2012 Existing Traffic Volumes/Turning Movement Counts (TMC’s)
As mentioned above, both historical traffic counts and new traffic counts were obtained.
But due to the construction that occurred along Main Street, it was agreed to use the
historic counts as the basis to develop the 2012 traffic volumes/turning movement
counts. This was considered to be conservative as the trend in traffic volume over the
last 5 years was shown to be decreasing, as evident in Table 2 and MAG Travel
Demand Models. This was considered acceptable to City of Mesa and Valley Metro
staff. The 2012 Existing Traffic Volumes/Turning Movement Counts (TMC’s) are shown
in Table 6.

Transportation Technical Report Page 26 December 2012
Environmental Assessment
Gilbert Road Extension
TABLE 6: 2012 EXISTING PM PEAK TURNING MOVEMENT COUNTS
INTERSECTION # ** Approach
Total
EASTBOUND (EB) WESTBOUND (WB) NORTHBOUND (NB) SOUTHBOUND (SB)
Total EBL EBT EBR Total WBL WBT WBR Total NBL NBT NBR Total SBL SBT SBR
Main Street
1 Mesa 3824 1075 54 881 140 694 113 470 111 898 79 666 153 1157 202 909 46
_ Station Ped
Signal No Signal in 2012
2* Lesueur 1987 1137 15 1109 13 740 26 693 21 63 8 10 45 47 17 5 25
3 Hobson 2053 1211 29 1162 20 709 41 640 28 53 13 8 32 80 40 20 20
4 Horne 2727 1328 33 1240 55 809 74 686 49 318 77 150 91 272 62 194 16
5* Miller 2250 1320 25 1250 45 770 25 700 45 80 25 10 45 80 25 10 45
6 Stapley 3982 1298 53 1133 112 778 101 623 54 924 127 660 137 982 57 855 70
_ Station Ped
Signal No Signal in 2012
7 Lazona 2340 1380 25 1320 35 830 15 770 45 50 15 10 25 80 25 10 45
8* Harris 2340 1400 25 1375 0 870 0 825 45 0 0 0 0 70 25 0 45
9 Williams 2411 1446 1 1400 45 891 25 865 1 71 25 1 45 3 1 1 1
10* PNR Access No Signal in 2012
11 Gilbert 5157 1493 152 1039 302 903 205 607 91 1334 186 951 197 1427 166 1150 111
12 Lindsay 4297 1275 120 931 224 803 119 566 118 992 116 752 124 1227 132 1011 84
Source: HDR – HCM Signalized Intersection Capacity Analysis 11/12
* 2012 unsignalized intersection
**Refer to Figure 4 for signalized intersection locations
R – Right turn
T – Through traffic
L – Left Turn

Transportation Technical Report Page 27 December 2012
Environmental Assessment
Gilbert Road Extension
3.2.1.3 2031 No-Build Alternative Traffic Volumes/Turning Movement Counts
Development of the 2031 No-Build traffic volumes considered existing and planned
economic growth for Mesa, review and use of the 2031 Travel Demand Modeling
growth output, and use of growth factors and corridor balancing and adjustments at
select locations using engineering judgment. The 2031 No-Build traffic volume turning
movement counts (TMC’s) included the following process:
Adding the difference between the MAG TDM 2031 No-Build volumes and the
MAG TDM 2010 TDM volumes, proportionally, to the 2012 traffic volumes/TMC’s
to obtain the 2031 No-Build TMC’s.
At some locations, if the above difference between the TDM 2031 No-Build
volume and the 2010 TDM volume was less than or equal to zero, than a 0.5%
growth rate per year was applied to the 2012 Traffic Volume/TMC to obtain the
2031 No-Build TMC.
At some locations, if the newly obtained 2031 No-Build TMC was less than zero,
it was agreed to use the 2012 traffic volume/TMC in its place. This was
considered conservative.
For the 2031 No-Build Alternative, two new signalized intersections were included along
the study corridor, Main Street/Mesa Station Pedestrian Signal and Main
Street/Lesueur. These locations are proposed to be signalized as part of the Central
Mesa Extension LRT project, to be constructed in 2016. For the Lesueur intersection,
the 2012 TMC’s were estimated using Maricopa County Assessor land use maps and
engineering judgment. 2031 No-Build TMC’s were then calculated using a 0.5% growth
rate per year applied to the 2012 TMC.
The pedestrian volumes for the Mesa Station pedestrian signal were obtained from the
TDM. This was considered conservative and the process was approved by City of Mesa
and Valley Metro staff.
2031 No-Build Alternative Traffic Volumes/Turning Movement Counts (TMC’s) are
shown in Table 7.

Transportation Technical Report Page 28 December 2012
Environmental Assessment
Gilbert Road Extension
TABLE 7: 2031 NO BUILD PM PEAK TURNING MOVEMENT COUNTS
INTERSECTION # Approach
Total
EASTBOUND (EB) WESTBOUND (WB) NORTHBOUND (NB) SOUTHBOUND (SB)
Total EBL EBT EBR Total WBL WBT WBR Total NBL NBT NBR Total SBL SBT SBR
Main Street
1 Mesa 3818 796 62 594 140 483 184 230 69 1105 119 928 58 1434 295 1118 21
_ Station Ped
Signal 1430 947 - 947 - 483 - 483 - No vehicles northbound or southbound
2 Lesueur 1583 949 16 919 14 514 29 462 23 69 9 11 49 51 19 5 27
3 Hobson 1758 1032 32 978 22 580 45 504 31 58 14 9 35 88 44 22 22
4 Horne 2374 1077 36 991 50 608 82 494 32 392 88 160 144 297 92 183 22
5* Miller 2020 1150 27 1074 49 696 27 620 49 87 27 11 49 87 27 11 49
6 Stapley 3980 1107 34 931 142 840 147 619 74 1024 98 847 79 1009 103 880 26
_ Station Ped
Signal No Signal in 2031 No Build
7 Lazona 2269 1216 27 1151 38 912 16 847 49 54 16 11 27 87 27 11 49
8* Harris 2271 1239 27 1212 - 956 - 907 49 - - - - 76 27 - 49
9 Williams 2348 1289 1 1239 49 979 27 951 1 77 27 1 49 3 1 1 1
10* PNR Access No Signal in 2031 No Build
11 Gilbert 5707 1356 141 983 232 1024 225 667 132 1618 229 1172 217 1709 279 1318 112
12 Lindsay 5057 1573 123 1204 246 1025 154 741 130 1087 128 823 136 1372 257 1023 92
Source: HDR – HCM Signalized Intersection Capacity Analysis 11/12
* Unsignalized intersection
R – Right turn
T – Through traffic
L – Left Turn

Transportation Technical Report Page 29 December 2012
Environmental Assessment
Gilbert Road Extension
3.2.1.4 2031 Build 4-Lane Alternative Traffic Volumes/Turning Movement
Counts
Development of the 2031 Build Alternative (4-Lane) traffic volumes utilized the TDM
2031 Build Alternative (4-Lane) volumes, TDM 2031No-Build volumes and engineering
judgment. As stated above, comparing the TDM 2031 No-Build and TDM 2031Build
Alternative (4-Lane) volumes found little change between the two and at many locations
the 2031 Build 4-Lane volumes were less than the 2031No-Build. This was due mainly
to the introduction of the Central Mesa Extension LRT project which reduces Main
Street to 2 travel lanes between Country Club Drive and Mesa Drive and also due to a
travel mode shift that includes increased light rail transit ridership and reduced auto
traffic volumes. Thus, the 2031 Build 4-Lane traffic volume/turning movement counts
(TMC’s) included the following process:
Adding the difference between the TDM 2031 Build Alternative (4-Lane) and the
TDM 2031 No-Build TDM volumes, proportionally, to the 2031 No-Build traffic
volumes/TMC’s (described above) to obtain the 2031 Build Alternative (4-Lane)
TMC’s.
At some locations, if the difference between the TDM 2031Build Alternative (4-
Lane) and TDM 2031 No-Build volumes was less than negative 20, than it was
agreed to use the 2031 No-Build traffic volume/TMC in its place.
For the 2031 Build Alternative (4-Lane), four new signalized intersections were included
along the study corridor: Main Street/Miller Street, Main Street/Stapley Station
Pedestrian Signal, Main Street/Harris Drive, and Main Street/Park and Ride (PNR)
Access. Signals at these locations, shown in the HDR May 2012 design plans, are
proposed to assist with protected left turns and cross street movements across the LRT
tracks. The 2012 TMC’s for these intersections were estimated using Maricopa County
Assessor land use maps and engineering judgment. 2031 Build Alternative (4-Lane)
TMC’s were then calculated using a 0.5% growth rate per year applied to the 2012
TMC. The pedestrian volumes for the Stapley Station Pedestrian signal were obtained
from the TDM 2031 Build Alternative (4-Lane) model. This process was approved by
City of Mesa and Valley Metro staff.
2031 Build Alternative (4-Lane) Traffic Volumes/Turning Movement Counts (TMC’s) are
shown in Table 8 and Table 9. Table 8 shows the additional traffic generated by the
South PNR facility and Table 9 shows additional traffic generated by the North PNR
Facility.

Transportation Technical Report Page 30 December 2012
Environmental Assessment
Gilbert Road Extension
TABLE 8: 2031 BUILD ALTERNATIVE (4-LANE) PNR SOUTH PM PEAK TURNING MOVEMENT COUNTS
INTERSECTION # * Approach
Total
EASTBOUND (EB) WESTBOUND (WB) NORTHBOUND (NB) SOUTHBOUND (SB)
Total EBL EBT EBR Total WBL WBT WBR Total NBL NBT NBR Total SBL SBT SBR
Main Street
1 Mesa 3806 793 66 587 140 482 184 228 70 1099 122 919 58 1432 297 1113 22
_ Station Ped
Signal 1448 950 - 947 - 498 - 498 - No vehicles northbound or southbound
2 Lesueur 1583 949 16 919 14 514 29 462 23 69 9 11 49 51 19 5 27
3 Hobson 1758 1032 32 978 22 580 45 504 31 58 14 9 35 88 44 22 22
4 Horne 2364 1073 36 986 51 606 82 490 34 390 87 160 143 295 90 183 22
5 Miller 2020 1150 27 1074 49 696 27 620 49 87 27 11 49 87 27 11 49
6 Stapley 4027 1103 30 931 142 885 163 616 106 1028 99 843 86 1011 107 878 26
_ Station Ped
Signal 2031 1136 - 1136 - 895 - 895 - No vehicles northbound or southbound
7 Lazona 2334 1231 27 1166 38 962 16 897 49 54 16 11 27 87 27 11 49
8* Harris 2346 1259 27 1232 - 1011 - 962 49 - - - - 76 27 - 49
9 Williams 2431 1312 1 1262 49 1039 27 1011 1 77 27 1 49 3 1 1 1
10 PNR Access 2545 1350 5 1322 23 1017 23 989 5 168 67 0 101 10 5 0 5
11 Gilbert 5852 1450 191 1026 233 1056 242 682 132 1619 229 1172 218 1727 280 1330 117
12 Lindsay 5114 1601 139 1218 244 1040 153 757 130 1093 133 822 138 1380 258 1024 98
Source: HDR – HCM Signalized Intersection Capacity Analysis 11/12
*Refer to Figure 2 for intersection locations
R – Right turn
T – Through traffic
L – Left Turn

Transportation Technical Report Page 31 December 2012
Environmental Assessment
Gilbert Road Extension
TABLE 9: 2031 BUILD ALTERNATIVE (4-LANE) PNR NORTH PM PEAK TURNING MOVEMENT COUNTS
INTERSECTION # * Approach
Total
EASTBOUND (EB) WESTBOUND (WB) NORTHBOUND (NB) SOUTHBOUND (SB)
Total EBL EBT EBR Total WBL WBT WBR Total NBL NBT NBR Total SBL SBT SBR
Main Street
1 Mesa 3805 793 66 587 140 482 184 228 70 1099 122 919 58 1432 297 1113 22
_ Station Ped
Signal 1448 950 - 950 - 498 - 498 - No vehicles northbound or southbound
2 Lesueur 1583 949 16 919 14 514 29 462 23 69 9 11 49 51 19 5 27
3 Hobson 1758 1032 32 978 22 580 45 504 31 58 14 9 35 88 44 22 22
4 Horne 2368 1073 36 986 51 610 82 494 34 390 87 160 143 295 90 183 22
5 Miller 2020 1150 27 1074 49 696 27 620 49 87 27 11 49 87 27 11 49
6 Stapley 4050 1103 30 931 142 919 180 633 106 1023 99 843 81 1005 101 878 26
_ Station Ped
Signal 2054 1124 - 1124 - 930 - 930 - No vehicles northbound or southbound
7 Lazona 2354 1216 27 1151 38 997 16 932 49 54 16 11 27 87 27 11 49
8 Harris 2361 1239 27 1212 - 1046 - 997 49 - - - - 76 27 - 49
9 Williams 2454 1294 1 1244 49 1080 27 1052 1 77 27 1 49 3 1 1 1
10 PNR Access 2546 1339 12 1322 5 1029 5 989 35 10 5 0 5 168 67 0 101
11 Gilbert 5924 1416 140 1009 267 1060 224 687 149 1642 241 1183 218 1806 331 1363 112
12 Lindsay 5152 1634 139 1234 261 1045 153 763 130 1093 133 822 138 1380 258 1024 98
Source: HDR – HCM Signalized Intersection Capacity Analysis 11/12
*Refer to Figure 2 for intersection locations
R – Right turn
T – Through traffic
L – Left Turn

Transportation Technical Report Page 32 December 2012
Environmental Assessment
Gilbert Road Extension
3.2.1.5 2031 Build Alternative (2-Lane) Traffic Volumes/Turning Movement
Counts
Development of the 2031 Build Alternative (2-Lane) traffic volumes utilized the TDM
2031 Build 2-Lane volumes, TDM 2031No-Build volumes and engineering judgment.
Thus, the 2031 Build Alternative (2-Lane) traffic volume/turning movement counts
(TMC’s) involved the following process:
Adding the difference between the TDM 2031 Build (2-Lane) and the TDM 2031
No-Build TDM volumes proportionally to the 2031 No-Build traffic volumes/TMC’s
(described above) to obtain the 2031 Build Alternative (2-Lane) TMC’s.
At some locations, if the above difference is less than or equal to zero, it was
agreed to use the 2031 No-Build traffic volume/TMC in its place.
For the 2031 Build Alternative (2-Lane), the same four new signalized intersections
were included along the study corridor as the 2031 Build Alternative (4-Lane). The traffic
volumes at these locations are the same as well, except they were adjusted and
rebalanced to account for the lane reduction on Main Street.
The 2031 Build Alternative (2-Lane) Traffic Volumes/Turning Movement Counts (TMC’s)
are shown in Table 10 and Table 11.
3.2.1.6 2031 Build Alternative (2-Lane Roundabouts) Traffic
Volumes/Turning Movement Counts
It is assumed that the 2031 Build Alternative (2-Lane Roundabouts) traffic volumes will
be the same as the 2031 Build Alternative (2-Lane) traffic volumes/TMC’s. The 2031
Build Alternative (2-Lane Roundabouts) Traffic Volumes/Turning Movement Counts
(TMC’s) are shown in Tables 10 and 11.

Transportation Technical Report Page 33 December 2012
Environmental Assessment
Gilbert Road Extension
TABLE 10: 2031 BUILD ALTERNATIVE (2-LANE) PNR SOUTH PM PEAK TURNING MOVEMENT COUNTS
THESE ARE ALSO THE COUNTS FOR (2-LANE ROUNDABOUTS)
INTERSECTION # * Approach
Total
EASTBOUND (EB) WESTBOUND (WB) NORTHBOUND (NB) SOUTHBOUND (SB)
Total EBL EBT EBR Total WBL WBT WBR Total NBL NBT NBR Total SBL SBT SBR
Main Street
1 Mesa 3308 749 88 455 206 447 155 200 92 1070 143 887 40 1042 189 815 38
_ Station Ped
Signal 1140 690 - 690 - 450 - 450 - No vehicles northbound or southbound
2 Lesueur 1273 679 16 649 14 474 29 422 23 69 9 11 49 51 19 5 27
3 Hobson 1418 732 32 678 22 540 45 464 31 58 14 9 35 88 44 22 22
4** Horne 2003 780 36 676 68 520 56 441 23 354 96 218 40 349 86 242 21
5** Miller 1634 850 27 774 49 606 27 530 49 87 27 11 49 87 27 11 49
6 Stapley 3697 883 34 722 127 697 151 454 92 1065 93 936 36 1051 42 980 29
_ Station Ped
Signal 1486 786 - 786 - 700 - 700 - No vehicles northbound or southbound
7** Lazona 1734 831 27 766 38 762 16 697 49 54 16 11 27 87 27 11 49
8** Harris 1746 859 27 832 - 811 - 762 49 - - - - 76 27 - 49
9** Williams 1831 912 1 862 49 839 27 811 1 77 27 1 49 3 1 1 1
10 P&R Access 1897 950 5 922 23 769 23 741 5 168 67 0 101 10 5 0 5
11 Gilbert 5469 1047 220 572 255 961 297 513 151 1684 209 1271 204 1791 243 1485 49
12 Lindsay 4556 1102 118 671 313 1036 184 683 169 1079 123 838 118 1339 256 999 84
Source: HDR – HCM Signalized Intersection Capacity Analysis 11/12
*Refer to Figures 2 and 3 for intersection and roundabout locations
** Roundabout locations for 2031 Build Alternative (2-Lane Roundabouts)
R – Right turn
T – Through traffic
L – Left Turn

Transportation Technical Report Page 34 December 2012
Environmental Assessment
Gilbert Road Extension
TABLE 11: 2031 BUILD ALTERNATIVE (2-LANE) PNR NORTH PM PEAK TURNING MOVEMENT COUNTS
THESE ARE ALSO THE COUNTS FOR (2-LANE ROUNDABOUTS)
INTERSECTION # * Approach
Total
EASTBOUND (EB) WESTBOUND (WB) NORTHBOUND (NB) SOUTHBOUND (SB)
Total EBL EBT EBR Total WBL WBT WBR Total NBL NBT NBR Total SBL SBT SBR
Main Street
1 Mesa 3308 749 88 455 206 447 155 200 92 1070 143 887 40 1042 189 815 38
_ Station Ped
Signal 1139 689 - 689 - 450 - 450 - No vehicles northbound or southbound
2 Lesueur 1273 679 16 649 14 474 29 422 23 69 9 11 49 51 19 5 27
3 Hobson 1418 732 32 678 22 540 45 464 31 58 14 9 35 88 44 22 22
4** Horne 2003 780 36 676 68 520 56 441 23 354 96 218 40 349 86 242 21
5** Miller 1630 850 27 774 49 606 27 530 49 87 27 11 49 87 27 11 49
6 Stapley 3719 883 34 722 127 731 168 471 92 1060 93 936 31 1045 36 980 29
_ Station Ped
Signal 1514 774 - 774 - 740 - 740 - No vehicles northbound or southbound
7** Lazona 1754 816 27 751 38 797 16 732 49 54 16 11 27 87 27 11 49
8** Harris 1761 839 27 812 - 846 - 797 49 - - - - 76 27 0 49
9** Williams 1854 894 1 844 49 880 27 852 1 77 27 1 49 3 1 1 1
10 PNR Access 1911 939 12 922 5 794 5 754 35 10 5 0 5 168 67 0 101
11 Gilbert 5541 1013 169 555 289 965 279 518 168 1707 221 1282 204 1856 294 1518 44
12 Lindsay 4579 1118 118 687 313 1042 184 689 169 1077 123 836 118 1339 256 999 84
Source: HDR – HCM Signalized Intersection Capacity Analysis 11/12
*Refer to Figures 2 and 3 for intersection and roundabout locations
** Roundabout locations for 2031 Build Alternative (2-Lane Roundabouts)
R – Right turn
T – Through traffic
L – Left Turn

Transportation Technical Report Page 35 December 2012
Environmental Assessment
Gilbert Road Extension
3.2.1.7 Gilbert Road Park and Ride (PNR) Traffic Volumes/Turning
Movement Counts
The development of the PNR traffic volumes/TMC’s and PNR trip distribution utilized
TDM trip projections, travel shed maps, the 2031 Build Alternative design plans dated
May 2012, meetings with Valley Metro and City of Mesa staff and engineering judgment.
From the TDM’s, drive access person trips were converted to vehicle trips for each
station and the Gilbert Road PNR, using 2008 NHTS occupancy factors provided by
Valley Metro. The number of peak and off-peak period vehicle trips entering and exiting
the stations/PNR, including kiss and riders, were then developed based on trip purpose.
Since the TDM assumes a PNR lot near the Mesa Drive Station, a Mesa Drive and
Gilbert Road PNR travel shed map was developed to understand PNR vehicle trips to
the Gilbert Road PNR facility.
In addition, based on input from City of Mesa and Valley Metro staff in September 2012,
it was requested that the AM peak period be studied as the Gilbert PNR AM users may
generate traffic impacts to the Main Street/Gilbert Road intersection. Therefore, the
following intersections were studied during the AM peak period: Main Street/Gilbert
Road, Main Street/PNR Access and the PNR access along Gilbert Road (as an
unsignalized intersection). Available historic AM traffic volumes/TMC’s and TDM traffic
volumes were available at Main Street/Gilbert Road and used as a basis for AM traffic
volume development for the 2031 No-Build, 2031 Build Alternatives and the Gilbert PNR
as described above.
An additional study was conducted to verify whether or not the peak period for general
purpose traffic in the vicinity of Gilbert Road would be different than the peak period for
PNR traffic. To accomplish this, 24 hour counts were conducted at the existing end-of-
line Sycamore Transit Center PNR to determine peak PNR usage at that facility and
then applying the same findings to the proposed end-of-line at Gilbert Road. The
results of this study found that the general purpose traffic and PNR peak periods occur
at the same time, therefore the PNR peak traffic near Gilbert Road was added to the
PM peak period traffic volume tables.
Therefore, based on the above methods, studies and engineering assumptions:
1. It is estimated that 2,022 daily total vehicle trips, including kiss and riders (KNR),
will utilize the Gilbert Road PNR facility.
See Table 12.
2. 20% of the daily total vehicle trips are estimated to be PM peak hour PNR trips.
This is 410 vehicles. (This is approximately 60% of the proposed PNR capacity of
700 vehicles. This is also relatively close to the high-end average percentage

Transportation Technical Report Page 36 December 2012
Environmental Assessment
Gilbert Road Extension
utilization, 55%, of all other Valley Metro PNR’s over the last 6 months.)
See Table 12.
3. 15% of the daily total vehicle trips are estimated to be AM peak hour PNR trips.
This is 310 vehicles. (This is approximately 45% of the proposed PNR capacity of
700 vehicles.)
4. For both the AM and PM peak periods, it is estimated that 10% of the total PNR
trips are KNR. Because the TDM KNR vehicle trips used were only counted as one
trip in the TDM projected total vehicle trip, the actual KNR numbers need to be 2
trips (entering and exiting), and thus the KNR numbers are multiplied by 2.
See Table 13.
5. For the PM peak period, it is assumed that the PNR entering/exiting split is
20%/80%, respectively, for both the North and South Options.
See Table 13.
6. For the AM peak period, it is assumed that the PNR entering/exiting split is
80%/20%, respectively, for both the North and South Options.
7. For both the AM and PM peak periods, it is assumed that the KNR entering/exiting
split is 50%/50%.
See Table 13.
8. Gilbert Road PNR facility PM peak hour volumes are shown in Tables 12 and 13.
PNR trip distributions are shown in Figures 11 and 12 for the North and South PNR
Options, respectively.
9. The PNR and KNR volumes developed from the above, are included in the total
traffic volumes/TMC’s.
See Table 8 through Table 11.
TABLE 12: PNR PM PEAK HOUR VEHICLE TRIPS: NORTH AND SOUTH PNR
Station Daily Vehicle Trips*
(including Kiss-and-Riders) Peak Hour Vehicles
(including kiss-and-ride)
Mesa 1,022 210
Stapley 22 10
Gilbert 2,022 410
* From 2031 TDM "Drive Access to Station Activity" Note: Assume 20% of daily trips occur during PM peak hour

Transportation Technical Report Page 37 December 2012
Environmental Assessment
Gilbert Road Extension
TABLE 13: PNR AND KNR PM PEAK HOUR VOLUMES: NORTH AND SOUTH PNR
PNR and KNR Volume Split
Peak Hour Vehicle Trips
In % / Out % In Out
PNR (90%) 369 20% / 80% 74 295
KNR (10%) 41 50% / 50% 21 21
KNR trips*** 21 21
Total PM Peak Trips 116 337
Note: TDM vehicle trips are counted as one trip in TDM projected total vehicle trip. Thus KNR will be 2 trips (entering and exiting).
FIGURE 11: PM PEAK NORTH PNR TRIP DISTRIBUTIONS
FIGURE 12: PM PEAK SOUTH PNR TRIP DISTRIBUTIONS

Transportation Technical Report Page 38 December 2012
Environmental Assessment
Gilbert Road Extension
3.2.1.8 Pedestrian and Bicycle Volumes
New traffic counts were performed at most signalized intersections within the study area
and included pedestrian and bicycle counts. These were used for the 2012 Existing
Conditions. Where missing data occurred, historical counts and/or engineering
judgment were used to develop the pedestrian and bicycle counts.
For the 2031 No-Build scenario, an annual growth rate of 0.5% was applied to the 2012
pedestrian and bicycle counts and for the 2031 Build Alternatives, TDM projected LRT
boardings and alightings were added to the 2031 Build Alternative background
pedestrian volumes at the respective LRT station location.
3.2.2 Roadway Geometry/Lane Configurations
As part of the traffic operations analysis using Synchro, roadway lane configurations are
required as part of the modeling software. The 2012 existing roadway geometry,
including lane configurations and turn lane storage lengths, was obtained from available
basemapping, aerial photography surveys, and field reviews. This information was then
used for the 2012 Existing conditions and used partially for the 2031 No-Build Synchro
models.
For the 2031 No-Build analysis, the 2012 existing roadway geometry was used for most
of the corridor. In addition, the CME project, to be completed by 2016, was used for the
segment of Main Street between Mesa Drive and North Edgemont, as shown on the
conceptual design plans dated May 2012. Based on these drawings, the following
locations require roadway improvements, lane configuration changes or restricted turn
movements as part of the CME project. These are:
CME-at-grade, center running, semi-exclusive LRT tracks from Mesa Drive to
North Edgemont with the Mesa Drive Station located just east of Mesa Drive;
The westbound (WB) right turn pocket is removed at Mesa Drive;
One new pedestrian signalized crossing added for the east end of the Mesa
Drive Station;
One new signalized intersection added at Lesueur with EB and WB left turn
pockets;
Only one eastbound (EB) travel lane provided between Mesa Drive and Hobson;
South Udall and South Olive become right-in/right-out
For the 2031 Build Alternative (4-Lane), the roadway geometry, lane configurations,
station locations, and PNR locations were based on the conceptual project design
drawings dated May 2012. Based on these drawings, the following locations would

Transportation Technical Report Page 39 December 2012
Environmental Assessment
Gilbert Road Extension
require roadway improvements, lane configuration changes, or restricted movements
(compared to and in addition to the 2031 No-Build). These are:
Gilbert Road Extension – include at-grade, center running, and semi-exclusive
LRT tracks from the CME to Gilbert Road. This includes a station at Stapley
Drive and a station/PNR at Gilbert Road.
The WB and EB right turn pockets are removed from Horne and Stapley Drive.
One EB through lane and one EB left turn pocket at Gilbert Road are removed.
3 new signalized intersections are added at: Miller Street, North Harris Drive and
PNR Access Drive. These signalized locations will have EB and WB left turn
pockets.
1 new pedestrian signalized crossing added for the east end of the Stapley Drive
Station.
The following roads become right-in, right-out: North and South Ashland, North
Bellview, access to Apache Lanes/Rancho Grande, North Fraser Drive, Temple
Street, North and South Matlock, North Spencer, North Parcell, South Allen,
South Lazona, South Barkley, North Hunt Drive, and North Guthrie Drive.
For the 2031 Build Alternative (2-Lane), the roadway geometry, lane configurations,
station locations, and PNR locations were based on the conceptual project design
drawings dated May 2012. Based on these drawings, the following locations would
require roadway improvements, lane configuration changes, or restricted movements
compared to and in addition to the 2031 No-Build and/or the 2031 Build Alternative (4-
Lane). These locations are:
Removal of one EB and one WB through travel lane from Hobson to the Gilbert
PNR Access Road. From the PNR Access Road to Gilbert Road the Main Street
lane configuration is the same as the 2031 Build Alternative (4-Lane).
For the 2031 Build Alternative (2-Lane Roundabouts), the roadway geometry, lane
configurations, station locations, and PNR locations were based on the conceptual
design project drawings dated May 2012. Based on these drawings, the following
locations would require roadway improvements, lane configuration changes, or
restricted movements (compared to and in addition to the 2031 Build Alternative (2-
Lane). These locations are:
5 single-lane roundabouts added to the following locations instead of the
signalized intersections shown in the 2031 Build Alternative (2-Lane): Horne,
Miller Street, North Lazona Drive, North Harris Drive and South Williams.

Transportation Technical Report Page 40 December 2012
Environmental Assessment
Gilbert Road Extension
9 new pedestrian signalized crossings added. These are located at the flared
entries of each roundabout (the South Williams roundabout has only one
signalized pedestrian crossing east of the roundabout due to the proximity to the
North Harris Drive roundabout.)
1 new pedestrian signalized crossing added to the Stapley Drive Station west
end entry location.
3.2.3 Other Traffic Operations Study Parameters
3.2.3.1 Design Speed Input
Speed limits used along Main Street include the following:
35 mph: from west of Mesa Drive to Stapley Drive
40 mph: between Stapley Drive and Gilbert Road
45 mph: east of Gilbert Road
20 mph: assigned as the speed through the roundabouts for the 2031 Build
Alternative (2-Lane Roundabouts).
3.2.3.2 Signal Timing and Phasing Input
The existing signal timing of 110 second cycle length and phasing information along the
study corridor was provided by the City of Mesa and was used for the 2012 existing
conditions scenario.
For the 2031 No-Build scenario, 100 second cycle lengths were used and optimized
along the corridor along with coding protected left turn movements along Main Street for
those intersections that are part of the CME project.
For the 2031 Build Alternatives (4-Lane) and (2-Lane) including the (2-Lane
Roundabouts), 100 second cycle and 110 second cycle lengths, respectively, were
used and optimized along the corridors along with coding protected left turn movements
along Main Street for all signalized intersections that will be integrated with LRT
operations.
For the 2031 Build Alternative (2-Lane Roundabouts), RODEL was used to calculate
LOS and delay. The LOS and delay are based on Highway Capacity Manual (HCM)
unsignalized LOS thresholds and account for additional delay (15 seconds) due to the
LRT gated operations, averaged over the peak hour.
The existing 20-mile LRT Line and CME LRT projects use a “predictive priority” signal
detection system, which allows LRT the ability to have priority over auto/general
purpose traffic. For the purposes of this traffic operations analysis, based on the
limitations of Synchro to model LRT operations, LRT is considered to operate in

Transportation Technical Report Page 41 December 2012
Environmental Assessment
Gilbert Road Extension
coordination with general purpose traffic therefore LRT input into Synchro is limited and
coded only as bus blockage. More sophisticated software will be used to model traffic
and LRT operations in Final Design/next phase for the LPA.
3.2.3.3 On-Street Parking Input
Vehicles pulling into and out of parking spaces along Main Street will occur for the 2012
Existing, 2031 No-Build, and 2031 Build Alternatives (2-Lane) and (2-Lane
Roundabouts). These maneuvers have impacts on traffic flow and are coded into
Synchro. The number of these maneuvers during the PM peak hour considers the
number of existing and proposed parking spaces and are those shown on the
conceptual design project drawings dated May 2012. For the 2031 Build Alternative (4-
Lane) it is shown that all parking spaces along Main Street are removed.
3.2.3.4 Transit Input
Transit operations will have impacts on traffic flow and are coded into Synchro. Bus
operations, headways and bus stops are coded into Synchro based on existing and
proposed transit plans.
3.3 TRAFFIC OPERATIONS ANALYSIS RESULTS
Table 14 provides the overall PM Peak Hour average intersection level of service (LOS)
and delay utilizing the data in sections 3.2.1 through 3.2.3. Table 15 provides the AM
Peak hour average intersection LOS results at the 3 intersections near Gilbert Road
PNR.
Based on these results, all signalized intersections shown in the 2031 Build Alternative
(4-Lane) will operate at an acceptable Level of Service, as the City of Mesa allows LOS
E as acceptable during peak periods.
For the 2031 Build Alternative (2-Lane), except for the intersection of Main Street and
Stapley Drive, the intersections within the corridor operate at acceptable LOS. The
intersection of Main Street and Stapley Drive shows on overall intersection LOS F,
during the PM Peak period. Suggested mitigation is discussed in section 3.4.
Like the 2031 Build Alternative (2-Lane), the 2031 Build Alternative (2-Lane
Roundabouts) operates at acceptable LOS at each intersection along Main Street,
except at the intersection of Main Street and Stapley Drive. However, the 2031 Build
Alternative (2-Lane Roundabouts) shows substantially more delay than the 2031 Build
Alternative (2-Lane).
For the 3 intersections studied during the AM peak period, they will operate at
acceptable level of service in 2031 for all 2031 Build Alternatives.

Transportation Technical Report Page 42 December 2012
Environmental Assessment
Gilbert Road Extension
3.4 TRAFFIC OPERATIONS KEY FINDINGS AND SUGGESTED MITIGATION
According to results shown in Table 14, the 2031 Build Alternative (4-Lane)-North PNR
option shows three Main Street intersections change overall intersection LOS compared
to the 2031 No-Build. These occur at:
Mesa Drive: from LOS F to LOS E (this improvement due to travel mode
shift/reduction of traffic volumes)
Horne Street: from LOS B to C
Gilbert Road: from LOS D to E.
The 2031 Build Alternative (4-Lane)-South PNR option shows five intersections change
overall intersection LOS compared to the 2031 No-Build. These occur at:
Mesa Drive: from LOS F to LOS E (this improvement due to travel mode
shift/reduction of traffic volumes)
Horne Street: from LOS B to C
Lazona Drive: from LOS A to B
Gilbert Road: from LOS D to E
Lindsay Road: from LOS D to E.
Both the 2031 Build Alternative (2-Lane)-North and South PNR options show 5
intersections change overall intersection LOS compared to the 2031 No-Build. These
occur at:
Mesa Drive: from LOS F to LOS D. (This improvement due to the reduced traffic
volumes from 4 lanes to 2 lanes)
Horne Street: from LOS B to C
Stapley Drive: from LOS D to F
Lazona Drive: from LOS A to B
Williams Drive: from LOS A to B.
Both the 2031 Build Alternative (2-Lane Roundabouts)-North and South PNR options
show 5 intersections change overall intersection LOS compared to the 2031 No-Build.
These occur at:
Mesa Drive: from LOS F to LOS D. (This improvement due to the reduced traffic
volumes from 4 lanes to 2 lanes)
Horne Street: from LOS B to C
Stapley Drive: from LOS D to F
Lazona Drive: from LOS A to C
Williams Drive: from LOS A to E.
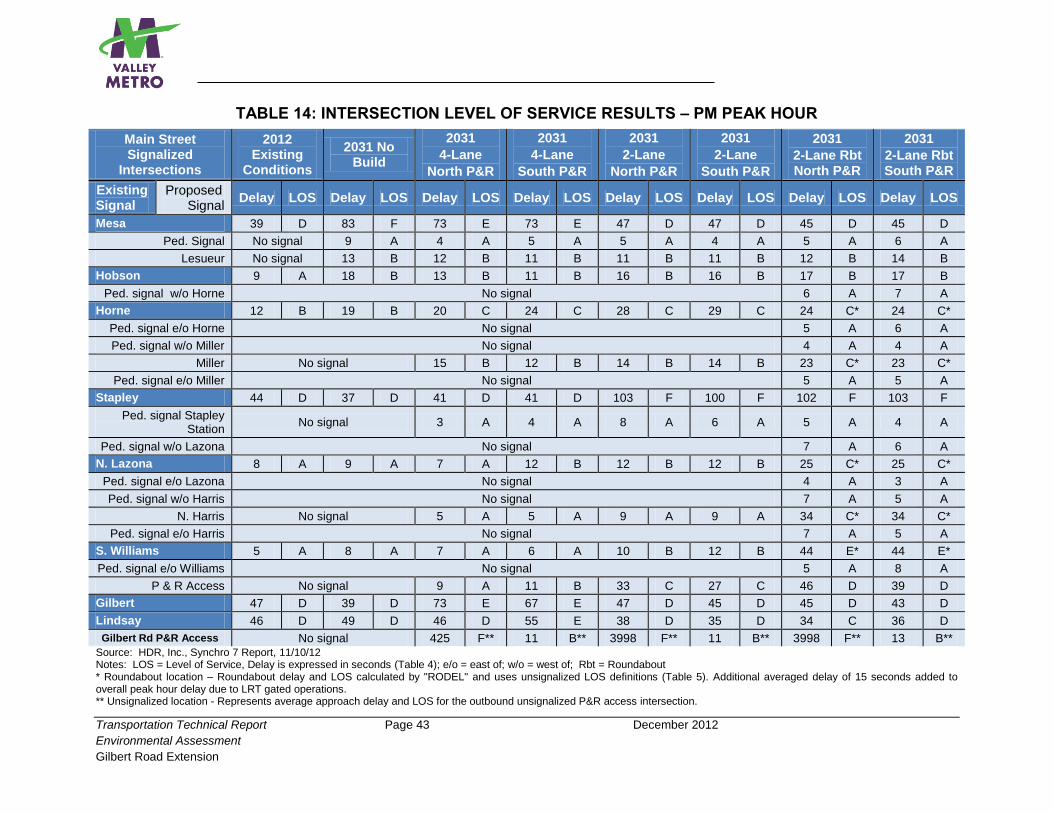
Transportation Technical Report Page 43 December 2012
Environmental Assessment
Gilbert Road Extension
TABLE 14: INTERSECTION LEVEL OF SERVICE RESULTS – PM PEAK HOUR
Main Street Signalized
Intersections
2012 Existing
Conditions
2031 No Build
2031
4-Lane
North P&R
2031
4-Lane
South P&R
2031
2-Lane
North P&R
2031
2-Lane
South P&R
2031
2-Lane Rbt North P&R
2031
2-Lane Rbt South P&R
Existing Signal
Proposed Signal
Delay LOS Delay LOS Delay LOS Delay LOS Delay LOS Delay LOS Delay LOS Delay LOS
Mesa 39 D 83 F 73 E 73 E 47 D 47 D 45 D 45 D
Ped. Signal No signal 9 A 4 A 5 A 5 A 4 A 5 A 6 A
Lesueur No signal 13 B 12 B 11 B 11 B 11 B 12 B 14 B
Hobson 9 A 18 B 13 B 11 B 16 B 16 B 17 B 17 B
Ped. signal w/o Horne No signal 6 A 7 A
Horne 12 B 19 B 20 C 24 C 28 C 29 C 24 C* 24 C*
Ped. signal e/o Horne No signal 5 A 6 A
Ped. signal w/o Miller No signal 4 A 4 A
Miller No signal 15 B 12 B 14 B 14 B 23 C* 23 C*
Ped. signal e/o Miller No signal 5 A 5 A
Stapley 44 D 37 D 41 D 41 D 103 F 100 F 102 F 103 F
Ped. signal Stapley Station
No signal 3 A 4 A 8 A 6 A 5 A 4 A
Ped. signal w/o Lazona No signal 7 A 6 A
N. Lazona 8 A 9 A 7 A 12 B 12 B 12 B 25 C* 25 C*
Ped. signal e/o Lazona No signal 4 A 3 A
Ped. signal w/o Harris No signal 7 A 5 A
N. Harris No signal 5 A 5 A 9 A 9 A 34 C* 34 C*
Ped. signal e/o Harris No signal 7 A 5 A
S. Williams 5 A 8 A 7 A 6 A 10 B 12 B 44 E* 44 E*
Ped. signal e/o Williams No signal 5 A 8 A
P & R Access No signal 9 A 11 B 33 C 27 C 46 D 39 D
Gilbert 47 D 39 D 73 E 67 E 47 D 45 D 45 D 43 D
Lindsay 46 D 49 D 46 D 55 E 38 D 35 D 34 C 36 D
Gilbert Rd P&R Access No signal 425 F** 11 B** 3998 F** 11 B** 3998 F** 13 B** Source: HDR, Inc., Synchro 7 Report, 11/10/12 Notes: LOS = Level of Service, Delay is expressed in seconds (Table 4); e/o = east of; w/o = west of; Rbt = Roundabout * Roundabout location – Roundabout delay and LOS calculated by "RODEL" and uses unsignalized LOS definitions (Table 5). Additional averaged delay of 15 seconds added to overall peak hour delay due to LRT gated operations. ** Unsignalized location - Represents average approach delay and LOS for the outbound unsignalized P&R access intersection.

Transportation Technical Report Page 44 December 2012
Environmental Assessment
Gilbert Road Extension
TABLE 15: INTERSECTION LOS RESULTS – AM PEAK HR AT GILBERT RD PNR
North Park and Ride Option South Park and Ride Option
2031 Build
4-Lanes 2031 Build
2-Lanes 2031 Build
4-Lanes 2031 Build
2-Lanes
Primary Street
Cross Street
Int. Delay (sec)
LOS Int. Delay
(sec) LOS
Int. Delay (sec)
LOS Int. Delay
(sec) LOS
Main Street
Gilbert Station
Ped Signal 11 B 13 B 8 A 18 B
Main Street
Gilbert Road
36 D 33 C 38 D 33 C
Gilbert Road
PNR Access
27 D* 36 E* 9 A* 9 A*
* Unsignalized location – Represents averaged approach LOS and corresponding delay using Table 5 LOS definitions

Transportation Technical Report Page 45 December 2012
Environmental Assessment
Gilbert Road Extension
Table 16 compares LOS for the 2031 Build-North Option Alternatives to each other. For
the South Option PNR to the Build Alternatives, the differences are minor as stated in
Section 3.4.2. The analysis results show (for the signalized or roundabout /unsignalized
intersections):
TABLE 16: LOS COMPARISON OF 2031 BUILD ALTERNATIVES
2031 BUILD ALTERNATIVE (4-LANE)
LOS Intersection
A Lazona, Harris, Williams, PNR Access
B Lesueur, Hobson, Miller
C Horne
D Stapley, Lindsay
E Mesa, Gilbert
F -
2031 BUILD ALTERNATIVE (2-LANE)
LOS Intersection
A Harris
B Lesueur, Hobson, Miller, Lazona, Williams
C Horne, PNR Access
D Mesa, Gilbert, Lindsay
E -
F Stapley
2031 BUILD ALTERNATIVE (2-LANE ROUNDABOUTS)
LOS Intersection
A -
B Lesueur, Hobson,
C Horne*, Miller*, Lazona*, Harris*,Lindsay
D Mesa, PNR Access, Gilbert
E Williams*
F Stapley
* Unsignalized/Roundabout intersection
Note: All Build Alternative signalized pedestrian crossings
operate at LOS A, thus are not shown.

Transportation Technical Report Page 46 December 2012
Environmental Assessment
Gilbert Road Extension
3.4.1 Main Street and Stapley Road
Evaluation of the LOS F results at Stapley Drive for the 2031 Build 2-Lane Alternative
indicates that the intersection’s low performance is mostly due to the large number of
right turning movements and cross street through volumes and the number of lanes
removed for this alternative: 2 through lanes, one eastbound and one westbound, and
the eastbound and westbound right turn lanes. This is 50% of the travel lanes along
Main Street. In comparison, Gilbert Road loses only 20% of the travel lanes along Main
Street for this same alternative.
Possible mitigation measures:
Continue to evaluate this intersection in future design phases including collecting
new traffic counts at Stapley when no construction may impact counts. New
traffic counts collected at Main Street and Stapley Road may have been affected
by the construction on Mesa Drive, thus traffic may have diverted to Stapley and
added diverted traffic to the southbound PM peak movement.
Add right turn lanes, 100 feet, to both eastbound and westbound directions. Re-
analysis results improve the overall intersection to LOS E/74 sec/vehicle from
LOS F/100 sec/vehicle in the PM peak.
Add dual left turn lanes, 200 feet, to both eastbound and westbound directions.
Preliminary results do not improve overall intersection LOS F results.
Use more sophisticated software to analyze the intersection and corridor, such
as VISSIM, that accounts for LRT operations along with auto operations to
achieve better/more accurate results.
Allow this intersection to go unmitigated. Drivers may divert to other less
congested intersections so they are not “stuck in traffic”. In this area, there are
other corridors that have the capacity to handle additional traffic volumes.
3.4.2 Park and Ride (PNR), North and South Options, Traffic Impacts
A comparison of the North to the South PNR option shows that there will be little
differences that occur relating to traffic delay and level of service based on the
assumptions of trip distributions and access/accessibility to the PNR’s. For the North
PNR, the eastbound movement out of the PNR onto Gilbert Road will experience
significant delays for this unsignalized location. Potential mitigation is to signalize this
location and/or add 2 additional access locations along Gilbert Road so that the
outbound traffic volume can “disperse” between 3 locations.
Based on a technical memo prepared by HDR for METRO: Gilbert Road Extension:
Park-and-Ride Facility Options Review, dated August 23, 2012, which assessed site
accessibility and traffic safety, site configuration and circulation needs, site capacity and

Transportation Technical Report Page 47 December 2012
Environmental Assessment
Gilbert Road Extension
future transit interface needs, the North Option PNR presents more advantages than the
South Option PNR.
Results of the traffic operational analysis show that the 2031 Build Alternative (4-Lane)
with the North Option would yield the best traffic operational results as compared with
the other possible combinations of Build Alternatives with the PNR North or South
Options.
4.0 OTHER TRANSPORTATION IMPACTS ASSESSMENTS
This section provides a qualitative assessment of other impacts the 2031 Build and No-
Build Alternatives would have on streets, transit, parking, and bicycle and pedestrian
facilities.
This information will assist Valley Metro and the City of Mesa in selecting a preferred
alternative; understanding the potential impacts of the proposed project alternatives and
will assist in developing appropriate design strategies, where needed, to avoid or
minimize impacts.
In each alternative, the placement of a light rail guideway and station platforms in a
center-running configuration on Main Street would result in the removal of the existing
center median. This exclusive light rail guideway would also eliminate many of the
existing left turn pockets located at unsignalized intersections and driveways. New
signalized intersections or roundabouts with turning opportunities would be created.
On-street parking would be affected uniquely with each alternative as described in
section 4.4. Pedestrian and bicycle connectivity would be maintained or enhanced,
although the resulting facilities in each alternative would be different than existing
conditions.
The following sections describe the changes to the existing roadway conditions that
would result from implementation of each of the design alternatives based on the HDR
Build Alternative plans dated May 2012.
4.1 IMPACTS TO SIGNALIZATION
The existing Central Phoenix/East Valley (CP/EV) Starter Line and the Central Mesa
Extension project (to be operational in 2016) use a Predictive Priority Control system
with traffic signals. Predictive priority uses detection devices placed far upstream of
intersection crossings to estimate train arrival times at the intersections. With this
communication, adjustments can be made to traffic signal timing and train station
departures in advance of the arrival of the train at the downstream intersections. The
detection has to be far enough upstream from the intersection to provide sufficient time
to complete minimum phases for any vehicular and pedestrian traffic movements

Transportation Technical Report Page 48 December 2012
Environmental Assessment
Gilbert Road Extension
initiated prior to detection. Under predictive priority, the basic traffic signal background
cycle will be maintained with changes made to length and sequencing of phases to
allow the phase serving LRT trains to be extended or advanced. Upon passage of the
LRT train through the intersection, the signal cycle would return to normal operation,
with no change in the background cycle length.
The City of Mesa plans to use the same Predictive Priority Control system for the Gilbert
Road Extension corridor for all the signalized intersection locations for all Build
Alternatives. The design of this system will be performed in the project development
phases and will use more advanced traffic analysis software that will determine the
signal timings to be used to integrate LRT operations along Main Street. It is
anticipated that all traffic control systems, software and hardware, at each of the
existing signalized intersections will need to be modified, but not replaced. New
signalized intersections will need to accommodate the appropriate control system
software and hardware. The design will be completed during the project development
phases.
In the 2031Build Alternative (2-Lane Roundabouts), traffic signals will not be required at
the 5 intersections proposed to use roundabouts. However they will still require
communications with approaching trains as they will utilize gates to control cross traffic
movements and also the signalized pedestrian crossings.
4.2 IMPACTS DUE TO TRAFFIC DIVERSION
The 2031 MAG Travel Demand Model runs were used to study the traffic diversion
occurring due to the reduction of travel lanes along Main Street for the 2031 Build
Alternative (2-Lane) during the PM peak periods. The reduction in capacity on Main
Street results in traffic shifting to other roadways in the network. Using the volume to
capacity ratios generated by the TDM, roadway link levels of service were developed.
Based on the TDM runs, the following information was determined based on evaluating
the differences in TDM Link LOS’s between the 2031 No-Build, 2031 Build Alternative
(4-Lane) and the 2031 Build Alternative (2-Lane) in relation to capacity impacts
(diversion impacts) along University Drive and Broadway:
The 2031 No-Build and the 2031 Build Alternative (4-Lane) have relatively the
same Link LOS’s along University and Broadway;
For the 2031 No-Build and Build Alternative (4-Lane), some roadway links show
LOS E and F. These locations are:
o EB University-Harris to Gilbert – LOS E
o EB Broadway- Stapley to Harris – LOS E
o EB University-Mesa to Stapley – LOS F

Transportation Technical Report Page 49 December 2012
Environmental Assessment
Gilbert Road Extension
o EB Broadway-Mesa to Stapley – LOS F
For the 2031 Build Alternative (2-Lane), due to traffic diversion, the following
changes to the University and Broadway roadway link LOS’s can be seen from
the TDM:
o EB University: Harris to Gilbert changes from LOS E to LOS F
o EB Broadway: Harris to Gilbert changes from LOS D to LOS E.
Thus, according to the 2031 MAG TDM runs, if Main Street is reduced to 2 lanes of
traffic, two segments of roadway links change from LOS D to E and LOS E to F, as
shown above. Further more detailed traffic analysis should be performed in future
project development phases to confirm LOS changes and adequate mitigation, if
required. Mitigation may be as basic as revising/optimizing the signal phasing. All other
University and Broadway roadway links will be the same as the 2031 No-Build and/or
2031 Build Alternative (4-Lane) LOS.
4.3 TURNING MOVEMENTS
4.3.1 Impacts Common to all Build Alternatives
For all 2031 Build Alternatives median breaks and left-turn pockets would be eliminated
at the following intersections - these all become right-in, right-out movements:
Ashland, Bellview, Frasier, Temple, Matlock, Spencer, Parsell, Allen, S. Lazona,
Barkley, Hunt, Guthrie
Protected left turn movements would occur at all signalized intersections along the
corridor for the 2031 Build Alternatives (4-Lane) and (2-Lane).
Passenger vehicle U-turns can be accommodated at all signalized intersections for the
2031 Build Alternatives (4-Lane) and (2-Lane). Turning opportunities for larger vehicle
types such as delivery trucks (SU-30’s) will need to be further analyzed in future design
phases.
For the 2031 Build Alternative (2-Lane Roundabouts), all passenger and delivery
vehicle type U-turns can be accommodated at the roundabouts but U-turns of larger
vehicle types such as SU-30’s at the signalized intersections will need to be further
analyzed in future project development phases.
4.4 DESIGN AND OPERATING SPEEDS
For the 2031 Build Alternatives (4-Lane) and (2-Lane), the design and posted speeds
would be the same as existing conditions; 35 mph from Mesa Drive to Stapley Drive and
40 mph from Stapley Drive to Gilbert Road.

Transportation Technical Report Page 50 December 2012
Environmental Assessment
Gilbert Road Extension
For the 2031Build Alternative (2-Lane Roundabouts), the design speeds for the
roundabout would be reduced to 20 mph. In between roundabouts, the design speed
can be the same as existing conditions.
4.5 IMPACTS TO TRANSIT
For all the 2031 Build Alternatives, the Valley Metro local bus route #40 would be
retained. Valley Metro Main Street LINK would no longer serve the Main Street corridor
west of Gilbert Road – the western terminus of this route would be at the proposed
Gilbert Road light rail station. LINK passengers wishing to continue west would transfer
to the LRT at Gilbert Road. Cross street bus routes on Mesa Drive (route 120), Stapley
Road (route 128) and Gilbert Road (route 136) would continue to operate as they do for
the 2031 No-Build conditions.
It is proposed that Route 30 on University Drive and Route 45 on Broadway Road would
divert on Gilbert Road to serve the end-of-line station at Gilbert Road. This is to be
confirmed in further agency discussions. See Section 2.3.4 of the EA for additional
information about the transit network associated with the 2031 Build Alternatives. (Note:
At the time of this report, the analysis did not include these bus reroutes. If the bus
reroutes are determined to be required, the traffic analysis will need to be revised
showing rerouted buses to the Gilbert Road Station PNR.)
4.6 IMPACTS TO ON-STREET PARKING
An inventory of existing on-street parking spaces along Main Street is documented in
Table 1 and repeated in Table 16 below for reference with respect to the impacts of the
light rail alternatives. Occupancy of on-street parking and parking maneuvers along
Main Street east of Downtown Mesa may be less than in Downtown Mesa because
businesses in this area tend to have proprietary off-street parking. On-street parking in
the Main Street study area primarily serves as a convenience to business patrons.
Table 17 documents the impacts to on-street parking that would be expected in each of
the proposed alternatives.

Transportation Technical Report Page 51 December 2012
Environmental Assessment
Gilbert Road Extension
TABLE 17: ON-STREET PARKING IMPACTS
Main Street Segment
2031 Light Rail Alternative
Existing
On-Street
Parking
Proposed On-Street Parking
No Build
Alternative
2031 Build
(4-Lane)
2031 Build
(2-Lane)
2031 Build
(2-Lane
Roundabouts)
Existing* and Proposed
Signalized Intersections
North
Side
South
Side
North
Side
South
Side
North
Side
South
Side
North
Side
South
Side
Ashland* - Horne* 7 0 0 0 6 0 8 5
Horne - Miller 22 27 0 0 11 21 19 26
Miller - Stapley 11 10 0 0 7 5 19 9
Horne* - Stapley* 33 37 0 0 18 26 38 35
Stapley* - Lazona* 27 11 0 0 0 0 0 0
Lazona - Harris 15 19 0 0 10 9 20 17
Harris - Williams 16 11 0 0 8 7 10 8
Lazona* - Williams* 31 30 0 0 18 16 30 25
Williams* - Gilbert* 9 19 0 0 0 0 0 0
Total On-Street Parking 204
0
(204 spaces
removed)
84
(120 spaces
removed)
141
(63 spaces
removed)
4.7 IMPACTS TO BICYCLE FACILITIES
4.7.1 Build Alternative 4-Lane
Bicycle lanes on Main Street would be mostly retained, as shown in the May 2012
concept plans. The proposed elimination of numerous uncontrolled left turn
opportunities and the on-street parking would reduce the potential hazards faced by
bicyclists on Main Street.

Transportation Technical Report Page 52 December 2012
Environmental Assessment
Gilbert Road Extension
FIGURE 14: BICYCLE RAMPS AT A
ROUNDABOUT (FHWA)
4.7.2 Build Alternative 2-Lane
Bicycle lanes on Main Street would be mostly retained, as shown in the May 2012
concept plans. The proposed elimination of numerous uncontrolled left turn
opportunities would reduce the potential hazards faced by bicyclists on Main Street.
4.7.3 Build Alternative (2-Lane Roundabouts)
Bicycle lanes would be mostly retained along the Main Street corridor, as shown in the
May 2012 concept plans. For safety reasons, the bicycle lanes should be dropped at
roundabout intersections. International
studies have shown that bicycle lanes
continuing through a roundabout expose
the rider to an increased risk of collisions
with vehicles that are turning right to exit
the roundabout.
At a roundabout, bicyclists may choose to
“take the lane” as they maneuver in the
circulatory travel lane through the
roundabout in the desired direction of
travel, as shown in Figure 13 from the
Washington State Department of
Transportation. Or the bicyclist may exit the
bicycle lane on a ramp ahead of the
roundabout and proceed to ride the
perimeter of the roundabout on the
sidewalk and cross side streets or Main
Street along with pedestrians on
crosswalks.
Design guidance from the Federal
Highway Administration (FHWA) for
modern roundabouts supports the
proposed design of roundabouts along
Main Street. FHWA recommends
terminating bicycle lanes well before the
entrance of the circulatory lane, so
FIGURE 13: BICYCLE ROUTE
THROUGH A ROUNDABOUT (WSDOT)

Transportation Technical Report Page 53 December 2012
Environmental Assessment
Gilbert Road Extension
bicyclists may merge into the stream of motor traffic or move to and from the sidewalk
on a ramp, similar to what is shown in Figure 14.
Further design of bicycle facilities for the Build Alternative (2-Lane Roundabouts) will be
considered in future design phases and coordinated and approved by the City of Mesa.
4.8 IMPACTS TO PEDESTRIAN FACILITIES
4.8.1 Impacts Common to Build Alternatives
Sidewalks along Main Street
Sidewalks would be retained along both sides of Main Street. The existing curb would
be relocated in some areas, and in these areas the sidewalk would be reconstructed
behind the curb. Sidewalk reconstruction would conform to current ADA standards.
At the proposed park and ride location west of Gilbert Road, sidewalks along Main
Street would cross the access to the PNR lot. The access road into the park and ride
would be designed as a signalized intersection with full curb returns and pedestrian
signals.
Section 3.16 of the EA, Safety and Security, discusses schools near the study area and
students as pedestrians. The EA reports that to minimize the accident potential for
children crossing Main Street and the LRT tracks, Valley Metro will conduct a safety
education program for elementary and junior high school students. The program would
be similar to that carried out prior to operation of the current 20-mile LRT starter line.
4.8.2 2031 Build Alternatives (4-Lane) and (2-Lane)
Crosswalks would be maintained at all signalized intersections on Main Street. Specific
changes proposed through this alternative would be as follows:
Miller: Crosswalks would be added at this new signalized intersection
East of Stapley: New signalized mid-block crosswalk would provide pedestrian
access across Main Street and to the east entry to the center platform station
North Lazona: Crosswalk would be added on east leg of the signalized intersection
North Harris: Crosswalks would be added at this new signalized intersection
South Williams: Crosswalk would be added on the east leg of the signalized
intersection
Gilbert Road Station PNR Access: Crosswalks would be added to this new
signalized intersection on Main St. that would also provide access to the center
platform station.

Transportation Technical Report Page 54 December 2012
Environmental Assessment
Gilbert Road Extension
FIGURE 15: TYPICAL ROUNDABOUT DESIGN, MAY 2012 CONCEPT PLAN
4.8.3 2031 Build Alternative (2-Lane Roundabouts)
Pedestrian crossings at roundabout intersections on Main Street will be designed
differently than in traditional signalized intersections, due to the presence of the light rail
alignment. Crosswalks at signalized intersections are situated close to the intersection
to allow for greater pedestrian visibility to motorists and to provide a shortest, direct
route for pedestrians. At a roundabout, traffic typically does not stop while yielding to
vehicles to the left and already in the roundabout. Modern roundabout design includes
splitter or “deflection” islands ahead of the point where vehicles enter the roundabout.
Crosswalks across Main Street at roundabouts would be signalized and set back from
the roundabout and would be signalized to ensure protected crossings in coordination
with LRT operations.
Special consideration should be given to the design of sidewalks and curb ramps at
roundabouts due to the potential shared use of these facilities by bicyclists and
pedestrians, as discussed in section 4.7.3
The proposed location of signalized crosswalks at roundabouts would require a
significant “out-of-direction” path of 150-200 feet for pedestrians intending to cross Main
Street east or west of the roundabout, as shown in Figure 15. This would occur at the
proposed roundabouts at Horne, Miller, N. Lazona Dr. N. Harris and S. Williams. Further
design concepts should be evaluated that locate the crosswalks closer to the
intersection/roundabout to minimize north-south pedestrian walk-time.

Transportation Technical Report Page 55 December 2012
Environmental Assessment
Gilbert Road Extension
In addition, the following crosswalk new locations will be provided:
East of Stapley: New signalized mid-block crosswalk would provide pedestrian
access across Main Street and to the west entry to the center-platform station.
S. Lazona: New signalized pedestrian crossing would be added on west leg of the
intersection (unsignalized for vehicle traffic). It would provide pedestrian access
across Main Street and to the east entry to the center-platform station.
Gilbert Road Station PNR Access: Crosswalks would be added to this new
signalized intersection on Main Street which would also provide access to the center
platform station.
4.9 IMPACTS TO FREIGHT MOBILITY
There are no designated arterial truck routes within the City of Mesa. However, the
arterial system, typified within the Gilbert Road Extension study area by Main Street,
Broadway Road to the south, University Drive to the north, and the intersecting streets
of Stapley Drive and Gilbert Road accommodates truck traffic related to commercial
freight hauling to, from, through and within Mesa. In terms of freight mobility, Main
Street in this section of Mesa has little regional significance. However, for the pick-up
and delivery of goods to the businesses along Main Street and the adjacent
neighborhoods, Main Street plays a more important role.
Truck deliveries to businesses along Main Street may be impacted by light rail due to
the loss of some of the on-street loading opportunities afforded by the on-street parking
spaces and through the elimination of many left-turn access points and U-turning
opportunities. Neither of these types on impacts is considered to be significant. Truck
deliveries could be made from off-street locations within proprietary or shared parking
lots, delivery areas from alleys behind buildings fronting Main Street and/or loading
docks. Regarding left turn access and U-turn movements, these are not considered
significant impacts as typically trucks can change their routes so that these movements
can be avoided.
4.10 IMPACTS TO EMERGENCY SERVICES AND VEHICLES ACCESS
The introduction of light rail to the Main Street corridor may potentially affect how
emergency service providers respond to calls within or near the study area. Generally
several conditions may affect emergency response, as described below:
Reduced left-turn access due to light rail guideway for all the 2031 Build
Alternatives. This can be alleviated by coordinating with Fire, Life, Safety agencies
and providing revised routes and emergency access plans;

Transportation Technical Report Page 56 December 2012
Environmental Assessment
Gilbert Road Extension
Improved opticom traffic control due to additional signalized intersections where the
traffic control system would provide intersection priority to emergency vehicles;
Reduced response time due to increased peak hour congestion on Main Street in
the 2031 Build Alternative (2-Lane) and (2-Lane Roundabouts). Again coordination
with affected agencies will need to occur in future design phases.
4.10.1 Medical Facilities
There are no hospitals or emergency medical clinics along Main Street within the study
area. In the vicinity are the following medical facilities:
Mesa Family Medical Center: University Drive east of Stapley Road
SouthWest Ambulance 1705 University Drive (west of Gilbert Road)
East Valley Vaccination and Examination Center (Evvax): 110 S Mesa Drive (south
of 1st Avenue)
Rural/Metro: 222 E. Main Street (west of Mesa Drive)
4.10.2 Law Enforcement
Mesa Police Department headquarters is in Downtown Mesa at 130 N. Robson. This
location is west of the study area. Two patrol divisions serve the study area. The Central
Patrol Division is located at headquarters, and the Red Mountain Patrol Division
Substation is located on University Drive at Greenfield.
4.10.3 Fire Protection
Mesa Fire Department headquarters is in Downtown Mesa at 13 W. 1st Street. This
location is west of the study area. None of the neighborhood fire stations are located
within the study area - they are located as follows:
Station 201: 360 E. 1st Street
Station 202: 830 S. Stapley Drive
Station 206: 815 N. Lindsay Road
Station 210: 1502 S. 24th Street
There would be no impacts to these facilities in any of the 2031 Build Alternatives.

Transportation Technical Report Page 57 December 2012
Environmental Assessment
Gilbert Road Extension
5.0 IMPACTS ANTICIPATED DURING CONSTRUCTION -
MAINTENANCE OF TRAFFIC
The construction of the Gilbert Road Extension (GRE) project will include a number of
elements including utility relocations, roadway improvements, and track and station
construction. These construction elements are temporary and once completed, roadway
and access will be restored to normal conditions and operations.
Projects such as the GRE are typically divided into various construction segments.
Segmenting the project, in an orderly manner, allows for efficient and cost effective
construction. These various construction segments are typically:
Advance utility relocations
Demolition and earthwork
Track installation
Roadway and sidewalk construction
Station and park and ride construction
Systems installation, including substations and signal control facilities
Safety certification and testing
Commissioning
The sequence of construction for the GRE will be developed during the project
development phases along with a set of plans and specifications for individual contracts,
construction schedules and durations.
These construction elements will impact and create disruptions to auto, bus, pedestrian
and bicycle operations, as well as access to residences and businesses along the
corridor. Maintenance of traffic facilities (auto, bus, pedestrian and bicycles) will require
a traffic control plan to be developed during the project development phase and will be
developed in accordance with City of Mesa and Federal guidelines to minimize impacts
to traffic and maintain access to residences, businesses, community facilities and
services, including emergency services, and local streets. The traffic control general
plan will include measures to:
Maintain a minimum of one traffic lane in each direction along Main Street and
intersecting streets where construction activities are required. There may be
short duration (weekend) full closures for construction of trackwork at
intersections. Evaluation of such full closures versus longer construction in

Transportation Technical Report Page 58 December 2012
Environmental Assessment
Gilbert Road Extension
stages at each intersection would be evaluated during the project development
phases.
Maintain transit operations in each direction along Main Street and all cross
streets. During project development, Valley Metro and their design staff will
coordinate transit operations for any temporary reroutes and bus stop relocations
that may be required during construction.
Impacts to residential and business access will occur. Community outreach and
access management planning will be required during the project development
phases.
Impacts to public services, such as garbage, utility and emergency services may
be affected during construction. Coordination with the appropriate City agency
and development of an access management plan will be required during the
project development phases.
Temporary closure of sidewalks and crosswalks is possible. Detours will be
established to safely guide pedestrians until the sidewalks and crosswalks are
restored per Americans with Disabilities Act (ADA) accessibility guidelines.
Temporary closure of bicycle lanes may be required. Detours will be established
to safely guide bicyclists on detoured route. Proper wayfinding signs and
pavement markings will be used to guide bicyclists through detours/temporary
routes.