Embed Size (px)
Citation preview
GILA RIVER INDIAN COMMUNITY DEPARTMENT OF ENVIRONMENTAL QUALITY
Post Office Box 97 • Sacaton, Arizona 85147 • (520) 562-2234 • FAX: (520) 562-2245
June 30, 2017
Sent via email to: [email protected]
Michael Flagg USEPA R9 Air Division 75 Hawthorne St. San Francisco, CA 94105 Re: 2016 GRIC Air Monitoring Network Review document Gila River Indian Community
Dear Mr. Flagg:
The Gila River Indian Community (GRIC) Department of Environmental Quality (DEQ) has developed an Ambient Air Monitoring Network Review document for the year 2016. GRIC DEQ presented the document to the members of the Gila River Indian Community through a public meeting.
The 2016 Ambient Air Monitoring Network Review is attached for your review and approval of the requested recommendations within the document.
Thank you. If you have any questions please contact me at [email protected] or (520) 796-3782.
Sincerely,
Leroy Williams, Environmental Engineer, GRIC DEQ Air Quality Program
cc w/ attachment: Dale Ohnmeiss, GRIC DEQ Ryan Eberle, GRIC DEQ AQ Program Randall Chang, USEPA R9

Gila River Indian Community 2016 AMBIENT AIR MONITORING
NETWORK REVIEW
Gila River Indian Community Department of Environmental Quality Air Quality Air Monitoring Program
GRIC San Tan Mountains to the north, 2016

2016 GRIC Network Review ii June 2017
June 2017
Table of Contents
Definition of Terms ....................................................................................................................... 1
1 Introduction ........................................................................................................................... 4
2 Air Monitoring Network Design .......................................................................................... 6
2.1 Monitoring Objectives .................................................................................................................. 6
2.2 Spatial Scales ................................................................................................................................ 6
3 Gila River Indian Community Ambient Air Monitoring Network .................................. 8
3.1 General .......................................................................................................................................... 8
3.2 Ozone Monitoring Network ........................................................................................................ 10 3.2.1 Background ............................................................................................................................................ 10 3.2.2 2016 Monitoring Results Summary ....................................................................................................... 11
3.3 PM10 Particulate Monitoring Network ....................................................................................... 12 3.3.1 Background ............................................................................................................................................ 12 3.3.2 2016 Monitoring Results Summary ....................................................................................................... 13
3.4 Meteorological Network ............................................................................................................. 14
3.5 Changes to the Network in 2016 ................................................................................................. 14
3.6 Proposed Network Changes and Improvements ......................................................................... 14
4 Compliance Discussion ....................................................................................................... 16
4.1 Minimum Monitoring Requirements .......................................................................................... 16
4.2 Data Submission Requirements .................................................................................................. 18
4.3 Air Quality Data .......................................................................................................................... 18
4.4 Audits .......................................................................................................................................... 18
5 Public Notice ........................................................................................................................ 20
5.1 News Release .............................................................................................................................. 20
5.2 Public Meeting ............................................................................................................................ 20
Figures Figure 3-1: Map of Ambient Air Monitoring Stations on Gila River Indian Community ..............8
Tables Table 2-1. Relationship Among Monitoring Site Types And Scales Of Representativeness. ....... 7
Table 3-1. GRIC Ambient Air Monitoring Sites for 2016............................................................. 9
Table 3-2. Ambient Air Quality Parameters Monitored at Each Station ....................................... 9

2016 GRIC Network Review iii June 2017
Table 3-3. National Ambient Air Quality Standards Monitored for Pollutants by GRIC ........... 10
Table 3-4. Site Types for Each Monitoring Station ..................................................................... 10
Table 3-5. 2016 8-Hour Average Ozone Summary ..................................................................... 12
Table 3-6. Three-Year Average of 4th Highest 8-Hour Ozone .................................................... 12
Table 3-7. 2016 24-Hour Average PM10 Summary .................................................................... 14
Table 4-1. Ozone Monitoring Requirements for SLAMS (Number of Stations per MSA) ........ 16
Table 4-2. PM10 Monitoring Requirements for SLAMS (Number of Stations per MSA) ......... 16
Table 4-3. Minimum Monitoring Requirements for GRIC Ozone Monitors, 2014-2016 ........... 17
Table 4-4. Minimum Monitoring Requirements for GRIC PM10 Monitors, 2014-2016 ............ 17
Table 4-5. Sources of Ambient Air Quality Data ........................................................................ 18
Table 4-6. Performance Audit Dates for GRIC Ozone Monitors ................................................ 19
Table 4-7. Semi-Annual Flow Rate Audit Dates for GRIC Continuous TEOM PM10 Monitor 19
Table 5-1. Summary of Comments and Questions Received at Public Meetings in 2017 .......... 21
Appendices A 2016 Air Monitoring Data by Site
B EPA-Required Site Metadata
C Public Notice and Comment Information

2016 GRIC Network Review 1 June 2017
DEFINITION OF TERMS
AQMP: Air Quality Management Plan. The AQMP is a collection of tribal regulations and plans to achieve healthy air quality under the Clean Air Act. For GRIC, the AQMP is synonymous with the Tribal Implementation Plan (TIP).
AQP: Air Quality Program within the Gila River Indian Community’s Department of Environmental Quality.
AQS: Environmental Protection Agency’s Air Quality System
Attainment: This refers to the NAAQS used to comply with the federal Clean Air Act. After several years of no violations of the NAAQS, the EPA can classify the area as in attainment for that pollutant.
CFR: Code of Federal Regulations.
Community: Gila River Indian Community Continuous monitoring: A method of monitoring air pollutants that is continually measuring
the quantity of the pollutant, either gaseous or particulate. Continuous monitors can be used to obtain real-time or short-term averages of pollutants.
Criteria Pollutants: Six pollutants (Carbon Monoxide, Lead, Nitrogen Dioxide, Ozone, Particulates, and Sulfur Dioxide) that have NAAQS established by the US EPA.
DEQ: Gila River Indian Community’s Department of Environmental Quality
Design Value: A design value is a statistic that describes the air quality status of a given area relative to the level of the NAAQS. For a concentration-based standard, the air quality design value is simply the standard-related test statistic. The design value of a pollutant monitoring network is the highest sample value in the network used to compare to the NAAQS; e.g. the 8-hour ozone design value for the network is the monitor with the highest 3-year average of the 4th highest concentrations each year.
EPA: U. S. Environmental Protection Agency.
Exceptional Events: An uncontrollable event caused by natural sources of pollution or an event that is not expected to recur at a given location. The AQP makes the determination of which events to classify as exceptional and those events are then flagged in the AQS. If the EPA concurs with the AQP’s determination, the measured pollution event will not be used in determination of compliance with the NAAQS.
FEM: Federal Equivalency Method. An official method, i.e. equipment

2016 GRIC Network Review 2 June 2017
and procedure, of monitoring air pollution that has been determined to produce results similar to the Federal Reference Method (FRM).
Filter-based Monitor: A method of monitoring particulate pollution that involves exposing a pre- weighed filter to a specific flow volume of air to capture the particulates in the air. The filters are then post-weighed to determine the weight of particulates per volume, e.g. µg/m3. Filter-based monitors used by GRIC are all FRM monitors.
FRM: Federal Reference Method. An official method (i.e. equipment and procedure) of monitoring air pollution that has been tested and determined to produce results that accurately measure air pollution with acceptable precision. These methods are the baseline that all other methods (i.e., FEMs) refer to.
GRIC: Gila River Indian Community
µg/m3: Microgram per cubic meter. MSA: Metropolitan Statistical Area. A geographical area designated by
the federal government based on the concept of a core area with a large population nucleus, plus adjacent communities having a high degree of economic and social integration with that core. It is unclear in Appendix D 40 CFR 58 how MSAs apply to sovereign tribes. Although the areas within the Community are geographically part of the Phoenix-Mesa-Scottsdale MSA, for purposes of the administration of Section 107 of the Clean Air Act (42 U.S.C. § 7407), except where a specific designation has been otherwise made by the Administrator, the air quality control region for the Community is all land within the exterior boundaries of the Community. Therefore, for the purposes of this document, the MSA principle does not apply to the GRIC Air Monitoring Network.
NAAQS: National Ambient Air Quality Standards. A health and welfare-based standard that is set by the US EPA to qualify allowable levels of criteria pollutants.
NO2: Nitrogen dioxide.
NOX: Nitrogen oxides. Sum of nitric oxide (NO), NO2, and other nitrogen-containing compounds.
PM: Particulate matter. Material suspended in the air in the form of minute solid particles or liquid droplets.
PM10: Particulate matter of 10 microns in diameter or smaller.
NPAP-TTP: National Performance Audit Program – Through the Probe
POC: Parameter Occurrence Code is an identification number distinguishing multiple instruments that may measure the same pollutant.
PPM: Parts per million.

2016 GRIC Network Review 3 June 2017
Primary Standard: One portion of the NAAQS. These standards are designed to protect the public health.
Secondary Standard: One portion of the NAAQS. These standards are designed to protect the environment.
SIP: State Implementation Plan. SIPs are a collection of state and local regulations and plans to achieve healthy air quality under the Clean Air Act.
SLAMS: State and Local Air Monitoring Station. The SLAMS consist of a network of approximately 5,000 monitoring stations nationwide whose size and distribution is largely determined by the needs of State, and local air pollution control agencies to meet their respective SIP requirements. The GRIC monitors operated by the AQP are not part of the SLAMS network, but the AQP operates the monitors in accordance with the requirements for SLAMS.
TEOM: Tapered Element Oscillating Microbalance. A continuous particulate measuring instrument used by the AQP to measure PM10.
TIP: Tribal Implementation Plan. The TIP is a collection of tribal regulations and plans to achieve healthy air quality under the Clean Air Act. For GRIC, the TIP is incorporated into and synonymous with the Air Quality Management Plan (AQMP).
VOC: Volatile organic compounds. VOCs are chemical compounds that can easily vaporize and enter the atmosphere. There are many natural and artificial sources of VOCs; solvents and gasoline make up some of the largest artificial sources. VOCs will react with NOx
in the presence of sunlight to create ground-level ozone pollution.
2016 GRIC Network Review 4 June 2017
1 INTRODUCTION
The Code of Federal Regulations (CFR) Title 40 Part 58.10 (40 CFR 58.10) requires an annual monitoring network plan to summarize the air quality surveillance system consisting of State and Local Air Monitoring Stations (SLAMS) and Special Purpose Monitors (SPM) operated under state and local authorities. The annual monitoring network plan must identify the purpose of each monitor and provide evidence that both the siting and the operation of each monitor meet the requirements in 40 CFR Part 58 appendices A, C, D, and E below:
• Appendix A Quality Assurance Requirements for SLAMS, SPMs, and PSD (Prevention of Significant Deterioration) Air Monitoring
• Appendix C Ambient Air Quality Monitoring Methodology
• Appendix D Network Design Criteria for Ambient Air Quality Monitoring
• Appendix E Probe and Monitoring Path Siting Criteria for Ambient Air Quality Monitoring
The Gila River Indian Community (GRIC or Community) Department of Environmental Quality (DEQ) Air Quality Program (AQP) operates air quality monitors that record ambient concentrations of two criteria pollutants - particulate matter less than or equal to 10 microns (PM10) and ozone (O3). Criteria pollutants are those that the United States Environmental Protection Agency (EPA) has defined as a potential risk to health, and correspondingly defined a National Ambient Air Quality Standard (NAAQS). The NAAQS are intended to protect public health and welfare by setting limits on the allowable level of each pollutant in the ambient air. The other criteria pollutants with established NAAQS that are not monitored by the AQP are particulate matter less than or equal to 2.5 microns (PM2.5), carbon monoxide (CO), sulfur dioxide (SO2), nitrogen dioxide (NO2), and lead (Pb). GRIC does not monitor for these pollutants because they have been found, through discrete sampling and emission inventory, to be at background ambient air quality concentrations. Additionally, GRIC does not have major stationary pollution sources that emit these particular criteria pollutants that may affect the NAAQS within GRIC jurisdictions.
The GRIC air quality monitors are Tribal Monitors and are most closely related to SLAMS monitors. The United States Environmental Protection Agency (EPA) works closely with GRIC to adhere to the requirements for SLAMS networks with appropriate flexibility as stated in the Tribal Authority Rule (TAR).
The purpose of this document is to fulfill the requirements of 40 CFR 58.10, and has been prepared in accordance with Annual Monitoring Network Plan checklists and guidance documents provided by USEPA. Therefore, this document contains the following sections:
• Air Monitoring Network Design – Describes the design requirements for an air monitoring network in accordance with Appendix D of 40 CFR 58.
• GRIC Air Monitoring Network – Describes the air monitoring network for the Community including monitor types, background information, summary of 2016 monitoring results, changes to the monitoring network in 2016, and proposed changes to
2016 GRIC Network Review 5 June 2017
the monitoring network.
• Compliance Discussion – Includes a discussion of compliance with 40 CFR 58, including a table of requirements for Network Review, minimum monitoring requirements, precision and accuracy certifications, data submittals, and audits.
• Public Notice – Includes information on public notices and community outreach for review and presentation of this document.
• Appendices – Contains the detailed monitoring site information and photographs, and a copy of the presentation that was prepared for the District meetings.

2016 GRIC Network Review 6 June 2017
2 AIR MONITORING NETWORK DESIGN
2.1 Monitoring Objectives
Appendix D of 40 CFR 58 states that monitoring networks must be designed to meet three basic monitoring objectives:
1. Provide air pollution data to the general public in a timely manner;
2. Support compliance with ambient air quality standards and emissions strategy development; and
3. Support air pollution research studies.
Furthermore, Appendix D states that in order to support air quality management work indicated in the three basic objectives above, monitoring networks must be designed with a variety of the following types of monitoring sites:
• Highest Concentration – Sites to determine the highest concentration expected to occur in the area covered by the network;
• Population Exposure – Sites to determine representative concentrations in areas of high population density;
• Source Impacts – Sites to determine the impact on ambient pollution levels of significant sources or source categories;
• Background Concentrations – Sites to determine general background concentration levels;
• Regional Transport – Sites to determine the extent of regional pollutant transport among populated areas, and in support of secondary standards; and
• Welfare Impacts – Sites to determine the welfare-related impacts in more rural and remote areas (such as visibility impairment and effects on vegetation).
2.2 Spatial Scales
The goal in designing a monitoring network is to establish monitoring stations that will provide data to meet the above monitoring objectives. The physical siting of the air monitoring station must achieve a spatial scale of representativeness that is consistent with the monitoring site type, air pollutant to be measured, and the monitoring objective. The spatial scale results from the physical location of the site with respect to the pollutant sources and categories by estimating the size of the area surrounding the monitoring site that experiences uniform pollutant concentrations. The categories of spatial scale are:
• Micro Scale - An area of uniform pollutant concentrations ranging from several meters up to 100 meters.
• Middle Scale – Uniform pollutant concentrations in an area of about 110 meters to 0.5 kilometer.

2016 GRIC Network Review 7 June 2017
• Neighborhood Scale – An area with dimensions in the 0.5 to 4 kilometer range.
• Urban Scale – Citywide pollutant conditions with dimensions of from 4 to 50 kilometers.
• Regional Scale – An entire rural area of the same general geography (that ranges from tens to hundreds of kilometers).
The appropriate spatial scale for each of the monitoring site types is shown in Table 2-1.
Table 2-1. Relationship Among Monitoring Site Types And Scales Of Representativeness.
Monitoring Objective
Appropriate Spatial Scale
Micro Middle Neighborhood Urban Regional
Highest concentration X X X X
Population Exposure X X
Source Impacts X X X
Background Concentrations X X X
Regional Transport X X
Welfare Impacts X X
2016 GRIC Network Review 8 June 2017
3 GILA RIVER INDIAN COMMUNITY AMBIENT AIR MONITORING NETWORK
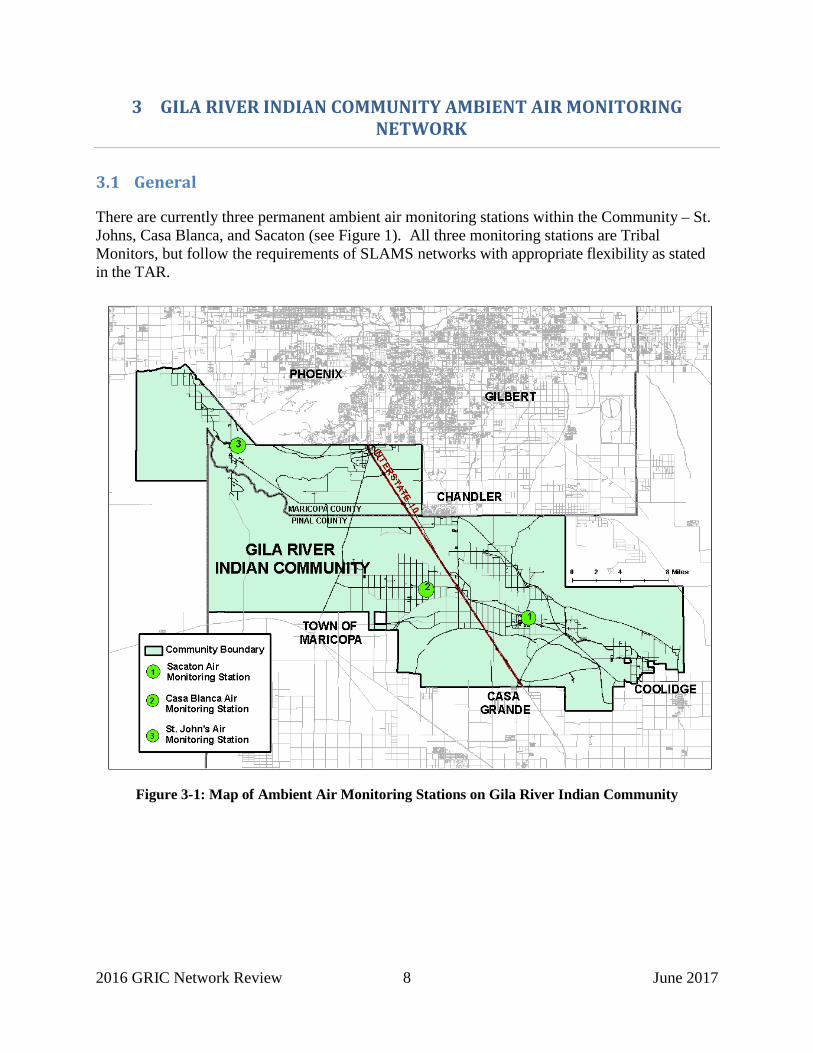
3.1 General
There are currently three permanent ambient air monitoring stations within the Community – St. Johns, Casa Blanca, and Sacaton (see Figure 1). All three monitoring stations are Tribal Monitors, but follow the requirements of SLAMS networks with appropriate flexibility as stated in the TAR.
Figure 3-1: Map of Ambient Air Monitoring Stations on Gila River Indian Community
2016 GRIC Network Review 9 June 2017
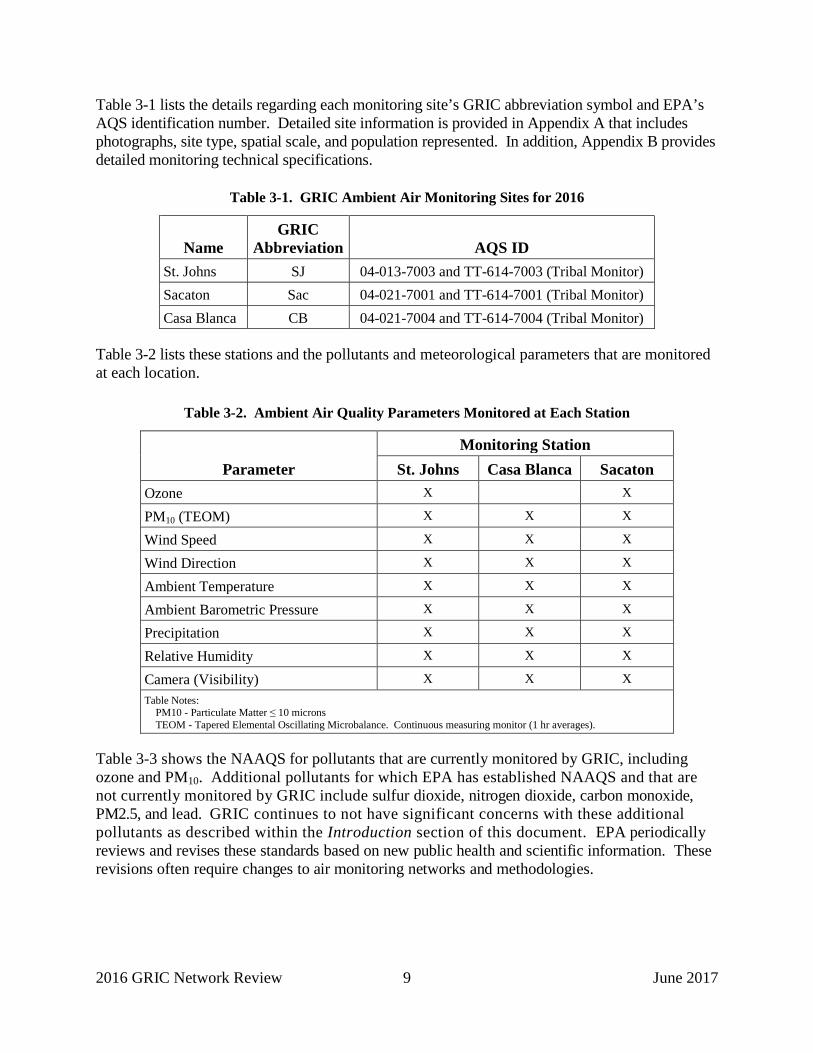
Table 3-1 lists the details regarding each monitoring site’s GRIC abbreviation symbol and EPA’s AQS identification number. Detailed site information is provided in Appendix A that includes photographs, site type, spatial scale, and population represented. In addition, Appendix B provides detailed monitoring technical specifications.
Table 3-1. GRIC Ambient Air Monitoring Sites for 2016
Name GRIC
Abbreviation AQS ID St. Johns SJ 04-013-7003 and TT-614-7003 (Tribal Monitor) Sacaton Sac 04-021-7001 and TT-614-7001 (Tribal Monitor) Casa Blanca CB 04-021-7004 and TT-614-7004 (Tribal Monitor)
Table 3-2 lists these stations and the pollutants and meteorological parameters that are monitored at each location.
Table 3-2. Ambient Air Quality Parameters Monitored at Each Station
Parameter Monitoring Station
St. Johns Casa Blanca Sacaton Ozone X X
PM10 (TEOM) X X X
Wind Speed X X X
Wind Direction X X X
Ambient Temperature X X X
Ambient Barometric Pressure X X X
Precipitation X X X
Relative Humidity X X X
Camera (Visibility) X X X Table Notes:
PM10 - Particulate Matter ≤ 10 microns TEOM - Tapered Elemental Oscillating Microbalance. Continuous measuring monitor (1 hr averages).
Table 3-3 shows the NAAQS for pollutants that are currently monitored by GRIC, including ozone and PM10. Additional pollutants for which EPA has established NAAQS and that are not currently monitored by GRIC include sulfur dioxide, nitrogen dioxide, carbon monoxide, PM2.5, and lead. GRIC continues to not have significant concerns with these additional pollutants as described within the Introduction section of this document. EPA periodically reviews and revises these standards based on new public health and scientific information. These revisions often require changes to air monitoring networks and methodologies.

2016 GRIC Network Review 10 June 2017
Table 3-3. National Ambient Air Quality Standards Monitored for Pollutants by GRIC
Pollutant Primary/ Secondary
Averaging Time
Level Form
Ozone primary and secondary
8-hour 0.070 PPM * Annual fourth-highest daily maximum 8-hr concentration, averaged over 3 years
PM10 primary and secondary
24-hour 150 µg/m3 Not to be exceeded more than once per year on average over 3 years
* October 1, 2015, the EPA promulgated revised primary and secondary eight-hour ozone NAAQS from 0.075 to 0.070 PPM.
The site types represented by each air quality monitor are shown in Table 3-4.
Table 3-4. Site Types for Each Monitoring Station
Site Type Ozone Particulate Matter ≤10 Microns (PM10)
St. Johns Sacaton St. Johns Casa Blanca Sacaton Highest Concentration X X Population Exposure X X X X X Source Impacts X Background Concentrations X X X X X
Regional Transport X X X X X Welfare Impacts
Detailed site information for each of the monitoring locations in presented in Appendix A.
3.2 Ozone Monitoring Network
Beginning in 2002, the Community started monitoring for ozone at two locations - one in Sacaton (District 3) and one in St Johns (District 6). In 2016, both ozone monitors were reported as operational in AQS. Before 2016, the GRIC ozone monitors were only operational during ozone season (April to October).
GRIC started monitoring ozone, at both GRIC sites, on an annual schedule beginning January 1, 2016. GRIC will monitor on an annual schedule throughout 2017 and a data review will be performed in June 2017 for seasonal monitoring reconsideration.
3.2.1 Background
The following subsections provide background information on the two ozone monitoring locations. Additional detailed information for each monitor is provided in Appendix B.

2016 GRIC Network Review 11 June 2017
3.2.1.1 Sacaton
Operated by the AQP since 2002, this site provides background and regional transport ozone monitoring on a regional scale. This site is located near the central GRIC government and business district of Sacaton, which includes four schools and a community hospital. It also provides a measurement of representative area ozone concentration for the community of Sacaton and surrounding areas. The monitor generally measures background levels of ozone during prevailing West or East winds. However, under the right wind conditions, the monitor can also detect ozone and ozone precursor transport from the Phoenix Metropolitan Area (PMA), north of the Community, in the form of elevated ozone readings. Measured concentrations at this site are often similar to those recorded at Pinal County’s Casa Grande monitor (approximately 9 miles south of Sacaton).
3.2.1.2 St. Johns
Initially operated by the AQP at Vee Quiva Casino (AQS ID 7002) in 2002 and then relocated 2 miles south to Gila Crossing Middle School (AQS ID 7003) in September 2004. This site is located in District 6 on the southwest side of the South Mountain Range near the City of Phoenix and provides background and regional transport ozone monitoring on a regional scale. Ozone concentrations at this site exhibit strong diurnal fluctuations caused by oxides of nitrogen (NOx) and volatile organic compounds (VOC) from nearby neighboring jurisdictions in the City of Phoenix. The monitor generally measures background levels of ozone during prevailing West or East winds. However, under the right wind conditions, the monitor can also detect ozone and ozone precursor transport from the PMA, north and east of the monitor location, in the form of elevated ozone readings.
3.2.2 2016 Monitoring Results Summary
The 1-hour average ozone standard was revoked by the EPA on June 15, 2005, and has been replaced by the 8-hour average standard for compliance purposes. On March 12, 2008, the EPA lowered the eight-hour ozone NAAQS from 0.080 to 0.075 ppm.
Then again on October 1, 2015, the EPA lowered the eight-hour ozone NAAQS from 0.075 to 0.070 ppm. Compliance with the standard is determined by averaging the 4th
highest eight-hour average over a three-year period. This three-year average must be less than or equal to 0.070 ppm.
There were no exceedances, at either GRIC site, of the 8-hour primary standard (NAAQS) ozone in 2016. Table 3-5 presents the four highest 8-hour average ozone readings for each monitor during the 2016 monitoring season (January – December).

2016 GRIC Network Review 12 June 2017
Table 3-5. 2016 8-Hour Average Ozone Summary
Site Max (PPM)
Date
2nd High (PPM) Date
3rd High (PPM) Date
4th High (PPM) Date
Number of Days >0.070
St Johns 0.068 0.067 0.065 0.065
0 5/3/2016 5/28/2016 5/27/2016 7/30/2016
Sacaton 0.069 0.068 0.067 0.066
0 7/20/2016 7/30/2016 7/21/2016 5/27/2016
In 2016, there were no violations of the 8-hour average NAAQS for ozone (the 8-hour average NAAQS for ozone is violated when the three-year average of the fourth highest values for each year is greater than 0.070 ppm). The fourth highest 8-hour average ozone reading for each of the past three years and the 3-year average is shown in Table 3-6.
Table 3-6. Three-Year Average of 4th Highest 8-Hour Ozone
Site 2014 4th High
(PPM) 2015 4th High
(PPM) 2016 4th High
(PPM) 3-Year Average of
4th High (PPM) St Johns 0.069 0.067 0.065 0.067
Sacaton 0.066 0.064 0.066 0.065
3.3 PM10 Particulate Monitoring Network
Beginning in 2002, the Community started monitoring for PM10 at one location (Casa Blanca) using a Federal Reference Method (FRM), filter-based, monitor operating on a 1-in-3 day schedule. In 2013, the Community began continuous monitoring methods for PM10 at all three monitoring stations (St. Johns, Casa Blanca, and Sacaton) using Federal Equivalent Method (FEM) Tapered Element Oscillating Microbalance (TEOM) monitors that provide hourly PM10 averages. In 2016, all three TEOM FEM monitors were reported as operational in AQS. There are no collocation requirements for EPA-approved PM10 FEM monitors.
3.3.1 Background
The following subsections provide background information on the three PM10 monitoring locations. Additional detailed information for each monitor is provided in Appendix B.
3.3.1.1 Casa Blanca
This site has been operated by the AQP since 2002. This monitoring site is a neighborhood scale and representative of particulate concentrations in District 5, Casa Blanca. The site consists of one TEOM monitor. Since there are no collocation requirements for EPA-approved PM10 FEM monitors, the two collocated FRM samplers (two identical monitors that sample separately) were discontinued on December 31, 2014.
2016 GRIC Network Review 13 June 2017
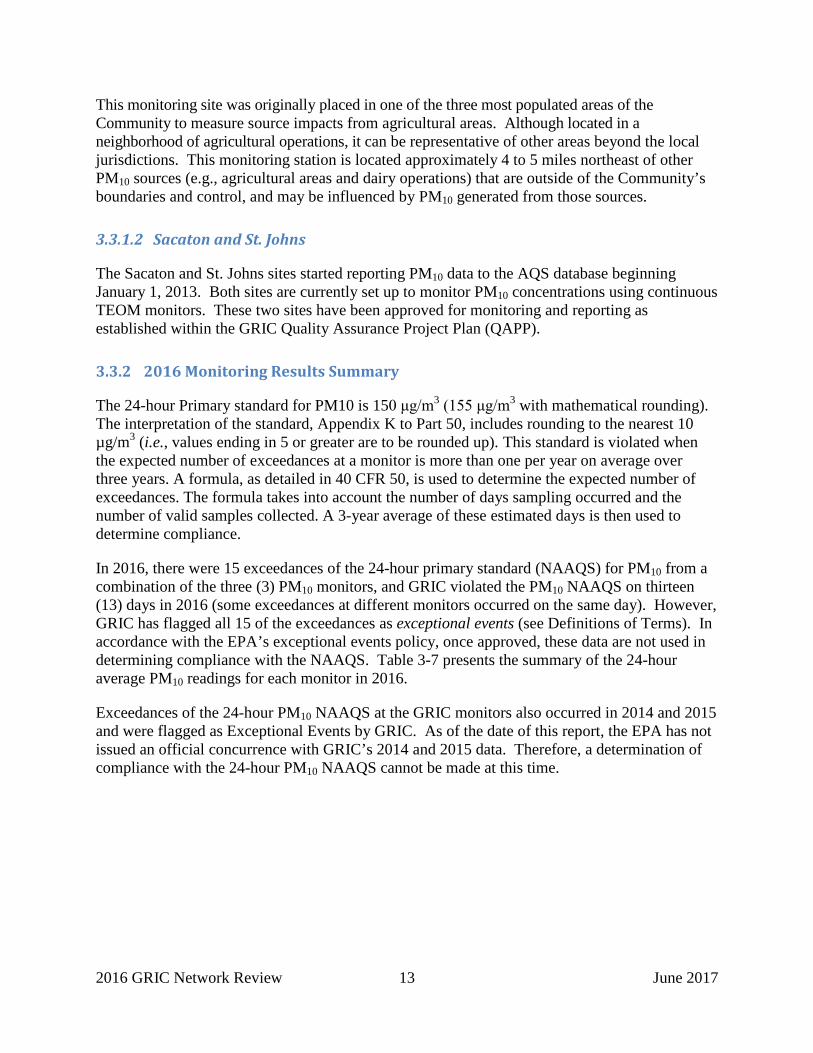
This monitoring site was originally placed in one of the three most populated areas of the Community to measure source impacts from agricultural areas. Although located in a neighborhood of agricultural operations, it can be representative of other areas beyond the local jurisdictions. This monitoring station is located approximately 4 to 5 miles northeast of other PM10 sources (e.g., agricultural areas and dairy operations) that are outside of the Community’s boundaries and control, and may be influenced by PM10 generated from those sources.
3.3.1.2 Sacaton and St. Johns
The Sacaton and St. Johns sites started reporting PM10 data to the AQS database beginning January 1, 2013. Both sites are currently set up to monitor PM10 concentrations using continuous TEOM monitors. These two sites have been approved for monitoring and reporting as established within the GRIC Quality Assurance Project Plan (QAPP).
3.3.2 2016 Monitoring Results Summary
The 24-hour Primary standard for PM10 is 150 μg/m3 (155 μg/m3 with mathematical rounding). The interpretation of the standard, Appendix K to Part 50, includes rounding to the nearest 10 µg/m3 (i.e., values ending in 5 or greater are to be rounded up). This standard is violated when the expected number of exceedances at a monitor is more than one per year on average over three years. A formula, as detailed in 40 CFR 50, is used to determine the expected number of exceedances. The formula takes into account the number of days sampling occurred and the number of valid samples collected. A 3-year average of these estimated days is then used to determine compliance.
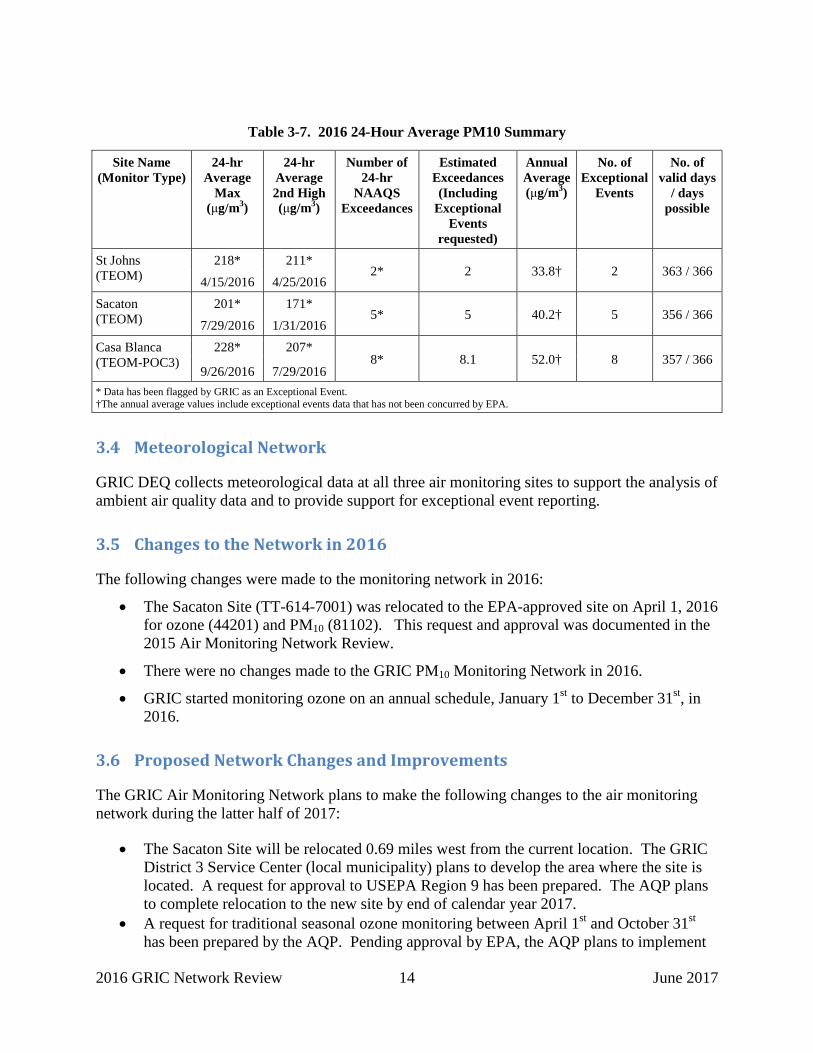
In 2016, there were 15 exceedances of the 24-hour primary standard (NAAQS) for PM10 from a combination of the three (3) PM10 monitors, and GRIC violated the PM10 NAAQS on thirteen (13) days in 2016 (some exceedances at different monitors occurred on the same day). However, GRIC has flagged all 15 of the exceedances as exceptional events (see Definitions of Terms). In accordance with the EPA’s exceptional events policy, once approved, these data are not used in determining compliance with the NAAQS. Table 3-7 presents the summary of the 24-hour average PM10 readings for each monitor in 2016.
Exceedances of the 24-hour PM10 NAAQS at the GRIC monitors also occurred in 2014 and 2015 and were flagged as Exceptional Events by GRIC. As of the date of this report, the EPA has not issued an official concurrence with GRIC’s 2014 and 2015 data. Therefore, a determination of compliance with the 24-hour PM10 NAAQS cannot be made at this time.
2016 GRIC Network Review 14 June 2017
3.4 Meteorological Network
GRIC DEQ collects meteorological data at all three air monitoring sites to support the analysis of ambient air quality data and to provide support for exceptional event reporting.
3.5 Changes to the Network in 2016
The following changes were made to the monitoring network in 2016:
• The Sacaton Site (TT-614-7001) was relocated to the EPA-approved site on April 1, 2016 for ozone (44201) and PM10 (81102). This request and approval was documented in the 2015 Air Monitoring Network Review.
• There were no changes made to the GRIC PM10 Monitoring Network in 2016.
• GRIC started monitoring ozone on an annual schedule, January 1st to December 31st, in 2016.
3.6 Proposed Network Changes and Improvements
The GRIC Air Monitoring Network plans to make the following changes to the air monitoring network during the latter half of 2017:
• The Sacaton Site will be relocated 0.69 miles west from the current location. The GRIC District 3 Service Center (local municipality) plans to develop the area where the site is located. A request for approval to USEPA Region 9 has been prepared. The AQP plans to complete relocation to the new site by end of calendar year 2017.
• A request for traditional seasonal ozone monitoring between April 1st and October 31st has been prepared by the AQP. Pending approval by EPA, the AQP plans to implement
Table 3-7. 2016 24-Hour Average PM10 Summary
Site Name (Monitor Type)
24-hr Average
Max (μg/m3)
24-hr Average 2nd High (μg/m3)
Number of 24-hr
NAAQS Exceedances
Estimated Exceedances (Including
Exceptional Events
requested)
Annual Average (μg/m3)
No. of Exceptional
Events
No. of valid days
/ days possible
St Johns (TEOM)
218* 211* 2* 2 33.8† 2 363 / 366
4/15/2016 4/25/2016 Sacaton (TEOM)
201* 171* 5* 5 40.2† 5 356 / 366
7/29/2016 1/31/2016 Casa Blanca (TEOM-POC3)
228* 207* 8* 8.1 52.0† 8 357 / 366
9/26/2016 7/29/2016 * Data has been flagged by GRIC as an Exceptional Event. †The annual average values include exceptional events data that has not been concurred by EPA.

2016 GRIC Network Review 15 June 2017
the traditional seasonal ozone monitoring in 2018 (April 1, 2018 through October 31, 2018). GRIC DEQ Air Monitoring Network will complete the 2017 annual monitoring schedule by December 31, 2017.
2016 GRIC Network Review 16 June 2017
4 COMPLIANCE DISCUSSION
In accordance with 40 CFR 58.10(a)(1), the following sections provide information on compliance with the requirements of Appendices A, C, D, and E of 40 CFR 58. A cross-reference of the requirements of Appendices A, C, D, and E of 40 CFR 58 and the section(s) of this report that address those requirements is included in tables provided in Appendix B of this document for all three GRIC air monitoring sites.
4.1 Minimum Monitoring Requirements
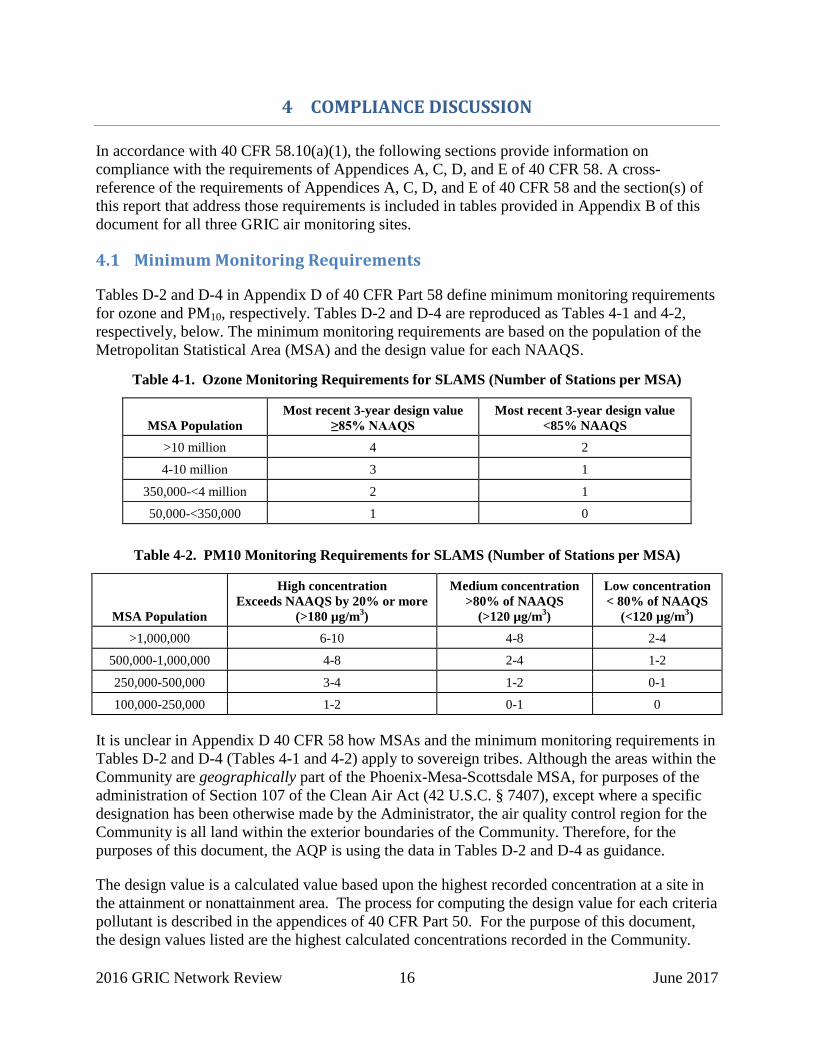
Tables D-2 and D-4 in Appendix D of 40 CFR Part 58 define minimum monitoring requirements for ozone and PM10, respectively. Tables D-2 and D-4 are reproduced as Tables 4-1 and 4-2, respectively, below. The minimum monitoring requirements are based on the population of the Metropolitan Statistical Area (MSA) and the design value for each NAAQS.
Table 4-1. Ozone Monitoring Requirements for SLAMS (Number of Stations per MSA)
MSA Population Most recent 3-year design value
≥85% NAAQS Most recent 3-year design value
<85% NAAQS >10 million 4 2
4-10 million 3 1
350,000-<4 million 2 1
50,000-<350,000 1 0
Table 4-2. PM10 Monitoring Requirements for SLAMS (Number of Stations per MSA)
MSA Population
High concentration Exceeds NAAQS by 20% or more
(>180 µg/m3)
Medium concentration >80% of NAAQS
(>120 µg/m3)
Low concentration < 80% of NAAQS
(<120 µg/m3) >1,000,000 6-10 4-8 2-4
500,000-1,000,000 4-8 2-4 1-2
250,000-500,000 3-4 1-2 0-1
100,000-250,000 1-2 0-1 0
It is unclear in Appendix D 40 CFR 58 how MSAs and the minimum monitoring requirements in Tables D-2 and D-4 (Tables 4-1 and 4-2) apply to sovereign tribes. Although the areas within the Community are geographically part of the Phoenix-Mesa-Scottsdale MSA, for purposes of the administration of Section 107 of the Clean Air Act (42 U.S.C. § 7407), except where a specific designation has been otherwise made by the Administrator, the air quality control region for the Community is all land within the exterior boundaries of the Community. Therefore, for the purposes of this document, the AQP is using the data in Tables D-2 and D-4 as guidance.
The design value is a calculated value based upon the highest recorded concentration at a site in the attainment or nonattainment area. The process for computing the design value for each criteria pollutant is described in the appendices of 40 CFR Part 50. For the purpose of this document, the design values listed are the highest calculated concentrations recorded in the Community.

2016 GRIC Network Review 17 June 2017
The minimum monitoring requirements of 40 CFR 58 Appendix D for the ozone and PM10 monitors within the Community are presented in Tables 4-3 and 4-4, respectively. The GRIC Air Quality Management Plan (AQMP) does not require a minimum number of monitors for the Community.
Table 4-3. Minimum Monitoring Requirements1 for GRIC Ozone Monitors, 2014-2016
MSA Monitor Site:
County
Population2 (GRIC
Census 2016)
8-hour Design Value for 2014-2016
(ppm) Site
(AQS ID)
Minimum Monitors Required
Number of Active Monitors
Monitors Needed
NA1 St. Johns: Maricopa
12,633 0.067 St. Johns
(TT-614-7003) 0A 2 0
Sacaton: Pinal 0.065 Sacaton (TT-614-7001)
Table Notes: 1. It is unclear in Appendix D 40 CFR 58 how MSAs apply to Tribal agencies. Although the areas within the Community are
geographically part of the Phoenix-Mesa-Scottsdale MSA, for purposes of the administration of Section 107 of the Clean Air Act (42 U.S.C. § 7407), the air quality control region for the Community is all land within the exterior boundaries of the Community. Therefore, for the purposes of this document, the MSA is not applicable to GRIC.
2. Number of members who reside within GRIC, 12/31/2016. A. A 3-year design value greater than 0.0595 would require one monitor for a population between 50,000 and 350,000 (smallest population
group in Table 4-2). Since the GRIC population is below the lowest population range in Table 4-2 and Tribal requirements are unclear, the minimum monitoring requirements was assumed to be zero. For comparison, the population of the Phoenix-Mesa-Scottsdale MSA in 2010 was 4,192,887 (according to the 2010 census), which would require a minimum of 3 monitors.
Table 4-4. Minimum Monitoring Requirements1 for GRIC PM10 Monitors, 2014-2016
MSA Monitor Site:
County
Population2 (GRIC Census
2016)
Max Concentration
(µg/m3) Site
(AQS ID)
Minimum Monitors Required
Number of Active
Monitors Monitors Needed
NA1
St. Johns: Maricopa
12,633 325A
154B
St Johns (04-013-7003 and TT-
614-7003 POC1)
0C 3 0 Sacaton: Pinal Sacaton
(TT-614-7001 and TT-614-7001 POC1)
Casa Blanca: Pinal
Casa Blanca (TT-614-7004 and TT-
614-7004 POC3) Table Notes:
1. It is unclear in Appendix D 40 CFR 58 how MSAs apply to Tribal agencies. Although the areas within the Community are geographically part of the Phoenix-Mesa-Scottsdale MSA, for purposes of the administration of Section 107 of the Clean Air Act (42 U.S.C. § 7407), the air quality control region for the Community is all land within the exterior boundaries of the Community. Therefore, for the purposes of this document, the MSA is not applicable to GRIC.
2. Number of members who reside within GRIC, 12/31/2016. A. Max concentration including data flagged as exceptional events. CB site, 4/26/2014. B. Max concentration excluding data flagged as exceptional events. Sac site, 7/3/2014. C. A maximum concentration greater than 180 µg/m3 would require 1-2 monitors for a population between 100,000 and 250,000 (smallest
population group in Table 4-2). A maximum concentration between 120 and 180 µg/m3 would require 0-1 monitors for a population between 100,000 and 250,000. Since the GRIC population is below the lowest population range in Table 4-2 and Tribal requirements are unclear, the minimum monitoring requirements was assumed to be zero. For comparison, the population of the Phoenix-Mesa-Scottsdale MSA in 2010 was 4,192,887 (according to the 2010 census), which would require a minimum of 6-10 monitors for maximum concentrations >180 µg/m3 and 4-8 monitors for maximum concentrations between 120 and 180 µg/m3.
Based on the information contained in Tables 4-3 and 4-4, the GRIC monitoring network meets

2016 GRIC Network Review 18 June 2017
the minimum monitoring requirements for all criteria pollutants measured (i.e., ozone and PM10) as established in 40 CFR 58 Appendix D, Tables D-2 and D-4.
4.2 Data Submission Requirements
Federal regulations (Appendix A of 40 CFR 58 and 40 CFR 58.15) require air monitoring organizations to submit precision and accuracy data for the data reported to the federal database. The air monitoring precision and accuracy data for the GRIC monitors are submitted to the USEPA AIRS/AQS database on a quarterly basis and are up to date as of the publication of this report.
Federal regulations (40 CFR 58.15) also require the air monitoring organization to annually submit a letter certifying that data has been submitted for that year to the EPA AQS database and that the data accurately represents the air quality in the Community. The AQP certified and submitted the 2016 air monitoring data for the Community to USEPA Region 9 Administrator on April 5, 2017 via Email.
4.3 Air Quality Data
All of the GRIC ambient air monitoring stations are registered with the EPA and regularly report NAAQS criteria pollutant data to the EPA’s AQS database. The data generated at these stations are public information and are available in various formats from the respective agencies. Table 4-5 below lists some popular sources for air quality data.
Table 4-5. Sources of Ambient Air Quality Data
Agency Address For Data
Requests Email / Internet address Data Available
GRIC DEQ AQP
P.O. Box 97 Sacaton, AZ
85147 attn: GRIC DEQ Director
[email protected] GRIC Air
Monitoring Data
United States Environmental
Protection Agency
Ariel Rios Building 1200 Pennsylvania
Avenue, N.W. Washington, DC 20460
www.epa.gov www.epa.gov/ttn/airs/airsaqs/index
National Air Monitoring
Data, including GRIC data
4.4 Audits
The AQP performed audits of the monitoring equipment in 2016. The performance audit dates for the ozone monitors are shown in Table 4-6 and the semi-annual audits dates for the continuous TEOM PM10 monitors are shown in Table 4-7. In addition, this information is included in Appendix B that provides detailed information of air monitoring specifications.

2016 GRIC Network Review 19 June 2017
Table 4-6. Performance Audit Dates for GRIC Ozone Monitors
Site AQS ID Parameter 2016 Audit Dates
Sacaton 04-021-7001 and TT-614-7001 (Tribal Monitor) Ozone 6/16, 7/27, and 9/26
St Johns 04-013-7003 and TT-614-7003 (Tribal Monitor) Ozone 3/30, 4/15, 4/18, 9/27, and 11/15
Table 4-7. Semi-Annual Flow Rate Audit Dates for GRIC Continuous TEOM PM10 Monitor
Site AQS ID Parameter 2016 Audit Dates
Sacaton (TEOM) 04-021-7001 and TT-614-7001 (Tribal Monitor) PM10 5/17, 6/16, 9/26, and 12/08
St. Johns (TEOM) 04-013-7003 and TT-614-7003 (Tribal Monitor) PM10 9/27 and 11/15
Casa Blanca (TEOM) 04-021-7004 and TT-614-7004 POC3 (Tribal Monitor) PM10 3/17 and 4/26
Table 4-8. National Performance Audit Program (NPAP) Date for GRIC Ozone Monitoring Network
Site AQS ID Parameter 2016 Audit Dates1
Sacaton 04-021-7001 and TT-614-7001 (Tribal Monitor) Ozone 4/21/2016

2016 GRIC Network Review 20 June 2017
5 PUBLIC NOTICE
In accordance with 40 CFR 58.10, the annual monitoring network plan must be made available for public inspection (website, hardcopy posting in libraries and public offices, and/or newspaper listing) for at least 30 days prior to submission to EPA. If an opportunity for public comment had been provided, comments received must be included in the annual network plan submission.
The Gila River Indian Community DEQ made a draft copy of this Network Review available to the public on June 16, 2017. In an effort to notify the public of the Network Review, the AQP published information through the following outlets:
• Public Notice posted in the Gila River Indian Newspaper, a newspaper of general circulation in Gila River Indian Community.
• Public Notice posted on the GRIC DEQ website (www.gricdeq.org/index.php/education--outreach/public-notices).
• Presentation at a scheduled Community public open house event.
5.1 News Release
The following news release was advertised in the Gila River Indian Newspaper, VOL. 20, No. 11 Edition (dated June 2, 2017):
PUBLIC NOTICE OF AMBIENT AIR MONITORING NETWORK REVIEW
Pursuant to 40 Code of Federal Regulations (CFR) §58.10 Gila River Indian Community (GRIC) Department of Environmental Quality (DEQ) Air Quality Program (AQP) will make its annual monitoring network plan available for public inspection prior to submission to the United States Environmental Protection Agency. The Annual Ambient Monitoring Network Review and Data Summary present changes to and data collected from the air quality monitoring network during calendar year 2016. This document will also be available for review at the GRIC DEQ office located at 35 Pima Street, Sacaton, AZ 85147, and on the AQP website at “http://www.gricdeq.org/index.php/air-quality-program/documents”. Additionally, presentation will be provided at Governance Center Lobby, GRIC, Sacaton, AZ on June 21, 2017, 10AM-2PM. Public comments may be submitted in writing to GRIC DEQ Air Quality, P.O. Box 97, Sacaton, Arizona, 85147, or comments may be given orally at the scheduled community meeting. Additional information is available from GRIC DEQ Air Quality, 35 Pima Street, Sacaton, Arizona, the AQP website “http://www.gricdeq.org/index.php/air-quality-program”, or by calling 520-562-2234.
There were no requests made to review the document.
5.2 Public Meeting
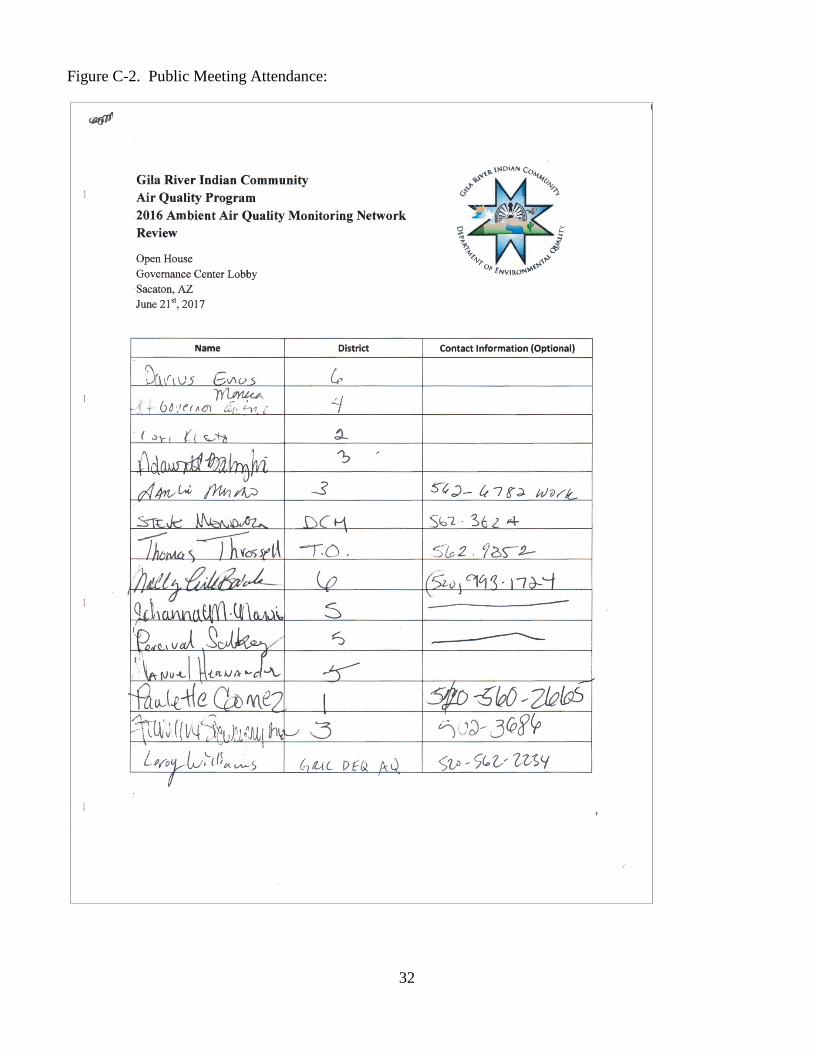
The AQP also presented a summary of the content of this document during the public open house

2016 GRIC Network Review 21 June 2017
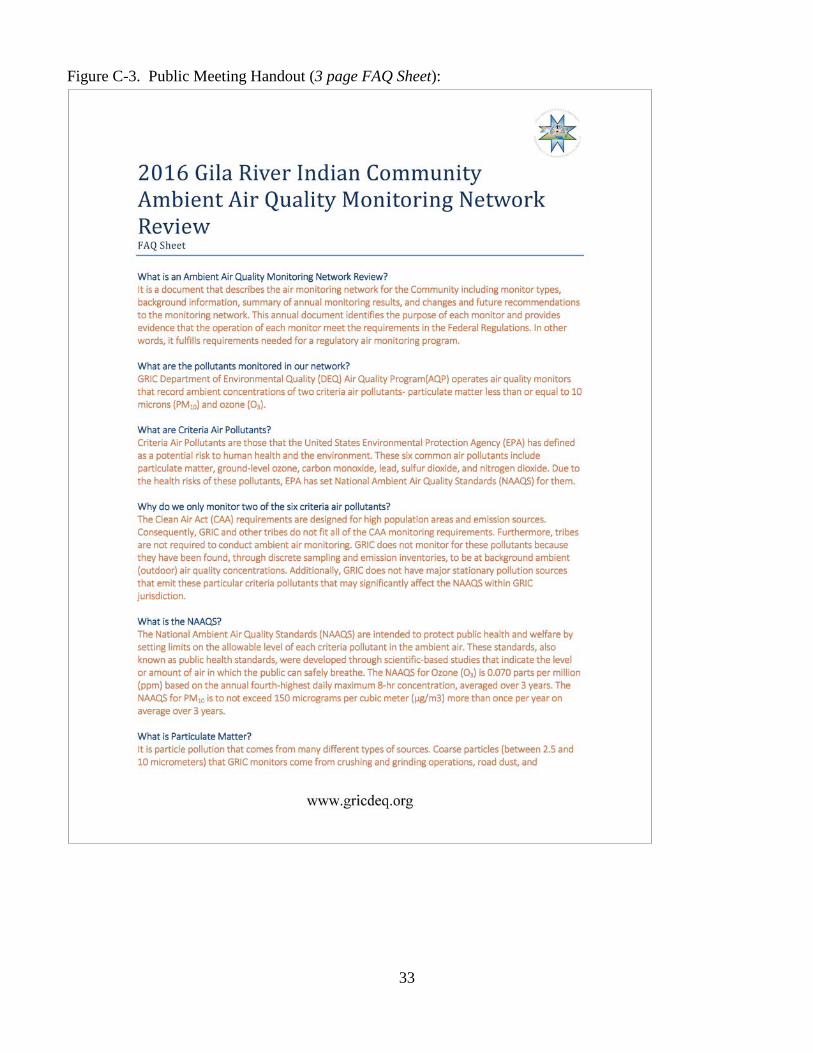
event on June 21, 2017 at the GRIC Governance Center. A copy of the public announcement and handouts are included as Appendix C. The comments and questions received from the Community members at the meeting are included in Table 5-1 below.
Table 5-1. Summary of Comments and Questions Received at the Open House Meeting in 2017
From Comments / Questions Received
Community member
Why isn’t there a monitor in District 7? You must receive a lot of complaints because of agriculture.
Community member
The only main concern I have is the pesticide (drift) that might linger into our homes when they’re done spraying the fields. These planes fly over head and dump whatever into the air.
Community member
Where can the community find air quality data for the day?
Community member
How do we monitor the air?
Community member
Where on the Community are the color flags of the AQI Flag Program located that forecast air quality?
Community member
How long have we been monitoring the air?
Community member
Have we done a network report for previous years?

22
Appendix A 2016 AIR MONITORING DATA BY SITE
(Site information includes: photographs, site type and spatial scale, and population represented.)
• St. Johns • Casa Blanca • Sacaton

23
St. Johns (SJ), 04-013-7003/TT-614-7003 (Tribal Monitor)
Location: 4208 W. Pecos Rd Laveen, AZ 85339
Spatial Scale: Urban (O3) and Neighborhood (PM10)
Monitoring Type: Population Exposure
Site Description: This site has been operational since 2003. The spatial scale for the St. Johns site is neighborhood for PM10 and Urban Scale for Ozone. It is located in a residential area and on a community elementary school property. This Tribal Monitoring location monitors for Ozone and PM10. This site operates one gaseous ozone analyzer and one continuous PM10 monitor that are both FEM instruments. Meteorological monitors operating at this site include: ambient temperature, barometric pressure, wind speed/direction, relative humidity, and precipitation. This site also includes two digital cameras that take 15 minute still images.
Pollutant Condition 2014 2015 2016
O3
Max. 8-hr O3 Average (PPM) 0.076 0.072 0.068
O3 # Daily Exceedances > 0.075 PPM 1 0 0
O3 # Daily Exceedances > 0.070 PPM 1 1 0
O3 3-year Average of 4th Highest (PPM) 0.069 0.068 0.067
PM10
Max. 24-hr PM10 Average (µg/m3) 160* 203* 218*
Number of exceedances 24-hr PM10 1† 2† 2†
Annual PM10 Average (µg/m3) 32.0ǂ 26.7ǂ 33.8ǂ * Indicates an exceedance of the NAAQS † Indicates exceptional events concurrence requested at this site and no Regional EPA assessment to date. ǂ The annual average values include exceptional events data that has not been concurred by EPA.
24
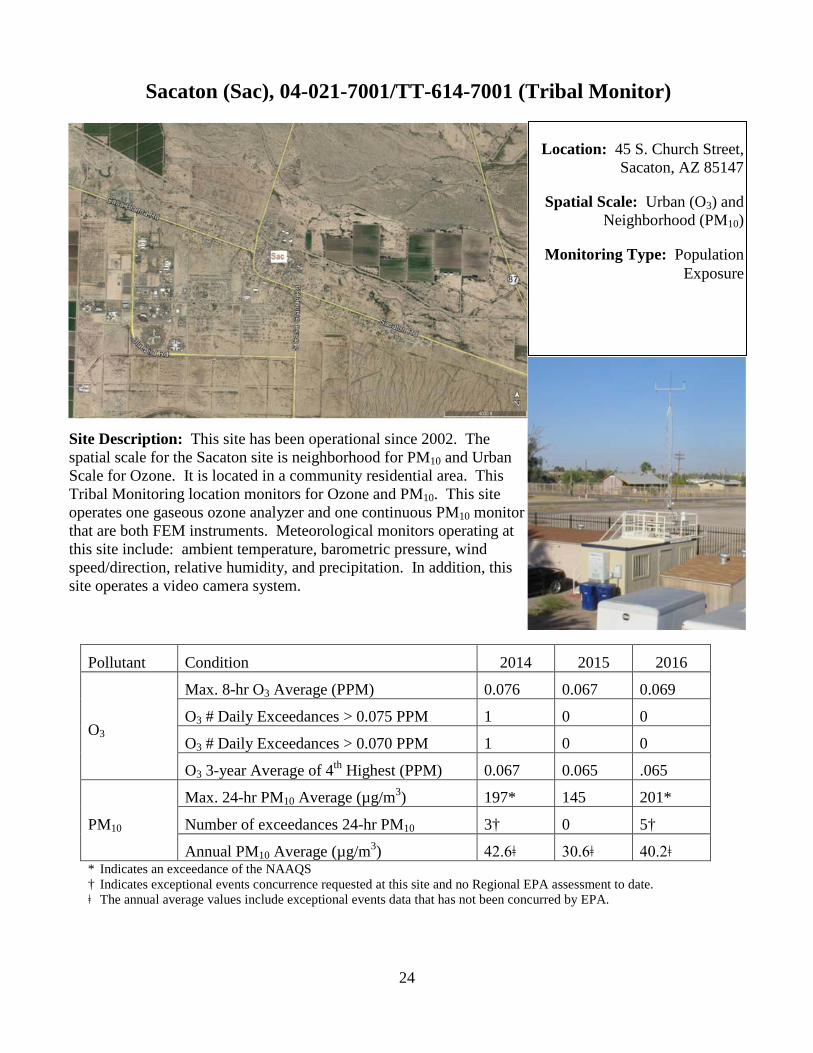
Sacaton (Sac), 04-021-7001/TT-614-7001 (Tribal Monitor)
Location: 45 S. Church Street, Sacaton, AZ 85147
Spatial Scale: Urban (O3) and Neighborhood (PM10)
Monitoring Type: Population Exposure
Site Description: This site has been operational since 2002. The spatial scale for the Sacaton site is neighborhood for PM10 and Urban Scale for Ozone. It is located in a community residential area. This Tribal Monitoring location monitors for Ozone and PM10. This site operates one gaseous ozone analyzer and one continuous PM10 monitor that are both FEM instruments. Meteorological monitors operating at this site include: ambient temperature, barometric pressure, wind speed/direction, relative humidity, and precipitation. In addition, this site operates a video camera system.
Pollutant Condition 2014 2015 2016
O3
Max. 8-hr O3 Average (PPM) 0.076 0.067 0.069
O3 # Daily Exceedances > 0.075 PPM 1 0 0
O3 # Daily Exceedances > 0.070 PPM 1 0 0
O3 3-year Average of 4th Highest (PPM) 0.067 0.065 .065
PM10
Max. 24-hr PM10 Average (µg/m3) 197* 145 201*
Number of exceedances 24-hr PM10 3† 0 5†
Annual PM10 Average (µg/m3) 42.6ǂ 30.6ǂ 40.2ǂ * Indicates an exceedance of the NAAQS † Indicates exceptional events concurrence requested at this site and no Regional EPA assessment to date. ǂ The annual average values include exceptional events data that has not been concurred by EPA.

25
Casa Blanca (CB), 04-021-7004/TT-614-7004 (Tribal Monitor)
Location: 3455 W. Casa Blanca Road
Bapchule, AZ 85121
Spatial Scale: Neighborhood
Monitoring Type: Population Exposure, Highest
concentration (PM10)
Site Description: This site has been operational since 2002. The spatial scale for the Casa Blanca site is neighborhood. It is located in a residential area and within a community elementary school property. This Tribal Monitoring location monitors for PM10. This site operates one continuous PM10 monitor that is a FEM instrument. Meteorological monitors operating at this site include: ambient temperature, barometric pressure, wind speed/direction, relative humidity, and precipitation. In addition, this site operates two digital cameras that take images every 15 minutes.
Pollutant Condition 2014 2015 2016
PM10
Max. 24-hr PM10 Average (µg/m3) 325* 191* 228*
Number of exceedances 24-hr PM10 8† 3† 8†
Annual PM10 Average (µg/m3) 49.9ǂ 40.6ǂ 52.0ǂ * Indicates an exceedance of the NAAQS † Indicates exceptional events concurrence requested at this site and no Regional EPA assessment to date. ǂ The annual average values include exceptional events data that has not been concurred by EPA.

26
Appendix B EPA-REQUIRED SITE METADATA
Detailed information includes: compliance information regarding air monitoring technical specifications found in 40 CFR §58.10 and Appendices A, C, D, and E (QA, monitoring methods, network design, and monitor siting)
Site Schematic Descriptions
Analysis Method (filter samples only) refers to the method used to process and analyze PM and Pb filter samples.
Distance from Supporting Structure refers to those sample probes that are attached to a supporting structure, such as the side of a building. In most cases the sample probe is located above the supporting structure, in which case the entry will show as “N/A”, aka not applicable.
Distance from Obstructions refers to those obstructions, both on the roof and off the roof, which are located higher than the probe. In the case of a nearby obstruction being higher than the probe, details of its location will be listed in the entry. If there are no obstructions higher than the probe, then the entry will be N/A.
Date of Annual Performance Evaluation refers to the last 2016 QA audit on the gaseous analyzers. These evaluations are performed by the GRIC’s QA personnel. Twenty-five percent of the monitors operating within each gaseous pollutant’s network are evaluated quarterly; thereby, each monitor is evaluated at least once per year as per 40 CFR Part 58, Appendix A, §3.2.2.
Date of Semi-Annual Flow Rate Audit refers to the last 2016 QA audit on PM monitors as per 40 CFR Part 58, Appendix A, §§ 3.2.4 and 3.3.4, respectively. These evaluations are performed by the GRIC’s QA personnel at least once every six months.
Probe Sample Line Material refers to the material makeup of the intake sample lines.
Pollutant Sample Residence Time refers to the amount of time that it takes a sample of air to travel between the probe inlet and the bulkhead of the analyzer. This residence time is calculated by a formula that is based on the sample line’s diameter and length, and the flow rate of the air intake. It is important to keep residence time low to prevent gases in the air sample from reacting with the sample line material or with other gases in the sample; i.e., O3 could react with nitrogen oxides in the sample if the residence time exceeds 20 seconds.
27
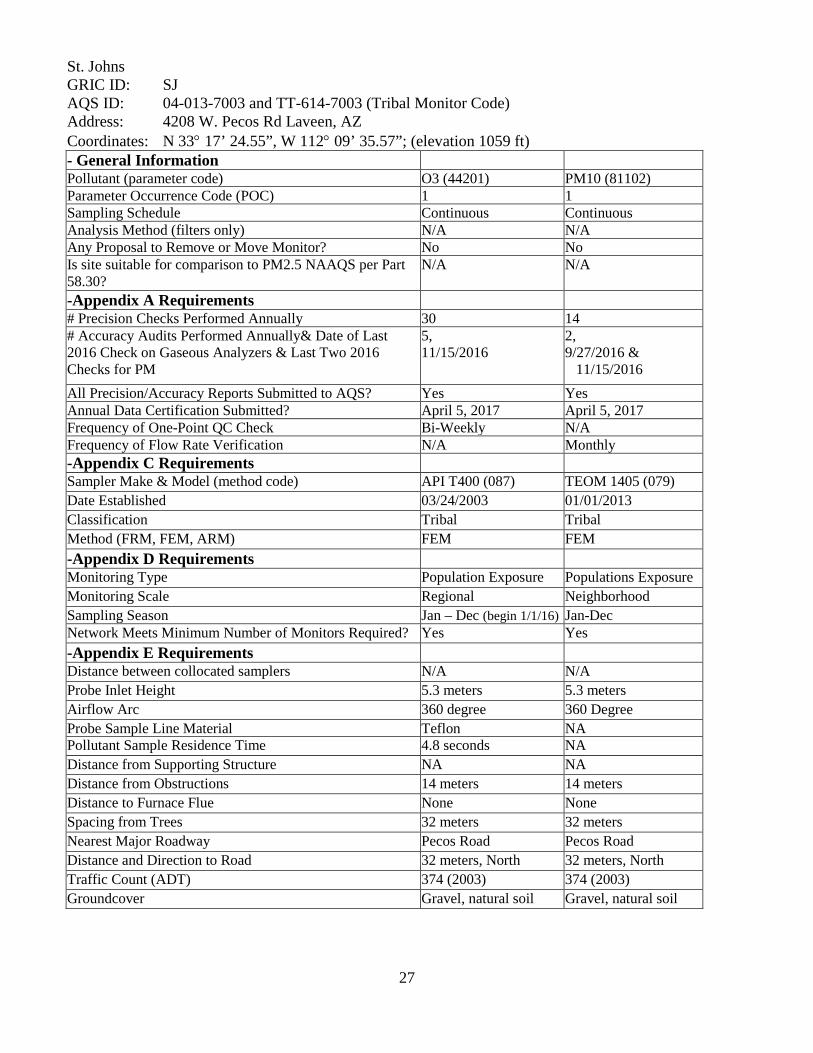
St. Johns GRIC ID: SJ AQS ID: 04-013-7003 and TT-614-7003 (Tribal Monitor Code) Address: 4208 W. Pecos Rd Laveen, AZ Coordinates: N 33° 17’ 24.55”, W 112° 09’ 35.57”; (elevation 1059 ft) - General Information Pollutant (parameter code) O3 (44201) PM10 (81102) Parameter Occurrence Code (POC) 1 1 Sampling Schedule Continuous Continuous Analysis Method (filters only) N/A N/A Any Proposal to Remove or Move Monitor? No No Is site suitable for comparison to PM2.5 NAAQS per Part 58.30?
N/A N/A
-Appendix A Requirements # Precision Checks Performed Annually 30 14 # Accuracy Audits Performed Annually& Date of Last 2016 Check on Gaseous Analyzers & Last Two 2016 Checks for PM
5, 11/15/2016
2, 9/27/2016 & 11/15/2016
All Precision/Accuracy Reports Submitted to AQS? Yes Yes Annual Data Certification Submitted? April 5, 2017
April 5, 2017
Frequency of One-Point QC Check Bi-Weekly N/A Frequency of Flow Rate Verification N/A Monthly -Appendix C Requirements Sampler Make & Model (method code) API T400 (087) TEOM 1405 (079) Date Established 03/24/2003 01/01/2013 Classification Tribal Tribal Method (FRM, FEM, ARM) FEM FEM -Appendix D Requirements Monitoring Type Population Exposure Populations Exposure Monitoring Scale Regional Neighborhood Sampling Season Jan – Dec (begin 1/1/16) Jan-Dec Network Meets Minimum Number of Monitors Required? Yes Yes -Appendix E Requirements Distance between collocated samplers N/A N/A Probe Inlet Height 5.3 meters 5.3 meters Airflow Arc 360 degree 360 Degree Probe Sample Line Material Teflon NA Pollutant Sample Residence Time 4.8 seconds NA Distance from Supporting Structure NA NA Distance from Obstructions 14 meters 14 meters Distance to Furnace Flue None None Spacing from Trees 32 meters 32 meters Nearest Major Roadway Pecos Road Pecos Road Distance and Direction to Road 32 meters, North 32 meters, North Traffic Count (ADT) 374 (2003) 374 (2003) Groundcover Gravel, natural soil Gravel, natural soil

28
Sacaton GRIC ID: Sac AQS ID: 04-021-7001 and TT-614-7001 (Tribal Monitor Code) Address: 35 Pima Street, PO Box 97, Sacaton, AZ 85147 Coordinates: N 33° 04’ 47.88”, W 111° 44’ 26.27”; (elevation 1280 ft) - General Information Pollutant (parameter code) O3 (44201) PM10 (81102) Parameter Occurrence Code (POC) 1 1 Sampling Schedule Continuous Continuous Analysis Method (filters only) N/A N/A Any Proposal to Remove or Move Monitor? Yes Yes Is site suitable for comparison to PM2.5 NAAQS per Part 58.30?
N/A N/A
-Appendix A Requirements # Precision Checks Performed Annually 27 18 # Accuracy Audits Performed Annually& Date of Last 2016 Check on Gaseous Analyzers & Last Two 2016 Checks for PM
3, 9/26/2016
4, 9/26/2016 & 12/8/2016
All Precision/Accuracy Reports Submitted to AQS? Yes Yes Annual Data Certification Submitted? April 5, 2017 April 5, 2017 Frequency of One-Point QC Check Bi-Weekly N/A Frequency of Flow Rate Verification N/A Monthly -Appendix C Requirements Sampler Make & Model (method code) API T400 (087) TEOM 1400AB (079) Date Established 07/01/2002 01/01/2013 Classification Tribal Tribal Method (FRM, FEM, ARM) FEM FEM -Appendix D Requirements Monitoring Type Population Exposure Population Exposure Monitoring Scale Regional Neighborhood Sampling Season January – December January – December Network Meets Minimum Number of Monitors Required? Yes Yes -Appendix E Requirements Distance between collocated samplers N/A N/A Probe Inlet Height 5 meters 5 meters Airflow Arc 360 degree 360 Degree Probe Sample Line Material Teflon NA Pollutant Sample Residence Time 4.8 seconds NA Distance from Supporting Structure NA NA Distance from Obstructions 25 meters, nearest tree 25 meters, nearest tree Distance to Furnace Flue None None Spacing from Trees 25 meters 25 meters Nearest Major Roadway W Pima Street W Pima Street Distance and Direction to Road 60 meters, South 60 meters, South Traffic Count (ADT) 253 (daily average 2008) 253 (daily average 2008) Groundcover Pavement and natural
soil Pavement and natural soil

29
Casa Blanca GRIC ID: CB AQS ID: 04-021-7004 and TT-614-7004 (Tribal Monitor Code) Address: Casa Blanca/ Preschool Road, Bapchule, AZ 85221 Coordinates: N 33° 07’ 03.14”, W 111° 53’ 08.93”; (elevation 1203 ft) - General Information Pollutant (parameter code) PM10 (81102) Parameter Occurrence Code (POC) 3 Sampling Schedule Continuous Analysis Method (filters only) N/A Any Proposal to Remove or Move Monitor? No Is site suitable for comparison to PM2.5 NAAQS per Part 58.30? N/A -Appendix A Requirements # Precision Checks Performed Annually 15 # Accuracy Audits Performed Annually& Date of Last 2016 Check on Gaseous Analyzers & Last Two 2016 Checks for PM
2, 3/17/2016 & 4/26/2016
All Precision/Accuracy Reports Submitted to AQS? Yes Annual Data Certification Submitted? April 5, 2017 Frequency of One-Point QC Check N/A Frequency of Flow Rate Verification Monthly -Appendix C Requirements Sampler Make & Model (method code) TEOM 1400AB (079) Date Established July 1, 2002 Classification Tribal Method (FRM, FEM, ARM) FEM -Appendix D Requirements Monitoring Type Population Exposure Monitoring Scale Neighborhood Sampling Season January - December Network Meets Minimum Number of Monitors Required? Yes -Appendix E Requirements Distance between collocated samplers N/A Probe Inlet Height 4.67 meters Airflow Arc 360 Degree Probe Sample Line Material NA Pollutant Sample Residence Time NA Distance from Supporting Structure NA Distance from Obstructions 8.9 meters, building to S Distance to Furnace Flue NA Spacing from Trees 9.6 meters, tree to East Nearest Major Roadway Casa Blanca Road Distance and Direction to Road 19 meters, to north Traffic Count (ADT) 2400 (daily average 2008) Groundcover gravel
30
Appendix C Public Notice and Comment Information
1. Figure C-1. 2016 public notice and news release information. 2. Figure C-2. Public Meeting Attendance. 3. Figure C-3. Public Meeting Handout (3 page FAQ Sheet).

31
Figure C-1. 2016 public notice and news release information.
32
Figure C-2. Public Meeting Attendance:
33
Figure C-3. Public Meeting Handout (3 page FAQ Sheet):

34

35