Embed Size (px)
Citation preview
International Group of Liquefied Natural Gas Importers
GIIGNL
Gas Naturally – Making a clean future real
-1-
Brussels, 26 April 2012
Trends in the LNG Industry
Jean Vermeire, President GIIGNL
Small scale LNG : a contribution to Energy 2050 Roadmap
Frédéric Deybach, VP Prospection, GDF SUEZ LNG, member of GIIGNL Commercial Study Group

• The International Group of LNG Importers, known by its French acronym GIIGNL, is a non-profit organisation established in Paris in 1971.
• GIIGNL presently has 68 member companies from 21 countries of Asia, Europe and the Americas, or nearly every company involved in the importation of LNG and/or the operation of LNG receiving terminals.
• GIIGNL’s main objective is to study and promote the development of activities related to LNG : purchasing, importing, processing, transportation, handling, regasification and various uses of LNG.
• GIIGNL promotes the exchange of information and of experience among its members to enhance the safe ,reliable, efficient and sustainable operation of LNG import facilities, to improve contractual techniques, to develop positions to be taken in international agencies, etc..
www.giignl.org-
3-
-4-
Over 67,000 cargoes delivered without loss since 1964
(start of commercial deliveries from Algeria to UK)
Industry safety standards continue to be first class
No accident with loss of life of the public since 1944
LNG less dangerous than more widely-traded products
Extensive research and scenario planning into potential hazards

Source: GIIGNL “LNG Industry 2010”BP Statistical report 2011Cedigaz
5
Filling regional supply gaps resulting from demand growth and
declining indigenous pipeline supplies
Discoveries of and access to “remote gas”
Low shipping cost per distance
Diversification of sources and markets
Destination flexibility and re-sale opportunities
and in particular for Europe as a result of liberalisation:
Easier for new entrants to acquire/control logistics
LNG projects more modular than large pipeline projects
LNG has evolved from a diversification option to a secure and competitive supply source, unaffected by transit issues
6

-7-
USA Alaska
Kenai
TrinidadAtlantic
Venezuela
NigeriaBonny
Angola
QatarNorth Field
Libya
ArunIndonesia
Australia-
North West Shelf
Brunei - Lumut
Malaysia - Bintulu
Indonesia Bontang
RussiaSakhalin
IndonesiaTangguh
Oman
AustraliaGorgon
Snøhvit
Atlantic Basin:Rapidly evolving regional market with arbitrage dynamics and increasing short-term trading
Asia-Pacific Market:The traditional LNG market dominated by long term sales to Japan ,Korea, Taiwan , India and China as well as new importers.
Algeria
Global LNG supplies :from two regional basins to globalised supplies?
Source: based on Wood Mackenzie
Latin America and Middle East:Fast growing markets offering attractive counter-seasonal arbitrage
7
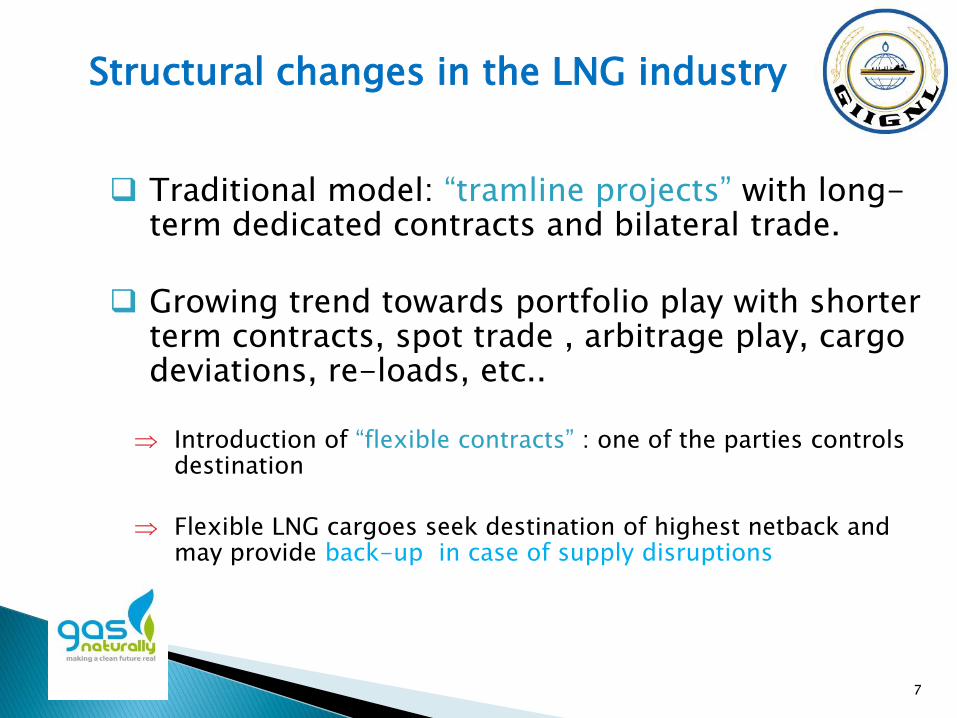
Traditional model: “tramline projects” with long-term dedicated contracts and bilateral trade.
Growing trend towards portfolio play with shorter term contracts, spot trade , arbitrage play, cargo deviations, re-loads, etc..
Introduction of “flexible contracts” : one of the parties controls destination
Flexible LNG cargoes seek destination of highest netback and may provide back-up in case of supply disruptions
Structural changes in the LNG industry

Source: GIIGNL “LNG Industry 2010”
9

Source: GIIGNL “LNG Industry 2010”
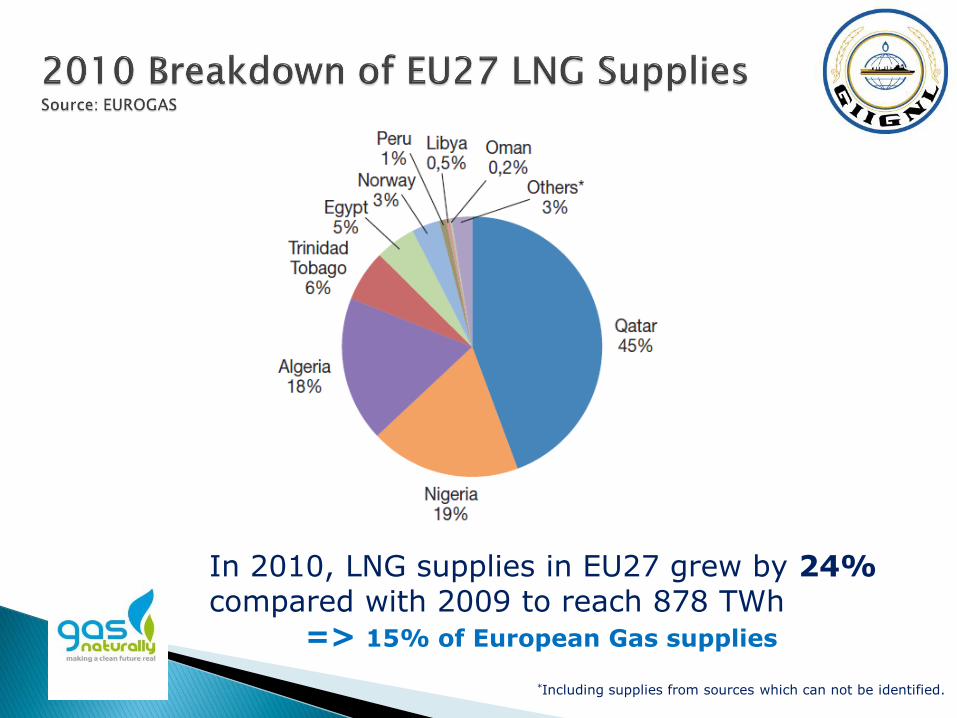
*Including supplies from sources which can not be identified.
In 2010, LNG supplies in EU27 grew by 24%compared with 2009 to reach 878 TWh
=> 15% of European Gas supplies
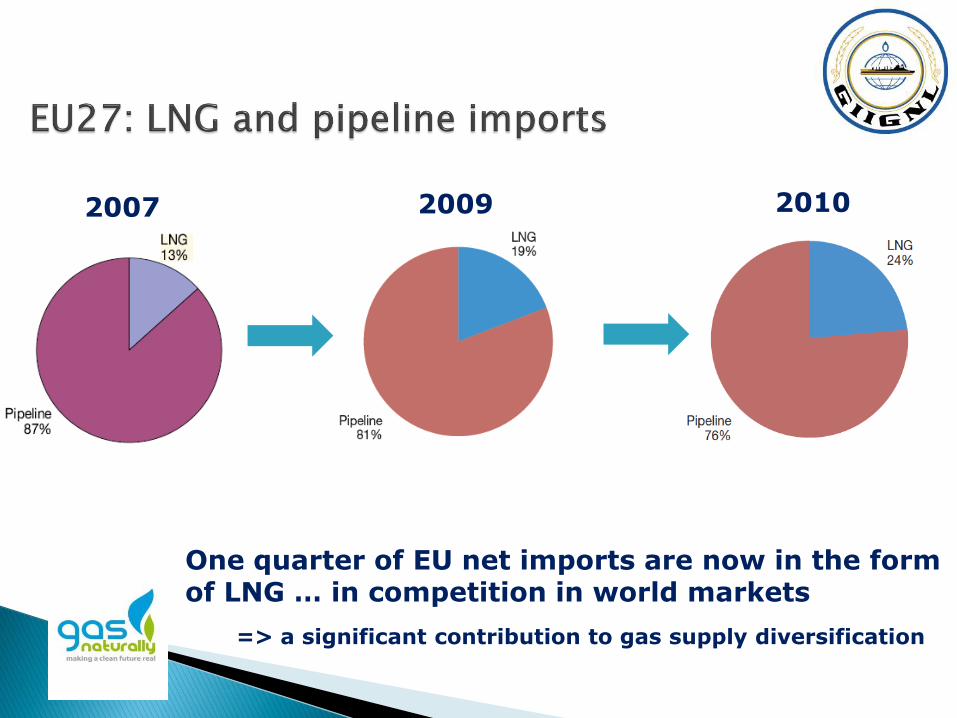
20102009
One quarter of EU net imports are now in the form of LNG … in competition in world markets
=> a significant contribution to gas supply diversification
2007 2009
13
Issues with key impact on future LNG markets
Shorter term
• Nuclear policy decision in Japan • FID’s on LNG exports from North America at hub pricing ?• Commercial policies of Qatar• Infrastructure commitments to develop small-scale LNG in Europe
Longer term
• Uncertainties of post-2030 gas demand in Atlantic Basin (decarbonisation and energy efficiencies in Energy 2050 Roadmap)
• Current wave of FID’s in Pacific Basin ( at high cost) leading to supplysurplus post-2016?
• A surge of unconventionals in Asian markets too ?

14
Small Scale LNG activities fall into two main categories depending on final usage : « Niche LNG » and « LNG as fuel »
Niche LNG = LNG to be supplied to small/remote markets (oversea or overland) with small LNG tankers (less than 20,000 m3) or LNG barges or LNG trucks
LNG as fuel = LNG to be used as fuel for ships of for road vehicles
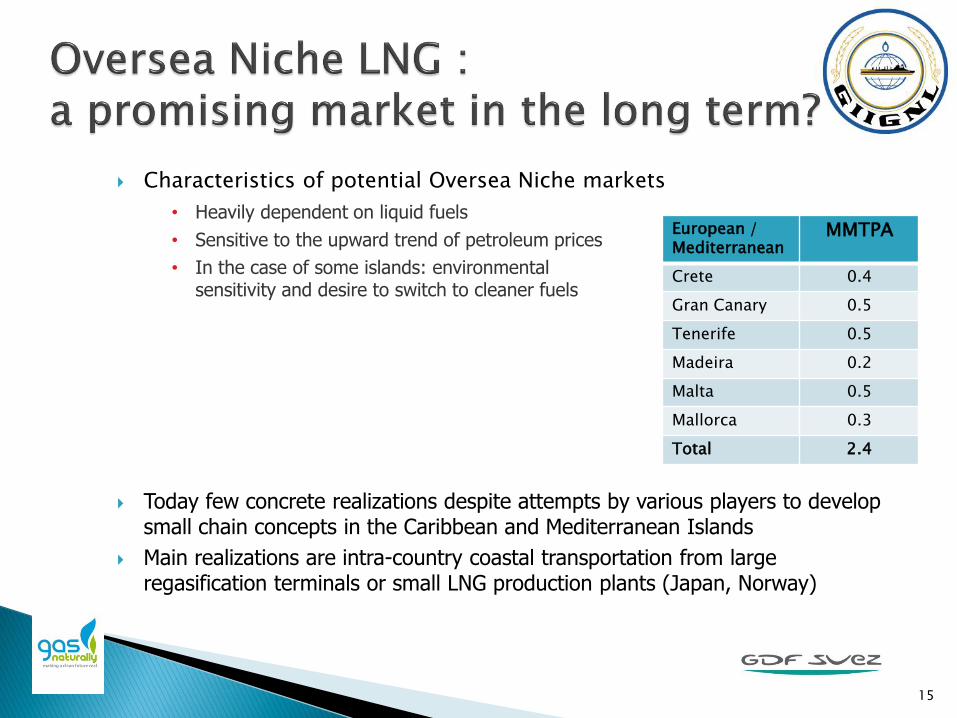
Characteristics of potential Oversea Niche markets
• Heavily dependent on liquid fuels
• Sensitive to the upward trend of petroleum prices
• In the case of some islands: environmental sensitivity and desire to switch to cleaner fuels
Today few concrete realizations despite attempts by various players to develop small chain concepts in the Caribbean and Mediterranean Islands
Main realizations are intra-country coastal transportation from large regasification terminals or small LNG production plants (Japan, Norway)
15
European / Mediterranean
MMTPA
Crete 0.4
Gran Canary 0.5
Tenerife 0.5
Madeira 0.2
Malta 0.5
Mallorca 0.3
Total 2.4

It is clear that the industry is still in a chicken and egg situation:
The small LNG to oversea markets is expensive◦ Cost of small scale liquefaction◦ Cost of small tankers◦ Cost of small scale regasification
Even if one is ready to invest, sourcing remains an issue
No existing small scale liquefaction plant
The cheapest sourcing solution – west of Suez at least – seems to be the reloading in a regasification terminal… but berthing slots cannot be guaranteed (access and tariffs)
Existing terminal owners/operators are reluctant to invest in dedicated small scale LNG infrastructure, as long as the market has not first developed significantly
16

Main segments of the market are :
Peakshaving facilities
Satellite storages
Industrial end users
Steady growth
Global tonnage of LNG transported overland was 1.9 million ton in 2009 against 0.6 million ton in 1998 (3-fold increase)
Total annual distance traveled was 30 million km in 2009, twice as much as in 1998
Europe continues to be the largest market for the overland transportation of LNG, produced locally (UK or Norway) or imported from Spanish terminals, and Japan is the only country utilizing rail
Mature technology
Cost stable and well known
Several suppliers exist for most equipments
Good safety record
17

Growth of market for LNG as fuel is to speed up :
1. International Maritime Organization : limits on NOx and SOx emissions from ship exhausts in the Marine Pollution (MARPOL) convention :
◦ 2020 or alternatively 2025 – decision in 2018 – as the deadline to cut the amount of sulfur burnt by the world fleet
◦ Aim is to reduce sulfur content in marine fuel to 0.5%
◦ Can be met by burning cleaner fuels like diesel oil or marine gas oil (middle distillates)
◦ More stringent requirements are applicable in Emission Control Areas (ECA): in particular Baltic Sea and North Sea in 2015, as well as the coasts of the United States
2. “Transport 2050″ Europe strategy for a cut in carbon emissions in transport by 60% :
◦ No more conventionally fueled cars in city centers by the middle of the century
◦ 40% cut in shipping emissions
◦ 40% use of low carbon fuels in aviation
18
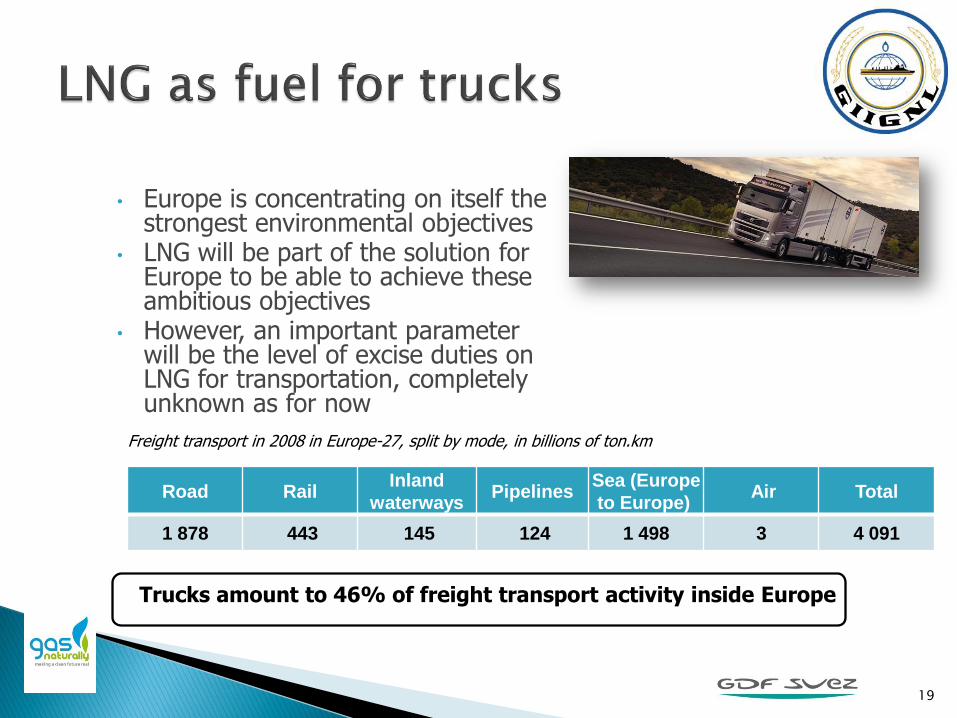
• Europe is concentrating on itself the strongest environmental objectives
• LNG will be part of the solution for Europe to be able to achieve these ambitious objectives
• However, an important parameter will be the level of excise duties on LNG for transportation, completely unknown as for now
19
Freight transport in 2008 in Europe-27, split by mode, in billions of ton.km
Trucks amount to 46% of freight transport activity inside Europe
Road RailInland
waterwaysPipelines
Sea (Europe
to Europe)Air Total
1 878 443 145 124 1 498 3 4 091

In a first step, LNG can be proposed to a limited segment of this market: long haul freight on predefined corridors
Assumption = LNG can take 10% of freight market (provided price of LNG vs diesel
is attractive enough)
According to European Commission, total freight inside Europe-27 was 1,878 billion ton.km in 2008 and it is expected to be 3,000 billion ton.km in 2030
Fuel consumption equivalence for a 20 to 40-ton truck running on LNG can be set at 30 kg LNG per 100 km (vs 33 liter diesel per 100 km) ie 7.5g LNG per ton.km
Thus a potential magnitude of demand for LNG as fuel for trucks could be:
10% * 1,878 billion ton.km * 7,5 g LNG per ton.km = 1.4 million ton per year
Only 10% of the fuel for truck market in Europe would be nearly as much as the 1.9 million ton of LNG transported overland, worldwide, in 2009
20
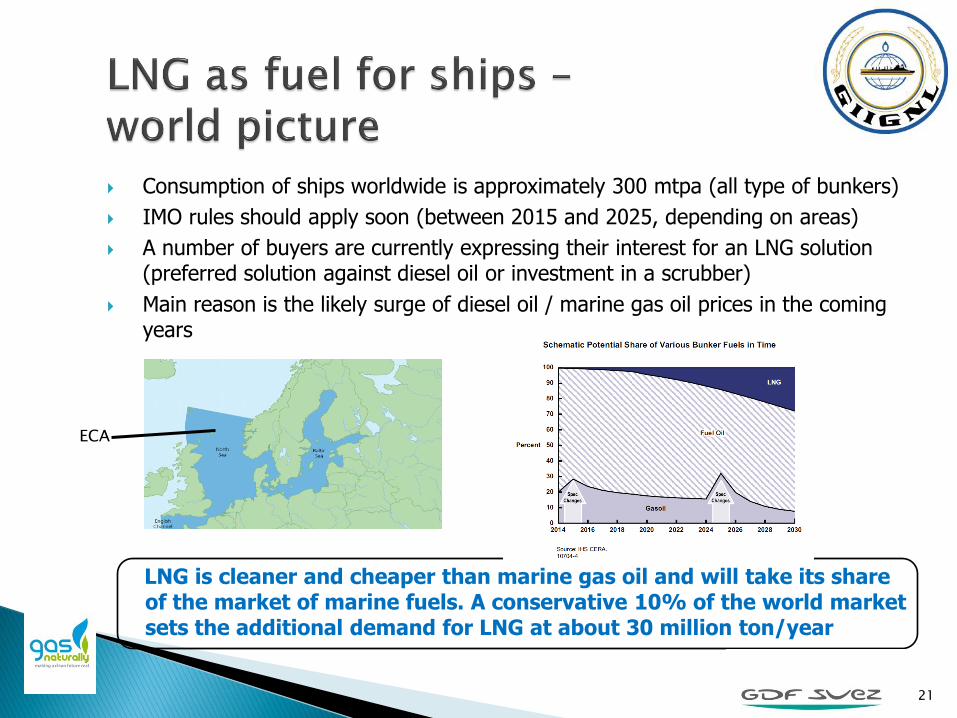
Consumption of ships worldwide is approximately 300 mtpa (all type of bunkers)
IMO rules should apply soon (between 2015 and 2025, depending on areas)
A number of buyers are currently expressing their interest for an LNG solution (preferred solution against diesel oil or investment in a scrubber)
Main reason is the likely surge of diesel oil / marine gas oil prices in the coming years
LNG is cleaner and cheaper than marine gas oil and will take its share of the market of marine fuels. A conservative 10% of the world market sets the additional demand for LNG at about 30 million ton/year
21
ECA
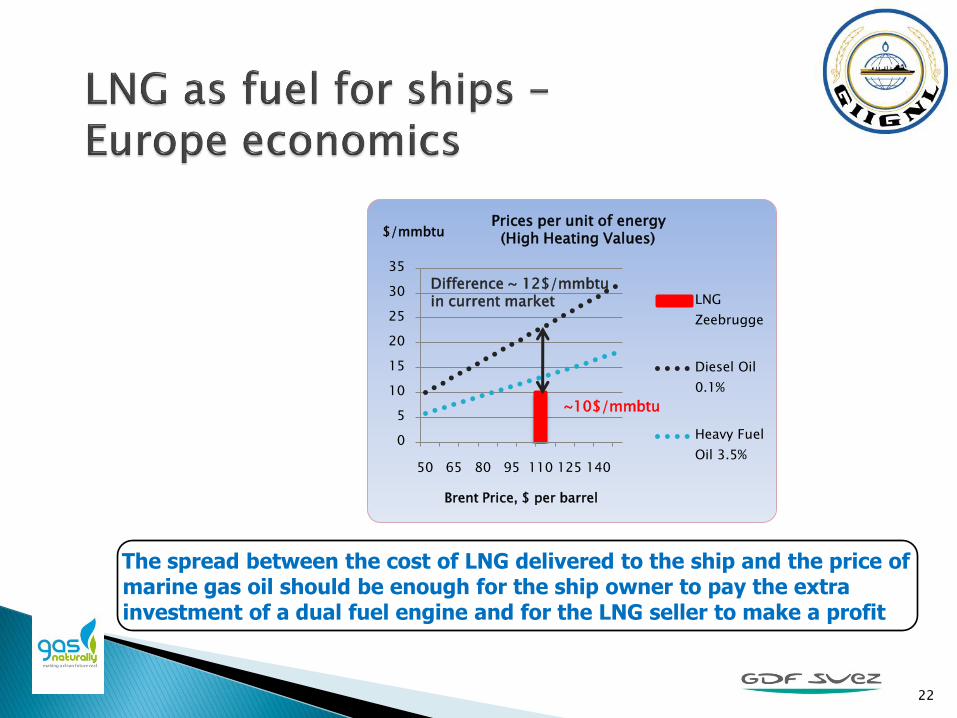
The spread between the cost of LNG delivered to the ship and the price of marine gas oil should be enough for the ship owner to pay the extra investment of a dual fuel engine and for the LNG seller to make a profit
0
5
10
15
20
25
30
35
50 65 80 95 110 125 140
$/mmbtu
Brent Price, $ per barrel
LNG
Zeebrugge
Diesel Oil
0.1%
Heavy Fuel
Oil 3.5%
Prices per unit of energy(High Heating Values)
Difference ~ 12$/mmbtuin current market
~10$/mmbtu
22


![„The draft GIIGNL voyage charterparty for LNG shipping …final].pdf · „The draft GIIGNL voyage charterparty for LNG shipping and ... General exceptions clause 31 ... 6 This](https://img.dokumen.tips/doc/110x75/5b4168ed7f8b9a51528dcb27/the-draft-giignl-voyage-charterparty-for-lng-shipping-finalpdf-the-draft.jpg)