Embed Size (px)
Citation preview

L. Bartoszek
BARTOSZEK ENGINEERING
For NBI2012 at CERN
11/4/12

Outline The MiniBooNE horn and my evolving understanding of
fatigue
Facts of fatigue
Theoretical understanding of fatigue for design
Fatigue factor of safety and confidence limits
The difference between ferrous and non-ferrous materials
Brief history of fatigue testing Old technology
RR Moore machines,etc
New Technology Ultrasonic fatigue testing
Where gigacycle fatigue testing is relevant today
Future horn applications
2

The MiniBooNE Horn The MiniBooNE experiment has been running since
2004 (8 years!) on the second of three horns built
The first horn failed at 96 million pulses
It failed by galvanic corrosion that lead to a water leak and a ground fault
The second horn now has 386 Megacycles on it
The galvanic corrosion condition that killed the first horn was eliminated
The only problems this horn has had are failures of subsystems like water pumps
3
4
The MiniBooNE horn on the test stand at MI-8

Horn fatigue design in 1999
MiniBooNE could not afford more than a one-horn system and it had to live forever.
Horns have a complex stress cycle structure because the beam and current pulses are different lengths
Thermal stresses and magnetic stresses peak at different times
5

Horn fatigue design in 1999 cont’d We analyzed the stress cycle by superimposing quasi-
static stresses from a 2D axisymmetric FEA model It was a time consuming and painful process
We did not have the computational power then to do a true transient solid model including all effects simultaneously—we really don’t now either Ichikawa-san has since done transient FEA on solid T2K horn
models to look at the symmetry of the magnetic field from current distribution
People are starting to use multiphysics modelers like Comsol on horns
I could not find any data on aluminum that went past 5E8 cycles in 1999.
6

Facts of Fatigue Parts fail at lower* stresses than yield stress when the
load is applied and removed more than once.
More cycles, lower stress at failure *Some materials (like annealed steel) increase in strength from cyclic stress.
(We don’t care about this for horns.)
You can do things to parts that can either decrease or increase the fatigue life of a part
Some coatings and platings increase fatigue life, others reduce it
Environmental conditions can reduce fatigue life
We are limited in design by lack of data, not by material properties
7

Horn Facts of Fatigue Inner conductors heat up and expand putting them in
compressive loading most of the time This effect can be modified by choices at horn assembly
Inner conductors are susceptible to buckling because they are thin Spiders protect ICs from buckling
Because the inner conductor is in compression, the outer conductor is in tension Outer conductors are always thick so stresses are very low
End caps are thin and in complicated bending states
The magnetic field tries to turn the cylinder of the horn into a sphere Radial inward pressure on the IC, outward on the OC
8

Horn Fatigue Facts 2 Because of the mean compressive stress in the inner
conductor, fatigue will not happen here first (in general) Compression tends to close fatigue cracks
Fatigue failure happens first in areas that alternate between compressive (or zero) and tensile stress
The MiniBooNE downstream end cap is the most likely place on the horn to fail in fatigue
This is what I’m waiting for!
If the compressive stress in the IC is high enough to cause buckling (with associated bending stresses,) then failure can happen along the IC This may be what killed the first K2K horn
9

“Primitive” Theoretical Understanding of Fatigue
Undergraduate engineering (in my day!) taught that there was a fundamental difference between ferrous and non-ferrous metals Ferrous alloys could exhibit an “endurance limit”
If the metal was stressed below the endurance limit it would never fail in fatigue (forever = 107 cycles)
Non ferrous alloys never exhibited an endurance limit
The modified Goodman diagram can be used to calculate a safety factor for fatigue
I could not figure out how the safety factor could be used to predict the “extra” life of a part We developed a statistical model from MIL-SPEC data
10

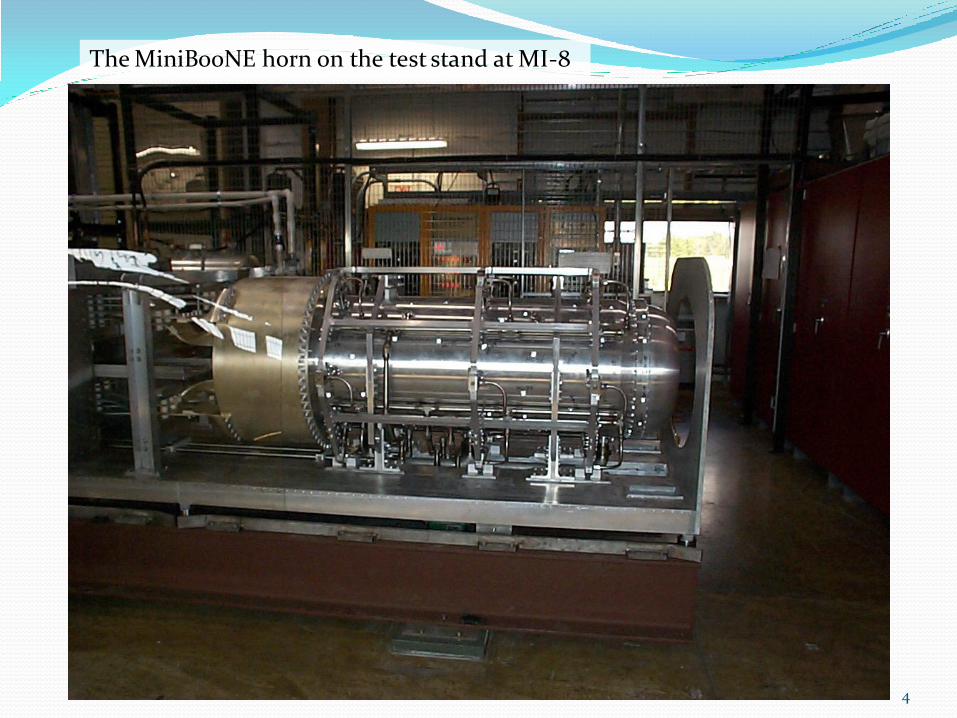
11 From: http://www.ckit.co.za/secure/conveyor/papers/troughed/modern/modern.htm
Modified Goodman Diagram σa = stress amplitude
σa
S.F. = safety factor = σa/σmax calc
The boundary of this plot is a failure locus. If the calculated stress amplitude is inside the locus, you get more than N cycles to failure. If the stress amplitude is outside the locus, you get fewer than N cycles to failure.
This curve represents the locus for a single fatigue lifetime of N cycles
12
Example Master Fatigue Diagram for 4340 steel

Fatigue testing yesterday and today
Fatigue testing used to require samples chucked in a machine similar to a lathe and mechanically stressed at a rate of <200 cycles per second until they broke
Getting to megacycles took a long time. Gigacycles was out of the question
The development of high speed fatigue testing started early in the 20th century, but didn’t become cheap and practical until 1950 when Mason used piezoelectric transducers at 20 kHz
Higher frequencies have been tried but modern systems typically run at 20 kHz
13

Fatigue Testing Standards
Test standards for traditional fatigue testing are available such as at:
http://www.astm.org/Standards/fatigue-and-fracture-standards.html (for ASTM standards)
and:
http://www.iso.org/iso/home/store/catalogue_tc/catalogue_tc_browse.htm?commid=53562 (for ISO standards)
One problem of ultrasonic fatigue testing is lack of standards.
Ultrasonic testing is more experimental but easy to set up a custom test stand
14

15
This is a traditional fatigue testing machine using a specimen in bending rotated about its axis It operates at 500-10,000 RPM. (This is fast for this type of machine.) This translates to a maximum frequency of 167 Hz. (Typical machines operate at 20 Hz.) At 500 RPM it takes 3.8 years to get to 109 cycles At 10,000 RPM it takes 70 days to get 109 cycles. (I don’t know if the machine can run at that speed for that long.) 1010 cycles = 700 days, 2 years
http://www.instron.us/wa/product/RR-Moore-Rotating-Beam-Fatigue-Testing-System.aspx
R.R. Moore rotating beam fatigue testing machine by Instron
These numbers show why ultrasonic testing runs at 20 kHz
16
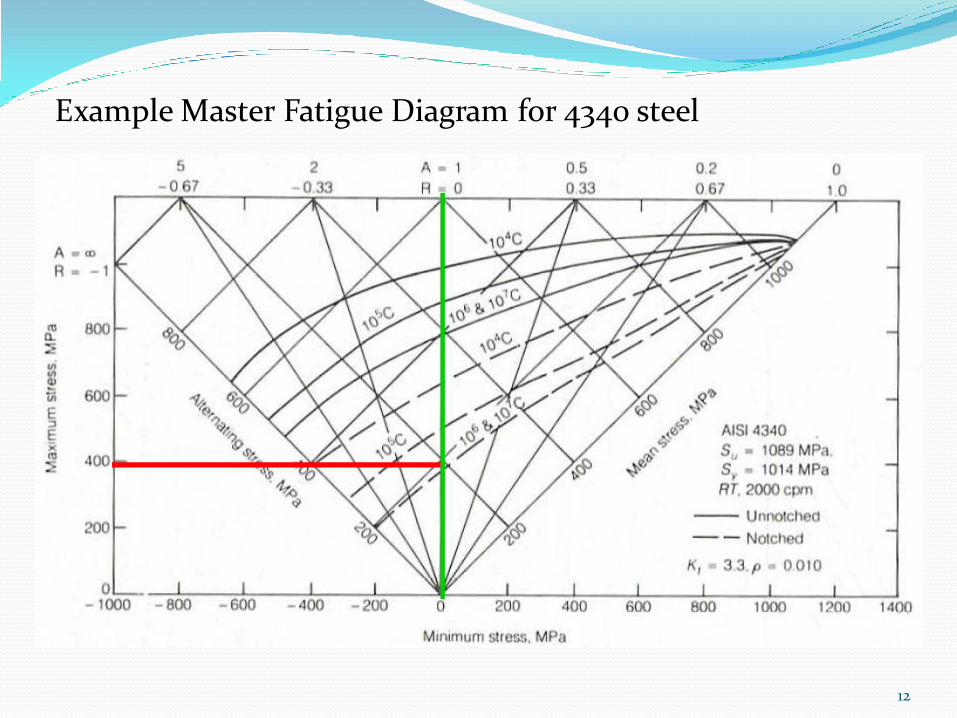
Much of what I learned about gigacycle fatigue came from this book. Claude Bathias’ name features prominently in any searches on ultrahigh cycle fatigue. Ultrasonic fatigue test machines must include the following three things: 1) A power generator that outputs a
20 kHz sinusoidal electrical signal 2) A piezoelectric or
magnetostrictive transducer that transforms the electrical signal into longitudinal ultrasonic waves of the same frequency
3) An ultrasonic horn that amplifies the transducer vibration to achieve the required strain in the specimen
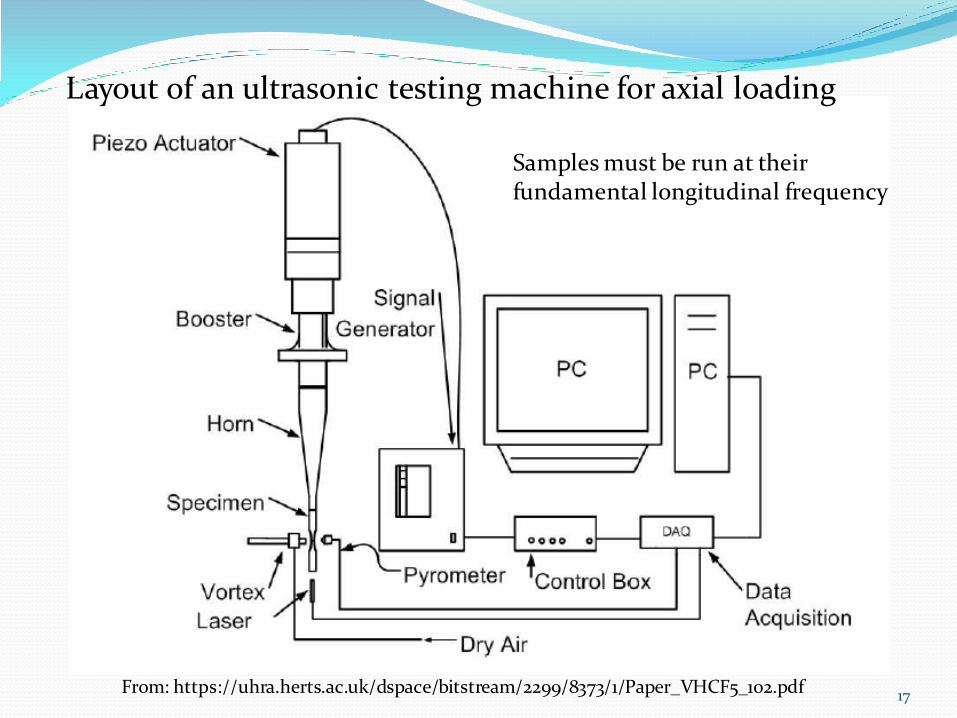
17 From: https://uhra.herts.ac.uk/dspace/bitstream/2299/8373/1/Paper_VHCF5_102.pdf
Layout of an ultrasonic testing machine for axial loading
Samples must be run at their fundamental longitudinal frequency

18
Diagram of an ultrasonic torsional testing machine
Marines-Garcia,Israel. Doucet,Jean-Pierre. Bathias,Claude. "Development of a new device to perform torsional ultrasonic fatigue testing.“ International Journal of Fatigue, Volume 29, Issues 9–11, Sep–Nov 2007, Pages 2094–2101

Some issues with ultrasonic fatigue testing
Data from slower traditional testing may not match over the same range when done ultrasonically
Temperature of the sample goes up rapidly in ultrasonic testing—for megacycle fatigue tests, not gigacycles
Temperature must be monitored and the test stopped when it exceeds a given value, or continuous cooling must be supplied
Samples with a free end are tested at R=-1, fully reversed stress
To modify the stress cycle for other values of R you need a cone and transducer at both ends of the sample
19

Ultrasonic fatigue testing issues cont’d Sample shapes and cones must be designed with FEA
to create shapes with the right natural frequencies to achieve resonance in the sample FFTs can be used to scan the device to determine the
natural frequencies
Temperature variations cause changes in the natural frequency of the sample Feedback loops must be used on the frequency to keep
the stress constant
Some machines measure the displacement with strain gages, some with laser transducers Strain gages are very sensitive to temperature changes
20
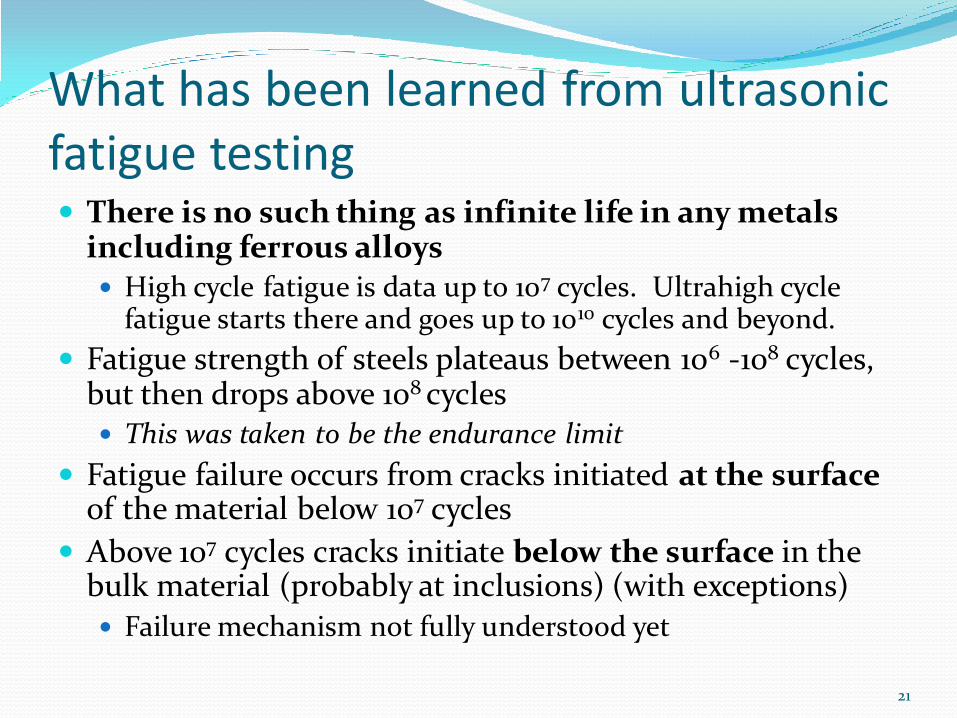
What has been learned from ultrasonic fatigue testing There is no such thing as infinite life in any metals
including ferrous alloys High cycle fatigue is data up to 107 cycles. Ultrahigh cycle
fatigue starts there and goes up to 1010 cycles and beyond.
Fatigue strength of steels plateaus between 106 -108 cycles, but then drops above 108 cycles This was taken to be the endurance limit
Fatigue failure occurs from cracks initiated at the surface of the material below 107 cycles
Above 107 cycles cracks initiate below the surface in the bulk material (probably at inclusions) (with exceptions) Failure mechanism not fully understood yet
21
22
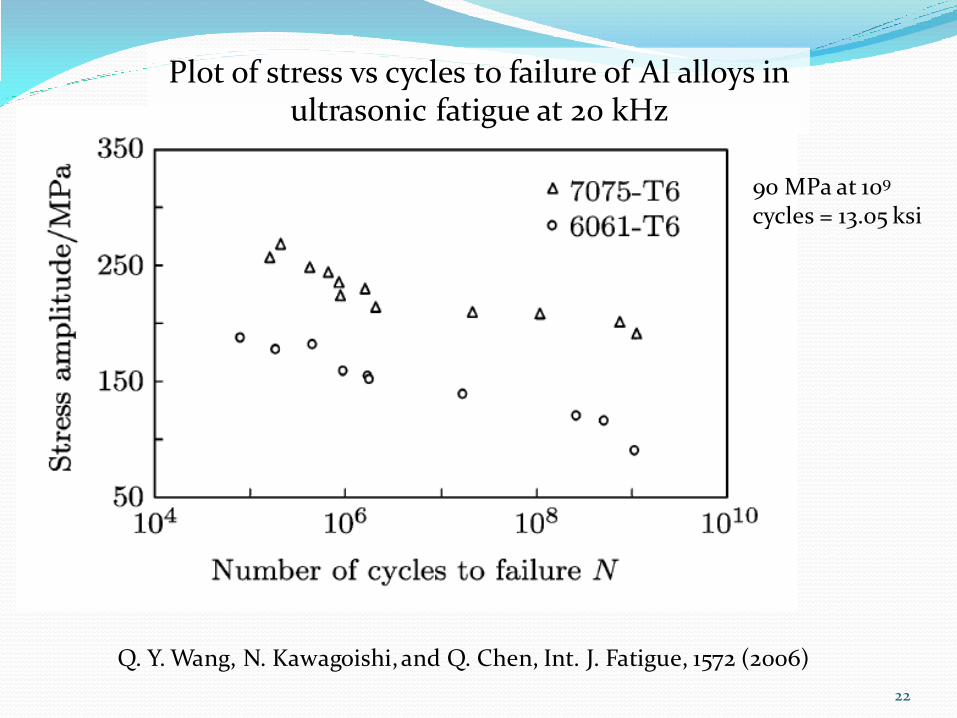
Q. Y. Wang, N. Kawagoishi, and Q. Chen, Int. J. Fatigue, 1572 (2006)
Plot of stress vs cycles to failure of Al alloys in ultrasonic fatigue at 20 kHz
90 MPa at 109 cycles = 13.05 ksi

Comments about ultrasonic test data
There are only a few data points so it is difficult to create a statistical model with the data shown
Given how easy it is to set up ultrasonic fatigue testing, we (the horn community) should be running these tests to create a better data set
Not enough attention has been paid to Al 6061 yet in the ultrasonic testing literature
Striplines are made from Al 6101 so that material needs testing too
23

Where Gigacycle fatigue is relevant to horns today MiniBooNE is still running
MicroBooNE uses the same beam line and horn
MicroBooNE is approved to run for 2-3 years, 6.6E20 POT
The MiniBooNE target hall is now called the “Booster Neutrino Beam” (BNB) target hall
The BNB will be run for many years from now
The target hall total system has already seen .48 Gigacycles of pulsing from the power supply to the horn Would be more but it’s been shut down since 4/12 until spring 2013.
European projects like Euronu want to run at 50 Hz!!
24

25
View of the horn installed in MI-12
Power supply Permanent
striplines
Walls of the underground enclosure rendered transparent, shielding blocks invisible
Horn
Floor level of MI-12 surface
building
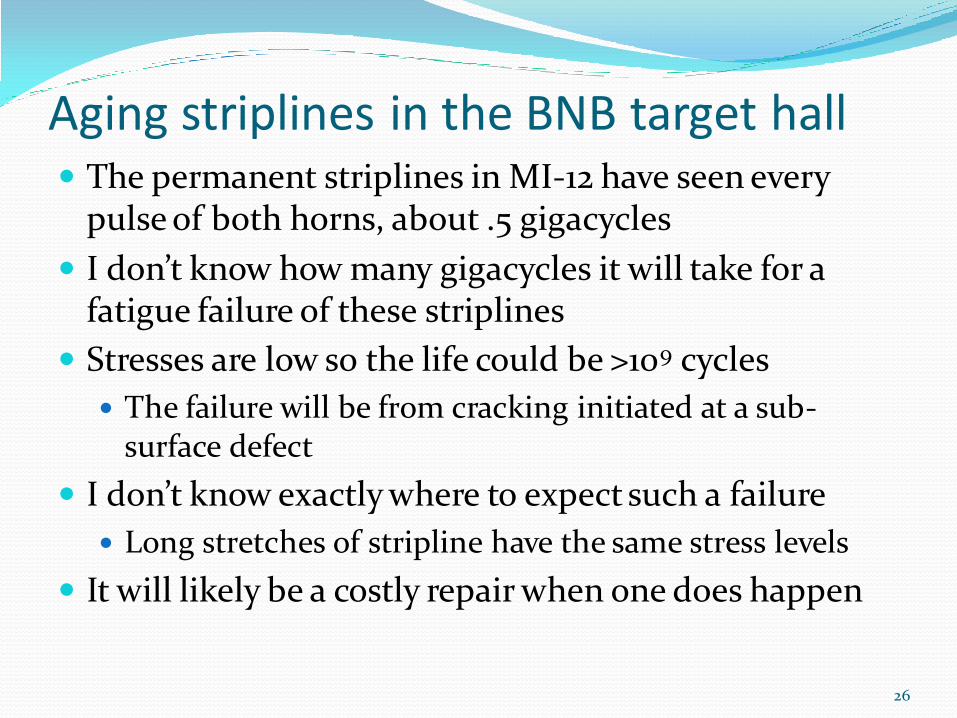
Aging striplines in the BNB target hall The permanent striplines in MI-12 have seen every
pulse of both horns, about .5 gigacycles
I don’t know how many gigacycles it will take for a fatigue failure of these striplines
Stresses are low so the life could be >109 cycles
The failure will be from cracking initiated at a sub-surface defect
I don’t know exactly where to expect such a failure
Long stretches of stripline have the same stress levels
It will likely be a costly repair when one does happen
26

Future Horn applications
27 http://dpnc.unige.ch/users/blondel/fondsnational/report3abnu.pdf
A 50 Hz horn designed by Stephane Rangod for a neutrino factory

28 http://www.comsol.com/cd/direct/conf/2012/papers/12068/12561_lepers_paper.pdf
Newer concept for a 4 horn system operating at 12.5 Hz based on the MiniBooNE horn design
Final comments We were not limited by aluminum in the design of the
MiniBooNE horn, we were limited by the data we had about aluminum
The material has proved to be better than we thought
The first MiniBooNE horn failure was not fatigue related at all, but corrosion related
We must be even more careful in the design of auxiliary systems because they can kill a horn before fatigue will
We should be expanding the fatigue data set for the materials we are interested in
29

Backup slides
30

Sources of Fatigue Data for AL 6061-T6 used in the MiniBooNE analysis
MIL-SPEC Handbook #5, Metallic Materials and Elements for Aerospace Vehicles
ASM Metals Handbook Desk Edition
ASM Handbook Vol. 19, Fatigue and Fracture
“Aluminum and Aluminum Alloys”, pub. by ASM
“Atlas of Fatigue Curves”, pub. by ASM
“Fatigue Design of Aluminum Components and Structures”, Sharp, Nordmark and Menzemer
31
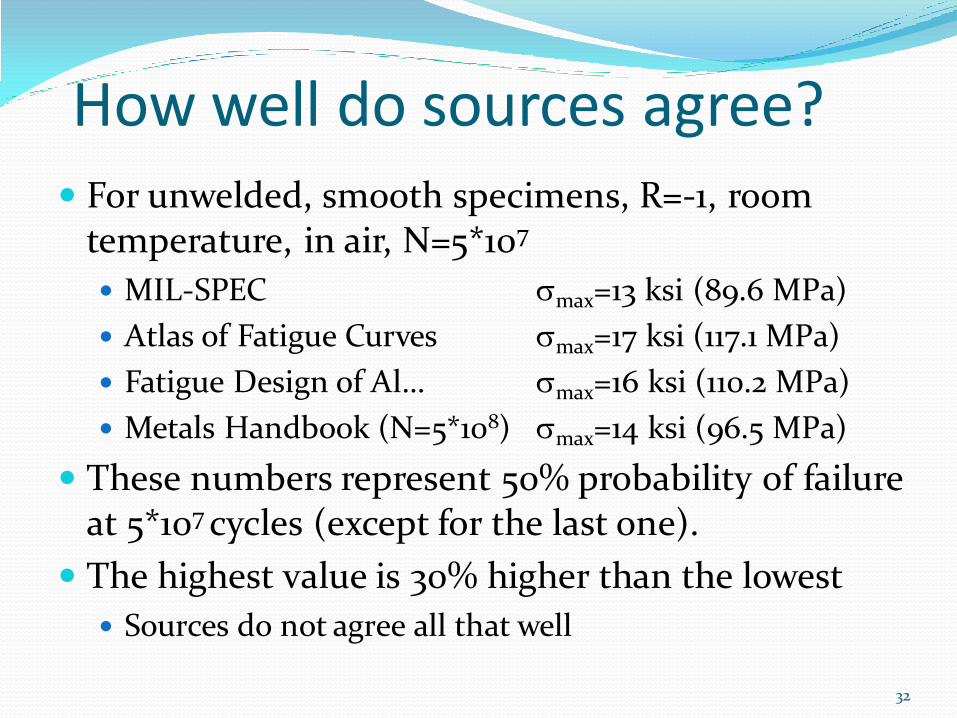
How well do sources agree? For unwelded, smooth specimens, R=-1, room
temperature, in air, N=5*107
MIL-SPEC smax=13 ksi (89.6 MPa)
Atlas of Fatigue Curves smax=17 ksi (117.1 MPa)
Fatigue Design of Al… smax=16 ksi (110.2 MPa)
Metals Handbook (N=5*108) smax=14 ksi (96.5 MPa)
These numbers represent 50% probability of failure at 5*107 cycles (except for the last one).
The highest value is 30% higher than the lowest
Sources do not agree all that well
32

Determining the allowable stress To be sure that the horn would last to at least 200
Megacycles we compared the calculated stress from the FEA for every element in the model to an allowable stress: Scalc ≤ Sallow
The allowable stress was calculated by multiplying modifying factors to a base stress level because the fatigue strength changes with varying conditions of stress and environment This method is outlined in Shigley’s “Mechanical Engineering Design”
Sallow = Seq*fR*fmoisture*fweld
Seq = 10 ksi (68.9 MPa) (from the statistical analysis shown later)
33

Effects that lower fatigue strength, 1: stress ratio
The stress ratio influences fatigue strength: Stress Ratio, R, is defined as the ratio of the
minimum to maximum stress. Tension is positive, compression is negative
R=Smin/Smax varies from -1R1
R = -1 alternating stress) smax=16 ksi
R = 0 Smin=0) smax=24 ksi, (1.5X at R=-1)
R = .5 smax=37 ksi, (2.3X at R=-1)
These values are for N=107 cycles, 50% confidence
Stress ratio is a variable modifier to maximum stress. Whole stress cycle must be known. We used a large spreadsheet to calculate R for every
element in the FE model
34

This is the page from the MIL-
SPEC handbook that was used
for the statistical analysis of the
scatter in fatigue test data.
The analytical model assumes
that all test data regardless of
R can be plotted as a straight
line on a log-log plot after all
the data points are corrected
for R.
The biggest problem with this
data presentation style is that
the trend lines represent 50%
confidence at a given life and
we needed >95% confidence of
ability to reach 200 x 106
cycles.
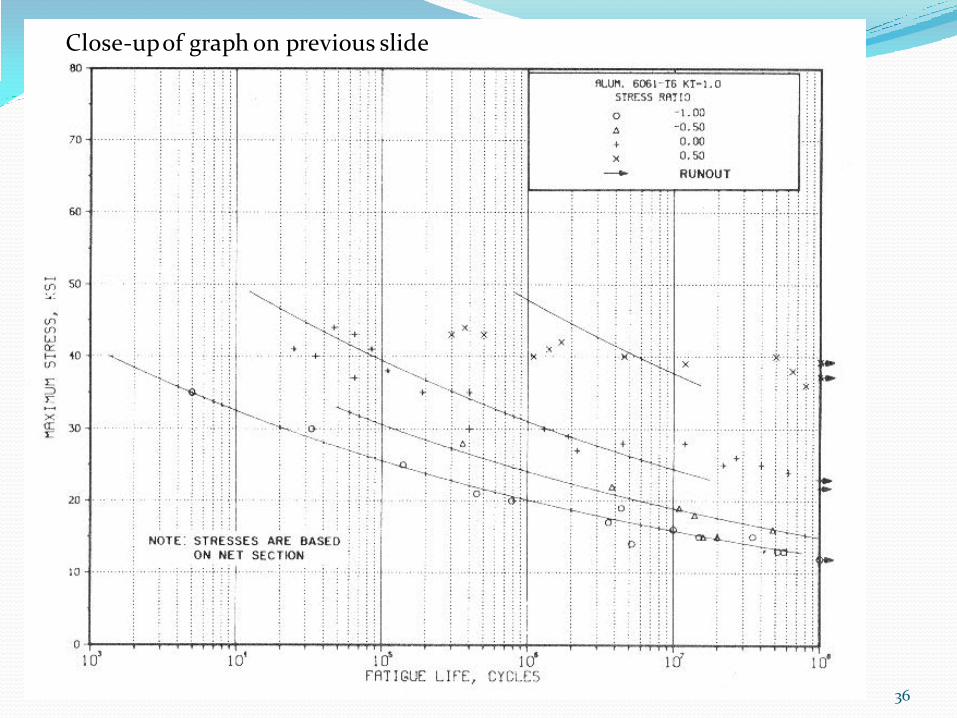
MIL-SPEC Data Showing Effect of R
35
36
Close-up of graph on previous slide
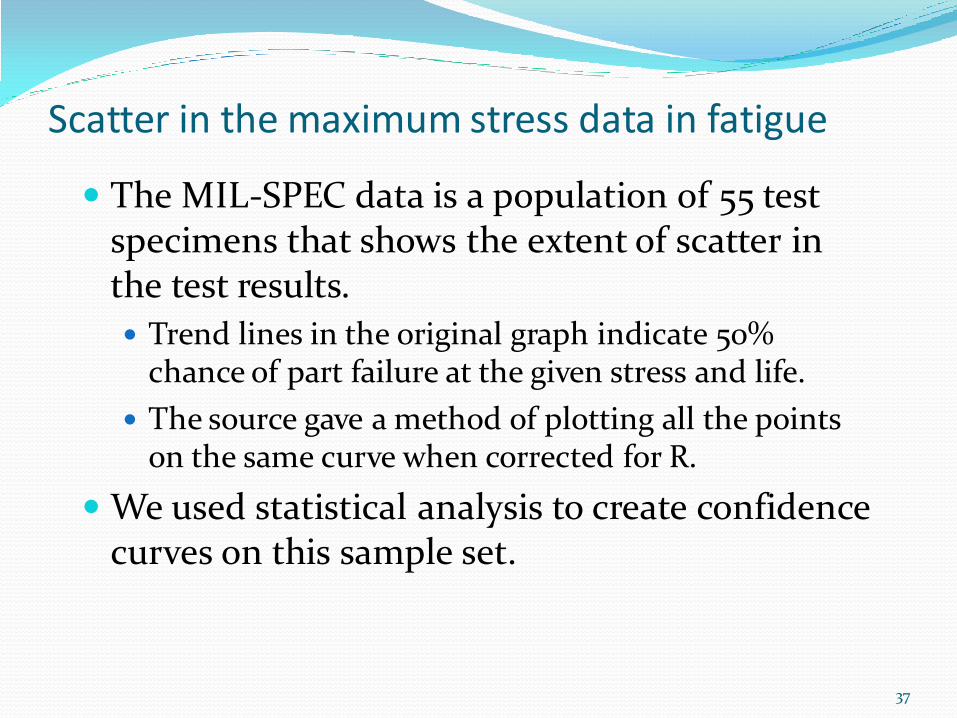
Scatter in the maximum stress data in fatigue
The MIL-SPEC data is a population of 55 test specimens that shows the extent of scatter in the test results.
Trend lines in the original graph indicate 50% chance of part failure at the given stress and life.
The source gave a method of plotting all the points on the same curve when corrected for R.
We used statistical analysis to create confidence curves on this sample set.
37

Stress/ Cycle Confidence Contours (97.5%, 94.9%, 75%, 50%, 25%)
Seq : Sm ax*(1-R)^0.63
Nf
1.0E+03
1.0E+04
1.0E+05
1.0E+06
1.0E+07
1.0E+08
1.0E+09
0 10 20 30 40 50 60 70
R M Laszew ski 22 Sep tember 1999
This graph plots all
of the MIL-SPEC
data points
corrected for R by
the equation at
bottom. The y axis
is number of cycles
to failure, the x
axis is equivalent
stress in ksi.
From this graph
we concluded
that the
equivalent stress
for >97.5%
confidence at 2e8
cycles was 10 ksi.
Confidence Curves on Equivalent Stress data plot
38

Calculation of stress ratio correction factor:
First correction is for R, stress ratio We determined that the minimum stress was
thermal stress alone after the horn cooled between pulses just before the next pulse.
Maximum stress happened at time in cycle when magnetic forces and temperature were peaked “simultaneously” (some manual adding here)
R was calculated by taking the ratio in every horn element in the FEA of the maximum principal normal stresses at these two points in time
Smax = Seq/(1-R).63 therefore: fR = 1 /(1-R).63
39
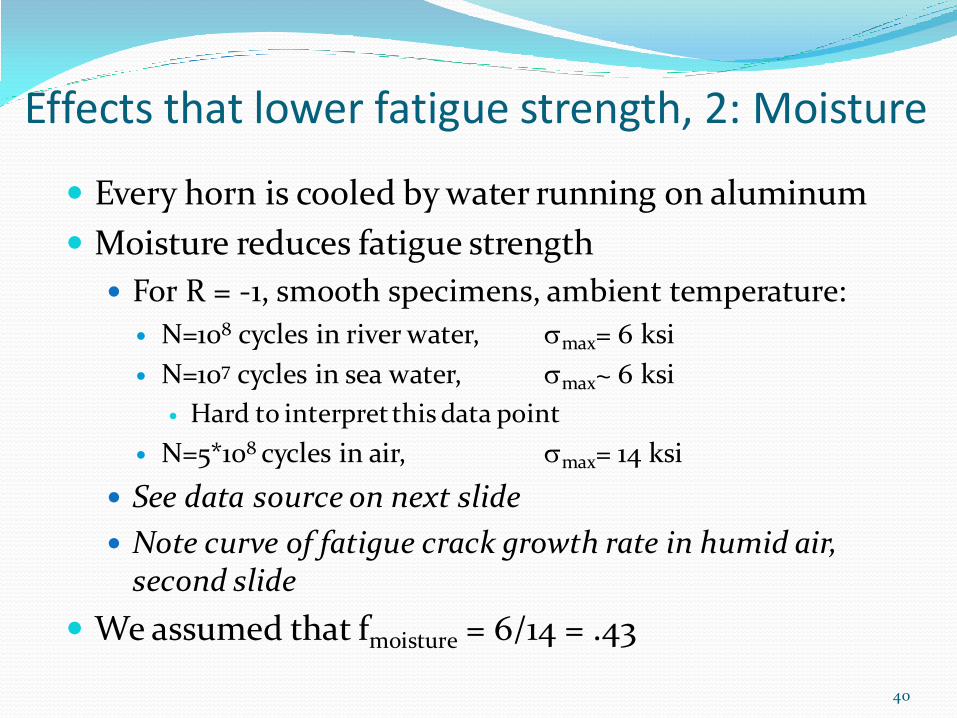
Effects that lower fatigue strength, 2: Moisture
Every horn is cooled by water running on aluminum
Moisture reduces fatigue strength
For R = -1, smooth specimens, ambient temperature:
N=108 cycles in river water, smax= 6 ksi
N=107 cycles in sea water, smax~ 6 ksi
Hard to interpret this data point
N=5*108 cycles in air, smax= 14 ksi
See data source on next slide
Note curve of fatigue crack growth rate in humid air, second slide
We assumed that fmoisture = 6/14 = .43
40
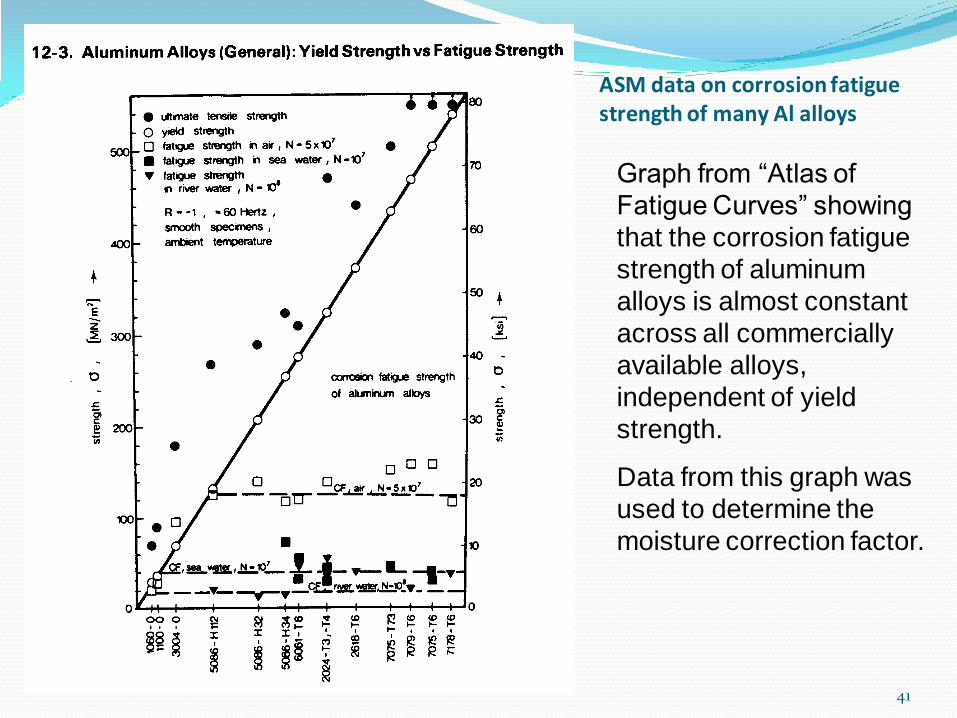
Graph from “Atlas of
Fatigue Curves” showing
that the corrosion fatigue
strength of aluminum
alloys is almost constant
across all commercially
available alloys,
independent of yield
strength.
Data from this graph was
used to determine the
moisture correction factor.
ASM data on corrosion fatigue strength of many Al alloys
41

Graph from “Atlas of Fatigue
Curves”
This graph is for a different
alloy than we are using, but
the assumption is that
moisture probably increases
the fatigue crack growth rate
for 6061 also.
It was considered prudent to
correct the maximum stress
for moisture based on this
curve and the preceding
one.
ASM data on effect of moisture on fatigue crack growth rate
42
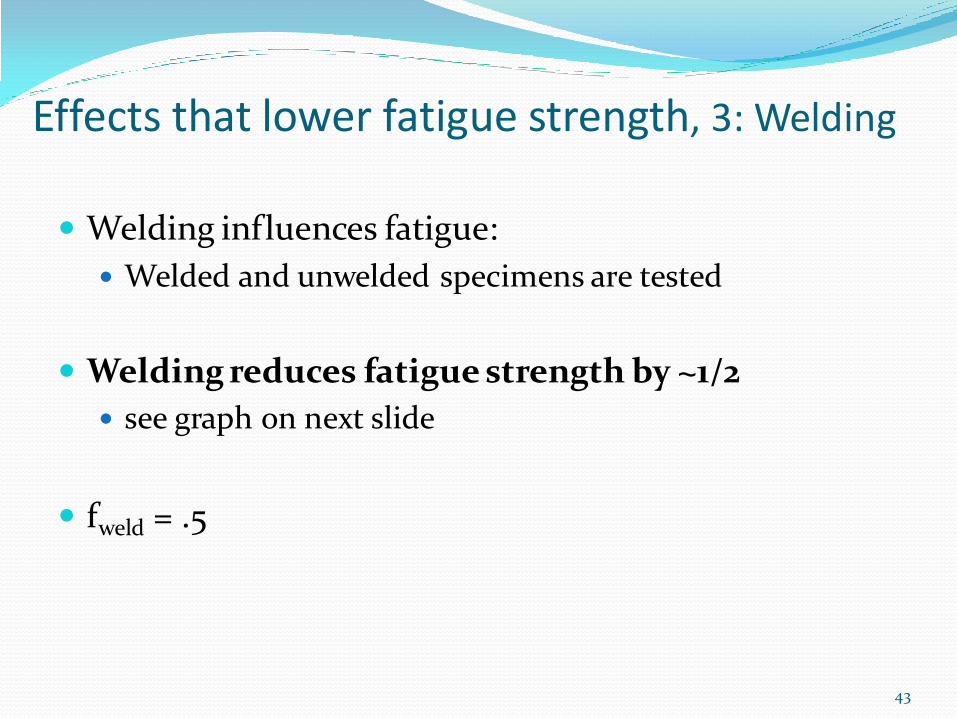
Effects that lower fatigue strength, 3: Welding
Welding influences fatigue:
Welded and unwelded specimens are tested
Welding reduces fatigue strength by ~1/2
see graph on next slide
fweld = .5
43

Graph from Atlas of Fatigue Curves
ASM data showing effect of welding
44

Effects that lower fatigue strength, 4: Notches
Geometry influences fatigue: Tests are done on “smooth” specimens and “notched”
specimens
Smooth specimens have no discontinuities in shape
Notched specimens have a standard shaped discontinuity to create a stress riser in the material
Notches reduce fatigue strength by ~1/2 see graph on next slide
We design inner conductors to be as notch-free as possible so there is no notch correction in our calculation of allowable stress (fnotches = 1.0)
45

Graph from Atlas of Fatigue Curves
ASM data showing effect of notches on fatigue strength
46

Effects of Plating and coating (from NuMI experience) Anodizing reduces the fatigue strength of aluminum
by 60% The thickened oxide layer appears to offer more crack
initiation sites
Anodizing is only used on NuMI outer conductors for insulation Fatigue is not an issue on these because of their thickness
Electroless nickel increases the fatigue strength NuMI inner conductors are nickel plated
Multiple effects may contribute to this increase The nickel may prevent the water from lubricating cracks
47

Effect of resonance MiniBooNE has a fast pulse structure
10 pulses separated by 1/15 sec (15 Hz), then off until the start of the next pulse train
Pulse trains start on a 2 second cycle
We needed to understand the natural frequency of the horn structure to make sure that pulses damped out before the next pulse train started If the pulses happen at the natural frequency of the
inner conductor resonance will cause the stress to go way up and the fatigue life will suffer
Modal analysis of the MiniBooNE horn indicated no benefit from bracing the inner conductor with spiders
48