Embed Size (px)
Citation preview
JETP Letters, Vol. 78, No. 12, 2003, pp. 745–750. Translated from Pis’ma v Zhurnal Éksperimental’no
œ
i Teoretichesko
œ
Fiziki, Vol. 78, No. 12, 2003, pp. 1265–1270.Original Russian Text Copyright © 2003 by Glushkov.
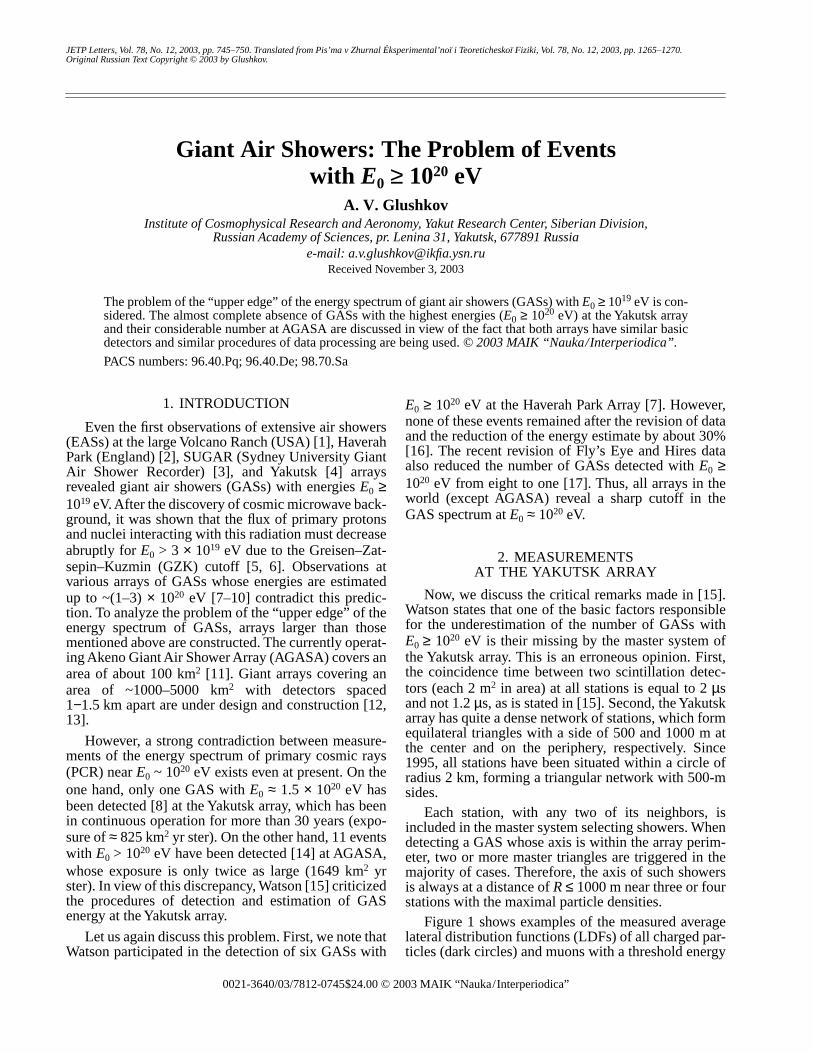
Giant Air Showers: The Problem of Events with E0 ≥ 1020 eV
A. V. GlushkovInstitute of Cosmophysical Research and Aeronomy, Yakut Research Center, Siberian Division,
Russian Academy of Sciences, pr. Lenina 31, Yakutsk, 677891 Russiae-mail: [email protected]
Received November 3, 2003
The problem of the “upper edge” of the energy spectrum of giant air showers (GASs) with E0 ≥ 1019 eV is con-sidered. The almost complete absence of GASs with the highest energies (E0 ≥ 1020 eV) at the Yakutsk arrayand their considerable number at AGASA are discussed in view of the fact that both arrays have similar basicdetectors and similar procedures of data processing are being used. © 2003 MAIK “Nauka/Interperiodica”.
PACS numbers: 96.40.Pq; 96.40.De; 98.70.Sa
1. INTRODUCTION
Even the first observations of extensive air showers(EASs) at the large Volcano Ranch (USA) [1], HaverahPark (England) [2], SUGAR (Sydney University GiantAir Shower Recorder) [3], and Yakutsk [4] arraysrevealed giant air showers (GASs) with energies E0 ≥1019 eV. After the discovery of cosmic microwave back-ground, it was shown that the flux of primary protonsand nuclei interacting with this radiation must decreaseabruptly for E0 > 3 × 10¹⁹ eV due to the Greisen–Zat-sepin–Kuzmin (GZK) cutoff [5, 6]. Observations atvarious arrays of GASs whose energies are estimatedup to ~(1–3) × 1020 eV [7–10] contradict this predic-tion. To analyze the problem of the “upper edge” of theenergy spectrum of GASs, arrays larger than thosementioned above are constructed. The currently operat-ing Akeno Giant Air Shower Array (AGASA) covers anarea of about 100 km2 [11]. Giant arrays covering anarea of ~1000–5000 km2 with detectors spaced1−1.5 km apart are under design and construction [12,13].
However, a strong contradiction between measure-ments of the energy spectrum of primary cosmic rays(PCR) near E0 ~ 1020 eV exists even at present. On theone hand, only one GAS with E0 ≈ 1.5 × 10²⁰ eV hasbeen detected [8] at the Yakutsk array, which has beenin continuous operation for more than 30 years (expo-sure of ≈ 825 km2 yr ster). On the other hand, 11 eventswith E0 > 1020 eV have been detected [14] at AGASA,whose exposure is only twice as large (1649 km2 yrster). In view of this discrepancy, Watson [15] criticizedthe procedures of detection and estimation of GASenergy at the Yakutsk array.
Let us again discuss this problem. First, we note thatWatson participated in the detection of six GASs with
0021-3640/03/7812- $24.00 © 20745
E0 ≥ 1020 eV at the Haverah Park Array [7]. However,none of these events remained after the revision of dataand the reduction of the energy estimate by about 30%[16]. The recent revision of Fly’s Eye and Hires dataalso reduced the number of GASs detected with E0 ≥1020 eV from eight to one [17]. Thus, all arrays in theworld (except AGASA) reveal a sharp cutoff in theGAS spectrum at E0 ≈ 1020 eV.
2. MEASUREMENTSAT THE YAKUTSK ARRAY
Now, we discuss the critical remarks made in [15].Watson states that one of the basic factors responsiblefor the underestimation of the number of GASs withE0 ≥ 1020 eV is their missing by the master system ofthe Yakutsk array. This is an erroneous opinion. First,the coincidence time between two scintillation detec-tors (each 2 m2 in area) at all stations is equal to 2 µsand not 1.2 µs, as is stated in [15]. Second, the Yakutskarray has quite a dense network of stations, which formequilateral triangles with a side of 500 and 1000 m atthe center and on the periphery, respectively. Since1995, all stations have been situated within a circle ofradius 2 km, forming a triangular network with 500-msides.
Each station, with any two of its neighbors, isincluded in the master system selecting showers. Whendetecting a GAS whose axis is within the array perim-eter, two or more master triangles are triggered in themajority of cases. Therefore, the axis of such showersis always at a distance of R ≤ 1000 m near three or fourstations with the maximal particle densities.
Figure 1 shows examples of the measured averagelateral distribution functions (LDFs) of all charged par-ticles (dark circles) and muons with a threshold energy
003 MAIK “Nauka/Interperiodica”

746
GLUSHKOV
of Eµ ≥ 1 GeV (light circles) in GASs with E0 = 2 ×10¹⁹ eV and ⟨cosθ⟩ = 0.98, 0.78, and 0.58 [18]. Solidcurves 1 and 2 describe the corresponding approxima-
Fig. 1. Lateral distributions of all charged particles (darkcircles) and muons (light circles) with threshold energies ofEµ ≈ 1.0secθ GeV in showers with E0 = 2 × 10¹⁹ eV and⟨cosθ⟩ ≥ 0.98 (a), 0.78 (b), and 0.58 (c). Curves 1 and 2 arerespective approximations (1) and (2) of the experimentaldata.
tions
(1)
with bs = 3.19, 2.67, and 2.15, and
(2)
with bµ = 1.92, 2.07, and 1.32 for three zenith angles,respectively. Here, RM is the Moliere radius (RM = 70 mfor Yakutsk).
It can be seen in Fig. 1a that the density of chargedparticles in nearly vertical GASs is equal to about 10 m–2
at a distance of R ≈ 1000 m. Therefore, about 20 parti-cles pass through each detector. The probability thattwo detectors at a station do not display a coincidenceover 2 µs is no higher than 10–6 for this particle density.In showers with E0 ≈ 1020 eV, the particle density at thisdistance is larger by a factor of about five; i.e., it isequal to about 50 m–2. This circumstance rules out anypossibility that the master system of the Yakutsk arraydoes not respond.
Watson [15] states that the second cause for under-estimating the number of GASs with E0 ≥ 1020 eV at theYakutsk array is the insufficient time of signal integra-tion by amplitude converters at the stations. In his opin-ion, this leads to underestimation of the value ofρs, 600(θ) by about 25%. Accordingly, energy E0 isunderestimated by a factor of 1.25.
This is also an erroneous opinion. The largest GASwas detected at the Yakutsk array at an angle of θ =58.7° [8]. It consisted almost completely of muons. Thepulse whose shape was measured at the output of one ofthe standard ground-based scintillation detectors at adistance of R = 930 m from the axis had an FWHM ofT1/2 ≈ 200 ns. This result agrees with the measurementsof the pulse shape at Pierre Auger Observatory [19],where T1/2 ≈ 200 ns was also obtained at the output ofthe water Cherenkov tank for a GAS with E0 ≈ (2–3) ×1019 eV and θ = 54° at a distance of R = 977 m from theaxis. The full width of this signal was equal to about400 ns. According to the AGASA data [20] and calcu-lations [21], the thickness of the disk for vertical show-ers at distances R ≈ 1000–2000 m is about twice aslarge as that for inclined showers due to the addition ofelectrons to muons. Hence, it follows that the effectivethickness of the disk (95% of all particles) at sea levelin a GAS with E0 ≈ 1020 eV at a distance of R ≈ 1000 mfrom the axis is equal to T0.95 ≈ 800 ns.
We note that analysis of the time structure of theGAS disk at the Haverah Park Array [22] leads to thesame conclusion. The Haverah Park and Yakutsk arrays
f s R( ) ρs 600, R/600( ) 1.3–=
× R RM+( )/ 600 RM+( )( )1.3 bs–
× R 2000+( )/2600( ) 3.5–
f µ R( ) ρµ 600, R/600( ) 0.75– R 280+( )/880( )0.75 bµ–
=
× R 2000+( )/2600( ) 8.0–
JETP LETTERS Vol. 78 No. 12 2003

GIANT AIR SHOWERS 747
are situated at approximately the same altitude. Knappet al. [22] measured a time of about 260 ns (for 10 to50% of the total charge) in a GAS with E0 ≈ 6 × 10¹⁹ eVand θ = 30° at a distance of R = 1029 m from the axis.This time corresponds to the effective disk thicknessT0.95 ≈ 1250 ns. Therefore, the thickness of the showerdisk of all particles in a GAS with E0 ≈ (2–6) × 1019 eVlies in the interval 0.8–1.2 µs (1 µs on the average) at adistance of R ≈ 1000 m from the axis.
Amplitude signals are measured at the Yakutsk arrayby using logarithmic RC converters (R and C are theresistance and capacitance of the input circuit, respec-tively) with a time integration constant of τ = RC ≈ 10–12 µs of the input signal U,
(3)
Calculations [23] show that, when ten or more particlesfall onto the detector, the input-signal transfer ratio isequal to k = U/U0 ≈ 1 + d/τ (U0 is the amplitude of theunperturbed signal and d is the half-width of the showerdisk). In the case under consideration, d ≈ 0.5 µs andk ≤ 1.05. In this case, the density of charged particles ishardly underestimated at distances R ≤ 1000 m, themore so for measurement of ρs, 600.
3. MEASUREMENTS AT AGASAThus, it has apparently been established that GASs
with E0 ≥ 1020 eV are virtually absent according to thedata from the Yakutsk and other world arrays. In viewof this circumstance, let us revise the procedure ofdetermining the energy of a GAS at AGASA. As wepreviously reported [18, 24–26], showers with E0 ≥(3−5) × 1018 eV evolve differently than those withlower energies. This statement refers particularly toultrahigh-energy GASs, whose spatial structurechanges significantly.
For a deeper insight into the problem, we comparethe LDFs obtained at the Yakutsk array and at AGASA.First, we consider the zenith-angle distributions ofparameters ρs, 600(θ) and ρµ, 600(θ) that are used to esti-mate energy E0 at both arrays. These distributions areshown in Fig. 2 for events with E0 = (a) 2 × 10¹⁸, (b) 1019,and (c) 3 × 10¹⁹ eV detected at the Yakutsk array (darksymbols) and AGASA (light symbols). The solid anddashed curves are theoretical LDFs for (1) charged par-ticles and (2) muons for both arrays. Calculations werecarried out in the QGSJET model for primary protons[26]. The Yakutsk data and all calculated values wereobtained from average LDFs. Experimental values ofρs, 600(θ) distributions were obtained at AGASA by themethod of equal-intensity lines [27], and the ρµ, 600(θ)distributions for this array refer to muons with a thresh-old of Eµ ≈ 1.0 secθ GeV [28].
It can be seen that all experimental data for E0 = 2 ×10¹⁸ eV (Fig. 2a) agree with the results of calculations.No such agreement is observed for GASs. The Yakutsk
U t/τ–( ).exp∼
JETP LETTERS Vol. 78 No. 12 2003
data show that the energies measured for E0 = 1019 eVexceed the calculated values by a factor of ~1.25(Fig. 2b). Stronger changes are observed for ρµ, 600(θ)distributions (dot-and-dash curve), which coincide withρs, 600(θ) for inclined events (θ ≥ 52°). In contrast,AGASA data exhibit a tendency to underestimation ofthe experimental ρs, 600(θ) distributions by a factor of~1.25 in the zenith-angle range 35°–50°.
The aforementioned anomaly in the development ofGASs is enhanced rapidly with an increase in theenergy of primary cosmic rays. This is clearly seen inFig. 2c for showers with E0 = 3 × 10¹⁹ eV. All experi-mental data completely contradict the predictions of theQGSJET model. This contradiction is not associatedwith the relatively low statistics of events. The changein the values of ρµ, 600(θ), which begins to show in theYakutsk data (dot-and-dash curve 2), is enhanced fur-ther and reaches the triple increase as compared to cal-culations for θ ≥ 35°. Experimental values of ρs, 600(θ)
Fig. 2. Parameter ρ600 for charged particles (1) and muons (2)
vs. secθ for E0 = (a) 2 × 10¹⁸, (b) 1019, and (c) 3 × 10¹⁹ eVdetected at the Yakutsk array (dark symbols) and AGASA(light circles [27] and triangles [28]). The solid and dashedcurves are calculated in the QGSJET model for primaryprotons [26] for the Yakutsk array and AGASA, respec-tively.

748 GLUSHKOV
in nearly vertical GASs exceed the calculated values bya factor of ~1.4 and coincide with ρµ, 600(θ) for θ ≥ 45°.The AGASA data for ρs, 600(θ) in the region of θ ≤ 30°are also larger than the calculated values by a factor of1.4, decrease rapidly for more inclined showers, aresmaller than the results of calculations for θ ≥ 37° by afactor of 1.4, and coincide with the Yakutsk data forθ ≥ 45°.
Therefore, only muons with an energy of Eµ ≥1.5 GeV are detected in these showers at the indicateddistance from the axis for θ ≥ 45°. There are no softermuons or, the more so, electrons in these showers. Theabove tendency will apparently be further enhancedwhen the energy of GASs approaches the limitingvalue. The disregard of this circumstance probablyleads to large errors in estimates of E0.
Fig. 3. Cascade curve for GASs with E0 = 1.3 × 10¹⁹ (a) and
3.3 × 10¹⁹ eV (b) obtained at the Pierre Auger Observatory[29].
Num
ber
of p
artic
les
Let us now focus special attention on certain impor-tant details in Fig. 2c. For secθ ≤ 1.2, the ρs, 600(θ) dis-tributions measured at both arrays are larger than theo-retical values by a factor of about 1.5, while theAGASA data for the ρµ, 600(θ) distribution are smallerthan theoretical values by a factor of 1.7. For the lateraldevelopment of GASs, this can mean that the maximumof the cascade curve is in an anomalously deep posi-tion. This assumption is corroborated by the experi-mental data shown in Fig. 3 for GASs with E0 = 1.3 ×10¹⁹ (a) and 3.3 × 10¹⁹ eV (b), which were obtained atthe Pierre Auger Observatory [29]. It can be seen thatthe measured value Xm ≈ 950 g cm–2 is indeed largerthan the estimate Xm ≈ 790 g cm–2 in the QGSJETmodel for primary protons by ∆Xm ≈ 160 g cm–2. ForAGASA, situated at an altitude of 920 g cm–2, such asituation might be dramatic, because the depth, or max-imum, of the development of GASs for E0 ≈ 1020 eVlies directly in the array plane (or below it). In this case,to interpret experimental data, it is necessary to use cal-culations differing from those previously used forEASs with lower energies.
We note one more interesting feature of the datashown in Fig. 2c. It is seen that all experimentalρs, 600(θ) distributions measured at the Yakutsk array lieabove the calculated curves but are parallel to them.The behavior of the AGASA data (light circles) is dif-ferent. They intersect theoretical curve 1. The increasein the values of ρs, 600(θ) in nearly vertical GASs (forsecθ ≤ 1.2) with respect to calculations is equal to a fac-tor of about 2.5 as compared to inclined events. Thedata in Fig. 2a do not show such a feature. This couldbe a purely methodical experimental error. In themethod of equal-intensity lines, which was used toobtain the aforementioned AGASA data, this situationlikely appears due to an uncontrolled increase inρs, 600(θ) upon a transition from inclined events to verti-cal events.
We will show by an example of one of the largestAGASA showers how this can be explained. Dark cir-cles in Fig. 4a show the LDF of charged particles in aGAS with an energy of E0 ≈ (1.7–2.6) × 1020 eV and θ ≈23° [30]. The solid curve corresponds to the approxi-mation
(4)
with RM = 91.6 m and with the parameter
(5)
This approximation was used to find the coordinates ofthe shower axis (cross in Fig. 4b). Dark squares are themuon densities with a threshold of Eµ ≈ 1.0secθ GeV.Arrows indicate the saturation of detectors. The atmo-sphere depth for this event is equal to X = 920secθ ≈1000 g cm–2.
ρs R( )
∼ R/RM( ) 1.2– 1 R/RM+( )1.2 η– 1 R/1000( )2+( ) 0.6–
η 3.97 1.79 secθ 1–( ).–=
JETP LETTERS Vol. 78 No. 12 2003

GIANT AIR SHOWERS 749
Let us analyze the results obtained by processingdata with another, more convex, LDF (dot-and-dashcurve in Fig. 4a). As a result, the GAS axis noticeablyapproaches the detectors with maximal particle densi-ties: the axis approaches the first and second detectorswith the maximal particle numbers (23682 and 687,respectively) by about 120 (light circle) and 100 m,respectively. The axis moves away from the third detec-tor (357 particles) by about 30 m, and the indicatedcoordinate shift almost does not affect other points inFig. 4a. This reduces the value of ρs, 600(θ) = 892 m–2
Fig. 4. One of the largest AGASA showers with E0 ≈ (1.7–
2.6) × 1020 eV and θ ≈ 23° [30]: (a) LDF of charged parti-cles (dark circles) and muons (dark squares) with thresholdEµ ≈ 1.0secθ GeV, solid and dot-and-dash curves areapproximation (4) and our approximation; (b) density mapin the array plan, where the radii of circles are proportionalto density logarithm in the corresponding detectors; thecross is the position of the shower axis according to [30].
JETP LETTERS Vol. 78 No. 12 2003
obtained at AGASA by a factor of about 2.5. Accord-ingly; energy E0 decreases by the same factor.
The dot-and-dash curve in Fig. 4a is just our roughestimate, which is quite possible, however, because themajority of the densities of GASs at AGASA are mea-sured at distances R > 600 m. Previously in [18, 26] andin Fig. 2, we showed that the LDFs of charged particlesin GASs at the Yakutsk array change substantially. Letus consider the consequence of this fact for AGASA.We use the LDF shown in Fig. 1a (for an atmosphericdepth of X = 1040 g cm–2) and replace Moliere radiusRM = 70 by 91.6 m in approximation (1). The result isshown by the solid curve in Fig. 5. The dot-and-dashcurve in this figure is approximation (4) for the sameatmospheric depth (with the parameter η = 3.74 corre-sponding to Eq. (5) for secθ = 1.13 = 1040/920). Bothlines are normalized to each other for R = 1000 m.
It can be seen that the shapes of the LDFs in Fig. 5are almost undistinguishable for R ≈ 600–2000 m. Thisis additional evidence that the measurements of thedensities of charged particles at the Yakutsk array at theperiphery of GASs are not distorted. However, closer tothe axis, approximation (1) is more gently sloping thanapproximation (4). This tendency is likely enhancedrapidly as the energy of GASs approaches the maximalvalue. The situation is complicated by the fact that themaximum of the cascade curve is almost at the setuplevel, where many particles intersect scintillator detec-tors at distances R > 1000 m at very small angles to theirsurfaces. Under these conditions, the responses of thedetectors to particle fluxes can considerably differ fromthose for much lower energies of EASs.
4. CONCLUSIONS
The above discussion shows that an increase in thenumber of events with E0 ~ 1020 eV at the operating set-
Fig. 5. Lateral distribution function of charged particles inthe GAS with E0 = 2 × 10¹⁹ eV at the atmosphere depth X =
1040 g cm–2. Solid curve is approximation (1) with bs =3.19, cosθ = 0.98, and RM = 91.6 m; dot-and-dash curve isapproximation (4) with η = 3.74 (secθ = 1.13).

750 GLUSHKOV
ups or the construction of setups covering giant areas(1000–5000 km2) with detectors spaced 1–1.5 km [12,13] apart cannot help in solving the problem of attain-ment of maximal energies of GASs. In our opinion, anyextrapolation of both theoretical results (obtained forE0 ≤ (2–3) × 1018 eV) and experimental dependences tothis region is inadmissible. Such extrapolation canintroduce considerable errors in the estimates of theenergy of primary particles. In this case, the LDFs ofcharged particles and muons must be separately inves-tigated at arrays where detectors are spaced no morethan 200–300 m apart. Criticism [15] of the methods ofdetection and estimation of the energy of GASs at theYakutsk array can hardly be accepted. This criticism isprobably due to insufficient popularization of the tech-nical characteristics of the Yakutsk array in the litera-ture.
This study, which is carried out at Yakutsk EASarray, included in the “List of Unique Research andExperimental Setups of National Significance” underno. 01-30, is supported by the Ministry of Education ofthe Russian Federation.
REFERENCES
1. J. Linsley, Phys. Rev. Lett. 10, 146 (1963).2. D. M. Edge, A. C. Evans, H. J. Garmston, et al., J. Phys.
A 6, 1612 (1973).3. C. J. Bell et al., J. Phys. A 7, 990 (1974). 4. D. D. Krasilnikov, A. I. Kuzmin, J. Linsley, et al.,
J. Phys. A 7, 176 (1974). 5. K. Greisen, Phys. Rev. Lett. 2, 748 (1966).6. G. T. Zatsepin and V. A. Kuz’min, Pis’ma Zh. Éksp. Teor.
Fiz. 4, 78 (1966) [JETP Lett. 4, 53 (1966)].7. Catalog of Highest Energy Cosmic Rays Giant Extensive
Air Showers (World Data Center C2 for Cosmic Rays,Japan, 1980), No. 1.
8. N. N. Efimov, T. A. Egorov, A. V. Glushkov, et al., inProceedings of International Workshop of AstrophysicalAspects of the Most Energetic Cosmic Rays (Kofu,1990), p. 20.
9. N. Hayashida, K. Honda, M. Honda, et al., ICRR ReportNo. 324-94-19 (Tokyo, 1994).
10. D. J. Bird, S. C. Corbato, H. Y. Dai, et al., Astrophys. J.424, 491 (1994).
11. N. Chiba, K. Hashimoto, N. Hayashida, et al., Nucl.Instrum. Methods Phys. Res. A 311, 338 (1992).
12. J. C. Cronin et al., Preprint EHI 92-08 (Univ. of Chicago,1992).
13. M. Teshima, M. Bessho, H. Y. Dai, et al., in Proceedingsof RIKEN, International Workshop on Electromagneticand Nuclear Cascade Phenomena at High andExtremely High Energies (1993), p. 135.
14. M. Takeda, N. Sakaki, K. Honda, et al., in Proceedingsof 28th ICRC (Tsukuba, 2003), Vol. 1, p. 381.
15. A. A. Watson, in Proceedings of 28th ICRC (Tsukuba,2003), Vol. 1, p. 373.
16. M. Ave, J. A. Hinton, J. Knapp, et al., in Proceedings of27th ICRC (Hamburg, 2001), Vol. 1, p. 381.
17. T. Abu-Zayyad, G. Archbold, J. A. Bellido, et al.,astro-ph/0208243 (2002).
18. A. V. Glushkov, M. I. Pravdin, I. E. Sleptsov, et al., Yad.Fiz. 63, 1557 (2000) [Phys. At. Nucl. 63, 1477 (2000)].
19. J. Bluemer et al., in Proceedings of 28th ICRC (Tsukuba,2003), Vol. 1, p. 445.
20. K. Honda, K. Hashimoto, N. Kawasumi, et al., in Pro-ceedings of 28th ICRC (Tsukuba, 2003), Vol. 1, p. 361.
21. T. Suomijarvi et al., in Proceedings of 28th ICRC(Tsukuba, 2003), Vol. 1, p. 473.
22. M. Ave, J. Knapp, M. Marchesini, et al., in Proceedingsof 28th ICRC (Tsukuba, 2003), Vol. 1, p. 349.
23. A. N. Gadalov, A. V. Glushkov, T. A. Egorov, et al., inExperimental Methods for Studying Cosmic Rays ofExtremely High Energies (Yakutsk, 1974), p. 30.
24. A. V. Glushkov, I. T. Makarov, E. S. Nikiforova, et al.,Yad. Fiz. 58, 1265 (1995) [Phys. At. Nucl. 58, 1186(1995)].
25. A. V. Glushkov, I. T. Makarov, M. I. Pravdin, et al.,Pis’ma Zh. Éksp. Teor. Fiz. 71, 145 (2000) [JETP Lett.71, 97 (2000)].
26. A. V. Glushkov, M. I. Pravdin, I. E. Sleptsov, et al., Yad.Fiz. 65, 1346 (2002) [Phys. At. Nucl. 65, 1313 (2002)].
27. M. Nagano, D. Heck, S. Shinozaki, et al., PreprintNo. 6191, FZKA (Karlsruhe, 1998).
28. S. Yoshida, N. Hayashida, K. Honda, et al., J. Phys. G 20,651 (1994).
29. S. Argiro et al., in Proceedings of 28th ICRC (Tsukuba,2003), Vol. 1, p. 457.
30. N. Hayashida, K. Honda, M. Honda, et al., Phys. Rev.Lett. 73, 3491 (1994).
Translated by R. Tyapaev
JETP LETTERS Vol. 78 No. 12 2003