Embed Size (px)
Citation preview

GHG PROTOCOL
POLICY AND ACTION STANDARD
AN ACCOUNTING AND REPORTING STANDARD FOR
ESTIMATING THE GREENHOUSE GAS EFFECTS OF
POLICIES AND ACTIONS

• 450+ staff
• Issue areas:
– Climate
– Energy
– Food
– Forests
– Water
– Sustainable cities
About WRI

• The GHG Protocol sets the global standard for how to measure, manage, and report greenhouse gas emissions
• Convened in 1998 by WRI and WBCSD
• Provides:
– Greenhouse gas accounting and reporting standards
– Sector guidance
– Calculation tools
– Trainings (webinar, e-learning and in-person training)
• Standards and tools available free of charge at www.ghgprotocol.org
About the Greenhouse Gas Protocol

Greenhouse Gas Protocol standards
Corporate Standard Project Protocol Product Standard Corporate Value Chain
(Scope 3) Standard
Mitigation Goal
Standard
Policy and Action
Standard
Global Protocol for
Cities (GPC)

Relationship of different standards

New standards
How to estimate the
greenhouse gas effects of
policies and actions
How to assess progress toward
national or subnational GHG
emissions reduction goals

New standards can help answer:
• Are countries on track to meet their climate commitments?
• How effective are local or national policies to drive emissions reductions?
• Will countries’ actions add up to limit warming to under 2 degrees Celsius?
Source for carbon budget: IPCC AR5 Synthesis Report

Need for new standards
• New diversity of national and subnational GHG reduction goals (e.g., INDCs)
• New needs for estimating GHG effects of policies and actions (e.g., NAMAs)
• Lack of consistency and transparency in current approaches
• Lack of capacity
• No international guidelines until now

Standard development process
Secretariat (WRI)
Advisory Committee (30)
Technical Working Groups (80)
Review Group (130)
Pilot Testers (30)
• 270 participants in 40 countries; three year process

Pilot testing: 32 policies/goals in 20 countries/cities
US
Mexico
Costa Rica Colombia
Chile South Africa
Indonesia
Japan
South Korea
China
India
Bangladesh
Tunisia
UK Belgium Germany
Israel


• To help users assess the GHG effects of specific policies and actions in an accurate, consistent, transparent, complete, and relevant way
• To help policymakers develop effective strategies for managing and reducing GHG emissions
• To support consistent and transparent reporting of emissions impacts and policy effectiveness
• To create more international consistency and transparency in the way the GHG effects of policies and actions are estimated
Purpose of the standard

Before implementation:
What effect is a given policy or action likely to have on emissions
in the future?
During implementation: Is a given policy or action on track and delivering expected
results?
After implementation: What effect has a
given policy or action had on emissions?
When the standard can be used

Intended users
• Governments (city, sub-national, national)
• Donor agencies and financial institutions
• Businesses
• NGOs/research institutions
Applicability
• All types of policies/actions
• All countries
• Policies and actions that increase or decrease GHG emissions
• All sectors: AFOLU, energy supply, industry, residential and commercial buildings, transport, waste

Regulations and standards
Taxes Subsidies
Emissions trading programs
Voluntary agreements
Information instruments
Infrastructure programs
Implementation of new technologies,
processes, or practices
Financing and investment
Types of policies and actions

Types of policies and actions piloted
0 1 2 3 4 5 6 7 8
R&D policies
Implementation of new tech.
Financing and investment
Infrastructure programs
Voluntary agreements
Information instruments
Tradable permits
Subsidies and incentives
Regulations and standards

Sectors piloted
0 1 2 3 4 5 6 7 8 9 10 11
Waste
Transport
Industry
Energy supply
Buildings
AFOLU

Non-GHG effects (co-benefits) can be assessed

Overview of presentation Table of contents
1. Introduction
2. Objectives
3. Key concepts and overview of steps
4. Accounting and reporting principles
5. Define the policy or action
6. Identify effects and map the causal chain
7. Define the GHG assessment boundary
8. Estimate baseline emissions
9. Estimate GHG effects ex-ante
10. Monitor performance over time
11. Estimate GHG effects ex-post
12. Assess uncertainty
13. Verification
14. Reporting
1. Define objectives and define the policy or action
2. Identify effects
3. Estimate effects
4. Report results

Chapter 2 Objectives

• Inform policy selection and design by comparing policy options based on their expected GHG effects
• Evaluate policy effectiveness (and cost-effectiveness) in delivering intended results
• Report on GHG effects of policies and actions
• Attract and facilitate financial support for mitigation actions by estimating GHG reductions
Objectives of assessing policy/action impact

Chapter 5 Defining the policy or action

Overview of steps

Regulations and standards
Taxes Subsidies
Emissions trading programs
Voluntary agreements
Information instruments
Infrastructure programs
Implementation of new technologies,
processes, or practices
Financing and investment
Types of policies and actions

Clearly define the policy or action
The title of the policy or action
Type of policy or action
Description of specific interventions
The status of the policy or action
Date of implementation
Date of completion (if applicable)
Implementing entity or entities
Objective(s) of the policy or action
Geographic coverage
Primary sectors, subsectors, and emission source/sink categories targeted
Greenhouse gases targeted (if applicable)
Other related policies or actions
Overview
Timeline
Scope

• Users may assess either:
– An individual policy or action
– A package of related policies or actions
Assessing an individual policy/action or a package

Assess an individual
policy/action
Will the assessment be manageable if a package of
policies/actions is assessed?
Yes No
Assess a package of
related policies/actions
Assess an individual
policy/action
Are there significant interactions with
other related policies and actions?
No Yes
Do end-users want to know the impact of an individual
policy/action or a package of related policies/actions?
Individual Package

Choose ex-ante or ex-post assessment
Planned Adopted Implemented End date (if applicable)
Ex-ante assessment
Ex-post assessment
Ex-ante assessment: Estimating future GHG effects of policies and actions
Ex-post assessment: Estimating past GHG effects of policies and actions

Pilot example: combining ex-ante and ex-post
Belgium’s federal tax reduction for roof insulation

Overview of presentation
1. Define objectives and define the policy or action
2. Identify effects
3. Estimate effects
4. Report results

Chapter 6 Identifying Effects and Mapping the Causal Chain

Types of effects
• Users should consider all possible types of effects:
– In-jurisdiction and out-of-jurisdiction
– Short- and long term
– Intended and unintended
– Likely, possible, and unlikely
– GHG increasing and GHG decreasing

Example for public transit policy
Indicator types Short-term Long-term
Intended effects
• Reduced emissions from
private transport due to shift
to public transport
• Reduced trip
distances due to
people moving near
transit
Unintended effects
(Including rebound
effects)
• Increased emissions from
public transport due to
higher use
Out-of-jurisdiction
effects (Leakage and
spillover effects)
• Increased emissions from
manufacturing of public
transit vehicles

Mapping the causal chain

Example: Home insulation subsidy

Chapter 7 Defining the GHG Assessment Boundary

• In order to identify significant effects, users should assess each potential GHG effect in terms of both:
– The likelihood of each GHG effect occurring
– The relative magnitude of each GHG effect
Assessing significance

Assess likelihood of effects occurring
Source: Adapted from IPCC (2010).

• Effects should be categorized as major, moderate, or minor
• Based on approximation, not detailed calculation
Assessing relative magnitude of effects

Determine significance of effects

Example: Home insulation subsidy

Example: Summary of effects, sources/sinks and gases included

• Excluding significant effects may be necessary in certain cases based on limitations related to:
– Measurability or data availability
– Relevance to policy objectives and context
– User resources and capacity
• Where possible, instead of excluding significant effects, users should:
– Use simplified methods to estimate the effect
– Use proxy data to fill data gaps
Disclosing and justifying exclusions

Overview of presentation
1. Define objectives and define the policy or action
2. Identify effects
3. Estimate effects
4. Report results

Estimating GHG effects: Key concepts

• Attribution is difficult since GHG emissions can change due to a variety of factors, including:
– The policy/action being assessed
– Other policies/actions that affect the same emissions sources
– External factors, such as changes in GDP, energy prices, weather, etc.
Attributing changes in emissions to specific policies/actions

• Baseline scenario: A reference case that represents the events or conditions most likely to occur in the absence of the policy or action being assessed
• Policy scenario: A scenario that represents the events or conditions most likely to occur in the presence of the policy or action being assessed
– The same as the baseline scenario except that it includes the policy or action being assessed
Baseline scenario and policy scenario

Estimate baseline scenario emissions
Estimate policy scenario emissions
Subtract to estimate the GHG
effect
Basic steps

Estimating the GHG effect of a policy/action
Total change in GHG emissions resulting from the policy or action (t CO2e) = Total policy scenario emissions (t CO2e) – Total baseline scenario emissions (t CO2e)

Pilot example: German renewable energy law

Pilot example: Tunisia solar energy program

Ex-ante and ex-post assessment

• Data:
– Bottom-up data are measured, monitored, or collected
– Top-down data are macro-level statistics collected at the jurisdiction or sector level
• Methods:
– Bottom-up methods calculate or model the change in GHG emissions for each source, project, or entity affected by the policy or action, then aggregate
– Top-down methods use statistical methods
Bottom-up and top-down data and methods

A range of methods are available to estimate the GHG effect of policies
Choosing a level of accuracy
Level of
accuracy/
completeness
GHG assessment
boundary Estimation methods Data sources
Lower
Higher
Less complete
More complete
Less accurate
methods (e.g.,
simplified
approaches)
More accurate
methods (e.g.,
complex
approaches)
International default
data
Source-specific or
jurisdiction-specific
data

• Users should determine the desired level of accuracy and completeness of the GHG assessment based on a range of factors, including:
– Objectives of the assessment, intended uses of the results, and the level of accuracy and completeness required to meet stated objectives
– Relative significance of the policy or action being assessed
– Data availability
– Capacity, resources, and time available to carry out the assessment
Choosing a level of accuracy

Chapter 8 Estimating baseline emissions

Choose type of baseline comparison
• For ex-post assessment, two methods are available:
– Scenario method: A comparison of a baseline scenario with a policy scenario for the same group or region
– Comparison group method: A comparison of one group or region affected by the policy or action with an equivalent group or region that is not affected by the policy or action

Guidance for choosing the type of comparison

Scenario method: Defining the most likely baseline scenario
• Possible options include:
– The continuation of current technologies, practices, or conditions
– Discrete baseline alternatives, practices, technologies, or scenarios
– A performance standard or benchmark that is indicative of baseline trends

Defining the most likely baseline scenario
• The most likely scenario depends on drivers that would affect emissions in the absence of the policy or action being assessed
• Two types of drivers:
– Other policies or actions: Other policies, actions, and projects expected to affect the same emissions sources and sinks
– Non-policy drivers: Other conditions such as socioeconomic factors and market forces expected to affect the same emissions sources and sinks
• Should include drivers that are significant

Examples for non-policy drivers in the baseline scenario

Select a desired level of accuracy

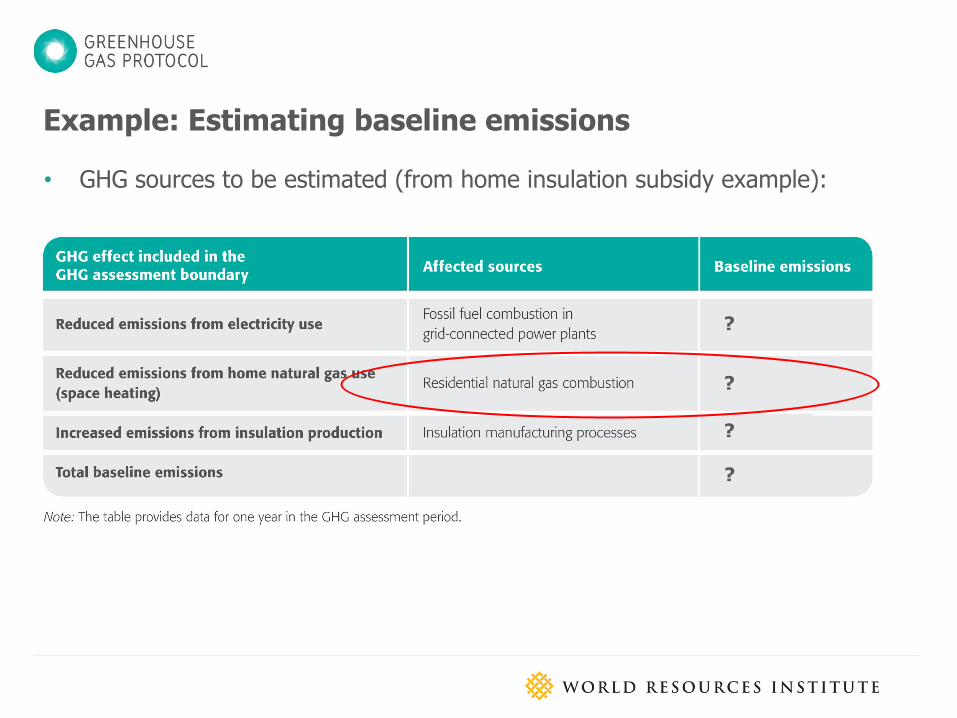
• GHG sources to be estimated (from home insulation subsidy example):
?
?
?
?
Example: Estimating baseline emissions
• GHG sources to be estimated (from home insulation subsidy example):
?
?
?
?
Example: Estimating baseline emissions

Example (cont’d): Estimating baseline emissions
• Step 1: Define an emissions estimation method and all parameters to calculate baseline emissions
Baseline emissions for residential natural gas use in 2020 (t CO2e) =
baseline natural gas use (MMBtu) x baseline emission factor (t CO2e/MMBtu)

Example (cont’d): Estimating baseline emissions
• Step 2: Determine baseline values for each parameter by identifying policy and non-policy drivers and assumptions

Example (cont’d): Estimating baseline emissions
• Step 3: Estimate baseline emissions
Baseline emissions for residential natural gas use in 2020 =
1,000,000 MMBtu x 55 kg CO2e/MMBtu = 55,000,000 kg CO2e
= 55,000 t CO2e

• Reporting results:
Example (cont’d): Estimating baseline emissions
?
55,000 t CO2e
?
?

• Step 4: Aggregate baseline emissions across effects/sources
Example: Estimating baseline emissions
50,000 t CO2e
55,000 t CO2e
5,000 t CO2e
110,000 t CO2e

Chapter 9 Estimating GHG effects ex-ante

Ex-ante assessment

• For GHG sources or sinks not affected by the policy or action:
– Use baseline values
• For GHG sources or sinks that are affected by the policy or action:
– Estimate policy scenario values
Estimating policy scenario values for parameters

Example: Estimating policy scenario emissions (ex-ante)
• Step 1: Identify parameters to be estimated
• In this example the only parameter affected by the policy is the amount of natural gas used
Policy scenario emissions for residential natural gas use in 2020 (t CO2e) =
Policy scenario natural gas use (MMBtu) x baseline emission factor (t
CO2e/MMBtu)

Example (cont’d): Estimating policy scenario emissions
• Step 2: Estimate policy scenario values for parameters

• Step 3: Estimate policy scenario emissions
Example (cont’d): Estimating policy scenario emissions
Policy scenario emissions for residential natural gas use in 2020 =
900,000 MMBtu x 50 kg CO2e/MMBtu = 50,050,000 kg CO2e
= 45,000 t CO2e

• Step 4: Aggregate policy scenario emissions and subtract to determine change across effects/sources
Example: Estimating the GHG effect ex-ante
GHG effect included Affected GHG
sources
Baseline
emissions
Policy scenario
emissions Change
Reduced emissions
from electricity
generation
Grid-connected
power plants 50,000 t CO2e 48,000 t CO2e -2,000 t CO2e
Reduced emissions
from home natural
gas use
Residential natural
gas use 55,000 t CO2e 45,000 t CO2e -10,000 t CO2e
Increased emissions
from insulation
production
Insulation
manufacturing
facilities
5,000 t CO2e 6,000 t CO2e +1,000 t CO2e
Total 110,000 t CO2e 99,000 t CO2e -11,000 t CO2e

Chapter 10 Monitoring performance

Purpose of monitoring
1. Monitor trends in key performance indicators to understand whether the policy or action is on track and being implemented as planned
2. Collect data needed to estimate GHG effects

Key performance indicators for monitoring performance

Examples

Collecting data to estimate GHG effects

• The monitoring plan should describe:
– Measurement or data collection methods and procedures
– Sources of data
– Monitoring frequency
– The level of uncertainty in any measurements or estimates
– Sampling procedures (if applicable)
– Whether the data is verified, and if so, verification procedures used
– Entity or person responsible for monitoring and roles and responsibilities of relevant personnel
– Procedures for internal auditing, quality assurance, and quality control
Creating a monitoring plan

Chapter 11 Estimating GHG effects ex-post

Ex-post assessment
• Should update baseline emissions every time an ex-post assessment is undertaken
• Should assess whether the effects identified in the causal chain actually occurred

Pilot example: Energy efficiency policies in the South African mining sector
Comparison of ex-post and ex-ante results

Policy interactions

• Deciding whether to assess an individual policy/action or a package of policies/actions
• Estimating the GHG effect of the policy or action when the policy or action assessed interacts with other policies/actions
• Aggregating GHG effects across multiple policies/actions
Situations to consider policy interactions

Types of policy interactions

Example: Subsidy and information campaign for home insulation

Pilot example: Air Quality Management Plan in Colombia
• The plan consists of two transportation policies:
1. Regulations to improve vehicle technologies
2. Incentives to reduce trips from private cars and motorcycles and increase trips by bicycle, walking, and public transportation

Overview of presentation
1. Define objectives and define the policy or action
2. Identify effects
3. Estimate effects
4. Report results

Chapter 14 Reporting

• Five parts to the reporting requirements and template:
1. GHG assessment information
2. Description of the policy or action
3. Estimated change in GHG emissions and removals
4. Methodology
5. Optional reporting information
Reporting requirements

Excerpt from sample reporting template
Year Total net change in
emissions and removals
Uncertainty range
(quantitative estimate or
qualitative description)
Year 1
Year 2
Year 3
Year 4
Year …
Total cumulative
emissions and
removals

Additional resources online
• Sample reporting template
• List of available calculation tools and methods
• Sector guidance documents
– AFOLU
– Energy supply
– Residential and commercial buildings
– Transportation
– Waste

For more information David Rich [email protected] 1-202-729-7744 To download the standard (and related resources), visit:
www.ghgprotocol.org/policy-and-action-standard