Embed Size (px)
Citation preview
GHG Permitting Experience With EPA Region 6
Presented by:
Thomas Sullivan, P.E. Zephyr Environmental Corporation
Presented to: Portland Cement Association
Manufacturing Technology Committee IEEE-IAS/PCA Cement Conference
April 27, 2015

Today’s Agenda
1. GHG Regulation Background 2. GHG Permitting Statistics 3. GHG Permit Application Elements 4. Top-Down BACT Review 5. GHG Permit Issues 6. Questions for TCEQ

• 06/03/2010: PSD Tailoring Rule • 12/30/2010: Federal Implementation Plan (FIP)
authorizing EPA to issue PSD permits in Texas for GHG-emitting sources
• 01/02/2011: Effective date of GHG Permits • 06/14/2013: HB 788 pass in Texas Legislature gives
TCEQ authority to issue GHG permits • 03/26/2014: Adoption of rules by TCEQ • 06/23/2014: SCOTUS issues opinion on UARG v. EPA • 11/10/2014: EPA approval of updated Texas
SIP/Withdrawal of FIP
GHG Regulation History in Texas
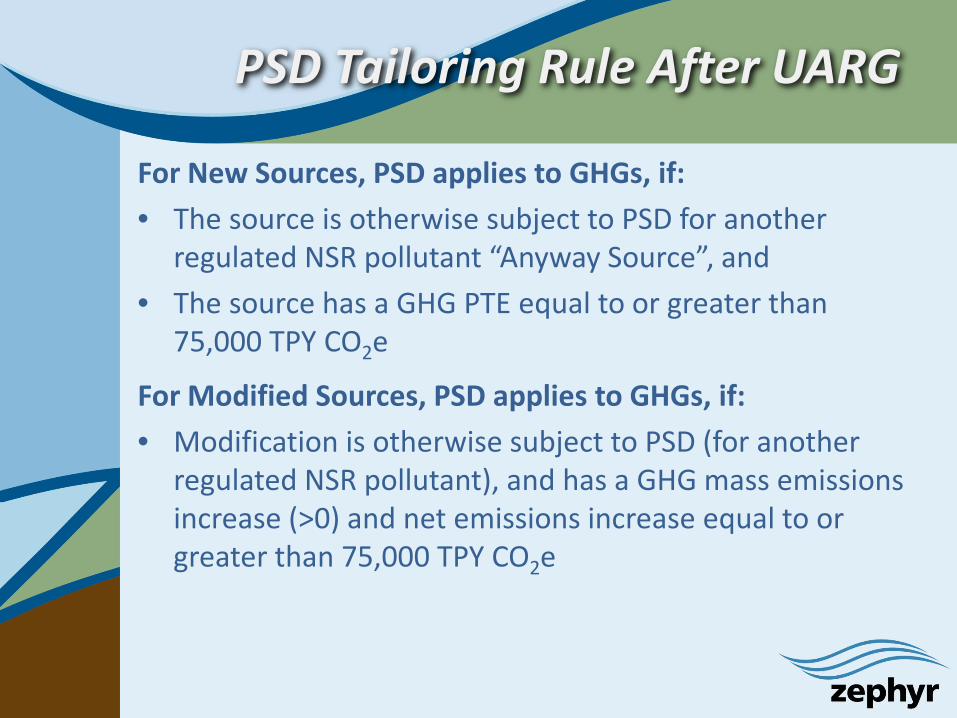
PSD Tailoring Rule After UARG
For New Sources, PSD applies to GHGs, if: • The source is otherwise subject to PSD for another
regulated NSR pollutant “Anyway Source”, and • The source has a GHG PTE equal to or greater than
75,000 TPY CO2e
For Modified Sources, PSD applies to GHGs, if: • Modification is otherwise subject to PSD (for another
regulated NSR pollutant), and has a GHG mass emissions increase (>0) and net emissions increase equal to or greater than 75,000 TPY CO2e
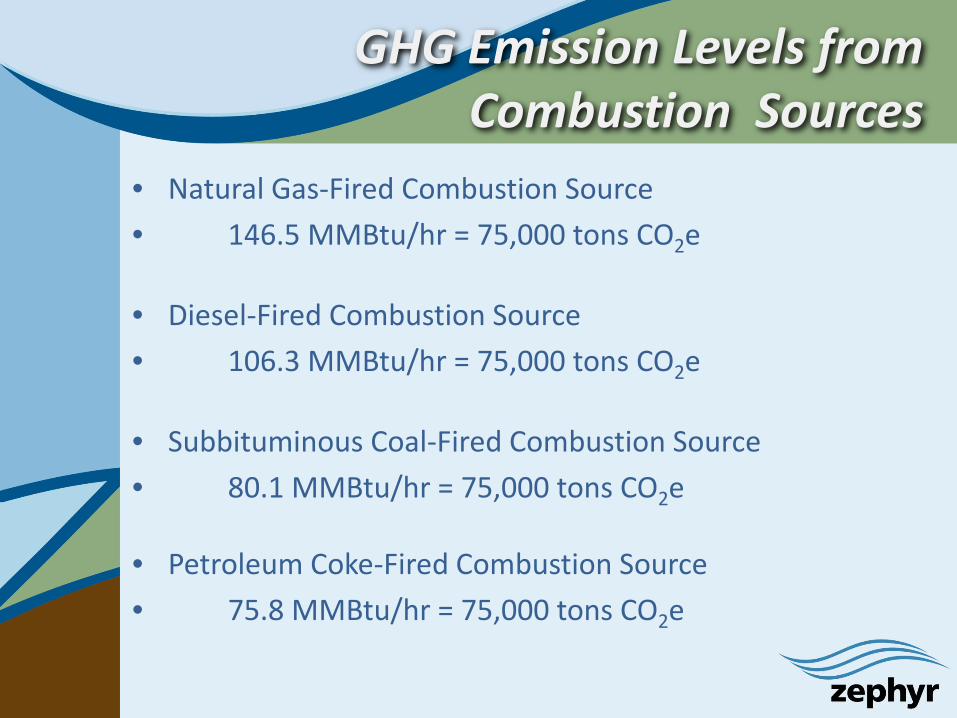
GHG Emission Levels from Combustion Sources
• Natural Gas-Fired Combustion Source • 146.5 MMBtu/hr = 75,000 tons CO2e
• Diesel-Fired Combustion Source • 106.3 MMBtu/hr = 75,000 tons CO2e
• Subbituminous Coal-Fired Combustion Source • 80.1 MMBtu/hr = 75,000 tons CO2e
• Petroleum Coke-Fired Combustion Source • 75.8 MMBtu/hr = 75,000 tons CO2e

EPA Region 6 GHG Permitting Statistics
• 89 GHG Applications submitted in Texas since 03/15/2011
• 63 GHG permits issued by EPA Region 6 Remaining 26 application either withdrawn due to “GHG only” PSD status, project changes, or transferred to TCEQ
• Average Processing Time for Issued Permits: 480 days
• Shortest Processing Time: 240 days (first one issued)
• Longest Processing Time: 778 days (final permit issued 02/19/2015)

TCEQ GHG Permitting Statistics
• 32 GHG Applications submitted in Texas since 01/27/2014
• 2 GHG permits issued by TCEQ
• Average Processing Time for Issued Permits: 213 days
• Shortest Processing Time: 77 days (originally submitted to EPA 09/04/2012, EPA Draft Permit issued 02/21/2014, transferred to TCEQ 12/12/2014)
• Longest Processing Time: 348 days (second permit issued 04/01/2015)
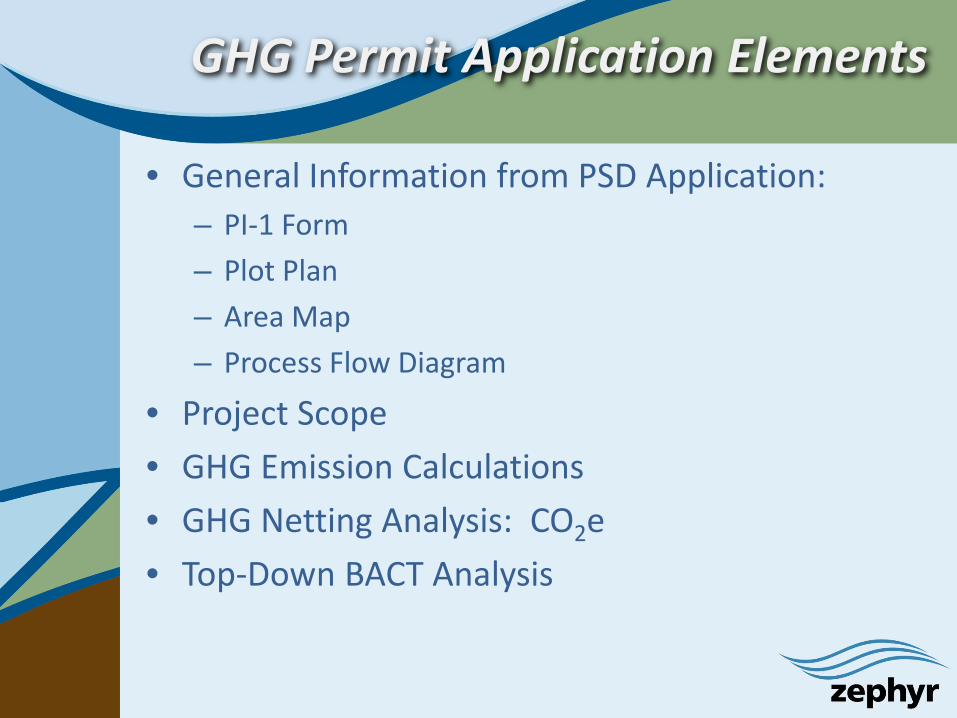
GHG Permit Application Elements
• General Information from PSD Application: – PI-1 Form – Plot Plan – Area Map – Process Flow Diagram
• Project Scope • GHG Emission Calculations • GHG Netting Analysis: CO2e • Top-Down BACT Analysis
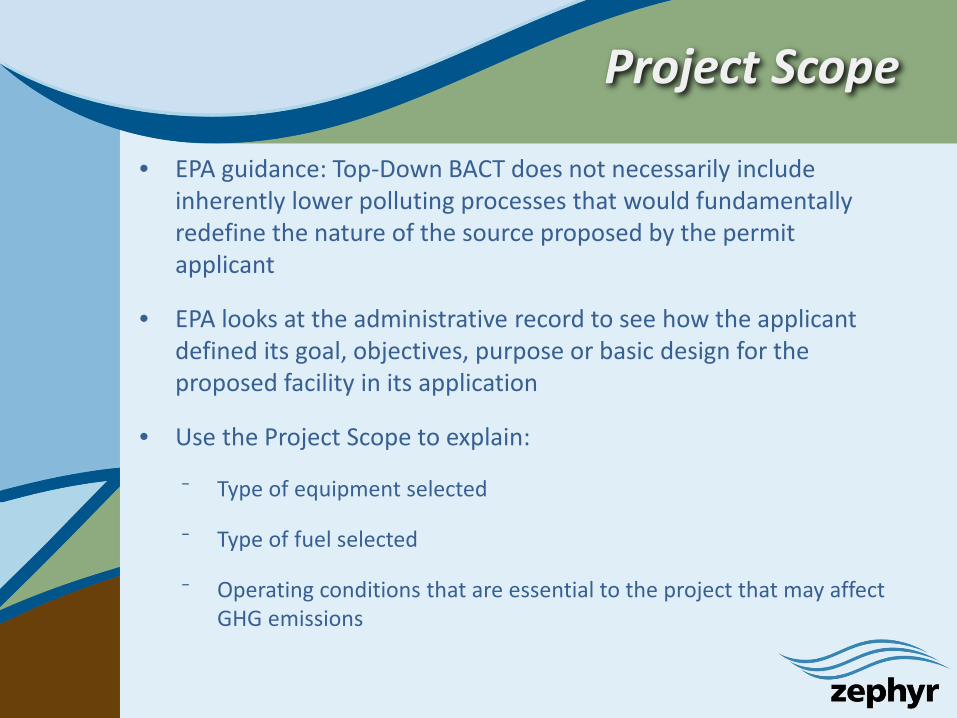
Project Scope
• EPA guidance: Top-Down BACT does not necessarily include inherently lower polluting processes that would fundamentally redefine the nature of the source proposed by the permit applicant
• EPA looks at the administrative record to see how the applicant defined its goal, objectives, purpose or basic design for the proposed facility in its application
• Use the Project Scope to explain:
⁻ Type of equipment selected
⁻ Type of fuel selected
⁻ Operating conditions that are essential to the project that may affect GHG emissions

GHG Netting
• CO2e only • Project Increases • Contemporaneous Emission Changes
- Beginning 5 years prior to Start of Construction for Electric Utilities
- 10 years prior to Start of Construction for other industries
- Ends at Start of Operation
• Demand Growth Exclusion • Sometimes difficult to estimate GHG emissions for
years prior to Mandatory GHG Reporting
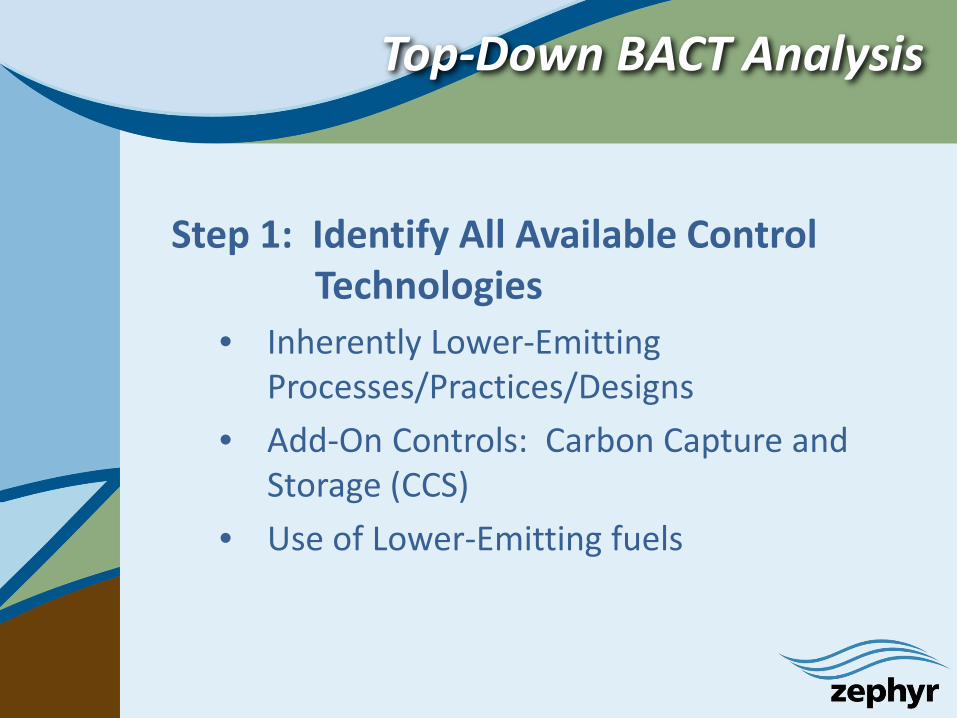
Top-Down BACT Analysis
Step 1: Identify All Available Control Technologies
• Inherently Lower-Emitting Processes/Practices/Designs
• Add-On Controls: Carbon Capture and Storage (CCS)
• Use of Lower-Emitting fuels

Top-Down BACT Analysis
Step 2: Eliminate Technically Infeasible Options
• EPA Region 6 position is that Carbon Capture is technically feasible
• Address CCS in Step 4 Note that EPA included CCS (for enhanced oil recovery) as part of BACT for a natural gas processing plant in the Permian Basin
Step 3: Rank Control Technologies

Top-Down BACT Analysis
Step 4: Evaluate Most Effective Controls • Provide cost estimate for CCS • National Energy Technology Laboratory: Cost
and Performance Baseline for Fossil Energy Plants – good CCS cost information
• Distance to nearest CO2 pipeline • Distance to nearest CO2 reservoir or enhanced
oil recovery well • EPA wants more detailed CCS cost information
as time goes on

Top-Down BACT Analysis
Step 4 (continued): • EPA looks at cost of CO2 avoided ($/ton) and
installation cost of CCS compared to project cost
• Example for Cement Kiln: ⁻ $158.4/ton CO2 avoided ⁻ CCS Cost/Project Cost: >500%
• CCS costs lower than $80/ton CO2 will get a close look by EPA
Top-Down BACT Analysis
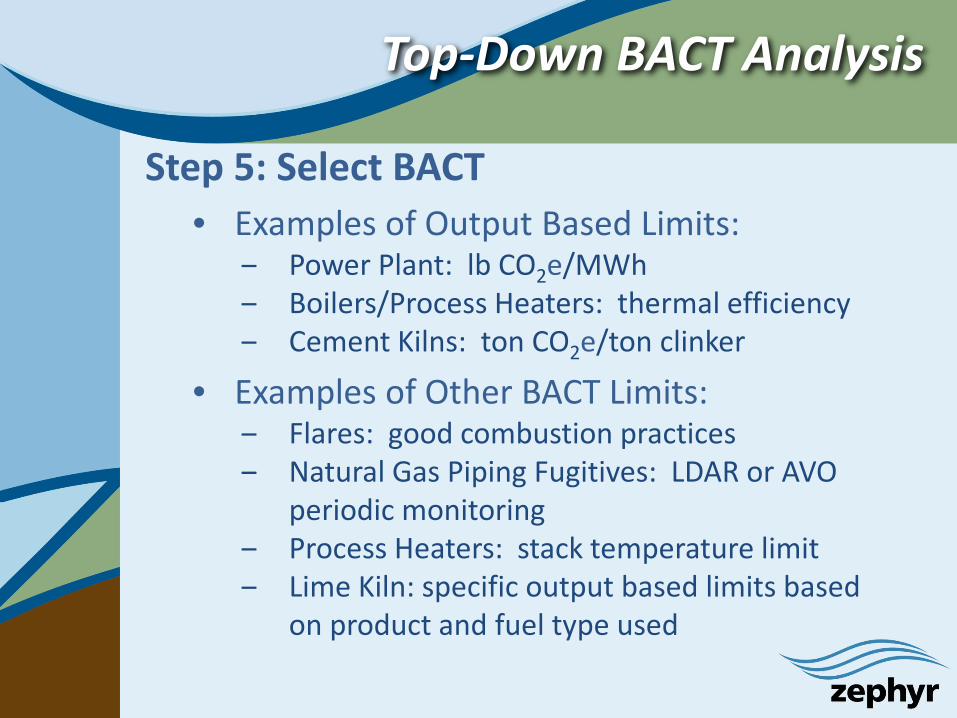
Step 5: Select BACT • Examples of Output Based Limits:
‒ Power Plant: lb CO2e/MWh ‒ Boilers/Process Heaters: thermal efficiency ‒ Cement Kilns: ton CO2e/ton clinker
• Examples of Other BACT Limits: ‒ Flares: good combustion practices ‒ Natural Gas Piping Fugitives: LDAR or AVO
periodic monitoring ‒ Process Heaters: stack temperature limit ‒ Lime Kiln: specific output based limits based
on product and fuel type used
Current Cement BACT
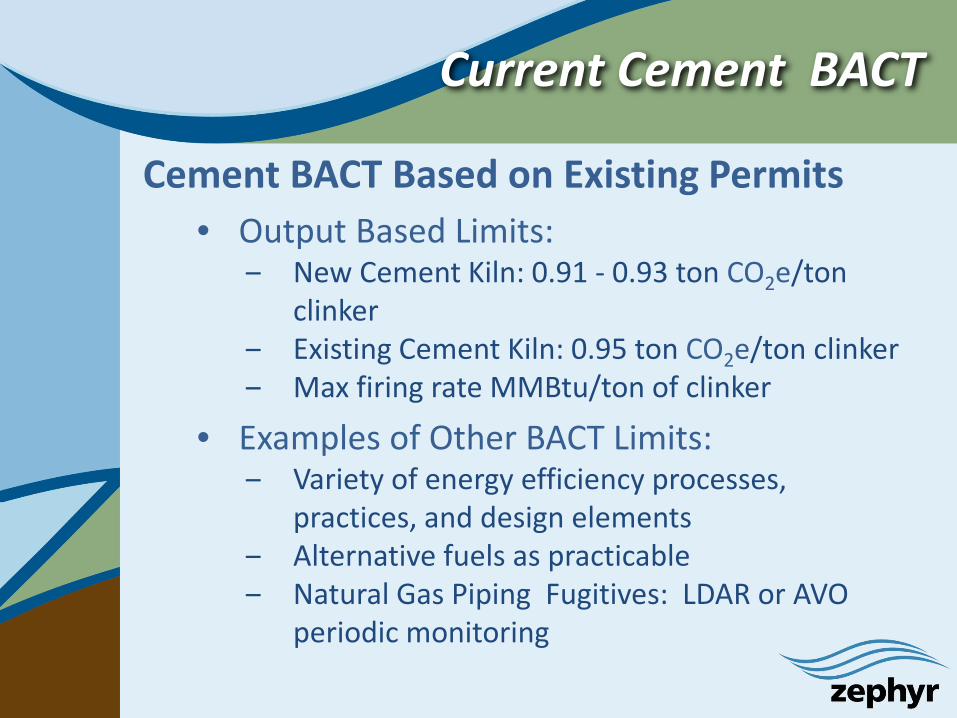
Cement BACT Based on Existing Permits • Output Based Limits:
‒ New Cement Kiln: 0.91 - 0.93 ton CO2e/ton clinker
‒ Existing Cement Kiln: 0.95 ton CO2e/ton clinker ‒ Max firing rate MMBtu/ton of clinker
• Examples of Other BACT Limits: ‒ Variety of energy efficiency processes,
practices, and design elements ‒ Alternative fuels as practicable ‒ Natural Gas Piping Fugitives: LDAR or AVO
periodic monitoring

Top-Down BACT Analysis – Lower GHG Emitting Fuels
• On one hand, EPA guidance says that Top-Down BACT does not necessarily include inherently lower polluting processes that would fundamentally redefine the nature of the source proposed by the permit applicant.
• On the other hand, EPA guidance says when a permit applicant has incorporated a particular fuel into one aspect of the project design (such as startup or auxiliary applications), this suggests that a fuel is “available”. Greater utilization of a fuel that the applicant is already proposing to use in some aspect of the project design should be listed as an option in Step 1 of the BACT unless it can be demonstrated that such an option would disrupt the applicant’s basic business purpose for the proposed project.
• Difficulty: Costs and availability of fuels changes over time.
• In one application, a “worldwide” alternative fuel usage “goal” listed in a sustainability report on the applicant’s website was included by EPA as a permit condition in a draft GHG permit.
GHG Permit: Emission Limits
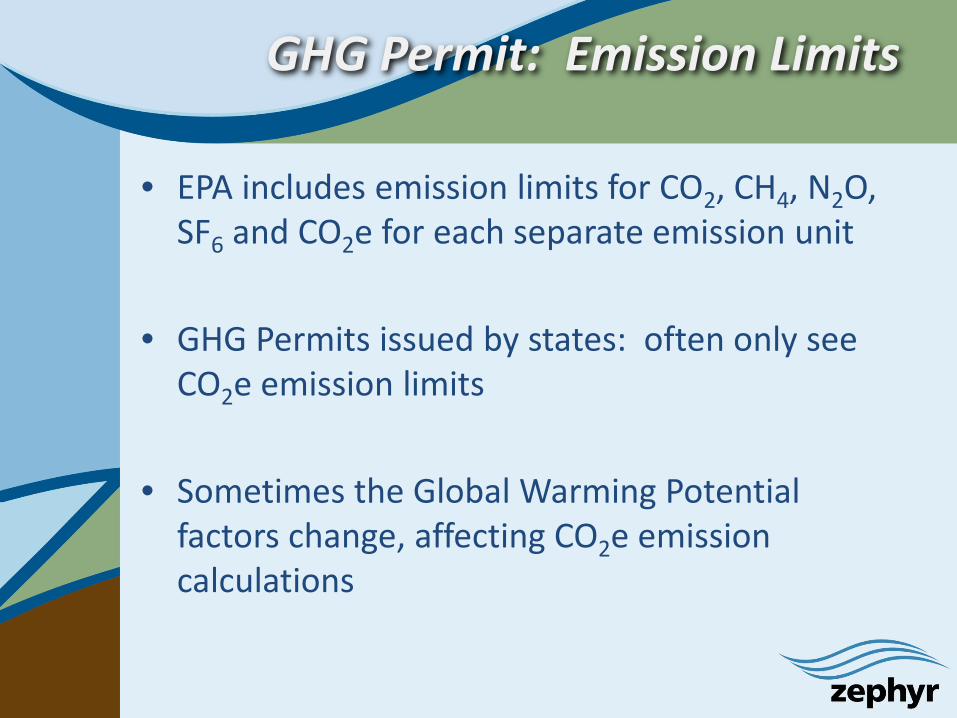
• EPA includes emission limits for CO2, CH4, N2O, SF6 and CO2e for each separate emission unit
• GHG Permits issued by states: often only see CO2e emission limits
• Sometimes the Global Warming Potential factors change, affecting CO2e emission calculations
GHG Permit Issues: Monitoring
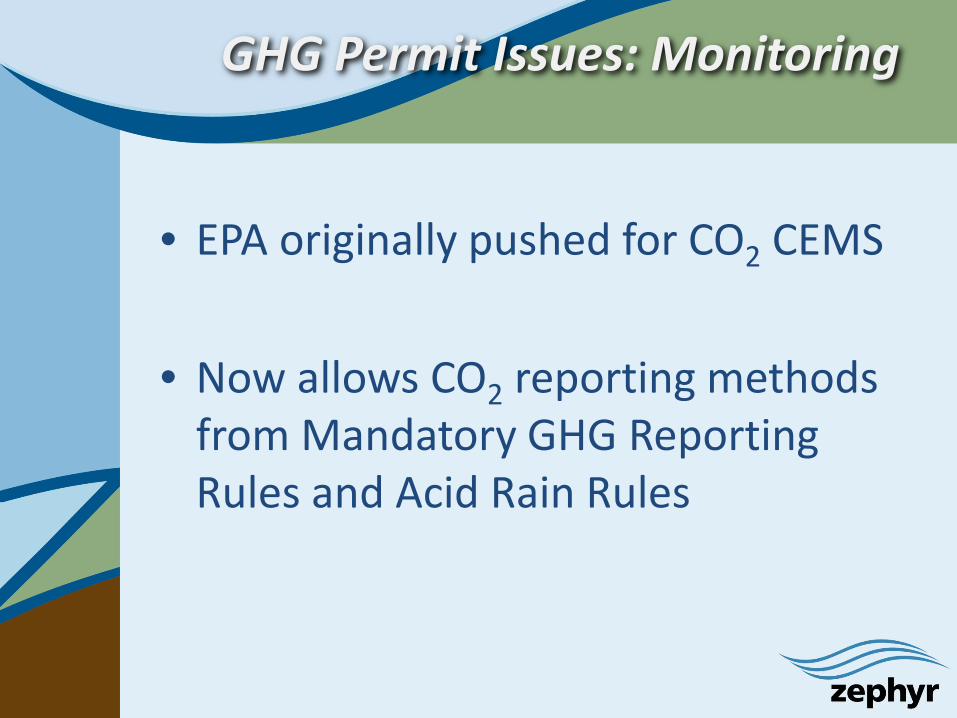
• EPA originally pushed for CO2 CEMS
• Now allows CO2 reporting methods
from Mandatory GHG Reporting Rules and Acid Rain Rules
GHG Permit Issues: Performance Test
• EPA has included initial and annual performance tests in GHG permits
• However, there are no short-term limits to compare performance tests results to
• EPA says the purpose is to generate data points

Questions for TCEQ
• How will minor modifications/revisions to GHG PSD permit be authorized? Certification form?
– Process for voluntary amendments to be rolled our summer of 2015
• Separate GHG application?
– Required for permits already in process, optional for new applications
• Specific GHG application forms?
– Yes, in process

Questions for TCEQ
• Separate public notices? – Yes, initially but coordinated PN possible,
combined in future
• Detailed CCS cost analysis for every application?
• Top-Down BACT analysis or Three Tier Approach?

Thank you!
Thomas I. Sullivan, Texas P.E.
Zephyr Environmental [email protected]
Phone: 512-879-6632
Visit us at www.ZephyrEnv.com and www.HazMatAcademy.com