Embed Size (px)
Citation preview

BANK OF GHANA
PETROLEUM HOLDING FUND & GHANA PETROLEUM FUNDS
SEMI ANNUAL REPORT: JULY 1 – DECEMBER 31, 2012
Jubilee Oil Field

GHANA PETROLEUM FUNDS SECRETARIAT SEMI-ANNUAL REPORT
Page 2
CONTENTS
1. INTRODUCTION ................................................................................................................................................... 3
2. OIL MARKET REVIEW ......................................................................................................................................... 3
A) WORLD MARKET REVIEW................................................................................................................................. 3
B) DEVELOPMENTS IN THE GHANAIAN OIL & GAS SECTOR ......................................................................... 4
I) EXPLORATION DISCOVERIES .......................................................................................................................... 4
II) PRODUCTION ....................................................................................................................................................... 4
III) JUBILEE FILED LIFTINGS .............................................................................................................................. 6
3. CRUDE OIL LIFTING & ALLOCATION .............................................................................................................. 7
A) JULY – DECEMBER 2012 LIFTING AND ALLOCATION ................................................................................ 7
B) LIFTING AND ALLOCATION FROM INCEPTION ............................................................................................ 7
4. SURFACE RENTALS AND ROYALTIES ........................................................................................................... 9
5. PORTFOLIO PERFORMANCE ........................................................................................................................... 9
6. PETROLEUM HOLDING FUND ........................................................................................................................ 12
7. CONCLUSION ..................................................................................................................................................... 12
ABBREVIATIONS:
ABFA: Annual Budget Funding Amount bbl/d: barrels per day bbls: barrels of oil Brent Crude: Price Index for light sweet crude oil sourced from North sea bopd. barrels of oil per day CAPI: Carried and Participating Interest CDS: Credit Default Swaps ECB: European Central Bank FOMC: Federal Open Market Committee GHAPET: Ghana Petroleum Holding Fund Account at Federal Reserve Bank of New York GHF: Ghana Heritage Fund GSF: Ghana Stabilisation Fund GNPC: Ghana National Petroleum Corporation mb/d: Million barrels per day MTAB: Mahogany, Teak, Akasa and Banda oil wells OPEC: Organization of the Petroleum Exporting Countries PBOC: People’s Bank of China PHF: Petroleum Holding Fund PRMA: Petroleum Revenue Management Act 2011 (815) TEN: Tweneboa, Enyenra, Ntomme oil wells WTI: West Texas Intermediate (Benchmark for light sweet crude oil from the Americas)

GHANA PETROLEUM FUNDS SECRETARIAT SEMI-ANNUAL REPORT
Page 3
1. INTRODUCTION
The Petroleum Holding Fund (PHF) and the Ghana Petroleum Funds (GPFs) were
established by the Petroleum Revenue Management Act (2011) (Act 815) (PRMA). In
accordance with the PRMA Section 28(a), (b) the Bank of Ghana reports on the performance
and activities of the PHF, and GPFs for the second half of 2012 ended December 31, 2012.
2. OIL MARKET REVIEW
a) World Market Review
Figure 1: Spot Brent Crude Price Jul 1 – Dec 31, 2012
Source: Bloomberg
Brent crude began the second half of 2012 (H2) at a low of US$96.59 as US manufacturing
measured by the Institute of Supply Management’s factory index fell to 47.9 in June from 53.5
in May 2012. From figure 1, brent crude recovered and traded largely above the simple
moving average for the first quarter of H2. On September 14, 2012 it climbed to a four month
high of US$117.59 versus an average price of US$109.69 as the Federal Reserve’s plan to
buy mortgage securities boosted demand for commodities and stocks. Brent crude ended
December 31, 2012 at US$111.94, (2.05 per cent above the simple moving average).
Brent crude price movements largely mirrored the economic headwinds of the half year ended
December 31, 2012. Economic contraction in US, Eurozone, and China enhanced downside
risks to prices at the beginning of H2 2012 whiles indications of an improvement and
strengthening global demand led to a recovery in prices.
In quarter 3 of the half year, euro area GDP declined by 0.1%. In quarter 4 of H2, the 3-
month moving average of the Eurozone Business Climate indicator improved from -1.37 in
October to -1.12 in December 2012. The Eurozone Investor Confidence indicator also rose
from -68.0% in July to -54.60% in December 2012. These indicators signaled a fragile
recovery in the 17 – nation currency bloc. To improve the upturn the ECB kept the key
interest rate unchanged at 0.75 per cent. In the US economic activity continued to expand at
GHANA PETROLEUM FUNDS SECRETARIAT SEMI-ANNUAL REPORT
Page 4
a slow pace. FOMC kept the target range for the Federal Funds rate untouched at 0.00 to
0.25% and continued purchases of agency backed mortgage securities at a pace of US$40
billion per month and longer term Treasuries at a pace of US$45 billion per month after
expiration of its program to extend the average maturity of its holdings of Treasury securities.
The rationale for this accommodative policy is to strengthen economic growth to generate
sustained improvement in the labour market. The China leading indicator (CNCILI Index) also
rose from 99.17 in June to 100.34 in September and headed further north to 100.50 on
December 31, 2012. The China Business Climate Index also rose 1.30 percent from
September to 124.4 in December 2012. Over the half year BOE held its key lending rate at
0.50 per cent.
b) Developments in the Ghanaian Oil & Gas Sector
i) Exploration Discoveries
During Q3 Tullow Oil announced that the Wawa-1 exploration well in the Deeptwater Tano licence
offshore Ghana had intersected oil and gas condensate in a Turonian turbidite channel system.
Wawa-1 encountered 20 metres of gas condensate pay and 13 metres oil pay in turbidite sands. Oil
samples from Wawa-1 are good quality between 38 and 44 degrees API. Wawa-1 is separate from
the Tweneboa, Enyenra, Ntomme (TEN) fields.
In Q4 the Okure-1 exploration well, drilled in the Deepwater Tano licence area by Tullow Oil Plc
reached its planned total depth of 4,511 meters and discovered a gross 17 meter interval of low net to
gross oil bearing Turonian age sandstones. Light oil with a 40 degree API was recovered from this
interval. This oil accumulation is not connected to other hydrocarbon discoveries in the same licence
area.
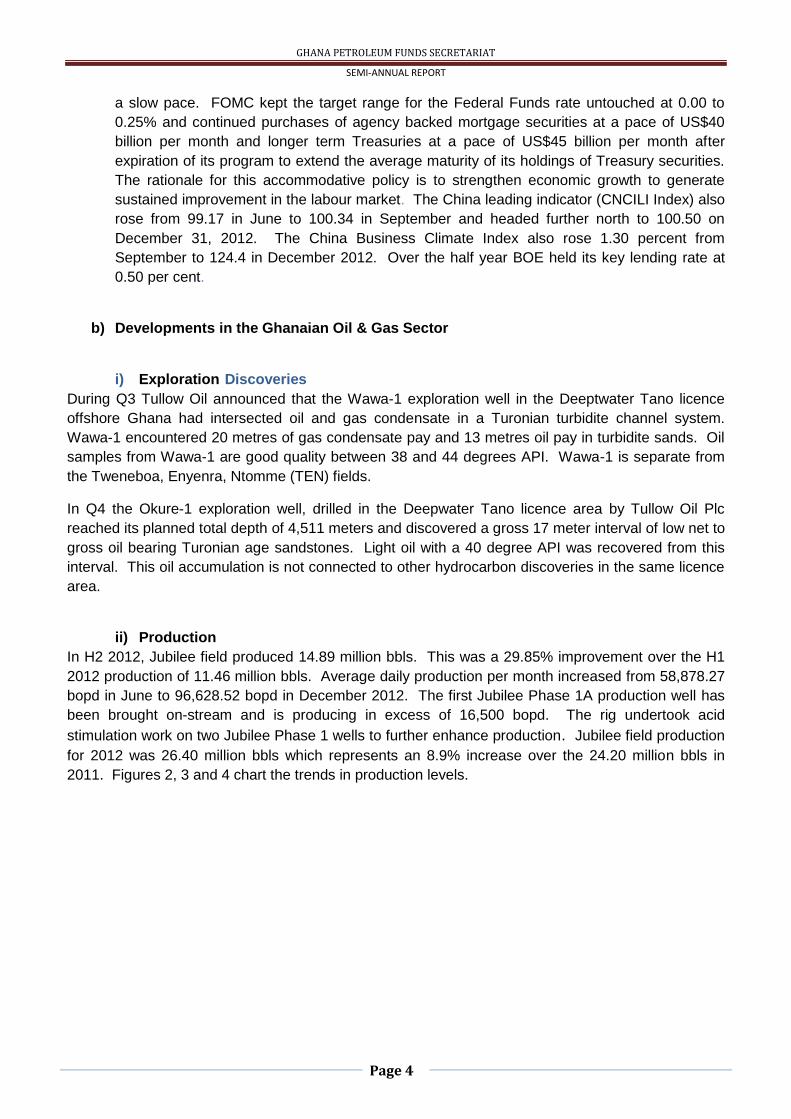
ii) Production
In H2 2012, Jubilee field produced 14.89 million bbls. This was a 29.85% improvement over the H1
2012 production of 11.46 million bbls. Average daily production per month increased from 58,878.27
bopd in June to 96,628.52 bopd in December 2012. The first Jubilee Phase 1A production well has
been brought on-stream and is producing in excess of 16,500 bopd. The rig undertook acid
stimulation work on two Jubilee Phase 1 wells to further enhance production. Jubilee field production
for 2012 was 26.40 million bbls which represents an 8.9% increase over the 24.20 million bbls in
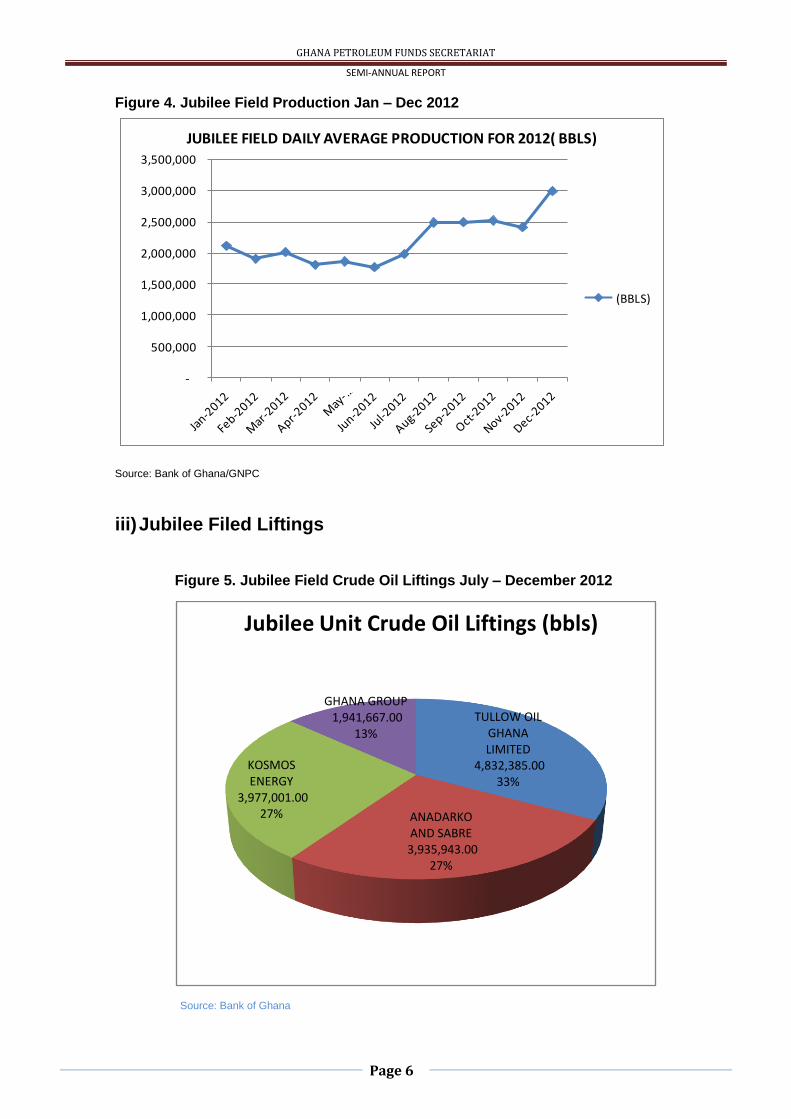
2011. Figures 2, 3 and 4 chart the trends in production levels.
GHANA PETROLEUM FUNDS SECRETARIAT SEMI-ANNUAL REPORT
Page 5
Figure 2. Jubilee Field Production Jul – Dec 2012
Source: Bank of Ghana/GNPC
Figure 3. Jubilee Field Production Jan – Dec 2011
-
500,000
1,000,000
1,500,000
2,000,000
2,500,000
3,000,000
JUBILEE FIELD DAILY AVERAGE PRODUCTION FOR 2011( BBLS)
(BBLS)
Source: Bank of Ghana/GNPC
-
20,000.00
40,000.00
60,000.00
80,000.00
100,000.00
120,000.00
Jul-2012 Aug-2012 Sep-2012 Oct-2012 Nov-2012 Dec-2012
JUBILEE FIELD PRODUCTION JUL-DEC 2012( BBLS)
(BBLS)
GHANA PETROLEUM FUNDS SECRETARIAT SEMI-ANNUAL REPORT
Page 6
Figure 4. Jubilee Field Production Jan – Dec 2012
-
500,000
1,000,000
1,500,000
2,000,000
2,500,000
3,000,000
3,500,000
JUBILEE FIELD DAILY AVERAGE PRODUCTION FOR 2012( BBLS)
(BBLS)
Source: Bank of Ghana/GNPC
iii) Jubilee Filed Liftings
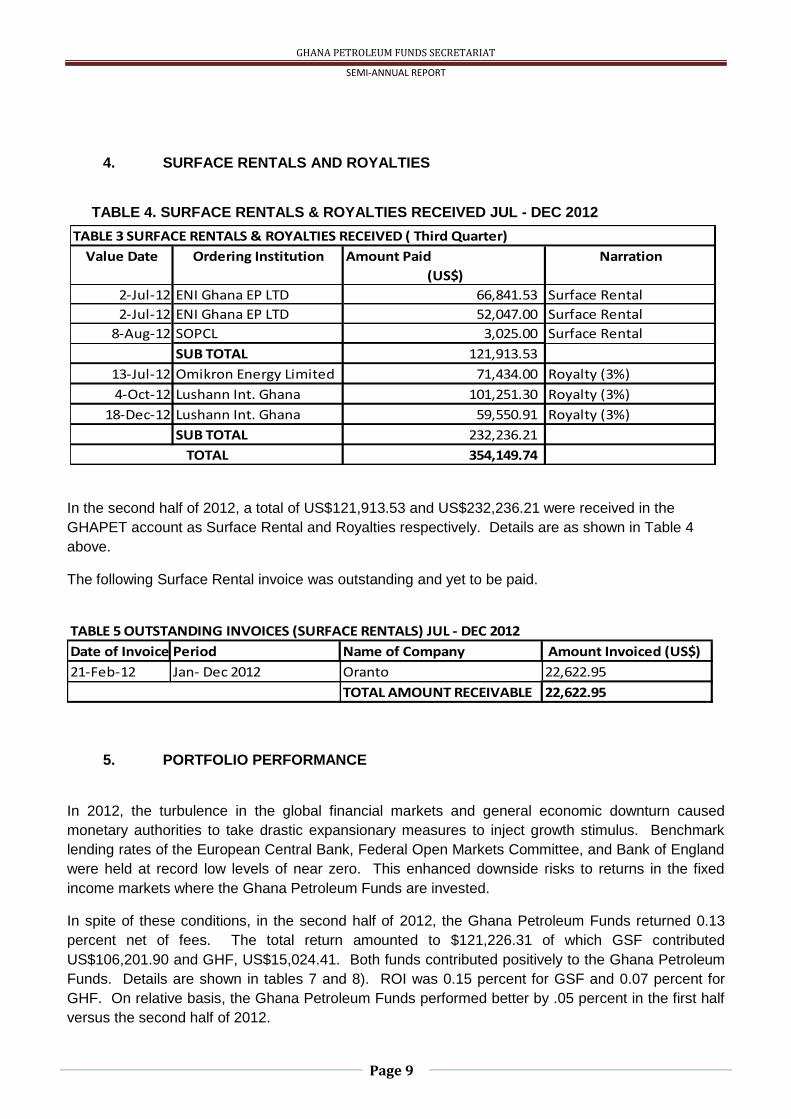
Figure 5. Jubilee Field Crude Oil Liftings July – December 2012
Source: Bank of Ghana
TULLOW OIL GHANA LIMITED
4,832,385.00 33%
ANADARKO AND SABRE3,935,943.00
27%
KOSMOS ENERGY
3,977,001.00 27%
GHANA GROUP1,941,667.00
13%
Jubilee Unit Crude Oil Liftings (bbls)

GHANA PETROLEUM FUNDS SECRETARIAT SEMI-ANNUAL REPORT
Page 7
During H2 2012 there were 15 liftings by the Jubilee Field lifting partners with a volume of
14.69 million bbls. From figure 5 above, Tullow Ghana Limited received the highest of 5
liftings totaling 4.83 million bbls, followed by Anadarko and Sabre, and Kosmos Energy, with 4
liftings each. The Ghana Group followed with 2 liftings and a volume of 1.94 million bbls.
3. CRUDE OIL LIFTING & ALLOCATION
a) July – December 2012 Lifting and Allocation
During the period under review, the Ghana Group (Ghana National Petroleum Corporation
(GNPC) lifting on behalf of Government of Ghana) lifted two crude oil parcels (8th & 9th liftings)
on September 12, 2012 and November 12, 2012 with total cargo value of US$214,451,313.27.
Table 1 below outlines the details of the two liftings.
TABLE 1. GHANA GROUP LIFTING AND ALLOCATION JUL 2012 - DEC 2012
TABLE 1 GHANA GROUP LIFTING AND ALLOCATION JUL 2012 - DEC 2012
NARRATION Actual (US$) Actual (US$) Total (US$)
LIFTING Eighth Lifting Nineth Lifting
LIFTING DATE 12-Sep-12 12-Nov-12
PROCEEDS RECEIVED 106,592,895.68 107,858,417.59 214,451,313.27
ALLOCATION:
ANNUAL BUDGET FUNDING AMOUNT 64,909,263.15 65,942,600.28 130,851,863.43
GNPC 41,683,632.53 41,915,817.31 83,599,449.84
GHANA STABILISATION FUND - - -
GHANA HERITAGE FUND - - -
The lifting proceeds of the second half in 2012 were allocated as follows:
In support of the 2012 budget, the Annual Budget Fund Amount (ABFA) received US$130,851,863.43
compared to US$131,905,535.44 in the first half. GNPC received US$83,599,449.84 for equity
finance and its 40 per cent share of the Carried and Participating Interest (CAPI). This amount
declined by US$21,251,186.74 compared to the first half allocation of US$104,850,636.58.
b) Lifting and Allocation from inception Since inception to the end of the second half of 2012, Ghana Group had lifted 9 parcels of crude oil with a net cargo value of US$985.196 million. Ghana Group lifted a total of 5 parcels in 2012, the first half of the year received a total of three lifting proceeds amounting to US$326.62 million whiles the second half received a total of two (2) lifting proceeds summing up to UD$214.45 million. Table 2 and 3 outlines the details of liftings in 2012.
TABLE 2
TOTAL LIFTINGS
2012 1st Half 2012 2nd Half
Jan 111,157,790.20 Jul -
Feb - Aug -
Mar Sept 106,592,895.68
Apr 125,598,381.86 Oct -
May - Nov 107,858,417.59
Jun 89,863,837.37 Dec -
TOTAL 326,620,009.43 214,451,313.27

GHANA PETROLEUM FUNDS SECRETARIAT SEMI-ANNUAL REPORT
Page 8
Figure 6: ALLOCATION OF GHANA GROUP PROCEEDS FROM INCEPTION
Source: Bank of Ghana
Total proceeds allocated from inception to the end of second half of 2012 amounted to
US$985,196,018.38. GNPC received 45 per cent, ABFA received 46 per cent, the GSF and GHF
received 7 per cent and 2 per cent respectively (Figure 6).
No allocations were made to the GHF and GSF on the 4th, 5th, 6th , 8th and 9th liftings.
TABLE 3 PETROLEUM REVENUE ALLOCATION FOR 2012 1ST & 2nd HALF OF THE YEAR
Ist Half GNPC ABFA GSF GHF TOTAL
Jan 51,334,257.84 59,823,532.36 - - 111,157,790.20
Feb -
Mar -
Apr -
May 53,516,379.00 72,082,003.11 - - 125,598,382.11
Jun 23,797,062.20 42,499,839.28 16,883,547.53 7,235,806.08 90,416,255.09
SUB TOTAL 128,647,699.04 174,405,374.75 16,883,547.53 7,235,806.08 327,172,427.40
2nd Half
Jul
Aug
Sep 41,683,632.53 64,909,263.15 - - 106,592,895.68
Oct
Nov 41,915,817.31 65,942,600.28 - - 107,858,417.59
Dec
SUB TOTAL 83,599,449.84 130,851,863.43 214,451,313.27
TOTAL 212,247,148.88 305,257,238.18 16,883,547.53 7,235,806.08 541,623,740.67
ALLOCATION
2012
453,509,527.73 46%
21,635,807.70 2%
71,688,900.26 7%
438,914,228.75 45%
ABFA
GH HERITAGE
GH STAB
GNPC
GHANA PETROLEUM FUNDS SECRETARIAT SEMI-ANNUAL REPORT
Page 9
4. SURFACE RENTALS AND ROYALTIES
TABLE 4. SURFACE RENTALS & ROYALTIES RECEIVED JUL - DEC 2012
In the second half of 2012, a total of US$121,913.53 and US$232,236.21 were received in the
GHAPET account as Surface Rental and Royalties respectively. Details are as shown in Table 4
above.
The following Surface Rental invoice was outstanding and yet to be paid.
TABLE 5 OUTSTANDING INVOICES (SURFACE RENTALS) JUL - DEC 2012
Date of Invoice Period Name of Company Amount Invoiced (US$)
21-Feb-12 Jan- Dec 2012 Oranto 22,622.95
TOTAL AMOUNT RECEIVABLE 22,622.95
5. PORTFOLIO PERFORMANCE
In 2012, the turbulence in the global financial markets and general economic downturn caused
monetary authorities to take drastic expansionary measures to inject growth stimulus. Benchmark
lending rates of the European Central Bank, Federal Open Markets Committee, and Bank of England
were held at record low levels of near zero. This enhanced downside risks to returns in the fixed
income markets where the Ghana Petroleum Funds are invested.
In spite of these conditions, in the second half of 2012, the Ghana Petroleum Funds returned 0.13
percent net of fees. The total return amounted to $121,226.31 of which GSF contributed
US$106,201.90 and GHF, US$15,024.41. Both funds contributed positively to the Ghana Petroleum
Funds. Details are shown in tables 7 and 8). ROI was 0.15 percent for GSF and 0.07 percent for
GHF. On relative basis, the Ghana Petroleum Funds performed better by .05 percent in the first half
versus the second half of 2012.
TABLE 3 SURFACE RENTALS & ROYALTIES RECEIVED ( Third Quarter)
Value Date Ordering Institution Amount Paid Narration
(US$)
2-Jul-12 ENI Ghana EP LTD 66,841.53 Surface Rental
2-Jul-12 ENI Ghana EP LTD 52,047.00 Surface Rental
8-Aug-12 SOPCL 3,025.00 Surface Rental
SUB TOTAL 121,913.53
13-Jul-12 Omikron Energy Limited 71,434.00 Royalty (3%)
4-Oct-12 Lushann Int. Ghana 101,251.30 Royalty (3%)
18-Dec-12 Lushann Int. Ghana 59,550.91 Royalty (3%)
SUB TOTAL 232,236.21
354,149.74 TOTAL

GHANA PETROLEUM FUNDS SECRETARIAT SEMI-ANNUAL REPORT
Page 10
Figure 7: Return on Ghana Stabilisation Fund Jul – Dec 2012
6 Months 12 months Since Inception
$ USD 103,485.52 106,201.90 209,687.42
Re
turn
s in
USD
Ghana Stabilization Fund
6 Months
12 months
Since Inception
Source: Bank of Ghana
Figure 8: Return on Ghana Heritage Fund Jul – Dec 2012
6 Months 12 months Since inception
$ USD 43,388.99 15,024.41 58,413.40
Re
turn
s in
USD
Ghana Heritage Fund
6 Months
12 months
Since inception
Source: Bank of Ghana

GHANA PETROLEUM FUNDS SECRETARIAT SEMI-ANNUAL REPORT
Page 11
Table 6 Ghana Petroleum Funds- Semi Annual Report: July 1 - Dec 31 2012
US$
Opening book Value (1 July 2012) 54,908,838.25
Receipt during the period 16,883,547.53
Account Management Fees (6,997.77)
Income from Investments 113,199.67
Closing book Value (31 December 2012) 71,898,587.68
Net Income for the Quarter comprised the Following
INCOME US$
Investment Income 113,199.67
Less:
Account Management Fees (6,997.77)
Net Return for the Period 106,201.90
US$
Opening book Value (1 July 2012) 14,443,390.61
Receipt during the period 7,235,806.08
Account Management Fees (1,728.61)
Income from Investments 16,753.02
Closing book Value(31 December 2012) 21,694,221.10
Net Income for the Quarter comprised the Following:
INCOME US$
Investment Income 16,753.02
Less:
Account Management Fees (1,728.61)
Net Return for the Period 15,024.41
GHANA PETROLEUM FUNDS
GHANA STABILISATION FUND ACCOUNT AT EUROCLEAR BANK
GHANA HERITAGE FUND ACCOUNT AT EUROCLEAR BANK

GHANA PETROLEUM FUNDS SECRETARIAT SEMI-ANNUAL REPORT
Page 12
6. PETROLEUM HOLDING FUND
The Petroleum Holding Fund held a balance of US$422,585.72 (see Schedule 1 below) as at
December 31, 2012. This amount comprised interest earned since inception amounting to
US$68,435.98 and US$354,149.74 representing Surface Rentals and Royalties.
7. CONCLUSION
Petroleum Revenue Management Regulations
In accordance to PRMA Section 60 (1) Sub-committees established by the Minister of Finance and
Economic Planning to develop the Petroleum Revenue Management Regulations have developed a
draft for the Minister’s consideration and adaption.
Audit of the Ghana Petroleum Fund and the Ghana Petroleum Funds
In compliance with the PRMA Section 44 (1) the Internal Audit Department of the Bank of Ghana had
performed an audit on the GPFs and the PHF for the period ended December 31, 2012.
During the last three months of the half year ended December 31, 2012, available data signaled a
fragile recovery from the global recession. To nurture and improve the subdued pace of recovery the
major monetary authorities kept benchmark interest rates at near zero levels. This enhanced
downside risks to returns in the fixed income markets where the Ghana Petroleum Funds are
invested. The Ghana Petroleum Funds did not lose capital. The value of the Ghana Stabilisation
Fund increased by US$0.106 million to US$71.898 million, and the Ghana Heritage Fund increased
by US$ 0.015 million to US$21.694 million. We are of the opinion that additional allocations to the
Ghana Petroleum Funds will enhance returns on investment.
Prepared by Ghana Petroleum Funds Secretariat, Bank of Ghana
February 13, 2013

GHANA PETROLEUM FUNDS SECRETARIAT SEMI-ANNUAL REPORT
Page 13
(A) INFLOWS: Volume Of Crude Shipped (BBLS)
Value of
Shipment (US$)
Notes (US$)
Date
27th July 2012 995,247 89,863,837.37 1 89,863,837.37
12th October 2012 947,021 106,592,895.68 2 106,592,895.68
12th December 2012 994,646 107,858,417.59 3 107,858,417.59
1st July 2012 Surface Rental and Royalties Received during 1st Half 552,417.72
2nd July 2012 4 66,841.53
2nd July 2012 5 52,047.00
13th July 2012 6 71,434.00
8th August 2012 7 3,025.00
4th October 2012 8 101,251.30
18th December 2012 9 59,550.91
TOTAL 305,221,718.10
(B) DISBURSEMENTS
21st August 2012 GNPC Equity Financing Cost for seventh lifting 27,603,476.00
5th November 2012 GNPC Equity Financing Cost for eighth lifting 18,195,508.00
17th December 2012 GNPC Equity Financing Cost for ninth lifting 17,973,695.00
Sub Total 63,772,679.00
21st August 2012 GNPC 40% CAPI for seventh lifting 14,896,363.28
5th November 2012 GNPC 40% CAPI for eighth lifting 23,488,124.53
17th December 2012 GNPC 40% CAPI for ninth lifting 23,942,122.31
Sub Total 62,326,610.12
21st August 2012 Annual Budget Funding Amount for seventh lifting 23,797,062.20
5th November 2012 Annual Budget Funding Amount for eighth lifting 64,909,263.15
17th December 2012 Annual Budget Funding Amount for ninth lifting 65,942,600.28
Sub Total 154,648,925.63
21st August 2012 Transfer to Ghana Heritage Fund: Seventh lifting 7,235,806.08
21st August 2012 Transfer to Ghana Stabilisation Fund: Seventh lifting 16,883,547.53
Sub Total 24,119,353.61
TOTAL DISBURSEMENTS 304,867,568.36
NET (RECEIPTS AND PAYMENTS) 10 354,149.74
ACCUMULATED INTEREST 11 68,435.98
AMOUNT HELD IN REPURCHASE AGREEMENT 12 (200,000.00)
TOTAL BALANCE ON ACCOUNT 13 222,585.72
9. Lushann International Ghana Royalties
5. Surface rental from ENI Ghana EP LTD
Schedule 1
PETROLEUM ACCOUNT AT FEDERAL RESERVE BANK OF NEW YORK
2. Proceeds for eighth oil lift
3. Proceeds for ninth oil lift
4. Surface rental from ENI Ghana EP LTD
Notes
1. Proceeds for seventh oil lift
6. 3% Royalties from Omikron Energy Limited
7. Surface Rental for SOPCL
8. Lushann International Ghana Royalties
10.Undistributed Surface Rental and Royalty (Saltpond Offshore Company)
11. Interest as of 31/12/2012
12. Interest amount moved into Repurchase Agreement
13. Does not include a total of US$ incurred by Bank of Ghana in Refurbishing Space for the Petroleum Secretariat