Embed Size (px)
Citation preview

©2011 Hay Group. All rights reserved
the ratio of CEO to average employee pay and what it means for company performance
This paper shows how CEO salary and total cash levels compare to average employee pay, sector by sector for FTSE 350 companies. We explain the variance between sectors and even between companies in the same sector and show whether or not a smaller gap between CEO and average employee pay results, as some commentators have opined, in better corporate performance.
The results will disappoint some and please others but one finding on which most people should agree is that reward for executives has become so complicated and arcane that it has lost touch with its real purpose – to reward for performance and to retain real talent in a way which is consistent with what businesses actually do and the returns they generate for shareholders.
Reward for executives has become so complicated and arcane that it has lost touch with its real purpose
With Will Hutton’s fair pay review suggesting that private sector companies should consider capping directors’ pay at a multiple of staff wages, Vince Cable commenting that executive pay needs to “come back to earth” and the independent High Pay Commission just under a year away from reporting its findings, there is a growing sense that “something must be done” about executive pay. We thought it would be useful to take the emotion out of the debate and instead consider some facts.
Getting the balance right:

1 Getting the balance right
Executive summaryOur analysis shows that CEO salary and total cash as a multiple of average employee salary and total cash varies significantly across and within sectors. We found that much of this variance can be explained by the different staffing models across sectors (at one end of the scale, CEOs in financial services businesses earn a median of five times as much as the average employee, whilst at the other, CEOs in cyclical consumer businesses earn 27 times as much as the average employee) and the individual circumstances of particular companies.
We found that, on the whole (even within sector), the pay multiple seems to reflect variations in average employee pay, rather than CEO pay, which in turn reflects the relationship between the complexity of products or services offered by a company and how close to mass consumers the company is.
We also looked at the relationship between this ratio and various company performance measures. We found that there is no consistent correlation between pay equality (a low CEO to average employee pay ratio) and performance, even when this is tested within a sector.
These findings suggest that a one-size fits all ‘CEO pay as a multiple of employee pay’ approach simply will not work or be helpful. It also suggests that blanket explanations as to how CEO salary levels are set need to be examined more closely.
So, what does this mean for those setting CEO pay?
Well, we would not dispute that knowing and understanding how a company’s ratio compares to others is important, especially with the increasing levels of scrutiny on executive pay from government, the corporate governance community and the public in general. But, this paper suggests that the most pressing call to action for those setting CEO pay is to ensure that it reflects the individual circumstances of the company that they are leading.
The data shows that CEO salary and bonus levels do not vary nearly as much as average employee salary and bonus levels. One explanation of this could be that CEO salary and bonus levels actually reflect market capitalisation rather than operational complexity or value at risk (arguably this explanation is counter-intuitive from both a reward and an investor perspective).
Another explanation is that a focus on market practice and the perceived restrictions put in place by institutional shareholders have created a situation in which CEO pay does not reflect individual company circumstances or strategies, meaning that (counter to most people’s expectations) we only really see variation in pay at the employee rather than CEO level.
We would conclude that the recent shift in investors’ perspectives on pay presents an opportunity for companies and remuneration committees to match CEO pay to individual companies. We will return to this subject in a future paper.
Blanket explanations as to how CEO salary levels are set need to be examined more closely

2
©2011 Hay Group. All rights reserved
We have examined the relationship between CEO pay and average employee pay – ‘pay equality’ – and investigated whether or not this relationship tells us anything about company performance.
IntroductionThere has been much recent discussion in the media around pay ‘fairness’, focused on issues such as investment banking bonuses, golden parachutes for executives and what the bosses of public sector organisations should earn relative to the average or lowest paid employee in the organisations they run.
Furthermore, most remuneration committees at listed companies assure their shareholders and other stakeholders that when considering how to set executive director salaries and other elements of pay they take into account pay for other employees. For example:
“ Consideration is also given to reward levels at the next tier of management and across the Group in order to sustain a common sense of purpose and sharing of success as well as to ensure that executive arrangements remain appropriate in the context of wider Group remuneration.” Tesco 2010 Annual Report
“ The committee…has regard to pay and conditions elsewhere within the group and endeavours to ensure that pay rises for executive and non-executive directors are generally comparable with those being applied elsewhere in the group.” Greene King 2009/10 Annual Report
Clearly, the concept of the relationship between what the CEO earns and what other employees earn is seen as important. In the case of journalists, social commentators and politicians, this is because it might tell us something about the rather hazy concept of ‘fairness.’ In the case of companies and remuneration committees this is because it affects or should be seen to affect decision making on executive and employee reward.

3 Getting the balance right
To measure pay equality within organisations we have compared, on a company by company basis, the wages (base salary and bonus) of an average employee with the base salary and total cash of the CEO. Our sample consists of constituents of the FTSE 350 index (245 in the 2009 sample, 200 in the 2007 sample).
Next, for each company in our sample, we have calculated average CEO salary as a multiple of average employee pay.
The salary multiple tells an interesting, if unsurprising, story. As we might have expected, financial services companies have the smallest ‘pay gap’ between the CEO (when we consider base salary only) and an average employee, with technology and energy companies not far behind. These sectors tend to employ
highly educated, highly skilled and relatively mobile workforces. Conversely, retail companies have the largest gap between CEO base salary and average employee wages, again not surprising when you consider the large number of low-skilled shop-floor employees, paid by the hour in an average FTSE 350 retailer.
Making the same comparison using CEO total cash (pay including bonus) compared to average employee pay we get a slightly different picture.
When we include bonus in the CEO pay figures, as we might expect, the multiple increases significantly, reflecting the higher bonus opportunity and emphasis on pay for performance for CEOs.
Figure two: CEO total cash versus average employee wagesFigure one: CEO salary versus average employee wages
Measuring pay equality in UK plcs
Pay equality between sectors
We have compared the base salary and total cash of CEOs to average employee pay at FTSE 350 companies and found significant variation in this relationship between sectors.
900,000
800,000
700,000
600,000
500,000
400,000
300,000
200,000
100,000
0
Utilitie
s
Communicatio
ns
Basic m
aterials
Consumer c
yclica
l
Industrial
Consumer n
on cyclica
l
Energy
Financial
Tech
nology
Sector
Pay
in 2
009
(£)
Median CEO base salary Median (of the average) wage
1,600,000
1,400,000
1,200,000
1,000,000
800,000
600,000
400,000
200,000
0
Utilitie
s
Communicatio
ns
Basic m
aterials
Consumer c
yclica
l
Industrial
Consumer n
on cyclica
l
Energy
Financial
Tech
nology
Sector
Pay
in 2
009
(£)
Median CEO total cash Median (of the average) wage

At this stage in our analysis we again found nothing particularly surprising. The ratio of CEO to employee pay once again reflects the nature of the sector we are looking at. It is higher where a company employs large numbers of relatively unskilled people and lower where a company employs smaller numbers of highly skilled people. The result is that when looking at total cash we see a wide range, from nine times the average (not lowest) employee’s wage in the oil and gas sector, to 43 times the average wage in the retail sector. For the purposes of comparison, the Will Hutton review, commissioned by the government in July 2010, will make recommendations on whether no public sector manager should earn more than twenty times the lowest paid person in the organisation.
Perhaps more interesting is the year on year change in the ratio, particularly when we consider the total cash earned by CEOs in relation to average pay. In most sectors CEOs’ total cash as a multiple of average employee pay was lower in 2009 than it was in 2007, on average 14 per cent lower, particularly in the
communications, financial services and oil and gas services sectors. This is almost entirely down to falls in the level of CEO bonus which in each instance might be reflective of the way in which the recession affected these sectors with advertising spend dropping steeply, financial services in turmoil and the brief fall in the oil price.
The basic materials sector consisting largely of mining companies and the cyclical consumer sector consisting mostly of a variety of retail and leisure businesses did not see the same pattern. In these sectors the multiple went up by roughly 10 per cent. The explanation for this increase is not clear cut. In the basic materials sector it in part reflects the recovery of commodity prices, in the consumer cyclical sector it in part reflects a wide-spread policy of wage restraint, the fact that recession has been good for some of these businesses e.g. JD Wetherspoon and Halfords, and perhaps mostly an unwillingness on the part of remuneration committees to cut executive pay levels.
4
©2011 Hay Group. All rights reserved
Figure three: CEO salary as a multiple of average employee pay Figure four: CEO total cash as a multiple of average employee pay
30
25
20
15
10
5
0
Utilitie
s
Communications
Basic m
aterials
Retail
Industrial
Consumer n
on cyclical
Energy
Financial
Technology
Sector
CEO
pay
as a
mul
tiple
of
aver
age
empl
oyee
pay
2007 2009
50
45
40
35
30
25
20
15
10
5
0
Utilitie
s
Communications
Basic m
aterials
Retail
Industrial
Consumer n
on cyclical
Energy
Financial
Technology
Sector
CEO
pay
as a
mul
tiple
of
aver
age
empl
oyee
pay
2007 2009
In most sectors CEOs’ total cash as a multiple of average employee pay was lower in 2009 than it was in 2007

5 Getting the balance right
Comparisons across sectors told us little that was unexpected and even less about what an appropriate cross-sector pay multiple of average employee pay (à la the Will Hutton review) ‘should’ be. More relevant might be the average multiple within the sector in which you do business and how you compare to that average. The following graph shows, sector by sector, CEO salary as a multiple of average employee pay and the highest and lowest multiples we see in each sector.
From the perspective of a remuneration committee, we could argue that those CEOs with a higher differential than the sector average are overpaid, whilst those with a smaller differential are underpaid, or have insufficient space between their earnings and the earnings of others in the organisation. To make that kind of judgement valid, these numbers alone are insufficient – we need a better understanding of what pay looks like inside the organisation.
For instance, is the company with the higher differential particularly well run? Are executives taking on more responsibility and accountability, thereby requiring fewer senior managers, meaning that whilst the differential is high the overall aggregate cost of management is relatively low and higher pay is justified? Or in the case of the company with the lower differential, does this reflect a situation in which the CEO is ‘first among equals’ relying on a large cadre of well paid managers to deliver results? In this case a lower differential is perhaps suitable.
Figure five: range of CEO salary versus average employee pay multiples
Pay equality within sectors
When we investigated CEO to average employee pay ratios in individual sectors, we found that the ratio varied significantly even within sectors. Generally, this variation reflects differences in average employee pay (as opposed to CEO pay) which in turn reflects differences in the relationship between the complexity of products or services offered by a company and how close to mass consumers the company is.
125
105
85
65
45
25
5
-15Utili
ties
Communicatio
ns
Basic m
aterials
Energy
Industrial
Consumer n
on cyclica
l
Consumer c
yclica
l
Financial
Tech
nology
Sector
1781
32
9
0
36
19
6
95
24
2
74
30
5
122
35
1
25 2514 18
112
1982
CEO
pay
as
a m
ultip
le o
f ave
rage
em
ploy
ee p
ay (2
009)
Companies need to consider such ratios in a broader context, asking better questions about how senior executive pay compares to employee pay but also asking for a more specific comparison to competitors

In fact, we think that the explanation for this variance is, on the whole, even easier to explain and is rooted not in CEO pay but in average employee pay. In our utilities super sector example the company with a CEO who earns the highest multiple of his employees’ pay is the CEO at Centrica whilst the one with the lowest multiple is National Grid. In each case the variance from the sector average is explained by looking at their business model.
With its large, downstream, consumer-facing operations we would expect Centrica to have large numbers of employees – in the field and in call centres for instance – pulling average employee pay down compared to the sector. In contrast, at National Grid (a transmitter and distributor) we would expect average pay – for engineers for instance – to be higher and therefore, the multiple to be lower.
We see that across super sectors it is the average employee pay level, explained by what the business does and in particular by the complexity of ‘product’ or ‘service’ offered, coupled with proximity to B2C sales, which explains a company’s multiple. This is illustrated in figure six.
We see this pattern repeated across sectors. In financial services the lowest multiple is at BlueBay, an asset manager to institutions
and HNW individuals with around 200 employees. The highest multiple is at Provident Financial, a provider of credit to consumers with around 3,000 employees. Similarly, in the technology sector, the lowest multiple is at Autonomy, a developer of sophisticated software for corporations with around 1,700 employees and the highest is at Sage, a developer of less sophisticated software for smaller businesses with around 14,000 employees.
At an even more granular level, employee pay and therefore, the ratio comparisons can be influenced by factors such as location and the in-or–out-sourcing of services such as cleaning and catering.
We can see then that even within sectors CEO pay as a multiple of average employee pay tells us little when considered in and of itself. Companies need to consider such ratios in a broader context, asking better questions about how senior executive pay compares to employee pay but also asking for a more specific comparison to competitors. For instance, if a company has a seemingly direct and easily comparable competitor, say Tesco compared to Sainsbury’s or GSK compared to AstraZeneca; one might ask how the ratios compare.
6
©2011 Hay Group. All rights reserved
Figure six: explaining the multiple
Highestmultiples
Highermultiples
Lowermultiples
Lowestmultiples
Prox
imity
to p
ublic
con
sum
ers
Complexity of product or ‘service’

7 Getting the balance right
A more exciting question we have looked to answer is what influences, if any, might these numbers have on company performance?
There are very few instances of consistent strong correlation between the pay equality ratio (average employee pay as a percentage of CEO pay) and the performance of the companies in our sample. We have looked at total shareholder return (TSR) performance, Return on Capital Employed (ROCE) performance and profit growth. In an effort to avoid having the impact of recession affecting our analysis to too great a degree we have
measured performance in-year for 2007 and 2009 and for the periods 2006 to 2009 and 2004 to 2007.
In no instance did we find a significant (+0.75 or -0.75) correlation between having more equal pay (a lower multiple of average employee pay to CEO pay) and better performance or vice versa. Nor did we find a significant correlation between having a better paid CEO compared to other employees and company performance.
The following tables show the results of this analysis:
Pay equality and performance
Our analysis of CEO to average employee pay ratios versus several company performance metrics found no relationship between the pay multiple and the performance of a company.
Our analysis shows that equality of pay and company performance are not correlated in any meaningful and consistent way
8
©2011 Hay Group. All rights reserved
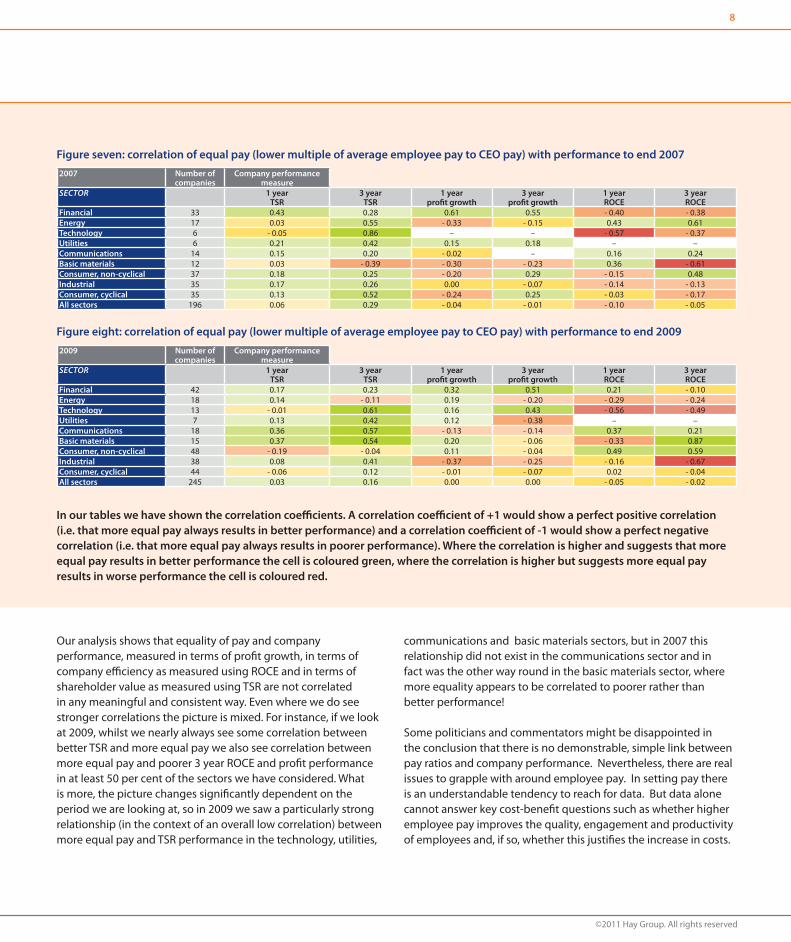
Our analysis shows that equality of pay and company performance, measured in terms of profit growth, in terms of company efficiency as measured using ROCE and in terms of shareholder value as measured using TSR are not correlated in any meaningful and consistent way. Even where we do see stronger correlations the picture is mixed. For instance, if we look at 2009, whilst we nearly always see some correlation between better TSR and more equal pay we also see correlation between more equal pay and poorer 3 year ROCE and profit performance in at least 50 per cent of the sectors we have considered. What is more, the picture changes significantly dependent on the period we are looking at, so in 2009 we saw a particularly strong relationship (in the context of an overall low correlation) between more equal pay and TSR performance in the technology, utilities,
communications and basic materials sectors, but in 2007 this relationship did not exist in the communications sector and in fact was the other way round in the basic materials sector, where more equality appears to be correlated to poorer rather than better performance!
Some politicians and commentators might be disappointed in the conclusion that there is no demonstrable, simple link between pay ratios and company performance. Nevertheless, there are real issues to grapple with around employee pay. In setting pay there is an understandable tendency to reach for data. But data alone cannot answer key cost-benefit questions such as whether higher employee pay improves the quality, engagement and productivity of employees and, if so, whether this justifies the increase in costs.
Figure seven: correlation of equal pay (lower multiple of average employee pay to CEO pay) with performance to end 2007
2009 Number of companies
Company performance measure
Sector 1 year TSR
3 year TSR
1 year profit growth
3 year profit growth
1 year ROCE
3 year ROCE
Financial 42 0.17 0.23 0.32 0.51 0.21 - 0.10Energy 18 0.14 - 0.11 0.19 - 0.20 - 0.29 - 0.24Technology 13 - 0.01 0.61 0.16 0.43 - 0.56 - 0.49Utilities 7 0.13 0.42 0.12 - 0.38 – –Communications 18 0.36 0.57 - 0.13 - 0.14 0.37 0.21Basic materials 15 0.37 0.54 0.20 - 0.06 - 0.33 0.87Consumer, non-cyclical 48 - 0.19 - 0.04 0.11 - 0.04 0.49 0.59Industrial 38 0.08 0.41 - 0.37 - 0.25 - 0.16 - 0.67Consumer, cyclical 44 - 0.06 0.12 - 0.01 - 0.07 0.02 - 0.04All sectors 245 0.03 0.16 0.00 0.00 - 0.05 - 0.02
Figure eight: correlation of equal pay (lower multiple of average employee pay to CEO pay) with performance to end 2009
2007 Number of companies
Company performance measure
Sector 1 year TSR
3 year TSR
1 year profit growth
3 year profit growth
1 year ROCE
3 year ROCE
Financial 33 0.43 0.28 0.61 0.55 - 0.40 - 0.38Energy 17 0.03 0.55 - 0.33 - 0.15 0.43 0.61Technology 6 - 0.05 0.86 – – - 0.57 - 0.37Utilities 6 0.21 0.42 0.15 0.18 – –Communications 14 0.15 0.20 - 0.02 – 0.16 0.24Basic materials 12 0.03 - 0.39 - 0.30 - 0.23 0.36 - 0.61Consumer, non-cyclical 37 0.18 0.25 - 0.20 0.29 - 0.15 0.48Industrial 35 0.17 0.26 0.00 - 0.07 - 0.14 - 0.13Consumer, cyclical 35 0.13 0.52 - 0.24 0.25 - 0.03 - 0.17All sectors 196 0.06 0.29 - 0.04 - 0.01 - 0.10 - 0.05
In our tables we have shown the correlation coefficients. A correlation coefficient of +1 would show a perfect positive correlation (i.e. that more equal pay always results in better performance) and a correlation coefficient of -1 would show a perfect negative correlation (i.e. that more equal pay always results in poorer performance). Where the correlation is higher and suggests that more equal pay results in better performance the cell is coloured green, where the correlation is higher but suggests more equal pay results in worse performance the cell is coloured red.
9 Getting the balance right
Conclusion
Clearly, the differences between companies are such that it is difficult to demonstrate that the ratio of CEO pay to average employee pay tells us very much about ‘fairness’. What is more we see no proven link between pay equality and operational performance or the returns which shareholders receive.
However, it is perhaps odd that average employee pay better reflects the particular circumstances and strategies of companies than CEO pay does. In part this reflects the difference between the way a company pays its labour force and the way it pays the people responsible for running it but more fundamentally it also reflects a 20 year trend, encouraged by executives and often consultants, towards paying executives the same way irrespective of the strategies they have chosen, the time-scale for return on the investments they have made and the value
they can and might generate. We will return to this issue in a future paper.
The ratio of CEO pay to average employee pay however, does shed light on how companies pay and why there are differences between them. From an executive reward perspective it gives us another tool with which to consider the subject of executive pay – how much, what for and how it should be structured to reflect a company’s unique circumstances.
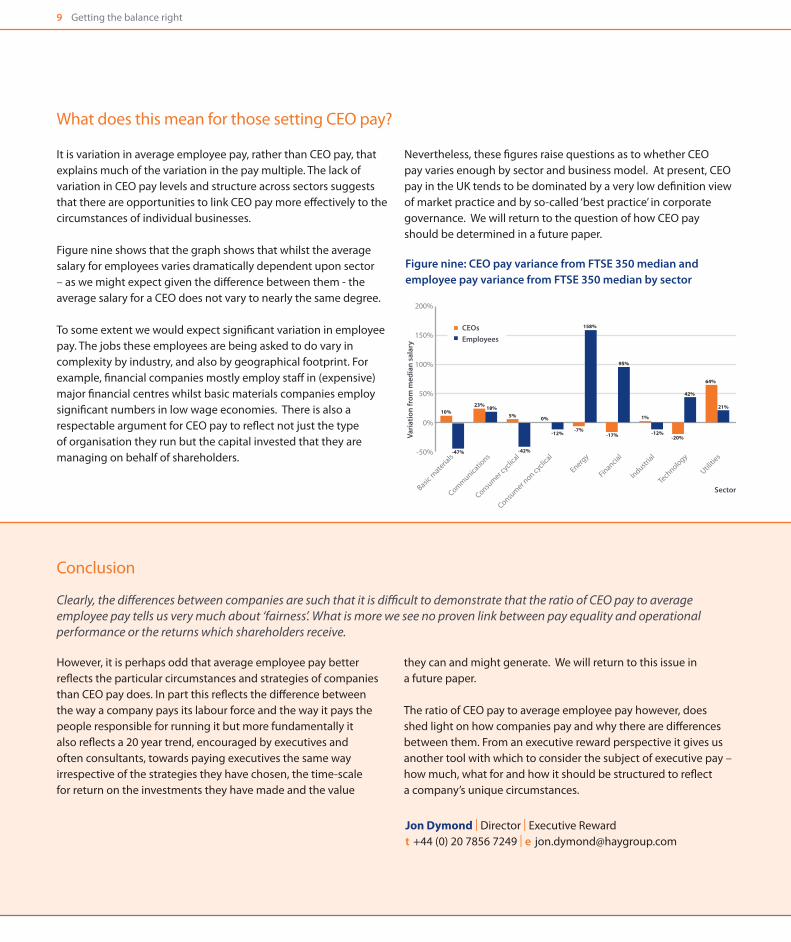
It is variation in average employee pay, rather than CEO pay, that explains much of the variation in the pay multiple. The lack of variation in CEO pay levels and structure across sectors suggests that there are opportunities to link CEO pay more effectively to the circumstances of individual businesses.
Figure nine shows that the graph shows that whilst the average salary for employees varies dramatically dependent upon sector – as we might expect given the difference between them - the average salary for a CEO does not vary to nearly the same degree.
To some extent we would expect significant variation in employee pay. The jobs these employees are being asked to do vary in complexity by industry, and also by geographical footprint. For example, financial companies mostly employ staff in (expensive) major financial centres whilst basic materials companies employ significant numbers in low wage economies. There is also a respectable argument for CEO pay to reflect not just the type of organisation they run but the capital invested that they are managing on behalf of shareholders.
Nevertheless, these figures raise questions as to whether CEO pay varies enough by sector and business model. At present, CEO pay in the UK tends to be dominated by a very low definition view of market practice and by so-called ‘best practice’ in corporate governance. We will return to the question of how CEO pay should be determined in a future paper.
What does this mean for those setting CEO pay?
Utilitie
s
Communicatio
ns
Basic m
aterials
Energy
Industrial
Consumer n
on cyclica
l
Consumer c
yclica
l
Financial
Tech
nology
Sector
10%23% 18%
5%
-42%
-12%
0%
-7%
158%
95%
-17%
1%
-12%-20%
42%
64%
21%
-47%
200%
150%
100%
50%
0%
-50%
CEOsEmployees
Vari
atio
n fr
om m
edia
n sa
lary
Figure nine: CEO pay variance from FTSE 350 median and employee pay variance from FTSE 350 median by sector
Jon Dymond | Director | Executive Rewardt +44 (0) 20 7856 7249 | e [email protected]

This perspective gives us another tool with which to consider the subject of executive pay – how much, what for and how it should be structured to reflect a company’s unique circumstances

AfricaCape TownJohannesburgPretoria
AsiaBangkokBeijingHong KongHo Chi Minh CityJakartaKuala LumpurMumbaiNew DelhiSeoulShanghaiShenzhenSingaporeTokyo
EuropeAthensBarcelonaBerlinBilbaoBirminghamBratislavaBristolBrusselsBucharestBudapestDublinFrankfurt
GlasgowHelsinkiIstanbulKievLilleLisbonLondonMadridManchesterMilanMoscowOsloParisPragueRomeStockholmStrasbourgViennaVilniusWarsawZeistZurich
Middle EastDubaiRiyadhTel Aviv
North AmericaAtlantaBostonCalgaryChicago
DallasEdmontonHalifaxKansas CityLos AngelesMexico CityMontrealNew York MetroOttawaPhiladelphiaReginaSan FranciscoSan José (CR)TorontoVancouverWashington DC Metro
PacificAucklandBrisbaneMelbournePerthSydneyWellington
South AmericaBogotáBuenos AiresCaracasLimaSantiagoSão Paulo
Hay Group is an independent global consulting business. Our UK executive remuneration team advises the remuneration committees of a wide number of companies, ranging from FTSE 100 to AIM, to those backed by private equity. Hay Group has over 2600 employees working in 85 offices in 49 countries. For over 60 years, we have been renowned for the quality of our research and the intellectual rigour of our work. We transform research into actionable insights. We give our clients breakthrough perspectives on their organisation, and we do it in the most efficient way to achieve the desired results.