Embed Size (px)
Citation preview
Getting Started with Pentaho Data Integration

This document is copyright © 2010 Pentaho Corporation. No part may be reprinted without writtenpermission from Pentaho Corporation. All trademarks are the property of their respective owners.
Help and Support ResourcesIf you have questions that are not covered in this guide, or if you would like to report errors in thedocumentation, please contact your Pentaho technical support representative.
Support-related questions should be submitted through the Pentaho Customer Support Portal athttp://support.pentaho.com.
For information about how to purchase support or enable an additional named support contact,please contact your sales representative, or send an email to [email protected].
For information about instructor-led training on the topics covered in this guide, visithttp://www.pentaho.com/training.
Limits of Liability and Disclaimer of WarrantyThe author(s) of this document have used their best efforts in preparing the content and theprograms contained in it. These efforts include the development, research, and testing of thetheories and programs to determine their effectiveness. The author and publisher make no warrantyof any kind, express or implied, with regard to these programs or the documentation contained inthis book.
The author(s) and Pentaho shall not be liable in the event of incidental or consequential damagesin connection with, or arising out of, the furnishing, performance, or use of the programs, associatedinstructions, and/or claims.
TrademarksPentaho (TM) and the Pentaho logo are registered trademarks of Pentaho Corporation. Allother trademarks are the property of their respective owners. Trademarked names may appearthroughout this document. Rather than list the names and entities that own the trademarks or inserta trademark symbol with each mention of the trademarked name, Pentaho states that it is using thenames for editorial purposes only and to the benefit of the trademark owner, with no intention ofinfringing upon that trademark.
Company InformationPentaho CorporationCitadel International, Suite 3405950 Hazeltine National DriveOrlando, FL 32822Phone: +1 407 812-OPEN (6736)Fax: +1 407 517-4575http://www.pentaho.com
E-mail: [email protected]
Sales Inquiries: [email protected]
Documentation Suggestions: [email protected]
Sign-up for our newsletter: http://community.pentaho.com/newsletter/

| TOC | 3
Contents
Introduction ............................................................................................................. 4Common Uses..........................................................................................................................4
Key Benefits............................................................................................................................. 4
Pentaho Data Integration Architecture......................................................................6Downloading Pentaho Data Integration....................................................................7Installing Pentaho Data Integration...........................................................................8
Starting the Spoon Designer.................................................................................................... 8
Pentaho Data Integration Folders and Scripts......................................................................... 8
Installing Enterprise Edition Licenses.......................................................................................9
Adding a JDBC Driver.............................................................................................................. 9
Connecting to the Enterprise Repository................................................................11Navigating through the Interface.............................................................................12Creating Your First Transformation........................................................................ 15
Retrieving Data from a Flat File (Text File Input Step)........................................................... 15
Saving Your Transformation........................................................................................18
Filter Records with Missing Postal Codes (Filter Rows Step)................................................ 18
Loading Your Data into a Relational Database (Table Output Step)......................................20
Retrieving Data from your Lookup File (Text File Input Step)................................................ 21
Resolving Missing Zip Code Information (Stream Lookup Step)............................................22
Completing your Transformation (Select Values Step).......................................................... 23
Running Your Transformation................................................................................................ 24
Building Your First Job............................................................................................27Scheduling the Execution of Your Job .................................................................. 29Building Business Intelligence Solutions Using Agile BI.........................................31
Using Agile BI.........................................................................................................................31
Correcting the Data Quality Issue.......................................................................................... 32
Creating a Top Ten Countries by Sales Chart....................................................................... 33
Breaking Down Your Chart by Deal Size............................................................................... 34
Wrapping it Up........................................................................................................................35
Why Choose Enterprise Edition?............................................................................37Professional, Technical Support.............................................................................................37
Enterprise Edition Features....................................................................................................37
Certified Software Releases...................................................................................................37
Troubleshooting......................................................................................................38I don't know what the default login is for the DI Server, Enterprise Console, and/or Carte....38
4 | | Introduction
Introduction
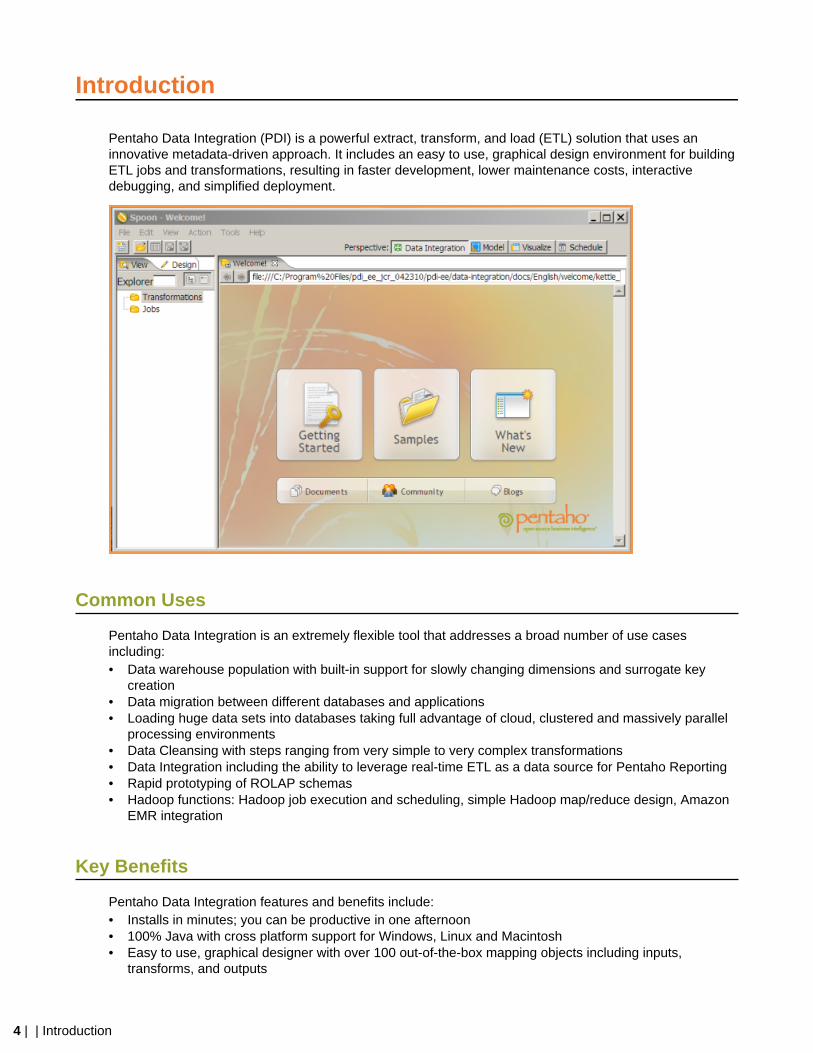
Pentaho Data Integration (PDI) is a powerful extract, transform, and load (ETL) solution that uses aninnovative metadata-driven approach. It includes an easy to use, graphical design environment for buildingETL jobs and transformations, resulting in faster development, lower maintenance costs, interactivedebugging, and simplified deployment.
Common Uses
Pentaho Data Integration is an extremely flexible tool that addresses a broad number of use casesincluding:• Data warehouse population with built-in support for slowly changing dimensions and surrogate key
creation• Data migration between different databases and applications• Loading huge data sets into databases taking full advantage of cloud, clustered and massively parallel
processing environments• Data Cleansing with steps ranging from very simple to very complex transformations• Data Integration including the ability to leverage real-time ETL as a data source for Pentaho Reporting• Rapid prototyping of ROLAP schemas• Hadoop functions: Hadoop job execution and scheduling, simple Hadoop map/reduce design, Amazon
EMR integration
Key Benefits
Pentaho Data Integration features and benefits include:• Installs in minutes; you can be productive in one afternoon• 100% Java with cross platform support for Windows, Linux and Macintosh• Easy to use, graphical designer with over 100 out-of-the-box mapping objects including inputs,
transforms, and outputs

| Introduction | 5
• Simple plug-in architecture for adding your own custom extensions• Enterprise Data Integration server providing security integration, scheduling, and robust content
management including full revision history for jobs and transformations• Integrated designer (Spoon) combining ETL with metadata modeling and data visualization, providing
the perfect environment for rapidly developing new Business Intelligence solutions• Streaming engine architecture provides the ability to work with extremely large data volumes• Enterprise-class performance and scalability with a broad range of deployment options including
dedicated, clustered, and/or cloud-based ETL servers

6 | | Pentaho Data Integration Architecture
Pentaho Data Integration Architecture
The diagram below depicts the the core components of Pentaho Data Integration Enterprise Edition
Spoon is the design interface for building ETL jobs and transformations. Spoon provides a drag and dropinterface allowing you to graphically describe what you want to take place in your transformations whichcan then be executed locally within Spoon, on a dedicated Data Integration Server, or a cluster of servers.
Enterprise Edition (EE) Data Integration Server is a dedicated ETL server whose primary functions are:
Execution Executes ETL jobs and transformations usingthe Pentaho Data Integration engine
Security Allows you to manage users and roles(default security) or integrate security to yourexisting security provider such as LDAP orActive Directory
Content Management Provides the ability to centrally store andmanage your ETL jobs and transformations.This includes full revision history on contentand features such as sharing and locking forcollaborative development environments.
Scheduling Provides the services allowing you toschedule activities and monitor scheduledactivities on the Data Integration server fromwithin the Spoon design environment.
The Enterprise Console provides a thin client for managing deployments of Pentaho Data IntegrationEnterprise Edition including management of Enterprise Edition licenses, monitoring and controlling activityon a remote Pentaho Data Integration server and analyzing performance trends of registered jobs andtransformations.
| Downloading Pentaho Data Integration | 7
Downloading Pentaho Data Integration
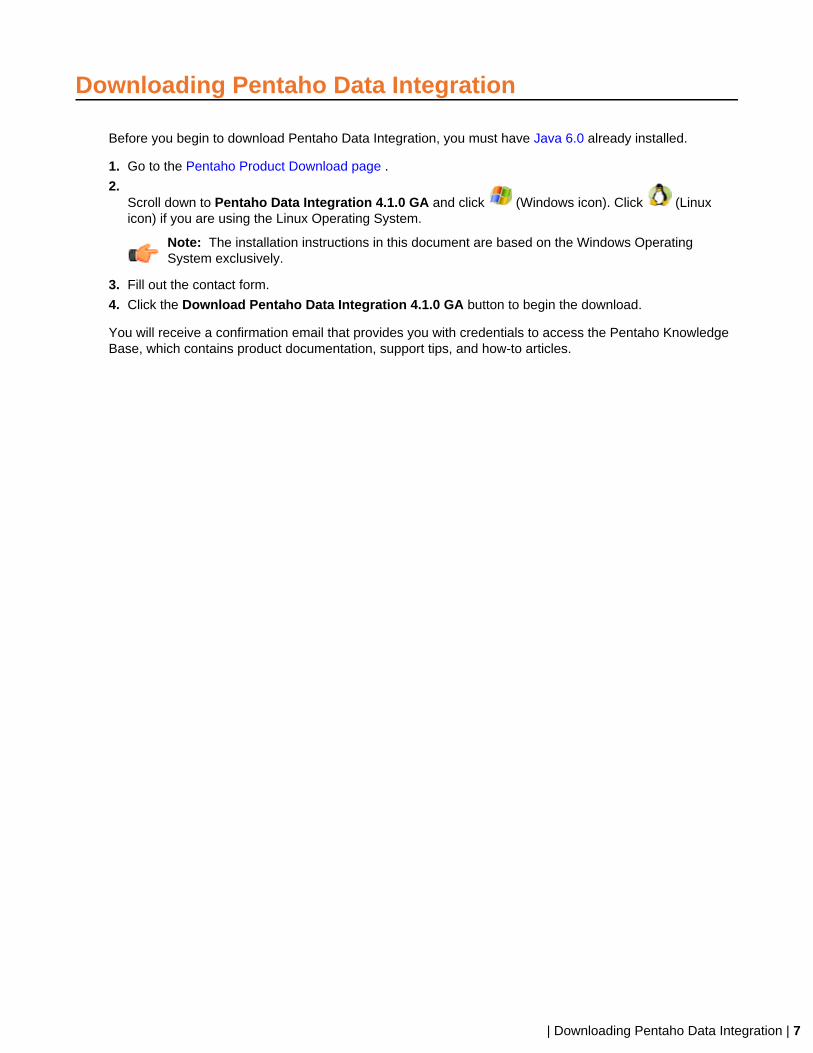
Before you begin to download Pentaho Data Integration, you must have Java 6.0 already installed.
1. Go to the Pentaho Product Download page .
2.Scroll down to Pentaho Data Integration 4.1.0 GA and click (Windows icon). Click (Linuxicon) if you are using the Linux Operating System.
Note: The installation instructions in this document are based on the Windows OperatingSystem exclusively.
3. Fill out the contact form.
4. Click the Download Pentaho Data Integration 4.1.0 GA button to begin the download.
You will receive a confirmation email that provides you with credentials to access the Pentaho KnowledgeBase, which contains product documentation, support tips, and how-to articles.

8 | | Installing Pentaho Data Integration
Installing Pentaho Data Integration
It is assumed that you will follow the default installation instructions and that you are installing to a localdevice (localhost).
1. Read and accept the License Agreement.2. Specify the location where you want to install Pentaho Data Integration or click Next to accept the
default.3. Set the user name and password for the Administrator account. For the purposes of this evaluation,
accept the default user name, "admin," and type "password" in Password and Confirm Passwordfields.
4. Click Next to accept the default installation options on the Summary page.5. Click Next to begin installation.
Pentaho Data Integration is installed as a Window service. When installation is complete, the Spoondesigner is launched.
Starting the Spoon Designer
If you inadvertently exit the Spoon designer, follow the instructions below to launch it again.
1. Navigate to the folder where you have installed Pentaho Data Integration; for example c:\ProgramFiles\pentaho\design-tools\data-integration.
2. Double-click Spoon.bat to launch the designer.
Note: If you are using Linux, double-click spoon.sh. To start the Spoon Designer on a Mac, goto .../pdi-ee/data-integration and double click on the Data Integration 32-bit or DataIntegration 64-bit icon depending on your system.
3. Alternatively, in Windows, go to Start -> Pentaho Enterprise Edition -> Design Tools to launch thedesigner.
Pentaho Data Integration Folders and Scripts
After installation, your pentaho folder contains the following files and directories:
File/Folder Name Description
\design-tools\data-integration Contains the Spoon designer and commandline utilities
\server Contains the data integration server includingindividual start/stop scripts; contains theenterprise console server including individualstart/stop scripts
\docs Contains this document
\server\data-integration-server\ start-pentaho.bat
Script file for starting the Data Integrationserver on Windows
\server\data-integration-server\ start-pentaho.sh
Script file for starting the Data Integrationserver on Linux and Macintosh
| Installing Pentaho Data Integration | 9
File/Folder Name Description
\server\data-integration-server\ stop-pentaho.bat
Script file for stopping the Data Integrationserver on Windows
\server\data-integration-server\ stop-pentaho.sh
Script file for stopping the Data Integrationserver on Linux and Macintosh
\design-tools\data-integration\Spoon.bat Script file for starting the Spoon Designer onWindows
\design-tools\data-integration\spoon.sh Script file for starting the Spoon Designer onLinux and Macintosh
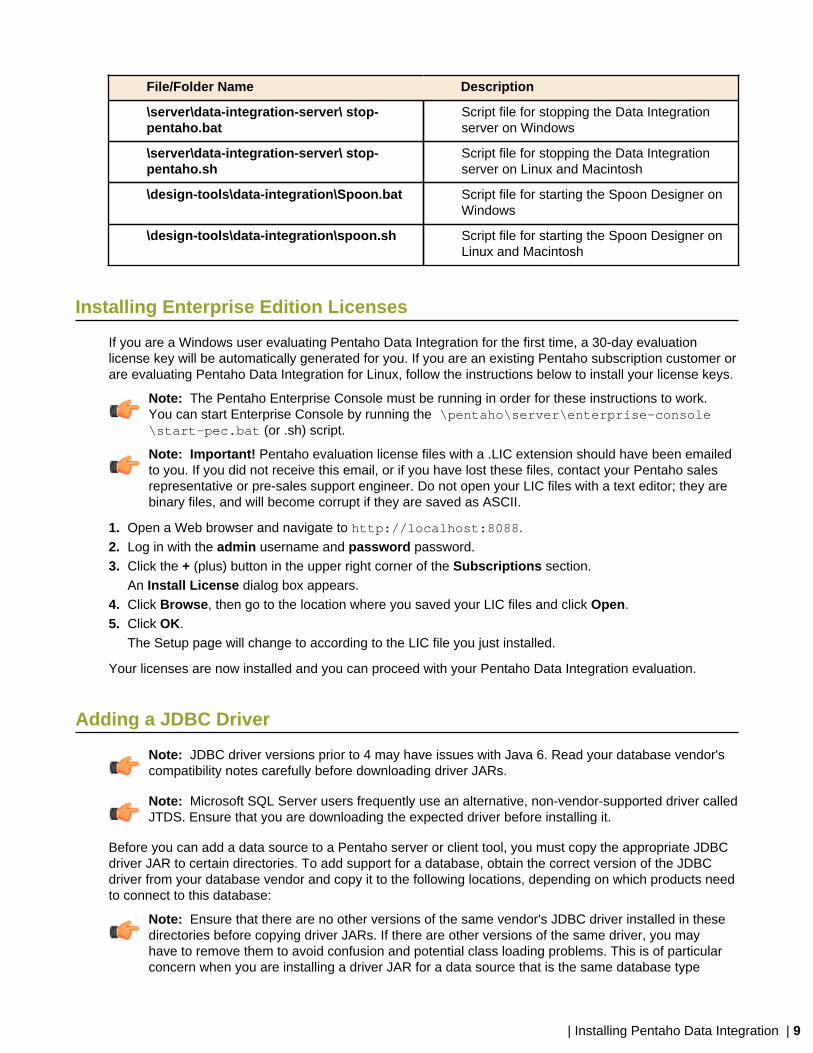
Installing Enterprise Edition Licenses
If you are a Windows user evaluating Pentaho Data Integration for the first time, a 30-day evaluationlicense key will be automatically generated for you. If you are an existing Pentaho subscription customer orare evaluating Pentaho Data Integration for Linux, follow the instructions below to install your license keys.
Note: The Pentaho Enterprise Console must be running in order for these instructions to work.You can start Enterprise Console by running the \pentaho\server\enterprise-console\start-pec.bat (or .sh) script.
Note: Important! Pentaho evaluation license files with a .LIC extension should have been emailedto you. If you did not receive this email, or if you have lost these files, contact your Pentaho salesrepresentative or pre-sales support engineer. Do not open your LIC files with a text editor; they arebinary files, and will become corrupt if they are saved as ASCII.
1. Open a Web browser and navigate to http://localhost:8088.2. Log in with the admin username and password password.3. Click the + (plus) button in the upper right corner of the Subscriptions section.
An Install License dialog box appears.4. Click Browse, then go to the location where you saved your LIC files and click Open.5. Click OK.
The Setup page will change to according to the LIC file you just installed.
Your licenses are now installed and you can proceed with your Pentaho Data Integration evaluation.
Adding a JDBC Driver
Note: JDBC driver versions prior to 4 may have issues with Java 6. Read your database vendor'scompatibility notes carefully before downloading driver JARs.
Note: Microsoft SQL Server users frequently use an alternative, non-vendor-supported driver calledJTDS. Ensure that you are downloading the expected driver before installing it.
Before you can add a data source to a Pentaho server or client tool, you must copy the appropriate JDBCdriver JAR to certain directories. To add support for a database, obtain the correct version of the JDBCdriver from your database vendor and copy it to the following locations, depending on which products needto connect to this database:
Note: Ensure that there are no other versions of the same vendor's JDBC driver installed in thesedirectories before copying driver JARs. If there are other versions of the same driver, you mayhave to remove them to avoid confusion and potential class loading problems. This is of particularconcern when you are installing a driver JAR for a data source that is the same database type

10 | | Installing Pentaho Data Integration
as your Pentaho solution repository. If you have any doubts as to how to proceed, contact yourPentaho support representative for guidance.
• BI Server: /pentaho/server/biserver-ee/tomcat/lib/• Data Integration Server: /pentaho/server/data-integration-server/tomcat/lib/• BI Server and Data Integration Server: /pentaho/server/enterprise-console/jdbc/• Data Integration client: /pentaho/design-tools/data-integration/libext/JDBC/• Report Designer: /pentaho/design-tools/report-designer/lib/jdbc/• Schema Workbench: /pentaho/design-tools/schema-workbench/drivers/• Aggregation Designer: /pentaho/design-tools/agg-designer/drivers/• Metadata Editor: /pentaho/design-tools/metadata-editor/libext/JDBC/
Note: If you installed a new driver to the BI Server or DI Server, you must restart all affectedservers (BI Server, DI Server, and the Pentaho Enterprise Console) to load the new database driver.
| Connecting to the Enterprise Repository | 11
Connecting to the Enterprise Repository
Next, you will create a connection to the Enterprise Repository that is part of the Data IntegrationServer. The Enterprise Repository is used to store and schedule the example transformation and job youwill create when performing the exercises in this document.
To create a connection to the Enterprise Repository:...
1. In the Repository Connection dialog box, click (Add).
2. Select Enterprise Repository:Enterprise Repository and click OK.The Repository Configuration dialog box appears.
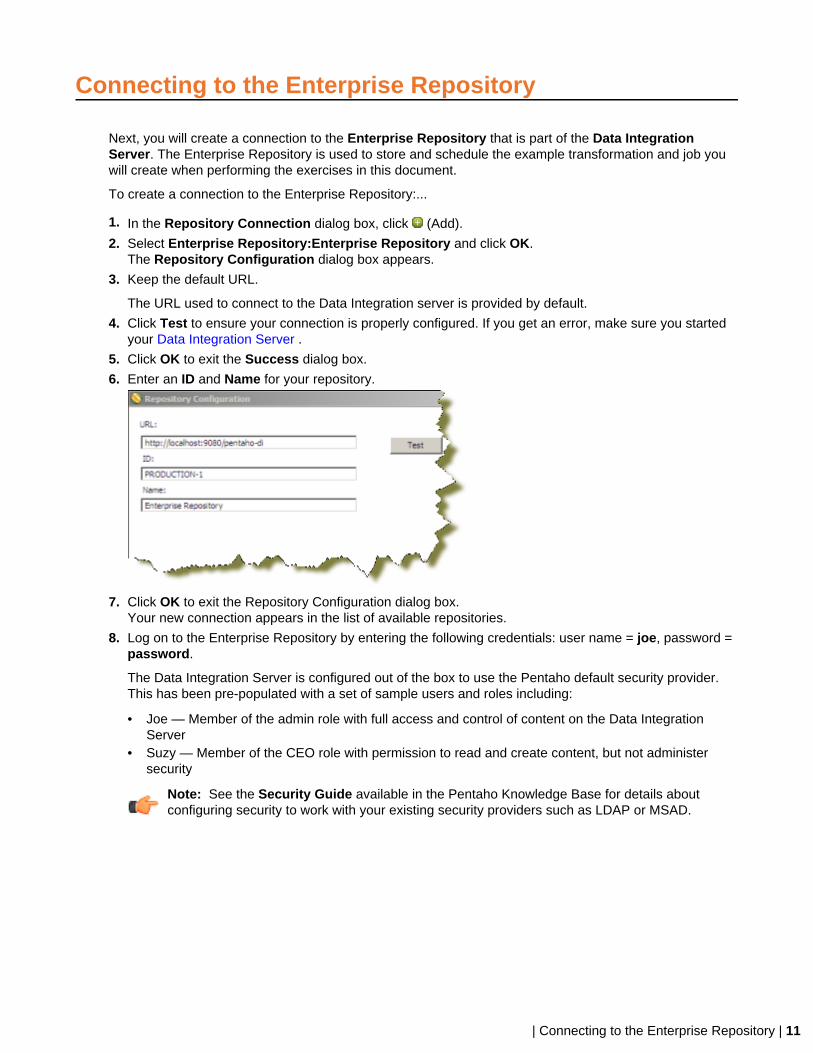
3. Keep the default URL.
The URL used to connect to the Data Integration server is provided by default.
4. Click Test to ensure your connection is properly configured. If you get an error, make sure you startedyour Data Integration Server .
5. Click OK to exit the Success dialog box.
6. Enter an ID and Name for your repository.
7. Click OK to exit the Repository Configuration dialog box.Your new connection appears in the list of available repositories.
8. Log on to the Enterprise Repository by entering the following credentials: user name = joe, password =password.
The Data Integration Server is configured out of the box to use the Pentaho default security provider.This has been pre-populated with a set of sample users and roles including:
• Joe — Member of the admin role with full access and control of content on the Data IntegrationServer
• Suzy — Member of the CEO role with permission to read and create content, but not administersecurity
Note: See the Security Guide available in the Pentaho Knowledge Base for details aboutconfiguring security to work with your existing security providers such as LDAP or MSAD.
12 | | Navigating through the Interface
Navigating through the Interface
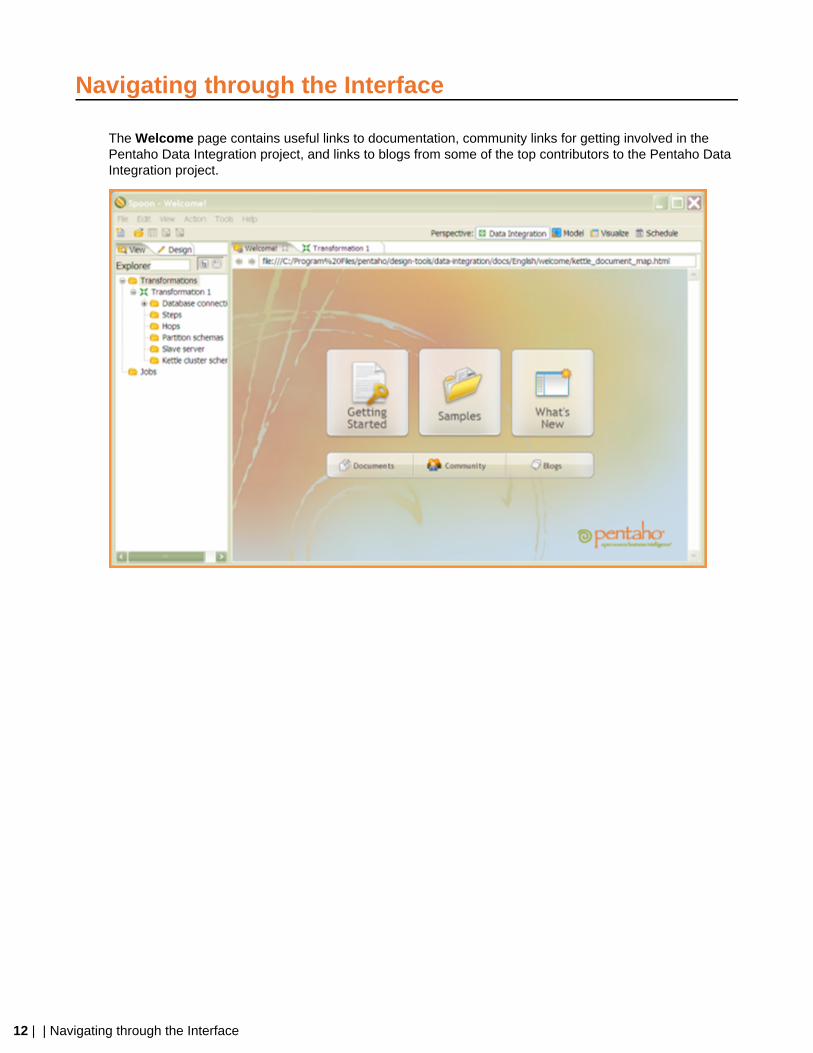
The Welcome page contains useful links to documentation, community links for getting involved in thePentaho Data Integration project, and links to blogs from some of the top contributors to the Pentaho DataIntegration project.
| Navigating through the Interface | 13
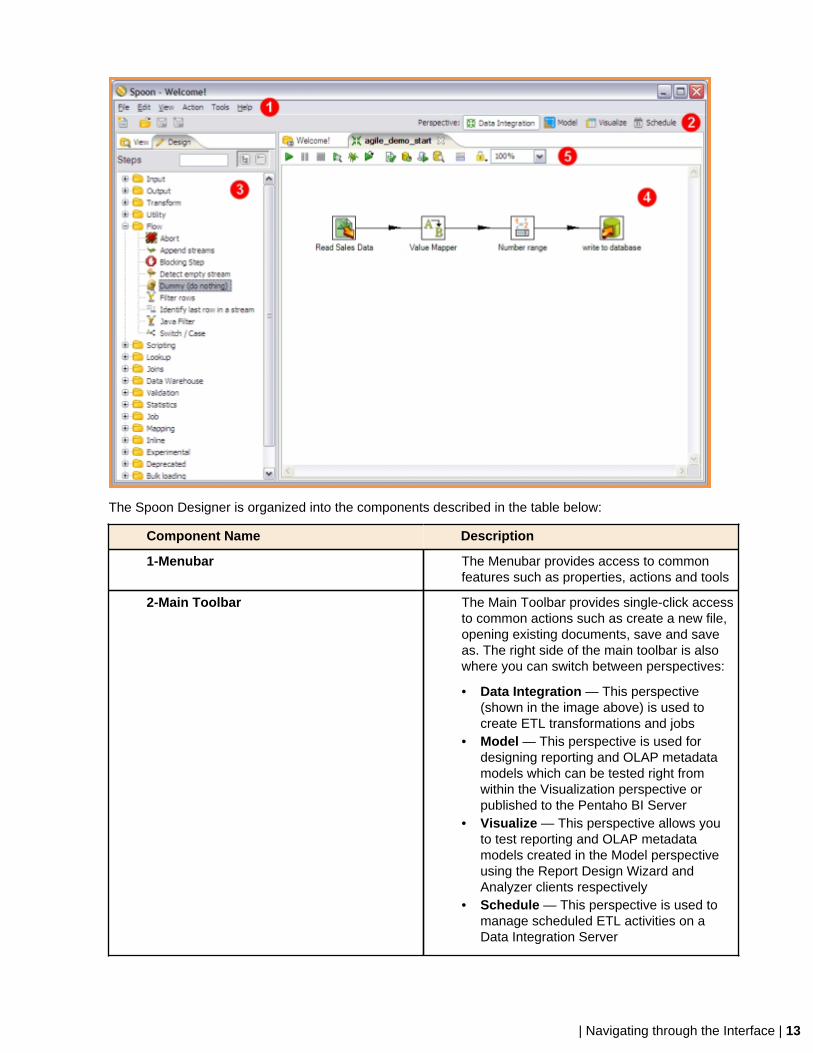
The Spoon Designer is organized into the components described in the table below:
Component Name Description
1-Menubar The Menubar provides access to commonfeatures such as properties, actions and tools
2-Main Toolbar The Main Toolbar provides single-click accessto common actions such as create a new file,opening existing documents, save and saveas. The right side of the main toolbar is alsowhere you can switch between perspectives:
• Data Integration — This perspective(shown in the image above) is used tocreate ETL transformations and jobs
• Model — This perspective is used fordesigning reporting and OLAP metadatamodels which can be tested right fromwithin the Visualization perspective orpublished to the Pentaho BI Server
• Visualize — This perspective allows youto test reporting and OLAP metadatamodels created in the Model perspectiveusing the Report Design Wizard andAnalyzer clients respectively
• Schedule — This perspective is used tomanage scheduled ETL activities on aData Integration Server

14 | | Navigating through the Interface
Component Name Description
3-Design Palette While in the Data Integration perspective,the Design Palette provides an organizedlist of transformation steps or job entriesused to build transformations and jobs.Transformations are created by simplydragging transformation steps fromthe Design Palette onto the GraphicalWorkspace, or canvas, (4) and connectingthem with hops to describe the flow of data.
4-Graphical Workspace The Graphical Workspace, or canvas, is themain design area for building transformationsand jobs describing the ETL activities youwant to perform.
5-Sub-toolbar The Sub-toolbar provides buttons for quickaccess to common actions specific to thetransformation or job such as Run, Previewand Debug.
| Creating Your First Transformation | 15
Creating Your First Transformation
The Data Integration perspective of Spoon allows you to create two basic document types: transformationsand jobs. Transformations are used to describe the data flows for ETL such as reading from a source,transforming data and loading it into a target location. Jobs are used to coordinate ETL activities such asdefining the flow and dependencies for what order transformations should be run, or prepare for executionby checking conditions such as, "Is my source file available?," or "Does a table exist in my database?"
This exercise will step you through building your first transformation with Pentaho Data Integrationintroducing common concepts along the way. The exercise scenario includes a flat file (CSV) of sales datathat you will load into a database so that mailing lists can be generated. Several of the customer recordsare missing postal codes (zip codes) that must be resolved before loading into the database. The logiclooks like this:
Retrieving Data from a Flat File (Text File Input Step)
Follow the instructions below to retrieve data from a flat file.
1. Click (New) in the upper left corner of the Spoon graphical interface.
2. Select Transformation from the list.
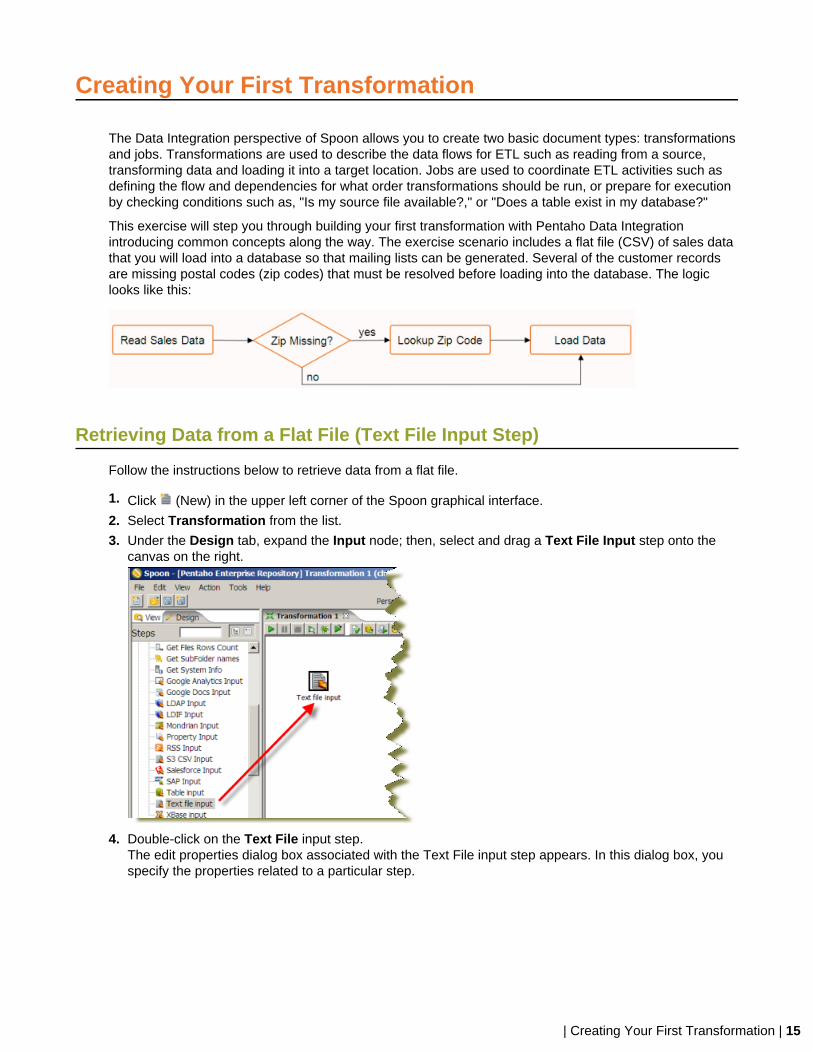
3. Under the Design tab, expand the Input node; then, select and drag a Text File Input step onto thecanvas on the right.
4. Double-click on the Text File input step.The edit properties dialog box associated with the Text File input step appears. In this dialog box, youspecify the properties related to a particular step.

16 | | Creating Your First Transformation
5. In the Step Name field, type Read Sales Data.You are renaming the Text File Input step to Read Sales Data.
6. Click Browse to locate the source file, sales_data.csv, available at ...\design-tools\data-integration\samples\transformations\files.The path to the source file appears in the File or directory field.
7. Click Add.The path to the file appears under Selected Files. You can look at the contents of the file by clickingthe Show file content to determine things such as how the input file is delimited, what enclosurecharacter is used, and whether or not a header row is present. In the example, the input file is comma(,) delimited, the enclosure character being a quotation mark (“) and it contains a single header rowcontaining field names.
8. Click the Content tab.The fields under the Content tab allow you to define how your data is formatted.
9. Make sure that the Separator is set to comma (,) and that the Enclosure is set to quotation mark (").Enable Header because there is one line of header rows in the file.
10.Click the Fields tab and click Get Fields to retrieve the input fields from your source file.A dialog box appears requesting that you to specify the number of lines to scan, allowing you todetermine default settings for the fields such as their format, length, and precision. Type 0 (zero) in the

| Creating Your First Transformation | 17
Number of Sample Lines text box to scan all lines. By scanning all lines, you ensure that PentahoData Integration has read the entire contents of the file and you reduce the possibility of errors that maycause a transformation not to run. Click OK and the summary of the scan results appears. Once youare done examining the scan results,click Close to return to the step properties editor.
11.Under the Fields tab, find the SALES field. Notice that SALES is set as a String data type. This is howPentaho Data Integration interpreted the data type for the field. You are going to change the data typeto a number. Click String and select Number from the drop down list. Change the Format to #.## or0.00 so that your numeric values display correctly.
12.Click Preview Rows to verify that your file is being read correctly. You can change the number of rowsto preview. click OK to exit the step properties dialog box.
13.Save your transformation. See Saving Your Transformation on page 18.

18 | | Creating Your First Transformation
Saving Your Transformation
Follow the instructions below to save your transformation.
Note: You can save your transformation at any point in this walk through. Saving allows you to startand stop the exercises at your convenience.
1. In the Spoon designer, click File -> Save As.The Transformation Properties dialog box appears.
2. In the Transformation Name field, type Getting Started Transformation.
3. In the Directory field, click (folder icon) to select a repository folder where you will save yourtransformation.
4. Expand the Home directory and double-click the joe folder.Your transformation will be stored in the joe folder in the Enterprise Repository.
5. Click OK to exit the Transformation Properties dialog box.The Enter Comment dialog box appears.
6. Click in the Enter Comment dialog box and press <Delete> to remove the default text string. Type ameaningful comment about your transformation.The comment and your transformation are tracked for version control purposes in the EnterpriseRepository.
7. Click OK to exit the Enter Comment dialog box.
Filter Records with Missing Postal Codes (Filter Rows Step)
The source file contains several records that are missing postal codes. You will now use the Filter Rowstransformation step to separate out those records so that you can resolve them in a later exercise.
1. Add a Filter Rows step to your transformation. Under the Design tab, go to Flow -> Filter Rows.2. Create a "hop" between the Read Sales Data (Text File Input) step and the Filter Rows step. Hops are
used to describe the flow of data in your transformation. To create the hop, click the Read Sales Data(Text File input) step, then press the <SHIFT> key down and draw a line to the Filter Rows step.
Alternatively, you can draw hops by hovering over a step until the hover menu appears. Drag the hoppainter icon from the source step to your target step.

| Creating Your First Transformation | 19
Note: For more information on hops including a description of color coding and hop icons, seethe Pentaho Data Integration User Guide in the Pentaho Knowledge Base.
3. Double-click the Filter Rows step.The Filter Rows edit properties dialog box appears.
4. In the Step Name field type, Filter Missing Zips.
5. Under The condition, click <field>. A dialog box that contains the fields you can use to create yourcondition appears.
6. In the Fields: dialog box select POSTALCODE and click OK.
7. Click on the comparison operator (set to = by default) and select the IS NOT NULL function and clickOK. Click OK to exit the Filter Rows properties dialog box.
Note: You will return to this step later and configure the Send true data to step and Send falsedata to step settings after adding their target steps to your transformation.
8. Save your transformation.

20 | | Creating Your First Transformation
Loading Your Data into a Relational Database (Table Output Step)
In this exercise you will take all records exiting the Filter rows step where the POSTALCODE was not null(the true condition) and load them into a database table.
1. Under the Design tab, expand the contents of the Output node.2. Click and drag a Table Output step into your transformation; create a hop between the Filter Missing
Zips (Filter Rows) and Table Output steps. Select Result is TRUE.
3. Double-click the Table Output step to open its edit properties dialog box.4. Rename your Table Output Step to Write to Database.5. Click New next to the Connection field. You must create a connection to the database.
The Database Connection dialog box appears.
6. Provide the settings for connecting to the database as shown in the table below.
Connection Name Type, Sample Data
Connection Type: Choose, H2
Host Name localhost
Database Name Type sampledata
Port Number 9092
User Name sa
Password blank/no password
7. Click Test to make sure your entries are correct. A success message appears. Click OK.

| Creating Your First Transformation | 21
Note: If you get an error when testing your connection, ensure that you have provided thecorrect settings information as described in the table and that the sample database is running.See Starting Pentaho Data Integration for information about how to start the Data IntegrationServers.
8. Click OK, to exit the Database Connections dialog box.
9. Type SALES_DATA in the Target Table text field.
This table does not exist in the target database. In the next steps you will generate the Data DefinitionLanguage (DDL) to create the table and execute it. DDL are the SQL commands that define thedifferent structures in a database such as CREATE TABLE.
10.In the Table Output edit properties dialog box, enable the Truncate Table property.
11.Click SQL to generate the DDL for creating your target table.
12.Click Execute to run the SQL.A results dialog box apperas indicating that one SQL statement was executed. Click OK close theexecution dialog box. Click Close to close the Simple SQL editor dialog box. Click OK to close theTable Output edit properties dialog box.
13.Save your transformation.
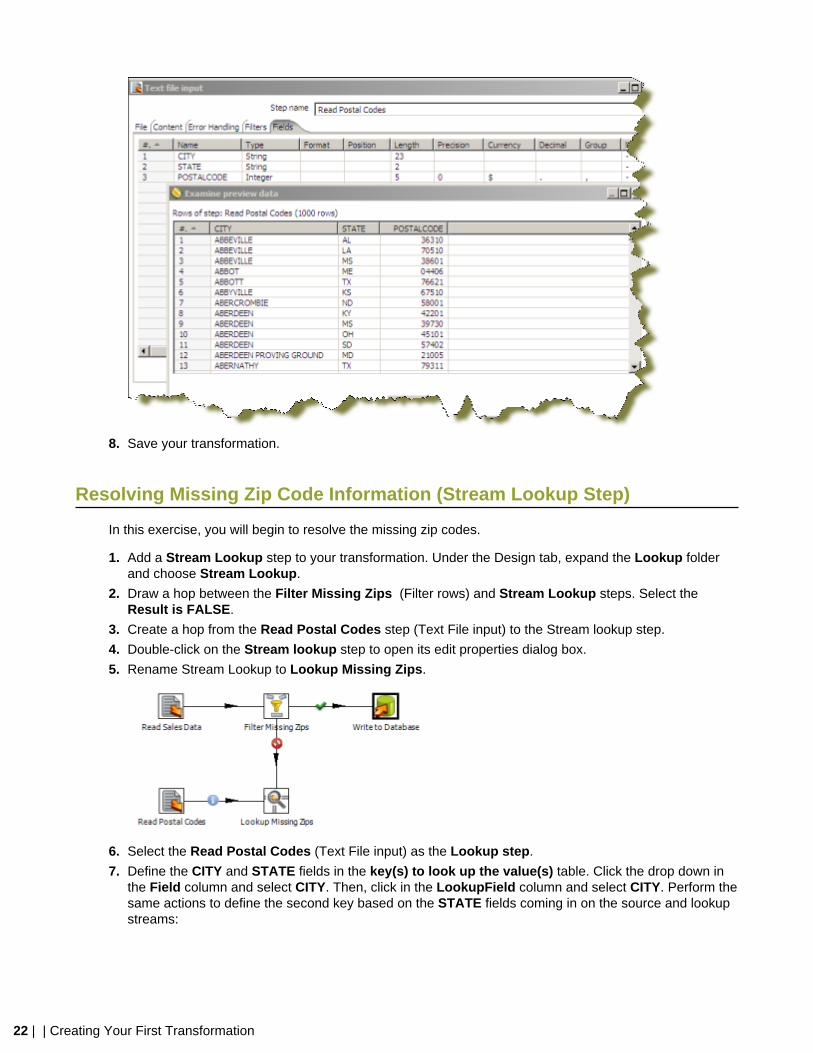
Retrieving Data from your Lookup File (Text File Input Step)
You have been provided a second text file containing a list of cities, states, and postal codes that you willnow use to look up the postal codes for all of the records where they were missing (the ‘false’ branch ofyour Filter rows step). First, you will use a Text file input step to read from the source file, next you will usea Stream lookup step to bring the resolved Postal Codes into the stream.
1. Add a new Text File Input step to your transformation. In this step you will retrieve the records fromyour lookup file.
2. Rename your Text File input step to, Read Postal Codes.
3. Click Browse to locate the source file, Zipssortedbycitystate.csv, located at ...\design-tools\data-integration\samples\transformations\files.
4. Click Add.The path to the file appears under Selected Files.
Note: Click Show File Content to view the contents of the file. This file is comma (,) delimited,with an enclosure of quotation mark (“), and contains a single header row.
5. Under the Content tab, enable the Header option. Change the separator character to a comma (,). andconfirm that the enclosure setting is correct.
6. Under the Fields tab, click Get Fields to retrieve the data from your .csv file.
7. Click Preview Rows to make sure your entries are correct and click OK to exit the Text File inputproperties dialog box.
22 | | Creating Your First Transformation
8. Save your transformation.
Resolving Missing Zip Code Information (Stream Lookup Step)
In this exercise, you will begin to resolve the missing zip codes.
1. Add a Stream Lookup step to your transformation. Under the Design tab, expand the Lookup folderand choose Stream Lookup.
2. Draw a hop between the Filter Missing Zips (Filter rows) and Stream Lookup steps. Select theResult is FALSE.
3. Create a hop from the Read Postal Codes step (Text File input) to the Stream lookup step.
4. Double-click on the Stream lookup step to open its edit properties dialog box.
5. Rename Stream Lookup to Lookup Missing Zips.
6. Select the Read Postal Codes (Text File input) as the Lookup step.
7. Define the CITY and STATE fields in the key(s) to look up the value(s) table. Click the drop down inthe Field column and select CITY. Then, click in the LookupField column and select CITY. Perform thesame actions to define the second key based on the STATE fields coming in on the source and lookupstreams:

| Creating Your First Transformation | 23
8. Click Get Lookup Fields. POSTALCODE is the only field you want to retrieve. (To delete the extraCITY and STATE lines, right-click in the line and select Delete Selected Line.) Give POSTALCODE anew name of ZIP_RESOLVED and make sure the Type is set to String. Click OK to close the StreamLookup edit properties dialog box.
9. Save your transformation.
You can now select the Lookup Missing Zips step (Stream lookup ) in the graphical workspace. Right-click and select Preview to display the preview/debugger dialog box. Click Quick Launch to previewthe data flowing through this step. Notice that the new field, ZIP_RESOLVED, has been added to thestream containing your resolved postal codes.
Completing your Transformation (Select Values Step)
The last task is to clean up the field layout on your lookup stream so that it matches the format and layoutof your other stream going to the Write to Database (Table output) step. You will create a Select valuesstep. This is a very useful step for renaming fields on the stream, removing unnecessary fields, and more.
1. Add a Select Values step to your transformation. Expand the Transform folder and choose SelectValues.
2. Create a hop between the Lookup Missing Zips and Select Values steps.
3. Double-click the Select Values step to open its properties dialog box.
4. Rename the Select Values step to, Prepare Field Layout.
5. Click Get fields to select to retrieve all fields and begin modifying the stream layout.
6. Select the ZIP_RESOLVED field in the Fields list and use <CTRL><UP> to move it just below thePOSTALCODE field (the one that still contains null values).
7. Select the old POSTALCODE field in the list (line 20) and delete it.

24 | | Creating Your First Transformation
8. The original POSTALCODE field was formatted as an 9-character string. You must modify your newfield to match the form. Click the Meta-Data tab.
9. In the first row of the Fields to alter table, click in the Fieldname column and select ZIP_RESOLVED.10.Type POSTALCODE in the Rename to column; select String in the Type column, and type 9 in the
Length column. Click OK to exit the edit properties dialog box.11.Draw a hop from the Prepare Field Layout (Select values) step to the Write to Database (Table
output) step.12.Save your transformation.
Running Your Transformation
Pentaho Data Integration provides a number of deployment options depending on the needs of your ETLproject in terms of performance, batch load window, and so on. The three most common approaches are:
Local execution Allows you to execute a transformation or jobfrom within the Spoon design environment(on your local machine). This is ideal fordesigning and testing transformations orlightweight ETL activities
Execute remotely For more demanding ETL activities, considersetting up a dedicated Enterprise EditionData Integration Server and using theExecute remotely option in the run dialog. TheEnterprise Edition Data Integration Serveralso enables you to schedule execution in thefuture or on a recurring basis.
Execute clustered For even greater scalability or as an optionto reduce your execution times, PentahoData Integration also supports the notion of
| Creating Your First Transformation | 25
clustered execution allowing you to distributethe load across a number of data integrationservers.
This final part of the creating a transformation exercise focuses exclusively on the local execution option.For more information on remote, clustered and other execution options review the links in the additionalresources section later in this guide or in the Pentaho Data Integration User Guide found in the KnowledgeBase.
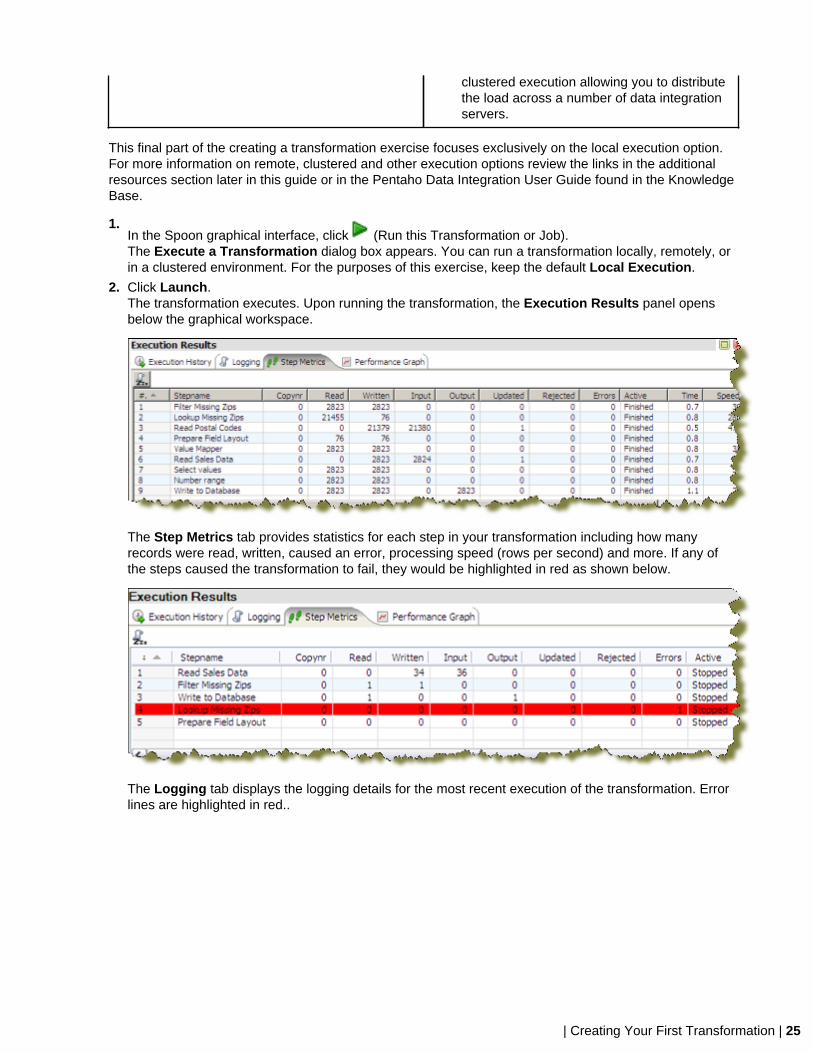
1.In the Spoon graphical interface, click (Run this Transformation or Job).The Execute a Transformation dialog box appears. You can run a transformation locally, remotely, orin a clustered environment. For the purposes of this exercise, keep the default Local Execution.
2. Click Launch.The transformation executes. Upon running the transformation, the Execution Results panel opensbelow the graphical workspace.
The Step Metrics tab provides statistics for each step in your transformation including how manyrecords were read, written, caused an error, processing speed (rows per second) and more. If any ofthe steps caused the transformation to fail, they would be highlighted in red as shown below.
The Logging tab displays the logging details for the most recent execution of the transformation. Errorlines are highlighted in red..

26 | | Creating Your First Transformation
You can see that in this case the Lookup Missing Zips step caused an error because it attempted tolookup values on a field called POSTALCODE2, which did not exist in the lookup stream.
The Execution History tab provides you access to the Step Metrics and log information from previousexecutions of the transformation. This feature works only if you have configured your transformation tolog to a database through the Logging tab of the Transformation Settings dialog. For more informationon configuring logging or viewing the execution history, see the Pentaho Data Integration User Guidefound in the Knowledge Base.
The Performance Graph allows you to analyze the performance of steps based on a variety of metricsincluding how many records were read, written, caused an error, processing speed (rows per second)and more.
Like the Execution History, this feature requires you to configure your transformation to log to adatabase through the Logging tab of the Transformation Settings dialog box. For more information onconfiguring logging or performance monitoring, see the Pentaho Data Integration User Guide found inthe Knowledge Base.

| Building Your First Job | 27
Building Your First Job
Jobs are used to coordinate ETL activities such as:
• Defining the flow and dependencies for what order transformations should be run• Preparing for execution by checking conditions such as, "Is my source file available?," or "Does a table
exist?"• Performing bulk load database operations• File Management such as posting or retrieving files using FTP, copying files and deleting files• Sending success or failure notifications through email
For this exercise, imagine that an external system is responsible for placing your sales_data.csv input inits source location every Saturday night at 9 p.m. You want to create a job that will check to see that the filehas arrived and run your transformation to load the records into the database. In a subsequent exercise,you will schedule the job to be run every Sunday morning at 9 a.m.
1. Click (New) in the upper left corner of the Spoon graphical interface.2. Select Job from the list.3. Expand the General folder and drag a Start job entry onto the graphical workspace..
The Start job entry defines where the execution will begin.4. Expand the Conditions folder and add a File Exists job entry.5. Draw a hop from the Start job entry to the File Exists job entry.6. Double-click the File Exists job entry to open its edit properties dialog box. Click Browse and select the
sales_data.csv from the following location: ...\design-tools\data-integration\samples\transformations\files.Be sure to set the filter to CSV files to see the file.
7. Expand the General folder and add a Transformation job entry.8. Draw a hop between the File Exists and the Transformation job entries.9. Double-click the Transformation job entry to open its edit properties dialog box.10.
Select the Specify by name and directory option. Click (Browse).

28 | | Building Your First Job
11.Expand the repository tree to find your sample transformation. Select it and click OK. You likely haveyour transformation stored under the "joe," (not public), folder.
12.Save your transformation as Sample Job.
13.Click Run Job. When the Execute a Job dialog box appears, choose Local Execution and clickLaunch.
The Execution Results panel should open showing you the job metrics and log information for the jobexecution.

| Scheduling the Execution of Your Job | 29
Scheduling the Execution of Your Job
The Enterprise Edition Pentaho Data Integration Server provides scheduling services allowing you toschedule the execution of jobs and transformations in the future or on a recurring basis. In this example,you will create a schedule that runs your Sample Job every Sunday at 9 am..
1. Open your sample job.
2. In the menubar, go to Action -> Schedule.The Schedule dialog box appears.
3. For the Start option, select the Date, click the calendar icon. When the calendar appears, choose thenext Sunday.
4. Under the Repeat section, select the Weekly option. Enable the Sunday check box.
5. For the End date, select Date and then enter a date several weeks in the future using the calendarpicker.
6. Click OK to complete your schedule.
Note: The scheduler includes full support for Pentaho Data Integrations parameters, arguments,and variables. For more detailed information on scheduling options, please refer to the PentahoData Integration User Guide found in the Knowledge Base (document not available until GArelease of Pentaho Data Integration).
7. To view, edit and manage all scheduled activities, click the Schedule perspective on the main toolbar.Here you can view a list of all schedules along with information such as when the next scheduled runwill take place, when the last run took place and its duration and who scheduled the activity.
8. If the scheduler is stopped, you must click (Start Scheduler) on the sub-toolbar. If the buttonappears with a red stop icon, the scheduler is already running. Your scheduled activity will take place asindicated at the Next Run time.

30 | | Scheduling the Execution of Your Job
Note: You can also start and stop individual schedules by selecting them in the table and usingthe Start and Stop buttons on the sub-toolbar.

| Building Business Intelligence Solutions Using Agile BI | 31
Building Business Intelligence Solutions Using Agile BI
Historically, starting new Business Intelligence projects required careful consideration of a broad set offactors including:
Data Considerations
• Where is my data coming from?• Where will it be stored?• What cleansing and enrichment is necessary to address the business needs?
Information Delivery Consideration
• Will information be delivered through static content like pre-canned reports and dashboards?• Will users need the ability to build their own reports or perform interactive analysis on the data?
Skill Set Considerations
• If users need self-service reporting and analysis, what skill sets do you expect them to have?• Assuming the project involves some combination of ETL, content creation for reports and dashboards,
and meta-data modeling to enable business users to create their own content, do we have all the toolsand skill sets to build the solution in a timely fashion?
Cost
• How many tools and from how many vendors will it take to implement the total solution?• If expanding the use of a BI tool already in house, what are the additional licensing costs associated
with rolling it out to a new user community?• What are the costs in both time and money to train up on all tools necessary to roll out the solution?• How long is the project going to take and when will we start seeing some ROI?
Because of this, many new projects are scratched before they even begin. Pentaho’s Agile BI initiativeseeks to break down the barriers to expanding your use of Business Intelligence through an iterativeapproach to scoping, prototyping, and building complete BI solutions. It is an approach that centers on thebusiness needs first, empowers the business users to get involved at every phase of development, andprevents projects from going completely off track from the original business goals.
In support of the Agile BI methodology, the Spoon design environment provides an integrated designenvironment for performing all tasks related to building a BI solution including ETL, reporting and OLAPmetadata modeling and end user visualization. In a single click, Business users will instantly be able tostart interacting with data, building reports with zero knowledge of SQL or MDX, and work hand in handwith solution architects to refine the solution.
Using Agile BI
This exercise builds upon your sample transformation and highlights the power an integrated designenvironment can provide for building solutions using Agile BI.
For this example, your business users have asked to see what the top 10 countries are based on sales.Furthermore, they want the data broken down by deal size where small deals are those less than $3,000,medium sized deals are between $3,000 and $7,000, and large deals are over $7,000.
1. Open or select the tab containing the sample transformation you just created.
2. Right-click the Write to Database (Table Output) step, and select Visualize -> Analyzer.In the background, Pentaho Data Integration automatically generates the OLAP model that allows youto begin interacting immediately with your new data source.
3. Drag the COUNTRY field from the Field list on the left onto the report.
4. Drag the SALES measure from the Field list onto the report.

32 | | Building Business Intelligence Solutions Using Agile BI
Note: Immediately you can see that there is another problem with the quality of the data. Somerecords being loaded into the database have a COUNTRY value of United States, while othershave a value of USA. In the next steps, you will return to the Data Integrationperspective toresolve this issue.
Correcting the Data Quality Issue
Follow the instructions below to correct the data quality issue:
1. Click on the Data Integration perspective in the main toolbar.
2. Right-click the Table output step from the flow and choose Detach step. Repeat this process to detachthe second hop.
3. Expand the Transform folder in the Design Palette and add a Value Mapper step to thetransformation.
4. Draw a hop from the Filter Missing Zips (Filter rows) step to the Value Mapper step and select Resultis TRUE.
5. Draw a hop from the Prepare Field Layout (Select values) step to the Value Mapper step.6. Draw a hop from the Value Mapper step to the Write to Database (Table output) step. Your
transformation should look like the sample below:
7. Double-click on the Value Mapper step to open its edit step properties dialog box.8. Select the COUNTRY field in the Fieldname to use input.9. In the first row of the Field Values table, type United States as the Source value and USA as the
Target value. Click OK to exit the dialog box.

| Building Business Intelligence Solutions Using Agile BI | 33
10.Save and run the transformation.
11.Click Visualize in the main toolbar.
12.Click the Clear Cache link at the top of the report.
13.Click Refresh under the data section of the Visualization Properties panel and notice that the datahas been cleansed.
Creating a Top Ten Countries by Sales Chart
Follow the instructions below to create the top ten countries by sales chart:
1. Right-click the COUNTRY header and select Top 10, and so on..
2. Confirm that the default settings are set to return the Top 10 COUNTRY members by the SALESmeasure. Click OK.
3.Click (chart) and select Stacked Bar to change the visualization to a bar chart.

34 | | Building Business Intelligence Solutions Using Agile BI
Breaking Down Your Chart by Deal Size
Your source data does not contain an attribute for Deal Size, so you will use the Data Integrationperspective to add the new field.1. Click Data Integration in the main toolbar.2. Expand the Transform folder and drag a Number Range step onto the graphical workspace between
the Value Mapper step and the Write to Database (Table Output) step. Click Yes to split the hop.
3. Double-click Number range to open its edit properties dialog box.4. Choose the SALES field as your Input field.5. Type DEAL SIZE as the name for the Output field.6. In the Ranges table, define number ranges as shown in the example below. Click OK.
Note: Because this step will be adding new field into the stream, you must update your targetdatabase table to add the new column in the next steps.
7. Double-click on the Write to Database (Table output) step.8. Click SQL to generate the DDL necessary to update the target table.

| Building Business Intelligence Solutions Using Agile BI | 35
9. Click Execute to run the SQL. Click OK to close the results dialog box. Click Close to exit the SimpleSQL Editor dialog box. Click OK to close the edit step properties dialog.
10.Save and run your transformation to re-populate your target database.
Wrapping it Up
Follow the instructions below to complete your Agile BI exercise:
1. Click Visualize to return to your Top 10 Countries chart. Next, you will update your dimensional modelwith the new Deal Size attribute.
2. Click View in the Visualization Properties panel on the right to display the Model perspective and beginediting the model used to build your chart.
3. Drag the DEALSIZE field from the list of available fields on the left onto the Dimensions folder in theModel panel in the middle. This adds a new dimension called DEALSIZE with a single default hierarchyand level of the same name.
4. Click Save on the main toolbar to save your updated model. Click Visualize to return to your Top 10Countries chart.
5. Click Refresh to update your field list to include the new DEALSIZE attribute.
6. Click (Toggle Layout) to open the Layout panel.
7. Drag DEALSIZE from the field list on the left into the Color Stack section of the Layout panel.
8. Click (Toggle Layout) to close the Layout Panel. You have successfully delivered your businessuser’s request

36 | | Building Business Intelligence Solutions Using Agile BI
| Why Choose Enterprise Edition? | 37
Why Choose Enterprise Edition?
Enterprise Edition enables you to deploy Pentaho Data Integration with confidence, security, and far lowertotal cost of ownership than proprietary and open source alternatives. Benefits of Pentaho Data IntegrationEnterprise Edition include:
Professional, Technical Support
• Live support provided by a knowledgeable team of product experts that consistently rates higher incustomer satisfaction than the BI megavendors
• Dedicated customer case triage providing faster response times and increased priority for customerreported defects and enhancements
Enterprise Edition Features
• Enterprise security with granular control over content and actions that can be performed by users androles. Enterprise security can be managed directly in Pentaho Data Integration Enterprise Edition orconfigured to integrate with your existing LDAP or Active Directory implementation
• Centralized content management facilitating team collaboration including secured sharing of content,content versioning (revision history), and transformation and job locking
• Integrated scheduler allowing you to schedule job and transformations for future or recurring execution;schedules are created and managed directly in the easy-to-use, graphical designer (Spoon)
• Additional transformation steps and job entries for integrating with third-party applications, messagingarchitectures and more
Certified Software Releases
• All certified software releases go through rigorous quality testing and a managed release process toensure the stability of your production deployments
• Only subscription customers get access to maintenance releases containing critical defect resolutions
Note: Binary distributions of Community Editions are provided with major product releases only.If you have a critical defect or improvement that has been addressed as part of a minor or patchrelease, you must wait for and upgrade to the next major release of Pentaho Data Integration.
Pricing for Pentaho Data Integration Enterprise Edition can be found at http://www.pentaho.com/buy/. Formore information or to start your subscription today, contact us at http://www.pentaho.com/contact/.
38 | | Troubleshooting
Troubleshooting
This section contains known problems and solutions relating to DI Server administration.
I don't know what the default login is for the DI Server, Enterprise Console,and/or Carte
For the DI Server administrator, it's username admin and password secret.
For Enterprise Console administrator, it's username admin and password password.
For Carte, it's username cluster and password cluster.
Be sure to change these to new values in your production environment.
Note: DI Server users are not the same as BI Server users.