Embed Size (px)
Citation preview

Page 1
321594
Getting Started with Dynamo for Civil 3D: A Beginner’s Guide
Samir Rezk
MicroCAD Training & Consulting
Description
Do you love the dynamic relationships of Civil 3D object data, but still find yourself zoning out
after a few minutes of doing a repetitive task? Using basic but logical math computations, we
can visually arrange functions or nodes, and use Dynamo to automate many tasks that are
required as part of any infrastructure project. A Dynamo script can be the missing dynamic link
between AutoCAD objects and Civil 3D objects, should the alignment change, AutoCAD blocks
placed along the alignment can be automatically updated. In this session, we’ll explore why
Dynamo has gained popularity among Revit users, and how to benefit from it in our Civil 3D
workflows. We’ll explore the Dynamo interface, and the fundamental concepts to getting started
creating your first logical graph to execute geometry driven by data.
Speaker
Currently a member of the MicroCAD team in Boston serving as an Autodesk infrastructure
applications instructor with primary focus on AutoCAD and Civil 3D technical support and
training. My background is in Civil Engineering, with experience working on highway, site
development, and treatment plant design and construction projects. I am a Civil 3D super fan at
heart, love good CAD practices and enjoy exploring new features and workflows. When I take a
break from my computer, I enjoy nature, hiking, camping, scuba diving and traveling.
Learning Objectives
• Learn how to navigate the Dynamo Interface, browse the node library, and use general graph management best practices
• Learn how to break down the intended end goal into individual computational tasks
• Learn about the input, process, and output of frequently used nodes, and distinguish between different data and geometry types
• Discover a handful of practical uses for Dynamo in Civil 3D

Page 2
Contents Learning Objectives ................................................................................................................... 1
Description ................................................................................................................................. 1
Speaker ..................................................................................................................................... 1
What is Dynamo? ....................................................................................................................... 3
Install + Launch ...................................................................................................................... 3
The User Interface .................................................................................................................. 3
The Workflow ......................................................................................................................... 4
The Library ............................................................................................................................. 4
Nodes and Wires .................................................................................................................... 5
Common data types ............................................................................................................... 5
Code Block ............................................................................................................................. 6
Lists of data ............................................................................................................................ 7
Connecting two or more lists .................................................................................................. 8
Working with AutoCAD and Civil 3D Libraries ............................................................................ 9
Example One – Working with Cogo Points and Property Sets ...............................................10
Example Two – Working with Corridors and Polylines ...........................................................12
Graph Management best practice .............................................................................................16
Sample graph attachments: ......................................................................................................16
Highlight Cogo Points not meeting spacing design criteria.....................................................16
Write Cogo Point station and offset information to property set .............................................16
Calc. Geometry intersection, write geometry, property set, and Excel ...................................16

Page 3
What is Dynamo?
Historically, it is relatively easy to repeat an AutoCAD operation with a script or macro, likewise
we can create a new function with Lisp. However, the limitations of both is the information is not
dynamic. As well as, AutoCAD scripts do not work well with Civil 3D data, and Lisp requires
learning the programing language to code new functions. Dynamo bridges the gap of creating
dynamic repeatable operations between AutoCAD and Civil 3D. Dynamo is programing! It is
user friendly visual programing, so us Civil 3D users do not need to learn or write code. It is
already written for us; we simply need to arrange the code. In other words, one needs to think
with the logic of a programmer but learning a programing language is not required. Dynamo’s
open-source graphical programming interface; enables BIM modeling with the data and logic
environment of a graphical algorithm editor. Users can build custom workflows for creating,
positioning, and visualizing data; test variations faster; iterate more frequently; and create better
designs in less time.
Install + Launch
Dynamo for Civil 3D is an extension
available to Civil 3D 2020 only.
Install it separately from your Autodesk
Desktop App or your online Autodesk
account (product update section)
To Launch within Civil 3D:
• Go to the Manage Tab
• Visual Programing Panel
The User Interface

Page 4
The Workflow
The Library pane contains the Libraries!
• There are core Libraries such as Geometry
• or program related libraries such as the AutoCAD library
Library contains Categories
• The Geometry Library contains a Curve category, Points category, etc.
Category contains Nodes
• Most Nodes are the functions that compute or calculate something, such as:
Point.ByCoordinates (input numbers – output a point)
The Library
Dynamo has an active user community and developer base. Many developers create additional
libraries that can be installed as a package. A package is simply a container of nodes that
perform additional functions from within Dynamo.
• You can browse for packages online at: dynamopackages.com/
• Or, within the Dynamo interface

Page 5
Nodes and Wires
• A Dynamo graph consists of Nodes connected with Wires. Nodes are prebuilt
programing code that perform a function or operation. Wires identify the data flow from
one operation to another
• Dynamo uses Autodesk Design Script as a programing language of which the nodes are
written in
• You may imbed Iron Python code to perform more advanced operations
• Computation flows Left to Right
• Three major Node behaviors:
o Create - create data / geometry
o Modify - compute data
o Query - get information
Common data types
Computational Nodes are typically looking for a specific data type to perform the operation on.
As an example,
the Point.ByCoordinates Node is looking for
a Double Number type input for the X and Y
ports for it to compute the Point geometry
type
Types:
String
o Programing term for Text
Number
o Double (decimal number), or
o Integer (whole number)
Boolean
o True or False Switch

Page 6
Geometry
o Many types of Dynamo Geometry are
available
o Note: a Line is simply considered a
straight Curve!
Code Block
There is a special type of Node that lets you type Design Script code directly; considering that all nodes are written in Design script, any Node can then be written in Design script or converted to code. Code blocks are useful in creating advanced multi step long operations or simple one-line items. You might opt to use a code block to make the graph concise and more manageable. Another benefit is that a simple double click in the canvas will insert a code block node. Below are a few time saving Nodes:
Number
String
ListCreate

Page 7
Sequence
o Creates a list of numbers at a
specified beginning, amount, and a
step.
The Amount is synonymous to the
AutoCAD Divide command specifying
the number of segments!
Range
o Creates a list of numbers at a
specified beginning, end, and a step.
The Step is synonymous to the
AutoCAD Measure command
specifying the segment length!
Lists of data
A list of data is fundamental to how Dynamo can repeatedly perform the same operation to the
end of eternity!

Page 8
In the screen capture above:
The Range node is used to generate a list of numbers, the numbers, as a List, are connected to
the X port of a point creation node to repeatedly create point geometry till the end of the list.
Connecting two or more lists
List management becomes of extreme importance when it comes time to create a correlation
between two or more lists
Luckily, the list order is always going to match the same structure from one operation to
another, so long you did not re-organize the list differently
Dynamo contains three (3) type of treatments that are defined by the term List Lacing
The right click menu on the node contains the Lacing choices
Following with the example
above:
We have two lists of Points
that may define the beginning
and ending of a Line
Segment.
However, depending on how
the Line node is Laced it will
produce vastly different
results

Page 9
Working with AutoCAD and Civil 3D Libraries
Prerequisite: Dynamo can only communicate on the active document (the open drawing); the
drawing must be open and active prior to opening the Dynamo interface.
The typical workflow would be using geometry or data from the AutoCAD environment or an
Excel spreadsheet as an Input in your Dynamo graph. Based on the program you create,
Dynamo will compute an operation, and finally write the result back to your intended
environment. This can be very efficient in creating a repeatable task that can dynamically
update relative to the design element.
An added benefit is the fact that one can output any sort of custom spreadsheet, enabling data
travel to many other software platforms for analysis or reporting.

Page 10
Example One – Working with Cogo Points and Property Sets
Problem Statement:
Automatically and dynamically update Cogo Point Station and Offset label information relative to
a Civil 3D Alignment. The context may be needing to label Utility Poles station and offset
information as well as populating additional property sets for a custom comprehensive label.
Methodology:
Execute Dynamo script to:
1. Capture Cogo Point locations and Alignment from active document into the Dynamo
interface
2. Get relative locations of list of Cogo Points
3. Write Information in Property Set
Step by Step:
Get Alignment of interest
from the active drawing
Get the Cogo Point
contained in a Point Group of
Interest
Page 11
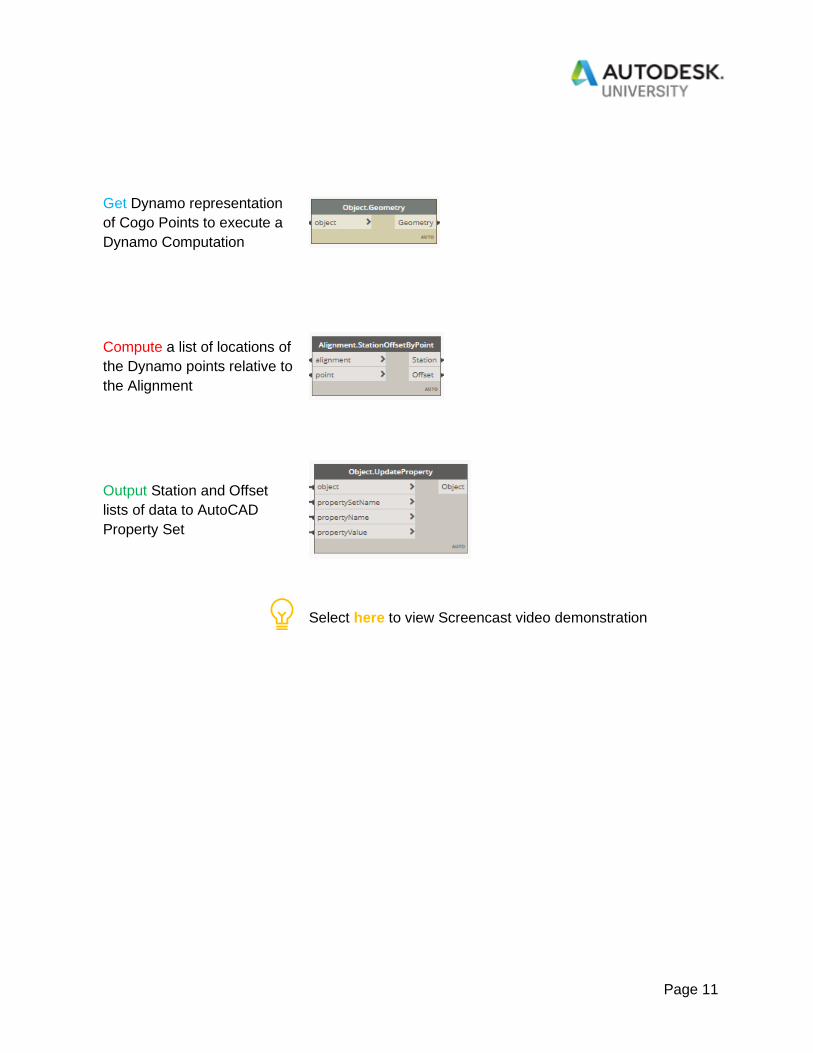
Get Dynamo representation
of Cogo Points to execute a
Dynamo Computation
Compute a list of locations of
the Dynamo points relative to
the Alignment
Output Station and Offset
lists of data to AutoCAD
Property Set
Select here to view Screencast video demonstration

Page 12
Example Two – Working with Corridors and Polylines
Problem Statement:
Get Geometry intersection between Corridor Feature Lines and Polylines. The context may be
calculating Right of Way impact along a Corridor.
Methodology:
Execute Dynamo script to:
1. Capture Corridor extents Feature Line locations and closed Polylines from active
document into the Dynamo interface
2. Flatten the Feature Line Elevations to 0
3. Create Dynamo representation from objects
4. Create Dynamo surfaces
5. Get Intersection of surfaces
6. Get Area
7. Write information as an AutoCAD Text
Step by Step:
Get Corridor of interest from
the active drawing

Page 13
Get Baseline of Corridor
Get Feature Line along
Baseline
Get Dynamo representation
of Feature Line to execute a
Dynamo Computation
(PolyCurve is similar in
theory to an AutoCAD
Polyline)
Get the Polylines on Layer of
Interest
Get Dynamo representation
of Polylines to execute a
Dynamo Computation

Page 14
Note:
Polylines are at Elevation 0; Corridor Feature Lines contain Corridor Elevations. To create an
intersection, they must intersect at X, Y, and Z. We will need to assign an elevation to the
PolyCurve representing Elevation 0. Dynamo enables us to project geometry on a Plane.
Normally in AutoCAD we work on the Top Plane (represented by the View Cube); in Dynamo we
can create a Plane wherever and relative to any geometry
Let’s Create an XY plane at
(Z) Elevation 0
the Curve.PullontoPlan
Node will pull the Feature
Line PolyCurves on to the XY
Plane of 0 Elev.
The easiest Dynamo
representation of a Closed
area is a Surface
This will Compute a List of
one surface (representing the
Corridor)
and
a List of many surfaces
(representing each closed
Polyline shape)

Page 15
Compute
Geometry Intersection
Note: List Lacing is
imperative, we have a “one
to many” relationship!
Use Longest Lacing
Get intersection Surface
Area
Finally, Output information,
possible outputs are
AutoCAD Text in the
drawing, Property Set, or an
Excel spreadsheet
In this example, Area are
annotated on the Drawing
with an AutoCAD Text
Select here to view Screencast video demonstration

Page 16
Graph Management best practice
Dynamo graphs can get complex looking very fast due to the nature of the individual nodes and
wires everywhere defining the operations of the programing code and how the data flow from
one operation to another.
• It is possible to create notes for you and others viewing or using the graph to identify key parameters that might need to be adjusted per project
• A double click on the Node title will enable you to rename the Node more appropriately; although it is helpful in some cases to leave the original generic name for identifying the category of the Node later
• It is also best to group functions together for easier documentation of the higher-level operation happening
Suggested color coding of group functions below; you may use any color scheme you prefer,
but be consistent:
Sample graph attachments:
Highlight Cogo Points not meeting spacing design criteria
Write Cogo Point station and offset information to property set
Calc. Geometry intersection, write geometry, property set, and Excel


![[] SUCCEEDING WITH WEBSOLUTIONS - maWebCentersw.mawebcenters.com/sgunfranchisetraining/WCT School 2016-ENG_FINAL 101... · Getting Started Guide WCT 101 Handout A “3” indicates](https://img.dokumen.tips/doc/110x75/5e80865d64322a73e666d989/-succeeding-with-websolutions-school-2016-engfinal-101-getting-started.jpg)


![Logic Models Handout 1. Morehouse’s Logic Model [handout] Handout 2](https://img.dokumen.tips/doc/110x75/56649e685503460f94b6500c/logic-models-handout-1-morehouses-logic-model-handout-handout-2.jpg)

