Embed Size (px)
Citation preview

Getting Started with DASYLab
Getting Started with DASYLab
National Instruments Ireland Resources Limited
September 2005 374212A-01

English-Language Support and Distribution
Americas
CEC Capital Equipment6 Bedford FarmsBedford, NH 03110 USATel.: +1 603 472 1068Fax: +1 603 472 1069E-Mail: [email protected]
Worldwide - Outside the Americas
measX GmbH & Co.KGTrompeterallee 11041189 Moenchengladbach GermanyTel.: +49 2166 9520-0Fax: +49 2166 9520-20E-Mail: [email protected]
Worldwide Support and Distributionwww.dasylab.com
© 2005 National Instruments Ireland Resources Limited. All Rights Reserved.

Important Information
WarrantyDASYLab is warranted against defects in materials and workmanship for a period of 90 days from the date of shipment, as evidenced by receipts or other documentation. National Instruments will, at its option, repair or replace equipment that proves to be defective during the warranty period. This warranty includes parts and labor.
The media on which you receive National Instruments software are warranted not to fail to execute programming instructions, due to defects in materials and workmanship, for a period of 90 days from date of shipment, as evidenced by receipts or other documentation. National Instruments will, at its option, repair or replace software media that do not execute programming instructions if National Instruments receives notice of such defects during the warranty period. National Instruments does not warrant that the operation of the software shall be uninterrupted or error free.
A Return Material Authorization (RMA) number must be obtained from the factory and clearly marked on the outside of the package before any equipment will be accepted for warranty work. National Instruments will pay the shipping costs of returning to the owner parts which are covered by warranty.
National Instruments believes that the information in this document is accurate. The document has been carefully reviewed for technical accuracy. In the event that technical or typographical errors exist, National Instruments reserves the right to make changes to subsequent editions of this document without prior notice to holders of this edition. The reader should consult National Instruments if errors are suspected. In no event shall National Instruments be liable for any damages arising out of or related to this document or the information contained in it.
EXCEPT AS SPECIFIED HEREIN, NATIONAL INSTRUMENTS MAKES NO WARRANTIES, EXPRESS OR IMPLIED, AND SPECIFICALLY DISCLAIMS ANY WARRANTY OF MERCHANTABILITY OR FITNESS FOR A PARTICULAR PURPOSE. CUSTOMER’S RIGHT TO RECOVER DAMAGES CAUSED BY FAULT OR NEGLIGENCE ON THE PART OF NATIONAL INSTRUMENTS SHALL BE LIMITED TO THE AMOUNT THERETOFORE PAID BY THE CUSTOMER. NATIONAL INSTRUMENTS WILL NOT BE LIABLE FOR DAMAGES RESULTING FROM LOSS OF DATA, PROFITS, USE OF PRODUCTS, OR INCIDENTAL OR CONSEQUENTIAL DAMAGES, EVEN IF ADVISED OF THE POSSIBILITY THEREOF. This limitation of the liability of National Instruments will apply regardless of the form of action, whether in contract or tort, including negligence. Any action against National Instruments must be brought within one year after the cause of action accrues. National Instruments shall not be liable for any delay in performance due to causes beyond its reasonable control. The warranty provided herein does not cover damages, defects, malfunctions, or service failures caused by owner’s failure to follow the National Instruments installation, operation, or maintenance instructions; owner’s modification of the product; owner’s abuse, misuse, or negligent acts; and power failure or surges, fire, flood, accident, actions of third parties, or other events outside reasonable control.
CopyrightUnder the copyright laws, this publication may not be reproduced or transmitted in any form, electronic or mechanical, including photocopying, recording, storing in an information retrieval system, or translating, in whole or in part, without the prior written consent of National Instruments Corporation.
TrademarksNational Instruments, NI, ni.com, and LabVIEW are trademarks of National Instruments Corporation. Refer to the Terms of Use section on ni.com/legal for more information about National Instruments trademarks.
Other product and company names mentioned herein are trademarks or trade names of their respective companies.
PatentsFor patents covering National Instruments products, refer to the appropriate location: Help»Patents in your software, the patents.txt file on your CD, or ni.com/patents.
WARNING REGARDING USE OF NATIONAL INSTRUMENTS PRODUCTS(1) NATIONAL INSTRUMENTS PRODUCTS ARE NOT DESIGNED WITH COMPONENTS AND TESTING FOR A LEVEL OF RELIABILITY SUITABLE FOR USE IN OR IN CONNECTION WITH SURGICAL IMPLANTS OR AS CRITICAL COMPONENTS IN ANY LIFE SUPPORT SYSTEMS WHOSE FAILURE TO PERFORM CAN REASONABLY BE EXPECTED TO CAUSE SIGNIFICANT INJURY TO A HUMAN.
(2) IN ANY APPLICATION, INCLUDING THE ABOVE, RELIABILITY OF OPERATION OF THE SOFTWARE PRODUCTS CAN BE IMPAIRED BY ADVERSE FACTORS, INCLUDING BUT NOT LIMITED TO FLUCTUATIONS IN ELECTRICAL POWER SUPPLY, COMPUTER HARDWARE MALFUNCTIONS, COMPUTER OPERATING SYSTEM SOFTWARE FITNESS, FITNESS OF COMPILERS AND DEVELOPMENT SOFTWARE USED TO DEVELOP AN APPLICATION, INSTALLATION ERRORS, SOFTWARE AND HARDWARE COMPATIBILITY PROBLEMS, MALFUNCTIONS OR FAILURES OF ELECTRONIC MONITORING OR CONTROL DEVICES, TRANSIENT FAILURES OF ELECTRONIC SYSTEMS (HARDWARE AND/OR SOFTWARE), UNANTICIPATED USES OR MISUSES, OR ERRORS ON THE PART OF THE USER OR APPLICATIONS DESIGNER (ADVERSE FACTORS SUCH AS THESE ARE HEREAFTER COLLECTIVELY TERMED “SYSTEM FAILURES”). ANY APPLICATION WHERE A SYSTEM FAILURE WOULD CREATE A RISK OF HARM TO PROPERTY OR PERSONS (INCLUDING THE RISK OF BODILY INJURY AND DEATH) SHOULD NOT BE RELIANT SOLELY UPON ONE FORM OF ELECTRONIC SYSTEM DUE TO THE RISK OF SYSTEM FAILURE. TO AVOID DAMAGE, INJURY, OR DEATH, THE USER OR APPLICATION DESIGNER MUST TAKE REASONABLY PRUDENT STEPS TO PROTECT AGAINST SYSTEM FAILURES, INCLUDING BUT NOT LIMITED TO BACK-UP OR SHUT DOWN MECHANISMS. BECAUSE EACH END-USER SYSTEM IS CUSTOMIZED AND DIFFERS FROM NATIONAL INSTRUMENTS' TESTING PLATFORMS AND BECAUSE A USER OR APPLICATION DESIGNER MAY USE NATIONAL INSTRUMENTS PRODUCTS IN COMBINATION WITH OTHER PRODUCTS IN A MANNER NOT EVALUATED OR CONTEMPLATED BY NATIONAL INSTRUMENTS, THE USER OR APPLICATION DESIGNER IS ULTIMATELY RESPONSIBLE FOR VERIFYING AND VALIDATING THE SUITABILITY OF NATIONAL INSTRUMENTS PRODUCTS WHENEVER NATIONAL INSTRUMENTS PRODUCTS ARE INCORPORATED IN A SYSTEM OR APPLICATION, INCLUDING, WITHOUT LIMITATION, THE APPROPRIATE DESIGN, PROCESS AND SAFETY LEVEL OF SUCH SYSTEM OR APPLICATION.


Contents
About This ManualConventions ...................................................................................................................vii
Chapter 1Data Acquisition and Visualization with DASYLab
Defining Experiments in the Worksheet Window.........................................................1-2Designing the Visualization in the Layout Window......................................................1-4Using the Function Bar ..................................................................................................1-6
Chapter 2Creating Your First Worksheet
Acquiring and Displaying Signals .................................................................................2-1Extending the Displays ..................................................................................................2-3Saving the Worksheet ....................................................................................................2-6
Chapter 3Creating a Complete Worksheet Solution
Configuring the Data Acquisition Device .....................................................................3-1Collecting and Scaling the Data.....................................................................................3-4Displaying the Data .......................................................................................................3-6Storing the Data .............................................................................................................3-8Connecting the Modules ................................................................................................3-9Documenting the Worksheet .........................................................................................3-11Configuring the Display Windows ................................................................................3-13Designing a Layout for Visualization ............................................................................3-16
Appendix AModule Groups
Input/Output Module Group ..........................................................................................A-1Trigger Module Group...................................................................................................A-1Mathematics Module Group ..........................................................................................A-2Statistics Module Group ................................................................................................A-2Signal Analysis Module Group......................................................................................A-2Control Module Group...................................................................................................A-3Display Module Group ..................................................................................................A-3Files Module Group .......................................................................................................A-3
© National Instruments Ireland Resources Limited v Getting Started with DASYLab
Data Reduction Module Group ..................................................................................... A-4Network Module Group ................................................................................................ A-4Special Module Group................................................................................................... A-4Add-On Module Group ................................................................................................. A-5Specific Hardware Modules .......................................................................................... A-5
Appendix BTips and Tricks
Combining and Configuring Modules........................................................................... B-1Block Size and Sampling Rate ...................................................................................... B-3Optimizing the Processing Speed.................................................................................. B-3Trouble-Shooting........................................................................................................... B-4
Getting Started with DASYLab vi www.dasylab.com

About This Manual
This manual provides information about the operation and functions of the DASYLab Data Acquisition and Analysis software.
Two exercises show you how to select function modules, how to link them in the worksheet work area and how to configure each module for your measurement. In the layout example, you will arrange the display modules to visualize the results of the data acquisition. Each exercise includes fig-ures that will assist you as you work through each step of the exercise.
In addition to the examples included in this manual, you can start the DASYLab interactive Tutorial by selecting Help»Tutorial. The Tutorial steps you through DASYLab and demonstrates the features by creating worksheets of varying complexity. You can start the worksheets directly from the Tutorial. You can use the Tutorial worksheets as the basis for the construction of your own worksheet.
ConventionsThe following conventions are used in this manual:
<> Angle brackets denote a keyboard key that you must press, for example <Ctrl> for the Control key.
» The » Symbol leads you through nested menu items and dialog box options to a final action. The sequence File»Page Setup»Options directs you to pull down the File menu, select the Page Setup item and select Options from the last dialog box.
This icon denotes a tip, which alerts you to advisory information.
This icon denotes a note, which alerts you to important information
bold Bold text denotes items that you must select or click in the software, such as menu items and dialog box options. Bold text also denotes parameter names.
italic Italic text denotes variables, emphasis, a cross reference, or an introduction to a key concept.
monospace Text in this font denotes text or characters that you should enter from the keyboard, sections of code, programming examples, and syntax examples.
© National Instruments Ireland Resources Limited vii Getting Started with DASYLab

About This Manual
This font is also used for the proper names of disk drives, paths, directories, programs, subprograms, subroutines, device names, functions, operations, variables, filenames, and extensions.
Getting Started with DASYLab viii www.dasylab.com

© National Instruments Ireland Resources Limited 1-1 Getting Start
1
Data Acquisition and Visualization with DASYLabUse DASYLab to interactively create an acquisition, control, simulation or analysis task. Simply select a function module and place it on the worksheet. Configure your task by connecting the modules. DASYLab supports many data acquisition and control devices, as well as different interfaces that communicate with external instruments.
DASYLab includes acquisition, control and analysis modules, including analog and digital inputs and outputs, mathematics, statistics, digital filters, FFT analysis, and switches. Logical operations, switches and sliders or the Sequence Generator provide exact, time-based waveforms for complex control signals. You can store the results of the data acquisition and analysis for off-line analysis by other programs.
The Chart Recorder, Y/t Chart and the X/Y Chart will plot the data as curves. The List Display and Digital Meter display the data numerically. Freely scalable Analog Meter, Bar Graph and Status Lamp displays are useful for Process and Measurement controls.
Tip You will find an overview of all available modules in Appendix A, Module Groups.
Use the DASYLab VITool Layout Windows to design one or more custom screens. Display and Control modules can be inserted and combined with text and graphics. In addition to creating a custom screen, you can use the VITool to create reports to print and document the results of your measurement. The reports can be printed manually or automatically, based on user or data events during measurement.
Save the worksheet, with the data workflow diagram, the display screens and the reports to a file, for use later (DASYLab Worksheet file, .DSB). You can easily create solutions for each measurement task on your PC, and load them when required. You can even configure the measurement to start at a later time after loading.
Use the DLL Extension Toolkit to program your own DASYLab module. The toolkit contains a complete description of the DASYLab module API
ed with DASYLab

Chapter 1 Data Acquisition and Visualization with DASYLab
(Applications Programming Interface) as well as example code. The examples are complete working programs for different module types. Experience with C Language and Microsoft Windows programming is required.
Defining Experiments in the Worksheet WindowWhen you start DASYLab, the DASYLab Worksheet window appears with the menu, Function Bar, Module Bar, Browser and the Info Area. Click on the Function bar Worksheet button to open the Worksheet view from one of the other DASYLab views.
Use the worksheet window to create your measurement worksheet. Select a function module from the Browser or Module bar and place it on the work area.
The Modules symbolize the program functions, starting from the acquisition and generation of the data up to output and display of that data. A worksheet can contain up to 256 modules. Use the Black Box module to put an additional 256 modules in a “sub-worksheet”. You can have multiple Black Box modules, and each Black Box can contain Black Boxes. Open a Black Box by double-clicking on the module; close it by clicking on the Close Black Box button on the Function bar.
Data channels connect the modules. Module outputs can be connected to module inputs. Your task determines how the modules will be connected.
Figure 1-1 shows the DASYLab Worksheet Window with the work area, the Module Bar, Browser and the Info Area.
Getting Started with DASYLab 1-2 wwww.dasylab.com

Chapter 1 Data Acquisition and Visualization with DASYLab
Figure 1-1. Worksheet View
Use the Browser to select a module and drag and drop it onto the work area. The Browser shows all modules that were installed with DASYLab and the selected drivers and options. The Browser uses a tree structure, organized by a module group.
The Module bar contains a selection of modules that are used frequently. Click on the module icon in the Module bar, move the mouse to the work area, and click to place the module. You can choose to display or remove the Module bar by selecting View»Module Bar.
You can easily customize the Module bar to include the functions that you use most frequently. Right-click over a button on the Module bar and choose New to open the selection dialog box. Scroll through the list of all available modules, select a module, and click on OK to confirm and map the button to that module. The Module bar button now shows the icon of the selected module. DASYLab stores the configuration of the Module bar, saves it when you close the program, and reloads it when you next start DASYLab.
1 Function Bar2 Module Bar3 Browser
4 Info Area5 Worksheet Work Area
© National Instruments Ireland Resources Limited 1-3 Getting Started with DASYLab

Chapter 1 Data Acquisition and Visualization with DASYLab
You can create different Module bar configurations for different tasks, save the configuration, and load them later. Use Edit»Module Bar to create a new, blank configuration, to save the current configuration or to load a stored configuration including standard Basic, Intermediate and Advanced configurations.
You can document the worksheet with text blocks that appear on the background of the work area. Right-click on a blank section of the work area and choose Edit Documentation from the context menu. Next, right-click again and select Create Documentation. Use the mouse to drag a box on the work area. Double-click on the box to open the Documentation Properties, where you can enter text commentary.
Designing the Visualization in the Layout WindowCreate your individual layout to display data and to document the measurement task. Click in the Function bar on the Layout Window button to open the Layout view. DASYLab displays the Layout Tool Bar, to allow you to create objects on the Layout Window. Click on an object and place it on the window area by clicking and dragging a box. You can change the size and location of each object. Connect to display objects, such as the Chart Recorder or Switch module using the Graph object. Include bitmaps, such as logos or process displays using the Bitmap object. Add text, boxes, lines, and other decoration.
Use the Layout Window Properties to configure the size of the screen or page. You can select Screen to match your monitor, or a paper size. You can zoom to enlarge or shrink the layout as you work on it.
Each worksheet can have up to 200 layout pages. Use Window»New Layout to add a page and Window»Delete Layout Page to remove the current page.
Figure 1-2 shows the DASYLab Layout Window with a layout page.
Getting Started with DASYLab 1-4 wwww.dasylab.com
Chapter 1 Data Acquisition and Visualization with DASYLab
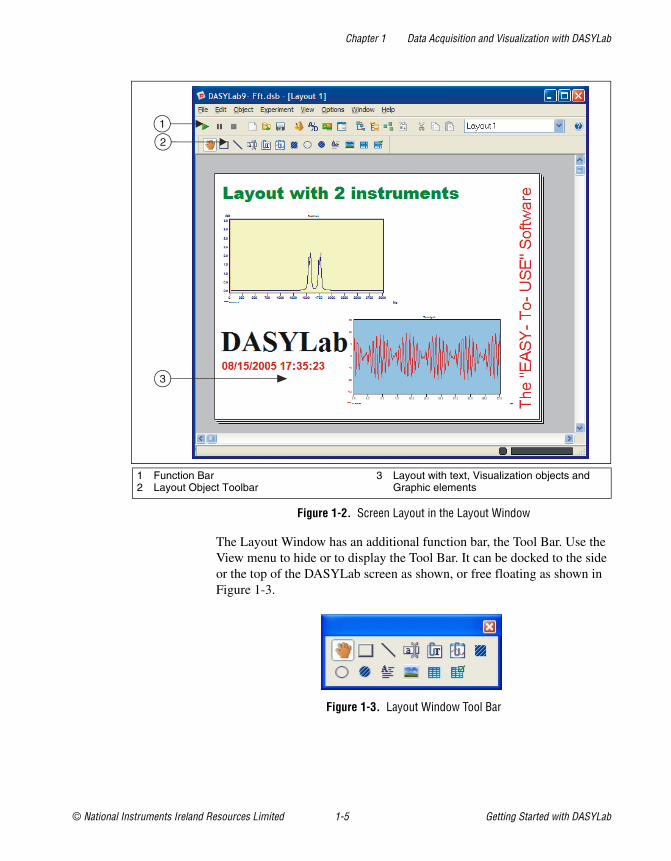
Figure 1-2. Screen Layout in the Layout Window
The Layout Window has an additional function bar, the Tool Bar. Use the View menu to hide or to display the Tool Bar. It can be docked to the side or the top of the DASYLab screen as shown, or free floating as shown in Figure 1-3.
Figure 1-3. Layout Window Tool Bar
1 Function Bar2 Layout Object Toolbar
3 Layout with text, Visualization objects and Graphic elements
© National Instruments Ireland Resources Limited 1-5 Getting Started with DASYLab

Chapter 1 Data Acquisition and Visualization with DASYLab
Use the Tool Bar to add active and passive layout elements to your layout page:
• Active Layout Elements
Active Layout elements are the objects that connect the worksheet modules to the layout window view. The Graph object connects to dis-play modules and control objects, such as Switch and Slider modules. The Text object connects to the Digital Meter display. These objects update continually while the worksheet is running.
• Passive Layout Elements
Passive Layout elements allow you to label and decorate the layout dis-play, and have no connection to modules on the worksheet. Graphic objects include line, circle, ellipse, rectangle, filled circles, filled rect-angles, text lines, and text blocks. The Bitmap object allows you to display a .bmp or .wmf graphic as a logo or as the background.
During a measurement, use <Ctrl+F> to activate the layout as Full Screen, hiding the menus and bars. This is especially useful for configuring the DASYLab worksheet to present only the measurement objects that you want to display, in the orientation, shape and size that you determine.
Using the Function BarThe Function bar contains buttons that link to frequently used menu commands. Figure 1-4 shows the Function bar in the Worksheet View.
Figure 1-4. Worksheet View Function Bar
When you hover over a button with the mouse, a Tool Tip will appear with the function of the button. The following list shows each button and its function:
Getting Started with DASYLab 1-6 wwww.dasylab.com

Chapter 1 Data Acquisition and Visualization with DASYLab
Start Experiment
Pause Experiment
Stop Experiment
New Worksheet
Open Worksheet
Save Worksheet
Time Base
Experiment Setup for Current Driver
Hardware Setup for Current Driver
Display Worksheet Information
Change to the Control Sequencer View
Change to the Display View
Change to the Worksheet View
Change to the Layout View
Cut Selected Object
Copy Selected Object
Paste from the Clipboard to the Worksheet or Layout
Close Black-Box. This function button only appears if you have opened a Black Box module.
© National Instruments Ireland Resources Limited 1-7 Getting Started with DASYLab

Chapter 1 Data Acquisition and Visualization with DASYLab
To the right of the Function bar, you will see eight numbered buttons. You can configure these buttons to be a shortcut for frequently used functions. In each DASYLab view, there are 8 buttons, each view with its own color. This enables you to define custom buttons that are appropriate to each view.
Figure 1-5. User-Defined Function Buttons in the Worksheet View
Initially, three buttons are configured when DASYLab is installed. They are customized to open the Define Global Variable dialog box, the Define Global Strings dialog box, and the Report information. You can change the function of any of the buttons by right-clicking on the button. Choose New Command to select from all available menu functions. Confirm the choice by clicking on OK. The color of the button changes from the inactive gray color to the active color for the current view.
Hide all Display Windows
Unhide all Display Windows
Minimize all Display Windows
Restore all Display Windows to Normal View
Getting Started with DASYLab 1-8 wwww.dasylab.com

© National Instruments Ireland Resources Limited 2-1 Getting Start
2
Creating Your First WorksheetStart DASYLab. The DASYLab Worksheet view appears with the Menu at the top of the window and the Function bar under it, the Module bar and the Browser to the left of the display and the Info Area at the bottom. Press the <F1> key on the keyboard to activate the Help menu.
Note Click on <F1> while a dialog box is open to display the affiliated help page.
For this exercise, ensure that the Module bar is displayed. Click View»Module Bar to activate it if it is hidden. The Module bar displays a selection of icons which represent frequently used modules.
Acquiring and Displaying SignalsFollow these steps to create your worksheet:
1. Double-click on the Generator button on the Module bar. The follow-ing Generator Type dialog box appears.
Confirm the default setting by clicking on OK. DASYLab inserts the Generator module on the work area.
Tip Simply click once on the desired Module bar button. Then, move the mouse cursor to the work area, and click a second time to place the module at the desired location.
ed with DASYLab
Chapter 2 Creating Your First Worksheet
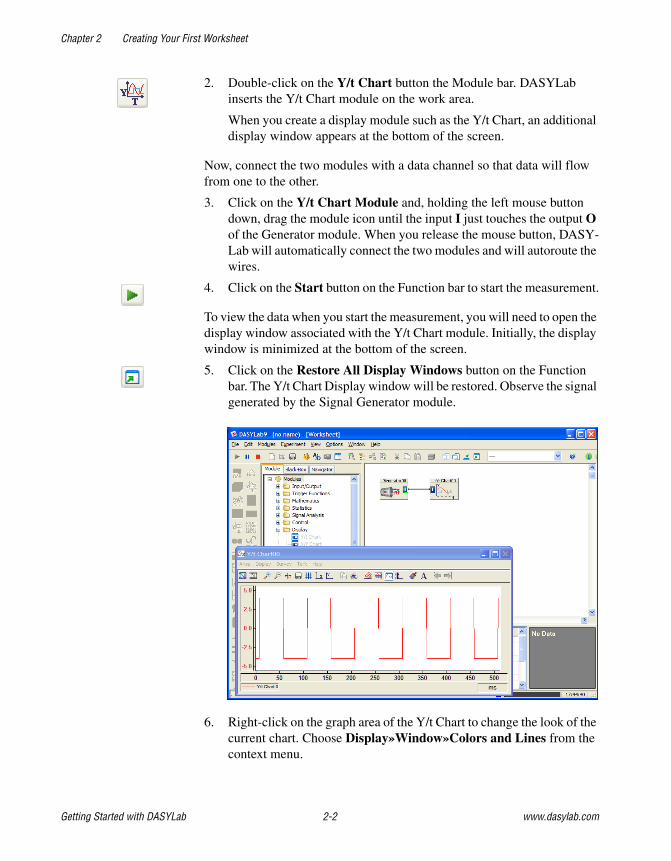
2. Double-click on the Y/t Chart button the Module bar. DASYLab inserts the Y/t Chart module on the work area.
When you create a display module such as the Y/t Chart, an additional display window appears at the bottom of the screen.
Now, connect the two modules with a data channel so that data will flow from one to the other.
3. Click on the Y/t Chart Module and, holding the left mouse button down, drag the module icon until the input I just touches the output O of the Generator module. When you release the mouse button, DASY-Lab will automatically connect the two modules and will autoroute the wires.
4. Click on the Start button on the Function bar to start the measurement.
To view the data when you start the measurement, you will need to open the display window associated with the Y/t Chart module. Initially, the display window is minimized at the bottom of the screen.
5. Click on the Restore All Display Windows button on the Function bar. The Y/t Chart Display window will be restored. Observe the signal generated by the Signal Generator module.
6. Right-click on the graph area of the Y/t Chart to change the look of the current chart. Choose Display»Window»Colors and Lines from the context menu.
Getting Started with DASYLab 2-2 www.dasylab.com
Chapter 2 Creating Your First Worksheet
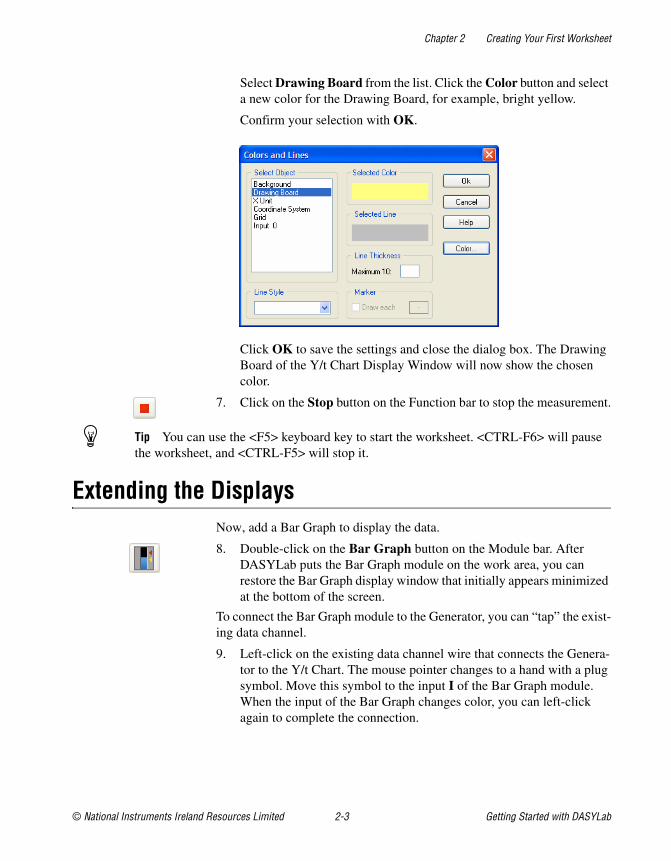
Select Drawing Board from the list. Click the Color button and select a new color for the Drawing Board, for example, bright yellow.
Confirm your selection with OK.
Click OK to save the settings and close the dialog box. The Drawing Board of the Y/t Chart Display Window will now show the chosen color.
7. Click on the Stop button on the Function bar to stop the measurement.
Tip You can use the <F5> keyboard key to start the worksheet. <CTRL-F6> will pause the worksheet, and <CTRL-F5> will stop it.
Extending the DisplaysNow, add a Bar Graph to display the data.
8. Double-click on the Bar Graph button on the Module bar. After DASYLab puts the Bar Graph module on the work area, you can restore the Bar Graph display window that initially appears minimized at the bottom of the screen.
To connect the Bar Graph module to the Generator, you can “tap” the exist-ing data channel.
9. Left-click on the existing data channel wire that connects the Genera-tor to the Y/t Chart. The mouse pointer changes to a hand with a plug symbol. Move this symbol to the input I of the Bar Graph module. When the input of the Bar Graph changes color, you can left-click again to complete the connection.
© National Instruments Ireland Resources Limited 2-3 Getting Started with DASYLab

Chapter 2 Creating Your First Worksheet
10. Double-click on the Title bar of the Bar Graph display window, cur-rently minimized at the bottom of the screen. It will be restored so that you can see the Bar Graph display.
11. Start the worksheet again.
DASYLab now shows the Generator signal in both the Y/t Chart and the Bar Graph displays.
Getting Started with DASYLab 2-4 www.dasylab.com

Chapter 2 Creating Your First Worksheet
12. Stop the current measurement.
Tip Right-click twice (don’t double-click) on a data channel to delete the data channel.
13. Double-click on the Digital Meter in the Module bar. DASYLab places this module on the work area.
14. Move the Digital Meter module under the Bar Graph module.
DASYLab will automatically place the module to align it, and will not allow you to place one under the other.
Tip Right-click on the work area to open the Chart Window properties where you can define the grid spacing.
15. Click on the data channel that connects the Generator module to the Bar Graph module. Connect the data channel to the input I of the Dig-ital Meter in the same way as before.
16. Double-click on the title bar of the minimized Digital Meter display window to restore it to normal view.
17. Start the measurement.
By default, the Generator module creates a 10 Hz Square Waveform. The characteristics of this generated signal can be changed while the experi-ment is running.
© National Instruments Ireland Resources Limited 2-5 Getting Started with DASYLab

Chapter 2 Creating Your First Worksheet
18. Double-click on the Generator Module on the work area to open its properties dialog box. Choose Sine as the Wave Form.
Click OK to confirm this choice and close the dialog box.
The display windows now show the sine wave form.
Note While the measurement is running, you can examine the contents of each data chan-nel on the work area. When you click on a data channel wire, DASYLab displays information about the data channel in the FIFO Values area of the Info Area, including the sampling rate, block size, and the current value of the data in the channel.
19. Stop the measurement.
Saving the Worksheet
20. Click on the Save button on the Function bar to save the worksheet with all of the current configuration to a file.
Give this file the name MyWorksheet. When you click OK, DASY-Lab stores the worksheet as MyWorksheet.DSB in the default DASYLab worksheet folder. DASYLab automatically adds the .DSB file extension to the file name that you type. The DASYLab Title bar now displays the worksheet name.
Getting Started with DASYLab 2-6 www.dasylab.com
© National Instruments Ireland Resources Limited 3-1 Getting Start
3
Creating a Complete Worksheet SolutionThis chapter shows you a complete data acquisition task.
You want to test a motor and visualize that data. A Chart Recorder will display the temperature, the power and the speed of the motor. Additionally, you want to display the current values for power and speed in numerical form.
You want to collect the data at 1 sample/second (Hz), then scale it, and store it continuously to a file on the hard drive. The measurement task will be started and stopped manually.
To do this, you need to have a supported data acquisition device available. All sensor signals are linear, and can be scaled according to Table 3-1 below:
Configuring the Data Acquisition DeviceBefore you can create the worksheet for this measurement task, you must verify that the data acquisition device is correctly installed, configured and working with DASYLab. This is an essential step to ensure that the data acquired by DASYLab is interpreted and displayed correctly.
DASYLab differentiates hardware drivers by whether they can be used simultaneously with other drivers. For example, you can use the Sound Card driver at the same time as the National Instrument NI-DAQmx driver.
When you installed DASYLab, you selected the driver for your data acquisition device. The settings for the hardware drivers are found in the
Table 3-1. Unit Scaling for the Data Acquisition Device
Motor Temperature 1. Channel 0 0-5 Volt 0-300 Degrees C
Power 2. Channel1 0-2 Volt 0-1000 Watt
Speed 3. Channel 2 0-5 Volt 0-3500 RPM
ed with DASYLab

Chapter 3 Creating a Complete Worksheet Solution
Experiment»Hardware Setup menu. Choose the NI-DAQmx»Hardware Setup submenu to configure National Instruments data acquisition devices. Figure 3-1 shows an example of the available tasks for this driver.
Figure 3-1. NI-DAQmx Hardware Settings
The modules associated with the NI-DAQmx driver are found in the Browser or in the menu, Modules»Input/Output»NI-DAQmx.
The Driver menu choice is reserved for drivers that use the DASYLab standard driver interface. Select this driver using the Experiment»Select Driver menu. Figure 3-2 shows the Hardware Setup for the Sound Card Driver.
Figure 3-2. Selecting the Sound Card Driver
Once you select the driver, all driver related features, modules and settings refer to the Sound Card.
Getting Started with DASYLab 3-2 www.dasylab.com

Chapter 3 Creating a Complete Worksheet Solution
Once you have configured the hardware settings for your data acquisition device, you must configure your data acquisition task. Click the Experiment Setup button on the Function bar.
Figure 3-3. Experiment Setup
As shown in Figure 3-3, you configure the Sampling Rate, the Block Size and the Driver Buffer in the Experiment Setup dialog box. The sampling rate and block size determine the number of samples transferred from the driver to DASYLab, and determine how data is moved from module to module on the worksheet. The driver buffer determines how much data can be stored as it moves from the sound card to DASYLab.
For this data acquisition task, choose a block size of 1 (one). The Sampling Rate/Channel for this task is 1 Hz, or 1 sample/second. This means that one sample will be collected and displayed each second.
Up to now, you have relied on DASYLab default settings for sample rate and block size. DASYLab stores the Experiment Setup data acquisition settings with the worksheet.
The Hardware Setup settings for the data acquisition card are not stored in the worksheet file. Typically these settings remain unchanged unless the hardware changes.
© National Instruments Ireland Resources Limited 3-3 Getting Started with DASYLab

Chapter 3 Creating a Complete Worksheet Solution
Collecting and Scaling the DataTo create the worksheet, you must first define a module that will acquire the three signals that are connected to the Data Acquisition card. If you use the Sound Card for this exercise, choose the Input/Output»Driver»Ana-log Input from the Browser. However, if you are using a DAQ card with the NI-DAQmx driver, you would choose the Input/-Out-put»NI-DAQmx»Analog Input from the browser.
Note In order to create this exercise on any PC, regardless of the installed data acquisition device, this example uses the DEMO driver.
Place an A/D Module for the Demo driver on the work area. Choose channels 0-15 in the Hardware Selection dialog box. This module represents your data acquisition device. Double-click the module on the work area to open the Properties dialog box.
At the top of the module properties dialog box, you can name the module so that you can easily identify this module on the work area and add a short description.
Use the Channel bar to activate channels. Double-click on a channel button to activate a channel. Channel 0 is already activated. Below the Channel bar are settings for the selected channel.
Figure 3-4. Analog Input Module Settings
Getting Started with DASYLab 3-4 www.dasylab.com
Chapter 3 Creating a Complete Worksheet Solution
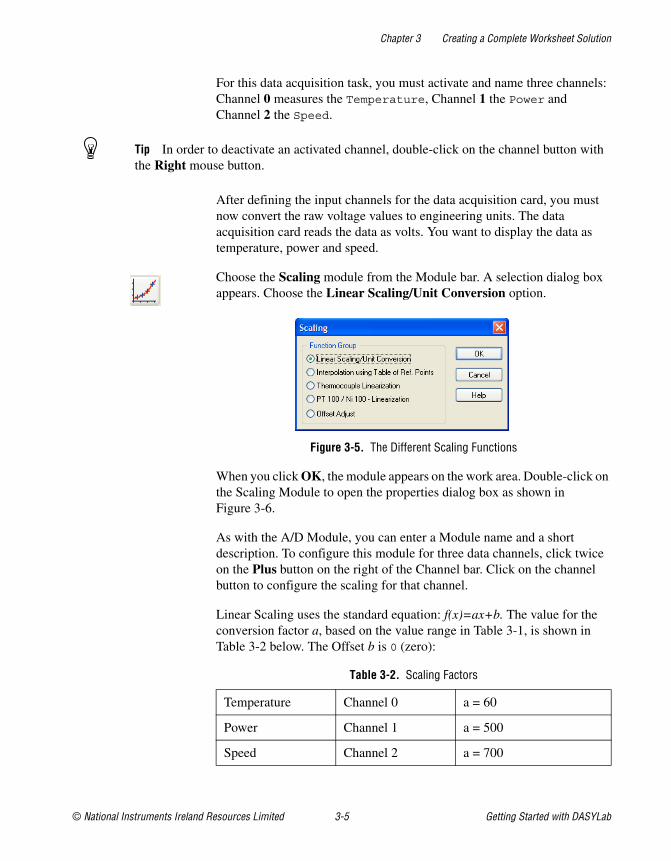
For this data acquisition task, you must activate and name three channels: Channel 0 measures the Temperature, Channel 1 the Power and Channel 2 the Speed.
Tip In order to deactivate an activated channel, double-click on the channel button with the Right mouse button.
After defining the input channels for the data acquisition card, you must now convert the raw voltage values to engineering units. The data acquisition card reads the data as volts. You want to display the data as temperature, power and speed.
Choose the Scaling module from the Module bar. A selection dialog box appears. Choose the Linear Scaling/Unit Conversion option.
Figure 3-5. The Different Scaling Functions
When you click OK, the module appears on the work area. Double-click on the Scaling Module to open the properties dialog box as shown in Figure 3-6.
As with the A/D Module, you can enter a Module name and a short description. To configure this module for three data channels, click twice on the Plus button on the right of the Channel bar. Click on the channel button to configure the scaling for that channel.
Linear Scaling uses the standard equation: f(x)=ax+b. The value for the conversion factor a, based on the value range in Table 3-1, is shown in Table 3-2 below. The Offset b is 0 (zero):
Table 3-2. Scaling Factors
Temperature Channel 0 a = 60
Power Channel 1 a = 500
Speed Channel 2 a = 700
© National Instruments Ireland Resources Limited 3-5 Getting Started with DASYLab

Chapter 3 Creating a Complete Worksheet Solution
Figure 3-6. Linear Scale Settings for the Third Input Channel
Tip To deactivate a channel, click on the Minus button on the Channel bar.
Displaying the DataYou want to display all three input signals continuously in the Chart Recorder. Additionally, you want to view the current value of the power and speed as numbers.
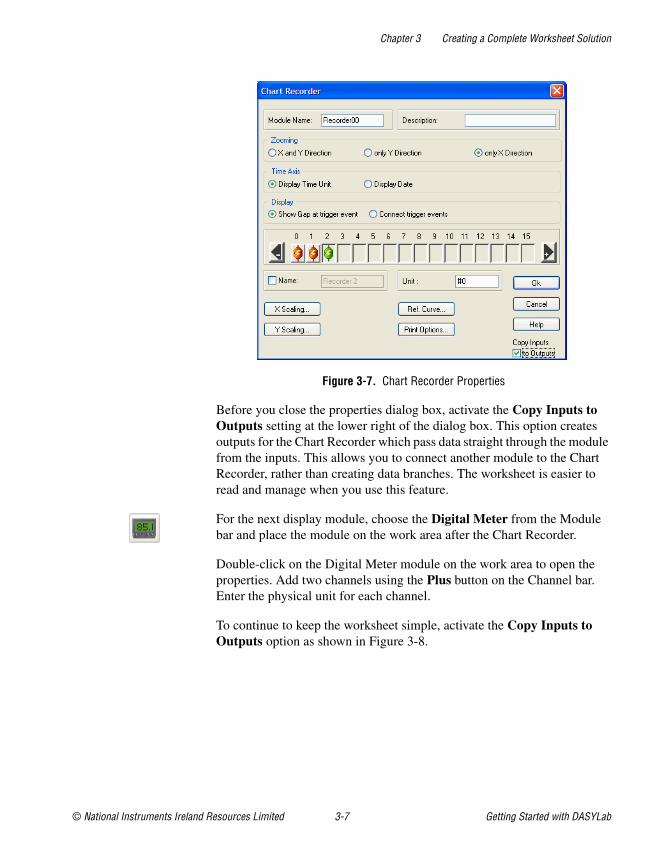
Choose the Chart Recorder module from the Module bar and place the module on the work area after the Scaling module. You can see the minimized Chart Recorder Display window at the bottom of the screen. Double-click on the Chart Recorder module on the work area to open the properties dialog box as shown in Figure 3-7.
Add two channels by clicking on the Plus button. Click on the X Scaling button. Select Time for the Time Axis and adjust the Maximum Display Time to 60 seconds. Click OK to close the X-Scaling properties.
Getting Started with DASYLab 3-6 www.dasylab.com
Chapter 3 Creating a Complete Worksheet Solution
.
Figure 3-7. Chart Recorder Properties
Before you close the properties dialog box, activate the Copy Inputs to Outputs setting at the lower right of the dialog box. This option creates outputs for the Chart Recorder which pass data straight through the module from the inputs. This allows you to connect another module to the Chart Recorder, rather than creating data branches. The worksheet is easier to read and manage when you use this feature.
For the next display module, choose the Digital Meter from the Module bar and place the module on the work area after the Chart Recorder.
Double-click on the Digital Meter module on the work area to open the properties. Add two channels using the Plus button on the Channel bar. Enter the physical unit for each channel.
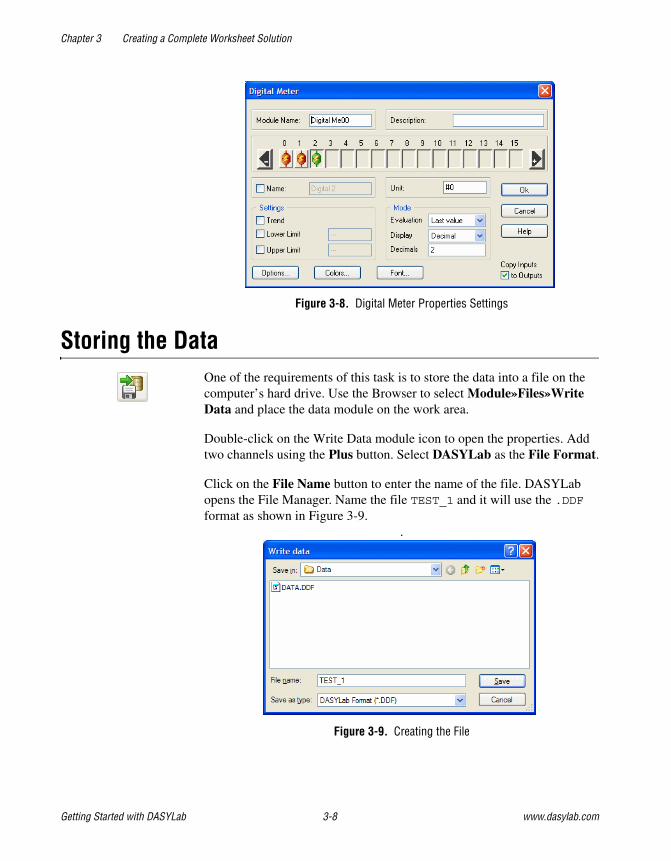
To continue to keep the worksheet simple, activate the Copy Inputs to Outputs option as shown in Figure 3-8.
© National Instruments Ireland Resources Limited 3-7 Getting Started with DASYLab
Chapter 3 Creating a Complete Worksheet Solution
Figure 3-8. Digital Meter Properties Settings
Storing the DataOne of the requirements of this task is to store the data into a file on the computer’s hard drive. Use the Browser to select Module»Files»Write Data and place the data module on the work area.
Double-click on the Write Data module icon to open the properties. Add two channels using the Plus button. Select DASYLab as the File Format.
Click on the File Name button to enter the name of the file. DASYLab opens the File Manager. Name the file TEST_1 and it will use the .DDF format as shown in Figure 3-9.
.
Figure 3-9. Creating the File
Getting Started with DASYLab 3-8 www.dasylab.com

Chapter 3 Creating a Complete Worksheet Solution
Create the file by clicking on the Save button. DASYLab uses the name and adds the path and displays the complete file name in the Write Data properties, at the bottom of the dialog box as shown in Figure 3-10.
.
Figure 3-10. Write Data Properties
Connecting the ModulesNow you have created the modules necessary for this task. If the order of the modules on the work area doesn’t correspond to the sequence of pro-cessing steps, you can move the modules around. This helps, in part, to ensure that the next step, connecting the modules, is correct.
© National Instruments Ireland Resources Limited 3-9 Getting Started with DASYLab

Chapter 3 Creating a Complete Worksheet Solution
Figure 3-11 shows the order of the modules:.
Figure 3-11. The Worksheet with all the Modules
The next step to create a running worksheet is to connect the module outputs to the inputs of the following module.
DASYLab has a quick and easy method to connect modules. First, click on the Scaling module, and hold the left mouse button down while you drag the Scaling module toward the A/D Module. When the inputs and outputs just touch, release the mouse button. The two modules should now be connected by three data connection wires, channel 0-0, 1-1 and 2-2.
Use this technique, connecting inputs to outputs of the proceeding module to connect all of the modules as shown in Figure 3-12:
Getting Started with DASYLab 3-10 www.dasylab.com
Chapter 3 Creating a Complete Worksheet Solution
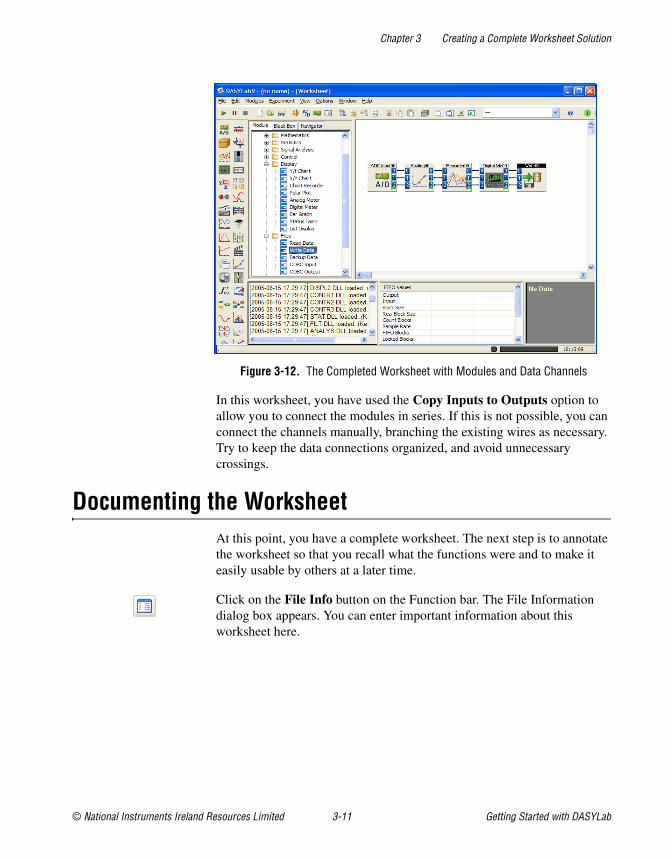
Figure 3-12. The Completed Worksheet with Modules and Data Channels
In this worksheet, you have used the Copy Inputs to Outputs option to allow you to connect the modules in series. If this is not possible, you can connect the channels manually, branching the existing wires as necessary. Try to keep the data connections organized, and avoid unnecessary crossings.
Documenting the WorksheetAt this point, you have a complete worksheet. The next step is to annotate the worksheet so that you recall what the functions were and to make it easily usable by others at a later time.
Click on the File Info button on the Function bar. The File Information dialog box appears. You can enter important information about this worksheet here.
© National Instruments Ireland Resources Limited 3-11 Getting Started with DASYLab

Chapter 3 Creating a Complete Worksheet Solution
Figure 3-13. File Info Documents the Worksheet
Save the worksheet now before you make accidental changes. Click on the Save button on the Function bar. Call this worksheet MyWorksheet2. DASYLab adds the .DSB Extension automatically. DASYLab stores the worksheet in the folder, C:\PROGRAM FILES\DASYLAB 9.0\WORKSHEETS.
Figure 3-14. Saving the Worksheet
Getting Started with DASYLab 3-12 www.dasylab.com
Chapter 3 Creating a Complete Worksheet Solution
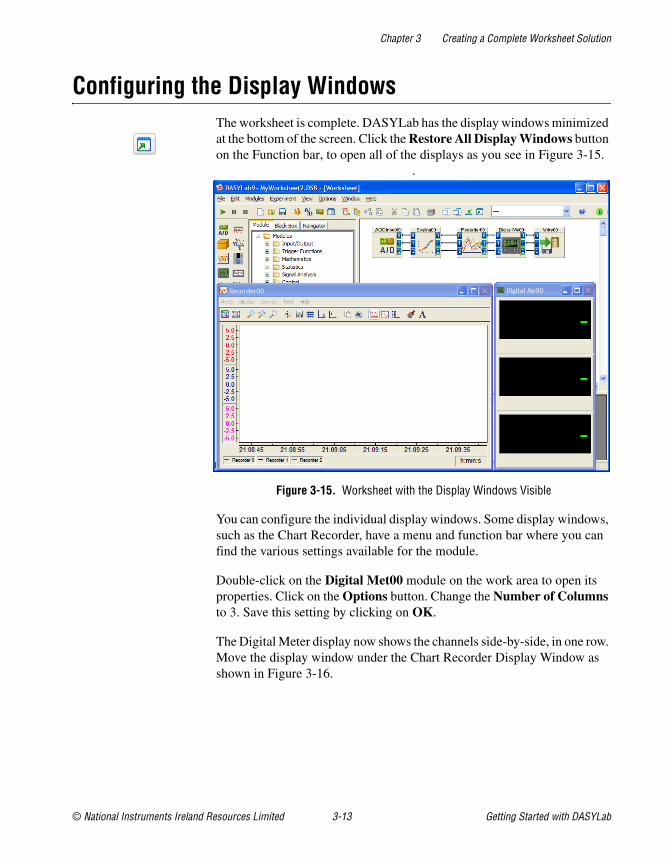
Configuring the Display WindowsThe worksheet is complete. DASYLab has the display windows minimized at the bottom of the screen. Click the Restore All Display Windows button on the Function bar, to open all of the displays as you see in Figure 3-15.
.
Figure 3-15. Worksheet with the Display Windows Visible
You can configure the individual display windows. Some display windows, such as the Chart Recorder, have a menu and function bar where you can find the various settings available for the module.
Double-click on the Digital Met00 module on the work area to open its properties. Click on the Options button. Change the Number of Columns to 3. Save this setting by clicking on OK.
The Digital Meter display now shows the channels side-by-side, in one row. Move the display window under the Chart Recorder Display Window as shown in Figure 3-16.
© National Instruments Ireland Resources Limited 3-13 Getting Started with DASYLab
Chapter 3 Creating a Complete Worksheet Solution
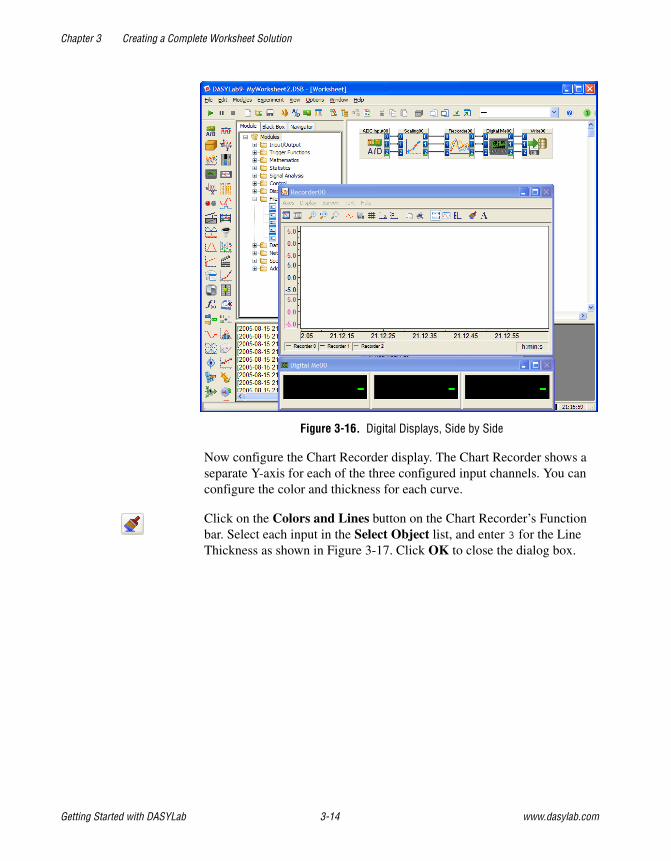
Figure 3-16. Digital Displays, Side by Side
Now configure the Chart Recorder display. The Chart Recorder shows a separate Y-axis for each of the three configured input channels. You can configure the color and thickness for each curve.
Click on the Colors and Lines button on the Chart Recorder’s Function bar. Select each input in the Select Object list, and enter 3 for the Line Thickness as shown in Figure 3-17. Click OK to close the dialog box.
Getting Started with DASYLab 3-14 www.dasylab.com

Chapter 3 Creating a Complete Worksheet Solution
Figure 3-17. Set the Line Thickness for Each Input
You can move the individual display windows anywhere on your computer screen and resize it to cover the worksheet view.
You can have DASYLab remember the locations of the windows by using View»Save Window Arrangement. Confirm the proposed name, Window1 for the current Window order. You can now see the name of this arrangement on the Function bar.
Start the measurement by clicking the <F5> key on the keyboard. Figure 3-18 shows the acquired temperature, power and speed on the Chart Recorder as curves and numerically on the Digital Meter.
Stop the measurement by clicking <Ctrl+F5>.
© National Instruments Ireland Resources Limited 3-15 Getting Started with DASYLab

Chapter 3 Creating a Complete Worksheet Solution
Figure 3-18. Displaying the Data in the Chart Recorder and Digital Meter
Designing a Layout for VisualizationThus far, you have created the worksheet and displayed the data in the worksheet view. The Layout Window view will allow you to create differ-ent layouts to display the data and to document the results of the data acqui-sition. The Layouts allow you to combine the existing display windows with other elements, including tests, tables, logos, frames and lines.
Click on the Layout button on the Function bar to open the Layout Window. Click OK to create a new Layout. DASYLab opens the Layout View as shown in Figure 3-19 showing the empty Layout page: Layout1.
Getting Started with DASYLab 3-16 www.dasylab.com

Chapter 3 Creating a Complete Worksheet Solution
Figure 3-19. Layout Window View with an empty Layout Page
Double-click on the empty Layout Page to open the Page Properties. You can configure the page format, the alignment and the margins for the page here. Choose the Screen format as shown in Figure 3-20 to optimally display on your computer screen. Save the settings by clicking OK.
© National Instruments Ireland Resources Limited 3-17 Getting Started with DASYLab

Chapter 3 Creating a Complete Worksheet Solution
Figure 3-20. Layout Page Settings
Now insert the Display Windows into the blank layout. Click the Graph button in the Layout Toolbox, move the mouse to the empty page, and click and drag a box onto the page. Double-click on the box to open the properties for this object. Link the object to the Recorder00 module as shown in Figure 3-21.
Getting Started with DASYLab 3-18 www.dasylab.com
Chapter 3 Creating a Complete Worksheet Solution
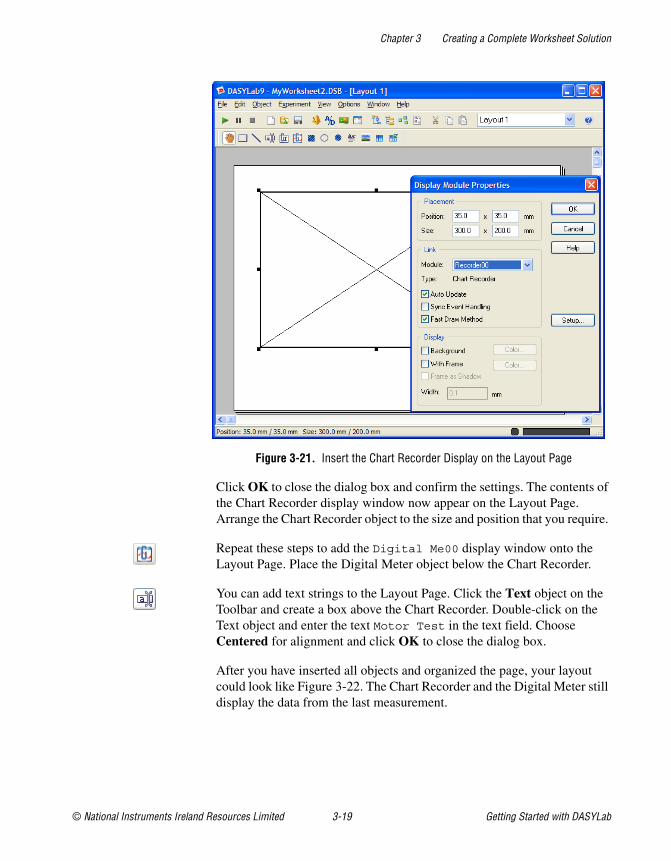
Figure 3-21. Insert the Chart Recorder Display on the Layout Page
Click OK to close the dialog box and confirm the settings. The contents of the Chart Recorder display window now appear on the Layout Page. Arrange the Chart Recorder object to the size and position that you require.
Repeat these steps to add the Digital Me00 display window onto the Layout Page. Place the Digital Meter object below the Chart Recorder.
You can add text strings to the Layout Page. Click the Text object on the Toolbar and create a box above the Chart Recorder. Double-click on the Text object and enter the text Motor Test in the text field. Choose Centered for alignment and click OK to close the dialog box.
After you have inserted all objects and organized the page, your layout could look like Figure 3-22. The Chart Recorder and the Digital Meter still display the data from the last measurement.
© National Instruments Ireland Resources Limited 3-19 Getting Started with DASYLab

Chapter 3 Creating a Complete Worksheet Solution
Figure 3-22. Layout with Chart Recorder and Digital Meter
Click on the Save button on the Function bar to save the worksheet, including the Layout Window.
Note The Layout Windows are stored with the worksheet and are opened when you open the worksheet. You can save a Layout as a separate file using the Edit»Save Layout As. The layout will be stored with the .LAY file extension.
Select View»Full Screen from the menu. The Layout Window now takes up the whole screen. All menus and tool bars are hidden. Start the measurement by clicking <F5>. DASYLab shows the measurement data in Full Screen mode as shown in Figure 3-23.
Click the <Esc> key on your keyboard to leave the Full Screen mode. <Ctrl+F5> stops the measurement.
Getting Started with DASYLab 3-20 www.dasylab.com

Chapter 3 Creating a Complete Worksheet Solution
Figure 3-23. Full Screen display of the Layout Window
You can create additional Layout Pages by choosing Window»New Layout from the menu. You can change the page format to match your printer paper to print reports that document the results of the measurement. Double-click on the Layout page to open the Page Properties. You can see the list of created Layout Pages in the drop-down on the Function bar. To make it easier to work on the layout, you can right-click to use the context menu to zoom in and out on the page.
You can add a Print button to the layout. Add an Action Module and a Switch Module to the worksheet. Connect these two modules together. Open the properties of the switch module to change the Switch Type to One Shot Switch. In the Action module properties, choose the Rising Edge event, to react to the user pressing the switch. The Receiver is DASYLab, and the Action is Print Layout, with the number of the Layout Page that you want to print.
Change to the Layout view, and add the switch to Layout1 using the Graph object to connect it. When you start the measurement, you can simply click on the switch to print the layout on the connected printer.
Tip For additional help for creating your worksheet, see Appendix B, Tips and Tricks.
© National Instruments Ireland Resources Limited 3-21 Getting Started with DASYLab

© National Instruments Ireland Resources Limited A-1 Getting Start
A
Module GroupsDASYLab Functions are organized into twelve groups of similar or related functions. This section provides a quick overview. For more information and for the specifics of each module, refer to the online help.
Input/Output Module GroupThe Input/Output group contains modules necessary to communicate with hardware drivers. It includes Analog Input, Analog Output, Digital Input and Digital Output modules that are associated with the installed data acquisition hardware. The Counter Input and Frequency Output modules connect to those functions on the data acquisition hardware.
The DDE Input and Output modules allow you to send and receive data with other Windows programs, such as Excel.
The RS232 and IEEE488 Interface modules provide recording and control possibilities for a wide variety of instruments that connect to the RS232 or IEEE488 interfaces. You can communicate with a wide variety of RS232 devices and parse the incoming data for use by other modules on the work-sheet. Various IEEE488 interface cards are supported.
Trigger Module GroupThe Trigger Group contains modules that allow you to monitor the data, and check conditions. The Start/Stop Trigger, Pre/Post Trigger, Combi-Trigger, Sample Trigger and the Trigger on Demand offer different ways to evaluate the data and determine whether the specified conditions have been met. The Relay module, when used in connection with a Trigger module, the TTL Pulse Generator or the Switch modules controls flow of data on the worksheet.
ed with DASYLab

Appendix A Module Groups
Mathematics Module GroupThe Mathematics Group includes the Arithmetic module for computation of two or more channels together or one channel with constant, the Trigo-nometry module with standard trig function, and the Scaling module, including Linear Scaling, Linear Interpolation, and Thermocouple Linear-ization. The Differentiation/Integration module allows you to compute the slope or area of the data.
The Formula Interpreter module allows you to create complex calculations for up to 16 input channels. The Reference Curve module computes a wave-form that can be used to monitor subsequent data measurements.
Statistics Module GroupThe Statistics group provides several statistical calculations. The Statistical Values module provides standard statistics, including mean, maxi-mum/minimum, and standard deviation.
Also included in this group are the Histogram and the Check Reference Curve functions. The PWM Analysis module computes the frequency of a regular signal, while the Counter module counts events.
Signal Analysis Module GroupThe Signal Analysis group allows you to filter the data using IIR Digital Filters; you can configure the filter type, order, and range.
The Data Window and FFT modules condition and compute the frequen-cies contained within the time domain signal. The Correlation module calculates the cross-correlation, the correlation coefficient and cepstrum of the signal.
The Polar/Cartesian module converts polar coordinates into cartesian as well as the reverse.The Electrical Characteristics module outputs standard computations for a known voltage and current, including power and phase angle of the incoming signal.
Getting Started with DASYLab A-2 www.dasylab.com

Appendix A Module Groups
Control Module GroupThe Control group includes modules for control of the worksheet, such as the Switch or Coded Switch modules. The Slider and Switch modules can be inserted into the worksheet to provide manual controls for the operator. The Generator module creates various waveforms that can be dynamically configured.
The PID module and the Two-Point Control module provide standard con-trol logic for open and closed-loop controls. The Stop module allows you to stop or pause the worksheet based on data events or duration.
The Global Variable Read and Write modules store data to internal variable locations and allow you to replay that data into a normal data channel for use by other modules on the worksheet.
Display Module GroupThe Display module group allows you to render the data for display in var-ious ways. The Y/t Chart, X/Y Chart and the Chart Recorder will plot your data as curves. The Analog and Digital Meters show you the current data.
For slower data, the Bar Graph and the List module can display many chan-nels simultaneously. The Status Lamp shows on/off states, and can show binary data.
Each display module has a separate Display Window that can be incorpo-rated into a Layout Window. The Layout Window can combine the display windows as well as control modules, such as the Switch and Slider, to pro-vide a custom operator panel or report for your measurement task.
Files Module GroupThe Files module group includes the File Write, File Read and Backup modules. Store your data or the results of your data analysis using different file formats, including ASCII and DASYLab formats. The DASYLab format stores all data in a binary file, retaining all of the information that DASYLab requires to replay the data and work with it. This allows you to collect data that will be processed offline, or to assist in worksheet devel-opment. The Backup module allows you to archive the data periodically.
© National Instruments Ireland Resources Limited A-3 Getting Started with DASYLab

Appendix A Module Groups
ODBC Input and Output allow you to read parameters from a standard database file, and to output test results. ODBC drivers exist for many for-mats, including Microsoft Access, Excel, and simple text files.
Data Reduction Module GroupThe Data Reduction group reduces data using the Average or Block Aver-age module. The Separate module removes data from the data stream without additional processing. Use the Merge/Expand module to combine two or more channels.
The Circular Buffer module provides a “holding bin” that can be released on demand.
Network Module GroupThe DataSocket Import and DataSocket Export modules communicate with OPC-Server or National Instruments DataSocket Servers. The other Net-work modules are only available to you as part of the DASYLab-Net-Version.
The Network Import and Export modules allow high-speed communication over TCP/IP networks between cooperating copies of DASYLab-net. The Message Import and Export modules allow the software to send messages to the other DASYLab-net copies.
Special Module GroupThe Special module group consists of a variety of functions that don’t fit in the proceeding categories. The Time Base module separates the time infor-mation from a data channel and allows it to be processed as data. The Signal Adapt module synchronizes data from different sources.
Use the Black Box module to create a sub-worksheet, to help manage a complex worksheet, or simply to create a reusable section of worksheet. You can also nest Black Box modules in Black Box modules.
The Action module is a powerful feature of DASYLab, allowing you to react to program events, data events, and user events to change the displays, reset running values, open and close relays, even restart the computer! The Message and E-mail modules allow you to log events and notify via printer, file or E-mail.
Getting Started with DASYLab A-4 www.dasylab.com
Appendix A Module Groups
Add-On Module GroupThe Add-On module group includes optional features that are available with the Signal Analysis Toolkit or with DASYLab Pro. It includes the Transfer function for signal analysis and the Block Weighting module.
Several of the optional modules appear in the Add-On group, and others will be shown in the appropriate functional group, such as the Con-trol»Sequence Generator and Statistics»Rainflow.
Specific Hardware ModulesDASYLab requires additional software to work with some hardware devices. These hardware drivers appear as additional entries in the DASY-Lab menus. The new menu items provide additional functions that are specific to the installed hardware.
Note DASYLab is constantly updating drivers and related hardware support. For updated information, please check www.dasylab.com.
© National Instruments Ireland Resources Limited A-5 Getting Started with DASYLab


© National Instruments Ireland Resources Limited B-1 Getting S
B
Tips and TricksThe following tips and comments should help you to create efficient and organized worksheets
• Order the modules on the screen neatly.
• Keep the data channels as short as possible; avoid superfluous channel branches and channel crossings so that it is easier to follow the data flow on the worksheet.
• Try to keep all channels that go from one module to the next parallel or focused.
• Include as many channels as possible in a single display module. A Status Lamp with 16 data channels requires less processing than 16 individual Status Lamp modules.
• Name your modules so that others can easily understand the function and task of the modules.
• Store your worksheets as you develop them, and use revision numbers or dates in the file name. This will allow you to go back to a previous development step.
• Use Black Box modules to store tested subsets of the worksheet, creating a library of functions that you can re-use in other worksheets.
• If you work with many Black Box modules it helps to configure each with a different background color. For example, choose darker colors the deeper the Black Box lies in the worksheet.
Combining and Configuring ModulesBelow are some common module combinations, used to solve typical prob-lems:
• Trigger and Logic module combinations
Use the Logical Operations module to evaluate the outputs of two or more Trigger modules; use an OR or AND condition to combine the TTL-High output of the connected Trigger modules.
Tip For three or more channels, the easiest OR and AND processing is found in the Arith-metic module, two or more operands.
tarted with DASYLab
Appendix B Tips and Tricks
• Trigger and Counter combinations
Use the Counter module to count various Trigger Events. In the Data Trigger module, set the pre-trigger value to 0, the post trigger value for the event to be counted, and a hysteresis so that there is only one trigger per event. In the Counter module, count Time for TTL High Level or Rising Edges.
• Trigger and Relay Combinations
Use the Trigger on Demand with the Relay module to reduce data so that the minimum number of samples are required to accurately repro-duce the waveform. As the signal changes by the specified amount, the Trigger on Demand outputs a TTL-High. The output of the trigger con-trols a Relay, which releases a data point for each TTL High. The resultant waveform only has the data points necessary to recreate the original waveform.
• Displaying Different Types of Data
The Chart Recorder is very flexible, and can display different types of data channels at the same time, normal data, triggered data (with gaps), TTL data, averaged data, etc.
The Y/t Chart and the X/Y Chart can only display similar data at the same time. The data must have the same start time, block size, and type (normal, FFT, Histogram).
You can use more than one module to display the same data. Use the charts in combination to effectively visualize your data.
• Choose your Events carefully
Define the event in the Action module so that it does not continually react. For example, if you need to react to a TTL High input, choose the Rising Edge condition. This condition will not reoccur until the signal has fallen to TTL Low again. If you use the TTL High condition, the Action module will execute the defined action for each block that it receives with any sample at TTL High. This applies to the Exceeds Threshold and Value Above Threshold events also. Exceeds Threshold has an automatic hysteresis and the Action will happen once until the input falls below the threshold and rises again.
Getting Started with DASYLab B-2 www.dasylab.com

Appendix B Tips and Tricks
Block Size and Sampling RateThe time that it takes DASYLab to respond is determined by the relation-ship of the block size to the sampling rate.
• The block size defines the amount of data (number of samples) that is transported in the block from module to module.
• The sampling rate is the speed at which the Data Acquisition card digitizes the data; the scan rate.
The response time is defined by the length of time that it takes DASYLab to fill a block. Table B-1 lists the minimum sampling time based on differ-ent combinations of block size and sampling rate
Note The worksheet is updated as frequently as the block size. We recommend a sampling rate/block size ratio from 1 to 10.
The response time is also a function of the number of modules on a work-sheet. The more modules, the more work that must be done.
If the worksheet consists of 100 modules, and it has a sampling rate/block size ratio of 1000, then DASYLab must process 100 modules in less than 1 millisecond. Often, this is too little time, and DASYLab will be unable to keep up with incoming data and may halt.
Optimizing the Processing SpeedThe overall operating performance of DASYLab depends on the hardware resources of the computer, of the data acquisition device, and on the com-plexity of the worksheet.
• Increase the amount of memory (RAM) on your computer to minimize Window’s use of virtual memory and the resultant hard drive access. Frequent hard drive accesses can slow the system.
Table B-1. Reaction Time
Block Size Sampling Rate(1/Sec) Min. Reaction Time (Sec.)
1 1 1
1 1000 0.001
1000 1 1000
© National Instruments Ireland Resources Limited B-3 Getting Started with DASYLab
Appendix B Tips and Tricks
• A more powerful computer can do more in each time slice than a slower computer.
• Deactivate unnecessary display module functions, such as the grid on the chart displays.
• Use a fixed time scale in the chart axis settings. Updating a running axis is time-consuming.
• For processing high-frequency data with an FFT, you can reduce data by using the Separate module to skip data while maintaining the correct sampling rate for the data that is retained. For example, use a Separate module between the Analog Input and the FFT module to allow every 100th block to pass. The FFT will still have the full sampling rate in each block, but only processes every 100th block.
If you do not need to view the data while acquiring it, you can save it directly to a file and read it later, off-line. This is the optimal configu-ration for the highest performance data acquisition.
Trouble-ShootingThe following are answers to frequently asked questions and common problems.
A worksheet is not loaded“I cannot load a worksheet that I stored earlier. I am using the same hard-ware, but DASYLab reports that the worksheet does not match the installed hardware.”
The hardware settings for the Data Acquisition card are not stored in the worksheet file. It is stored in a separate file, depending on the driver and the manufacturer of the device. If you have changed any of the settings for the device, for example, changed the card from Single-Ended to Differential, DASYLab cannot incorporate that change into the worksheet. You must restore the hardware settings to match the worksheet.
Real-Time Output - Yes or No?“I want to connect a switch to a Digital Output. Should I choose the Real Time option in the Switch module settings?”
It depends on the output mode of the Digital Output. If the output is syn-chronized with the Analog Input, the Switch must be configured to output in Real Time. If the Digital Output is asynchronous, output in real time can be disabled.
Getting Started with DASYLab B-4 www.dasylab.com

Appendix B Tips and Tricks
If the Switch is not configured for real-time output, it generates data as quickly as possible, usually faster than the synchronous Digital Output is able to process it. If the Switch is now pressed, that change won’t be pro-cessed until all of the data before it is processed.
If the Digital Output is asynchronous, the data is processed as quickly as it is received; it doesn’t back up in the same way.
This tip applies to any module that generates data (Slider, Generator, Switch, etc.) and is output to an Analog or Digital Output on the data acqui-sition card.
Maximum worksheet size?“I want to build a complex worksheet and can only insert 256 modules in the work area. How can I put in more modules?”
Use the Black Box module to create one or more sub-worksheets. It is found in Module»Special. You can create up to 256 Black Box modules on the main worksheet. Insert it like any other module. Double-click on it to open the sub-worksheet. Use the Module»Special»Import/Export module to exchange data with the level above.
Only 16 branches on a data channel?“I need to use a channel more than 16 times. How can I create more than 16 branches?”
Use a mathematics module with the NOP function (No OPeration). Con-nect one of the data channel branches to this module, then use its output for 16 more branches.
The Display is too Slow!“My worksheet takes too long to display the acquired data in the display windows. What can cause that?”
The following factors affect the performance of the display modules:
• Your block size is too big for the sampling rate.
• You are using a Separate module so that it ignores many blocks. Until the next block is passed, the displays will not update. The timing is based on the block size and data reduction.
• The Average module is configured to block average and you did not change the output block size to reflect the data reduction. This also affects the Separate module when it reduces data by samples.
© National Instruments Ireland Resources Limited B-5 Getting Started with DASYLab
Appendix B Tips and Tricks
• You are using a Histogram or Statistical Values module and have configured it for multiple blocks. The module waits until all blocks are received before releasing each resultant data point or block.
• Is the hardware working? Check your settings, and verify that the hardware is working correctly. Check the card type, base address (if necessary), the IRQ interrupt channel, and possibly the DMA channel.
Getting Started with DASYLab B-6 www.dasylab.com


![Skaffold - storage.googleapis.com · [getting-started getting-started] Hello world! [getting-started getting-started] Hello world! [getting-started getting-started] Hello world! 5](https://img.dokumen.tips/doc/110x75/5ec939f2a76a033f091c5ac7/skaffold-getting-started-getting-started-hello-world-getting-started-getting-started.jpg)