Embed Size (px)
Citation preview

Figures for a Farming Future
Getting Started in FarmManagement AccountingPart II: Mapping out a farming future
www.defra.gov.uk

Department for Environment, Food and Rural AffairsNobel House17 Smith SquareLondon SW1P 3JRTelephone 020 7238 6000Website: www.defra.gov.uk
© Crown copyright 2004
Copyright in the typographical arrangement and design rests with the Crown.
This publication (excluding the logo) may be reproduced free of charge in any format or medium provided that it is reproduced accurately and not used in a misleading context. The material must be acknowledged as Crown copyright with the title and source of the publication specified.
Further copies of this publication in a smaller A5 format are available from:
Defra PublicationsAdmail 6000LondonSW1A 2XXTel: 08459 556000
This document is also available on the Defra website.
For telephone and email enquiries for information on any aspect of Defra's work, the Defra Helpline can be contacted on 08459 33 55 77.
The Helpline number is a local call rate number within the UK and is available between 09:00 and 17:00 on working days.
From outside the UK the telephone number is +44 (0) 20 7238 6951.
There is also a minicom/textphone number for the deaf and hard of hearing: 0845 300 1998
The Helpline email address is: [email protected]
Published by the Department for Environment, Food and Rural Affairs. Printed in the UK, February 2004.Printed on recycled paper containing at least 80% post consumer waste.
Product code PB9062 Part 2

Figures for a Farming Future
Getting Started in Farm
Management Accounting
Part II: Mapping out a farming future
Rural Affairs and Environment Group
Harper Adams University College
Authors:
Barrie Florey – Head of Rural Affairs and Environment
John Adams – Lecturer, Farm Business Management
Mike Robinson – Associate Consultant, Farm Business Management
Edited by Farm and Animal Health Economics Division, Defra

Foreword v
Preface vi
Further sources of help vi
Introduction 1
Partial planning – planning a partial change to your current system 1
Options for partial change 2
Resources required for partial change 3
Effect of partial change on farm profit 4
Effect of partial change on pattern of cash flow 6
Assessing risk 7
Financial summary of proposed partial change 8
Whole farm planning – making major changes to your current farming system 9
Setting aims and goals 9
Resources and limitations 10
Options and choosing a plan 11
Feasibility of the plan 14
Viability of the plan 15
Enterprise output, variable costs and gross margin 16
Gross margin budget 18
Fixed costs 19
Testing the plan’s viability in terms of profit 22
Testing the cash flow viability 25
Assessing for risk 26
Sensitivity analysis 26
Financial summary of proposed changes 28
Appendix 1: examples of gross margins 29
Appendix 2: gross margin templates 32
Appendix 3: table showing annual payments of interest and repayments of capital according to sum borrowed, interest rate and length of loan 35
Appendix 4 – cash flow templates 36
Glossary 38
Further reading (reference sources for whole farm management data) 39iii
Contents

UK farming will continue to face radical change in the coming years, not least throughunprecedented reform of the CAP less than 12 months from now. CAP reform anddecoupled support are however only two of many issues shaping the economic climatefarmers face. Meeting customer requirements on price and quality is the commonthread running through economically sustainable food production and diversification.This starts with ensuring the farm business is profitable and viable.
These booklets form a key part of the Sustainable Farming and Food Strategy in England.The Report of the Policy Commission on the future of Farming and Food in England notedthe ‘striking range in performance in farming’ and the need for a ‘stronger and morecomprehensive benchmarking drive to help poorer performers identify reasons why they arefalling behind’. In similar vein A Forward Strategy for Scottish Agriculture emphasised thatfarm businesses should review their cost structures and use benchmarking and peer reviewto test their own businesses against the best elsewhere in Scotland and abroad.
Against this background the Policy Commission recommended that ‘relevant data iscollected to underpin benchmarking work.’ The government’s published response tookthis forward: ‘A booklet on management accounting for farmers is being produced toprovide an industry standard for definitions.’
These booklets take this further by covering definitions and by providing a means bywhich farmers will be able to make better use of their annual accounts and get anintroduction to basic farm business management techniques. They are aimed at allfarmers, including those who, perhaps through some lack of confidence or interest,have not been involved with business management, planning and budgeting. Thebooklets will help farmers keep track of how well their business is performing andplan what action, if any, they need to take.
Two booklets have been prepared under the joint title ‘Figures for a Farming Future’. Thefirst, ‘Using the Farm Accounts to Point the Way’ explains how to make use of the farm’sprofit and loss account and the balance sheet to see where the business sits and how viableit is. The second booklet, ‘Mapping Out a Farming Future’ explains how possible changes tothe farm business are assessed so that plans are made on as sound a basis as possible.
The booklets cannot provide all the answers, but they do provide a starting point, anda platform from which outside help can be more usefully applied, be it from the FarmBusiness Advice Service in England, the forthcoming Farm Business Advice and SkillsService in Scotland, consultants, accountants or benchmarking with other farmers. TheFood Chain Centre has gathered evidence from farmers who practice benchmarkingand has shown it can bring beneficial results. The Food Chain Centre, Defra and theScottish Executive will be promoting benchmarking to farmers and encouraging themto participate in the increasing number of schemes available. Similarly the Red MeatIndustry Forum is working with livestock producers to promote and embed the useof benchmarking as one of the means to achieve continuous business improvement.
Sir Donald Curry v
Foreword

The authors, Defra and SEERAD (Scottish Executive, Environment and Rural AffairsDepartment) would like to thank the farmers that took part in the pilot testing of thesebooklets as well as the many stakeholders who provided comments and suggestions,including the Institute of Chartered Accountants in England and Wales and the BritishInstitute of Agricultural Consultants.
Farmers can work on their own through these booklets and they will particularly helpthose who have little or no experience in management accounting. To take thingsfurther and thereby get even more out of these booklets, many farmers would benefitfrom joining a benchmarking service and/or a local farmers group covering businessmanagement awareness and skills. Others can seek individual advice from a qualifiedconsultant or their accountant. Help is also available from the Farm Business AdviceService in England, Farming Connect in Wales and the forthcoming Farm BusinessAdvice and Skills Service in Scotland, Contact details for these and other organisationsthat can help are:
Farm Business Advice Service0845 600 9006
Forward FarmingELITE Consortium LtdStoneleigh ParkKenilworthWarwicks CV8 2NETel: 01995 642255
Highlands and Islands Local Enterprise Company and Scottish Enterprise Business GatewayHelpline number 0845 609 6611.
Farming Connect Service CentreWelsh Development Agency08456 000813
Food Chain Centre at IGDGrange LaneLetchmore HeathWatfordHerts WD25 8GDTel: 01923 857141www.foodchaincentre.com
Milk Development CouncilMilk Bench – National Dairy Benchmarking System www.milkbench.org.uk
vi
Preface

Red Meat Industry ForumPO Box 44Winterhill HouseSnowdon DriveMilton Keynes MK6 1AXTel: 01908 844710www.redmeatindustryforum.org
British Institute of Agricultural ConsultantsThe Estate OfficeTorry Hill MilsteadSittingbourneKent ME9 0SPTel: 01795 830100E mail: [email protected]
Secretary, Farming and Rural Business GroupInstitute for Chartered Accountants, England and WalesChartered Accountants HallPO Box 433Moorgate PlaceLondon EC2P 2BJ
These booklets are part of a package of management accounting aids to farmers thatthe Government will release in 2004. In addition to these booklets there will be3 key items:
1. A Guide to Converting the Farm’s Financial Accounts intoManagement AccountsThis will show how farm financial accounts and management accounts can bereconciled. The document will provide farmers and others with a better understandingof how financial accounts can be converted into management accounts.
2. A Interactive Database based on Farm Business SurveyDataThis will enable the individual farmer to compare the financial results from their farmbusiness with group averages based on data from the Farm Business Survey.
3. Publication covering terms and Definitions and theirApplication in Farm Business ManagementA more exhaustive publication to cover terms and definitions and their application inthe context of farm business management,
Announcements will be made by Defra and SEERAD as and when these itemsbecome available. vii
Figures for a Farming Future
Getting Started in Farm Management AccountingPart II: Mapping out a farming future

This booklet follows the earlier publication ‘Using the Farm Accounts to Point the Way’.After you have assessed your business using the publication shown above, you may needto consider changing your business activities. This booklet offers a method to enable youto use financial information on planning your business.
Not only will you and your business benefit from careful planning, but potential lenderswill respond more positively if you can present them with a realistic business plan.
Does the assessment you carried out in ‘Using the Farm Accounts to Point the Way’ showthat you need a major change to your farming system? If this is the case, the process of‘whole farm planning’ is described from page 9 of this booklet. We have simplified theprocess as far as possible, so you can try to develop your business yourself. If you needany help, you can get advice from a qualified farm business adviser.
If you need to carry out ‘whole farm planning’, follow the procedure described from page 9onwards.
Or, did your assessment show you need only minor changes or need only to fine-tune yourcurrent system? If this is the case, ‘partial planning’ can show you the effect of swapping oneenterprise for another, or increasing the size of one enterprise at the expense of another. Asmall change in your farm system may improve the viability and stability of your business.
If you want to make a partial change to your existing system, the simplified procedure isdescribed below. The later section (from page 9 onwards) deals with making more majorchanges to the business.
Action:• Work your way through the booklet, preferably with another person or a
specialist adviser.
• Consider joining farm management/benchmarking clubs or groups.
• Look at the management training options provided by your local agricultural college.
• Consider engaging a farm business consultant.
Partial planning – planning a partial change to your currentsystem
1 Set your goalsExampleThe current farm system is not making enough profit to be viable (financiallysustainable).Goal: to increase profits by at least £8,000.
ExampleA son or daughter is returning home from higher education to help run the farm, butthe farm profit can only cover half their personal needs of £12,000 a year.Goal: to increase profits by at least £6,000.
1
Introduction

Activity – Identify your goals here:
2 What are the options for changing your business?Examples:
Activity – Identify your likely possible options here:
3 Assess your options and choose an outline planExample: free-range hens
Activity
Assess your likely options, using one table as below to assess each option.
Option…
Activity
Choose your best option (or mix of options) from your assessment, and outline theexpected level of production. This will form the basis of your plan.
Strengths . Weaknesses . Opportunities . Threats
Strengths . Weaknesses . Opportunities . Threats
Don’t need much land Need new skills Sell eggs direct CompetitionDon’t need much capital Can be a lot of Customer demand Diseaseinvestment if you use investment Premium price Unstable marketthe existing building Mix rations using Direct marketing own cereals and
reduce costs
Increase thesize of theoutdoorpig-breedingherd
Introduce ahigher-valuecash crop, forexample, bulbonions
Introduceanother farmstockenterprise,for example,free-rangelaying hens
Create a newenterprise,for example,enlarge anexisting pond,stock it andcreate afishingenterprise
Let out land,employ acontractor orsell machinery
Improve theproductivityof existingenterprisesby improvingtechnicalmanagement
2
Figures for a Farming Future
Getting Started in Farm Management AccountingPart II: Mapping out a farming future

Example:
Activity
4 Assess the resources you need to carry out the preferredchanges
ActivitySummarise your review of the resources you need by ticking the appropriate boxes.
If you have answered ‘Yes’ to all four questions, go on to stage 5. If not, canyou find ways to cover resource needs, or is it ‘back to the drawing board’?
Is the land available? Yes �� No ��Is the labour available? Yes �� No ��Is the capital available? Yes �� No ��Will I be able to market the produce at the necessary prices? Yes �� No ��
Land .
Amount needed (hectares).
Where from (which enterprise, or enterprises, will release land, if any)?
Labour
Current spare capacity (for example, half a person’s time, none and so on).
Skills needed:
If you need extra labour, where will it come from (for example, contract or casual)?
Capital . (£)
Assess the capital you need (for example, for 3000 free-range hens: capital for shelters, stock, equipment, fencing and so on). (A)
How much capital (if any) will be released as a result of the changes (for example, by selling machinery or equipment)? (B)
Net amount needed: (A) – (B)
Is this amount available? Yes �� . No ��If not, where will extra capital come from (for example, overdraft or loan)?
Your likely options . Outline detail
Option: Increase pig-breeding enterprise Outline detail: 50 more breeding sowsOption: Introduce bulb-onion enterprise Outline detail: 10 hectares from barley areaOption: Introduce free-range egg enterprise Outline detail: 3000 layers (4 hectares from barley area)
3
Partial planning – planning a partial change to your current system

5 How will your planned change affect farm profits?What will you gain in terms of extra revenue and reduced costs? What will be lost interms of revenue and extra costs?
When estimating costs of the new enterprise, consider carefully the implications ofintroducing it. There may be little or no extra cost if the new enterprise will make useof resources currently on the farm.
Activity
Assess the possible profits of your plan by filling in the following table. Make sure youdocument the physical and financial assumptions made.
The total (C) minus the total (F) represents the change in profits compared to yourcurrent farming system, when the revised system is fully up and running.
1. E.g. If you borrow £10,000 to buy a machine over 5 years @ 7% interest, you will pay on average £440interest/year. Your bank manager will be able to advise you on the annual interest charged on any extra borrowing.The tables on pages 21 and 35 provide more information about interest charges according to amount borrowed,interest rate and length of loan.
Notes
For example, sales of free-range eggsof 300 eggs per bird at 63p a dozen(from the new enterprise)
For example, some fertiliser, seed andspray expenditure (from the barleyenterprise)
The sum of (A) + (B)
Notes
For example, possible sales of barley(from the barley enterprise)
For example, feed, vet and medical fees,wages (for the new free-range enterprise)
Do not include capital costs of buildings ormachinery, but you must include interestcharges on any additional borrowing thatresults from the project (see note 1 below)and any extra depreciation.
The sume of (D) + (E)
The sum of (C) - (F)
. . Amount (£)
Extra income
Total income gained (A)
Cost savings
Total costs saved (B)
Total possible gains (C)
Lost income Amount (£)
Total income lost (D)
Extra trading costs
Total extra costs (E)
Total to off-set against possible gains (F)
Change in profits (G)
4
Figures for a Farming Future
Getting Started in Farm Management AccountingPart II: Mapping out a farming future

Activity
What is the overall change in profits and does it achieve the goal you identified?Answer this question by filling in the following table.
If your planned change does not meet your profit goal, can realistic adjustments bemade within your chosen options to achieve the goal? Or, is it ‘back to the drawingboard’?
Activity
Make a note of any adjustments you can make to your physical or financial plans.
. . Amount (£) .
Change in profits (G)
Profit goal (from page 2) (H) For example, increase profit by £8,000
Is the total (G) more than (H)? Yes �� . No ��If ‘Yes’, by how much? (G – H)
If ‘No’, by how much? (G – H)
5
Partial planning – planning a partial change to your current system

6 How will your chosen plan change the pattern of cashflow in and out of your business?
Activity
Assess likely changes in your cash-flow patterns over the first year by filling in thetable. The timing of changes in revenues and costs is particularly important.
Use these figures to identify the net changes in your funds through the year. Forexample, if the overall net effect (D-H) for the first quarter is -£3500 and you wouldexpect your current system to result in an overdraft of £20,000, you could now expectthe overdraft to be £20,000 + £3500 = £23,500 after the change.
* an increase in interest charges will occur if you need to borrow capital to fund the change, e.g. to purchase a newbuilding for free range hens.
** include here repayments of borrowed capital/loan repayments but do not include interest charges as they arealready included in costs further up the table.
Description . . Total . First . Second . Third . Fourthfor the quarter quarter quarter quarteryear
Quarterly (three-monthly) increases in revenues(identify the expected income from the new (A)enterprise, for example selling free-range eggs)
Quarterly decreases in revenues(identify the expected loss of revenues from any enterprises you have replaced or reduced in size, for (B)example, loss of income from wheat and barley sales)
Capital released by planned change (if any, for example selling machinery or equipment) (C)
Net effect on revenues (A) – (B) + (C) (D)
Quarterly increases in costs(identify the trading costs associated with the new enterprise, for example, feed, vet and (E)medical fees, wages and so on for free-range hens) and any increase in interest charges.*
Quarterly decreases in costs(identify the trading costs saved from any enterprises you have replaced or reduced in size, (F)for example, some fertiliser, seed and spray expenditure from the wheat and barley enterprise)
Capital expenditure to carry out the planned change (from page 3)** (G)
Net effect on costs (E) – (F) + (G) (H)
Overall net effect of the changes (D-H)
6
Figures for a Farming Future
Getting Started in Farm Management AccountingPart II: Mapping out a farming future

Activity
Check that the overall net effect in each quarter does not cause your closing balance tobe higher than your overdraft limit.
The balances represented by (D-H) may show that you need to invest more capital, forexample by using a loan or overdraft facility.
You will also probably need to project the pattern of cash flow forward by another yearor more to show the full effects of the changes. Ideally, in the ‘total for the year’column, the overall net effect of the changes will be positive.
7 Assessing your proposed changes for riskRisk is an important part of planning that you need to consider. You need to assesshow vulnerable your future business is to risk, and consider measures you could take tooff-set risk.
• How specialised is your proposed system, after introducing the changes? Howdependent are you on one enterprise, or the price of one product (for example,the price of eggs)?
Activity
Assess your risk and circle the appropriate option.
Not vulnerable Vulnerable Very vulnerable
• Is there any surplus profit in your proposed system to absorb a ‘hit’ from, forexample, a fall in the price of eggs or an increase in the cost of feed?
Activity
Assess your profit reserve risk and circle the appropriate option.
Surplus profit Small surplus profit No surplus profit
• How vulnerable is your proposed business to competitive risk? (for example,a business selling organic vegetables to just one buyer would produce highcompetitive risk
Activity
Assess your competitive risk and circle the appropriate option.
Not too vulnerable Vulnerable Very vulnerable
7
Partial planning – planning a partial change to your current system
• Can you take any steps to reduce risk?For example:
– use contracts to minimize price fluctuations.
– branch out into different farm activities?
– sell direct to customers at competitive prices?
– give better or personal service?
– give your produce a healthy, locally-grown image?
Financial summary of your proposed changes
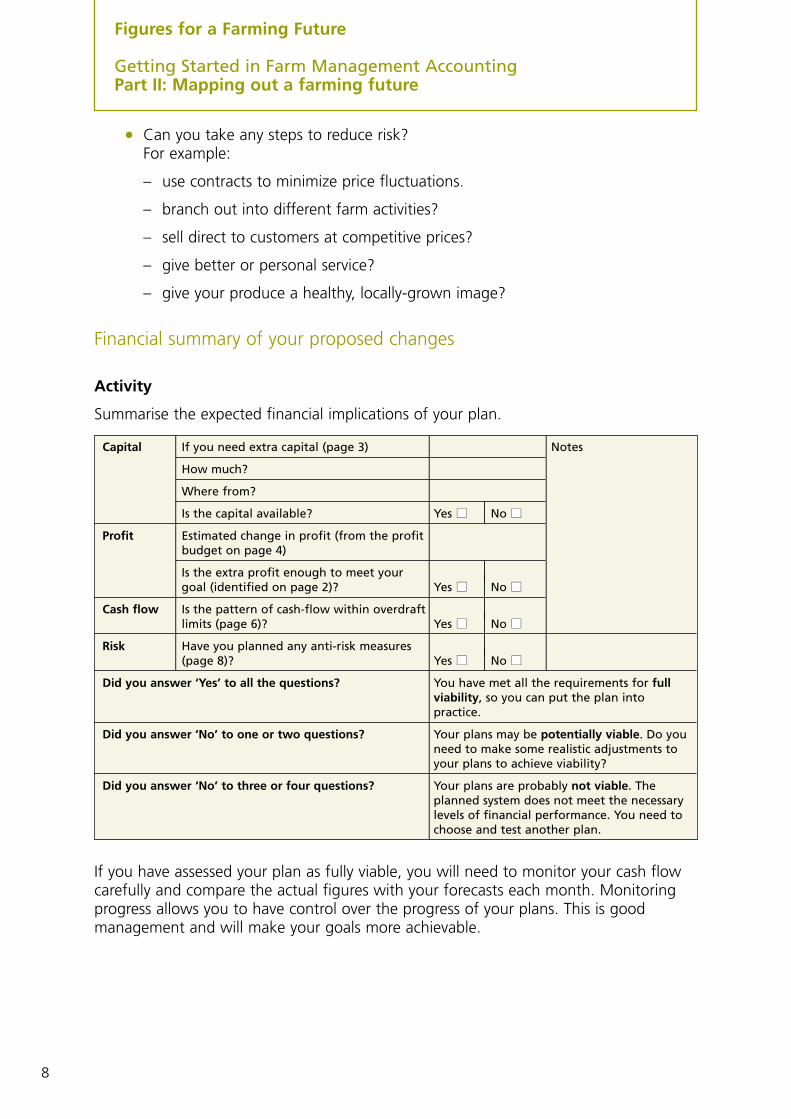
Activity
Summarise the expected financial implications of your plan.
If you have assessed your plan as fully viable, you will need to monitor your cash flowcarefully and compare the actual figures with your forecasts each month. Monitoringprogress allows you to have control over the progress of your plans. This is goodmanagement and will make your goals more achievable.
Capital . If you need extra capital (page 3) . . Notes
How much?
Where from?
Is the capital available? Yes �� . No ��Profit Estimated change in profit (from the profit
budget on page 4)
Is the extra profit enough to meet your .goal (identified on page 2)? Yes �� . No ��
Cash flow Is the pattern of cash-flow within overdraft .limits (page 6)? Yes �� . No ��
Risk Have you planned any anti-risk measures .(page 8)? Yes �� . No ��
Did you answer ‘Yes’ to all the questions? You have met all the requirements for fullviability, so you can put the plan intopractice.
Did you answer ‘No’ to one or two questions? Your plans may be potentially viable. Do youneed to make some realistic adjustments toyour plans to achieve viability?
Did you answer ‘No’ to three or four questions? Your plans are probably not viable. Theplanned system does not meet the necessarylevels of financial performance. You need tochoose and test another plan.
8
Figures for a Farming Future
Getting Started in Farm Management AccountingPart II: Mapping out a farming future

This section covers the steps involved in planning a major review and change to yoursystem. Whole farm planning takes a detailed look at the business, and aims to chooseand budget for a workable and viable system. The quality of the information used ina business plan is very important. Using figures that are realistic for your circumstanceswill help produce effective plans.
You can follow these steps when producing a business plan to help in the decision-making process.
1 Identify relevant aims and goals.
2 Identify your resources and any limitations.
3 Review suitable enterprises and other business options and choose a promising farm plan in outline detail.
4 Test that the plan is feasible (are the necessary resources available?).
5 Test that the plan is viable (does estimated profit meet the needs of the business?).
6 Test that the plan’s cash-flow is viable (does it create enough cash to fund the plan?).
7 Test the plan for risk.
1 Setting aims and goalsWhat do you need or want to achieve for your business? Examples of aims and goalsmay include the following.
You need to prioritise these goals and weigh up any conflicts between them.
Activity: If you have not already thought about your specific goals, identify them foryour business now.
These ‘strategic’ goals should help you develop a ‘practical farming plan’ that takesaccount of current resources and available opportunities.
Making enough profit will be an important financial goal, in order to meet thedemands of the business for private drawings, tax, repaying loans and reinvestmentto maintain the business (for example, in buildings, machinery and equipment).
To identify what level of profit is ‘enough’ you need to ask:
• How much profit does my system need to produce to allow for drawings, tax,loan repayments and reinvestment?
You need to estimate the demands on your profit, i.e. details of personal drawings, tax, loanrepayments and reinvestment for both your current system and your proposed system, when youhave chosen it. The remaining steps in this booklet will help you choose your proposed system.
Personal . Financial . Physical . Social
Leisure and pleasure Profitability Quality of produce Responsibility to: Personal development Viability Good long-term familyFamily considerations, Stability husbandry employeeshealth, succession. Adequate cash flow Care of the farm the local communityCare of the environment Landlord-tenant societyPrestige agreementsOther
9
Whole farm planning – making major changes to your current system

Activity
Identify your profit ‘target’ by listing the annual needs in the table below. You will onlybe able to complete all the boxes in the right hand column after you have worked yourway through the remainder of the booklet.
* to estimate this you need to consider the amount of capital the business would normally invest in buildings,equipment and machinery in one year, less disposals (asset sales). To do this for the current system you couldconsider the average annual investment (net of trade-ins) over the last 5 to 10 years as that will give you anindication of the ‘normal’ annual level of investment. For the proposed system, however, you will need to consider ifa higher (or lower) level of annual re-investment would occur. For example, the proposed system might require youto raise the level of annual investment in machinery because different types of machinery will be required under yourproposed system. You may need to seek specialist advice on this.
** depreciation (spreading the cost of an asset over its useful life) is included in the calculation of net profit but isnot a cost to the business in terms of cash. The demands on profit however have to be met with available cash.Therefore the profit target in the table is before depreciation.
2 Resources and limitationsBefore you consider options for change and choose your preferred mix of activities, youneed to have in mind an overview of your existing business and resources, and considerwhether it is practical to make the changes.
Activity
Using the table on the next page as a guide, identify the quantity and quality of theresources you can use, including their limitations.
Your Farm Your Farm
(Current system) (Proposed system)
. Amount (£) . Amount (£)
Private drawings
Tax
Repayments of loans
Reinvestment in buildings, machinery and equipment*
TotalProfit target you need to make (before depreciation**) to achieve viability £ £
10
Figures for a Farming Future
Getting Started in Farm Management AccountingPart II: Mapping out a farming future

Whilst the above table and process is very helpful in identifying strengths andlimitations of the farm’s resources, it assumes that the resources on the farm arerelatively ‘fixed’. When working your way through the table, you may need to thinkbeyond the farms current resources by considering options which involve for example
• taking on more land
• investing in additional machinery and buildings
• letting out the land to a third party or arranging for it to be contract farmed.
3 Options and choosing a planBy taking account of available resources, you now need to identify and considerrelevant options.
Which activity or mix of activities looks like the most promising route to achievingyour goals? To answer this question, you need to do the following:
Resource . . Your notes
Land Farm size
Soil types
Farmable area
Productivity For example, high, medium or low
Labour Number of staff
Available skills
Capital Own development capital Amount (£)available
Possibility of borrowing more Amount (£)money
Grants Amount (£)
Buildings Total capacities For example, head of stock or tonnes ofgrain
Flexibility of use For example, consider how easy it is to usethem for other purposes
Machinery and Availability For example, a list or schedule of items on equipment the farm
Flexibility of use/ For example, suitability for use in other change of use enterprises
Physical limitations Rainfall
Slopes and so on
Management Skills and abilities
External environment Markets
Safety
Pollution
Regulation
Policy changes
11
Whole farm planning – making major changes to your current system

Activity
Make a list of ideas that might allow you to achieve your aims, without making anyjudgements about them. It would be wise to include a wide range of possibilities atthis stage.
Examples of options to consider
Activity
Reduce these ideas to a short list by considering each in the light of your prioritisedgoals and your own interests. Provide an outline of the plan.
Example:
Activity
For each enterprise or activity included in your short list, consider any associatedstrengths and opportunities, along with any weaknesses or threats (and considerhow you could tackle these). For example, maincrop carrots:
Strengths . Weaknesses . Opportunities . Threats
Cash crop Variable produce prices Contracts Supermarkets tied tolarge-scale producers
Potential high value Vulnerable to the climate Retail packaging Changing consumption
Good cash flow Vulnerable to disease Co-operation
Suited to the ground Very capital intensive if it entails investment in machinery, storage and packing facilities
Your likely options . Outline detail
Option: for example a dairy farm aiming toachieve good levels of output and to useinvestment wisely
Outline detail: number and types of livestock,forage areas and area of arable or root crops(hectares), for example 120 dairy cows needing55 forage hectares
Traditional . Non-traditional . Reorganising assets
Livestock New enterprises Selling land or buildingsCrops Off-farm income. Leasing or letting out (for
example, machinery or a quota)Machinery sharingContract farmingShare farming
12
Figures for a Farming Future
Getting Started in Farm Management AccountingPart II: Mapping out a farming future

Now from your short list you need to choose the system you think is most likely toachieve your goals.
Activity
Summarise your chosen system and the business reasons for the proposed plan at thebottom of the page. What are its advantages from a business viewpoint, for example,good cash-flow pattern and/or anti-risk measures?
Now that you have chosen your preferred plan in outline, it is essential to test theplanned system to make sure that:
• there is enough land, labour, machinery and buildings to carry out the plan;
• there is enough financial capital available to carry out the intended plan if youneed new investment;
• the expected profit from the proposed system, when up and running, isenough to meet the needs of the business; and
• cash balances (cash flow) during and after you introduce the new system areadequate.
• it meets personal goals set out on page 9.
Strengths . Weaknesses . Opportunities . Threats
13
Whole farm planning – making major changes to your current system

4 Test that the plan is feasible (are the necessary resourcesavailable?)
You must test the feasibility of the proposed plan by measuring the demands oncapital and other resources (land and labour) that will happen in the first 12 months.If these demands are within the total amount of available land, labour and capital,the plan is feasible. On the other hand, if the plan appears to need more capital thanis available, is there any room for reducing the capital investment realistically, or is itback to the drawing board for a new plan?
Activity
Assess the resources you need to introduce the preferred changes.
Capital . . (£)
Assess what new investment capital you will need for buildings, machinery, plant and equipment (for example, 450 outdoor (A)sows: capital for shelters, stock, equipment, fencing and so on).
How much capital (if any) will be released as a result of the changes (for example, sale of machinery or equipment)? (B)
Net amount needed: (A) – (B)
Is this amount available? Yes �� . No ��If ‘No’, where will extra capital come from (for example, an overdraft or a loan)?
If the net amount you need is available (with or without .extra borrowing), the plan is feasible. Yes �� . No ��Has your system passed the capital test? .
If no, can you realistically reduce the capital required for .the system? Yes �� . No ��
If no, you need to select and assess an alternative plan
Land .
Amount needed (hectares)
Where from (which enterprises, if any, will release land?)
Labour
Current spare capacity (for example, half a person’s time, none and so on)
Skills needed:
If you need extra labour, where will it come from (for example, contract or casual)?
14
Figures for a Farming Future
Getting Started in Farm Management AccountingPart II: Mapping out a farming future

5 Test that the plan is viable (does the plan generate enoughprofit?)
When you have shown that the plan is feasible, you can then assess whether it is viable.
Does the profit expectation meet the needs of the business? You will remember that theamount of profit (profit before charging depreciation – see page 10) made needs tocover:
• private drawings;
• tax;
• repayments on loans and mortgages; and
• reinvestment to maintain the business (for example, in buildings, machineryand equipment).
You have already assessed the demands on your profit (on page 10). You now needto assess whether the expected profit from your proposed system will cover thesedemands in order for your system to be viable.
You need to ask: ‘How much profit (before charging for depreciation) will myproposed system create for me to spend on drawings, tax, loan repayments andreinvestment?’
You can answer this question by producing a profit budget for a ‘normal’ year whenthe proposed system is fully up and running.
Profit budget
You need to plan each enterprise making up the proposed farm system individuallyand monitor its progress if the whole business is to achieve its potential. As a result,for management purposes you need to work out the profit budget using enterprisegross margins and fixed costs.
The idea of gross margins was developed to allow farmers to focus on individualenterprises and assess their contribution to overall profitability, while avoiding thedifficulty of allocating fixed costs (like power and machinery) to each enterprise.Because fixed costs are not considered, a gross margin is not a profit figure. You canonly get the profit figure when you have deducted the farm’s fixed costs from thewhole farm gross margin.
A gross margin is only concerned with the output of an enterprise and its associatedvariable costs.
Enterprise gross margin = enterprise output less variable costs
15
Whole farm planning – making major changes to your current system

For planning purposes, a gross margin for winter wheat could look like this.
Winter wheat (milling)
£ Performance details
Enterprise output:
Yield (tonnes for each hectare) 7.25
Grain 543.75 Value (£ for each tonne) £75
Straw 30.00
Arable area payment (2004 only)* 225.00
Enterprise output 798.75
Variable costs
Seeds 40.00
Fertilisers 80.00
Sprays 105.00
Sundry crop costs 10.00
Total variable costs 235.00
Enterprise gross margin 563.75
*From 2005 harvest onwards, arable area payments will be zero. In 2005 a decoupled single payment will beintroduced. As, however, the single payment will not be attributable to any particular enterprise, the payment shouldnot be included in enterprise output, nor the enterprise gross margin. It should, however, be included within totalfarm output and profit.
This wheat enterprise has a gross margin of £564 for each hectare (one hectare = 2.47acres).
This amount is then available to cover the fixed costs (which are equally shared overthe whole farmed area) and to contribute to the whole farm net margin or profitmade by the business.
You must make realistic assumptions about yields, prices and costs when workingout the enterprise gross margins.
What is enterprise output?
The gross output of an enterprise is the total value of production of the enterprisetogether with any enterprise specific subsidies. From 2005 onwards, however,enterprise specific subsidies will be zero.
In the case of livestock, it is essential that you cost trading livestock (that you will selllater on) as a reduction in output. For example, animals bought in at 12 months andsold fat at 18 months only contribute to enterprise output for six months, and thismust be reflected in the enterprise output figure. Including the whole 18-month valueas output would be misleading.
16
Figures for a Farming Future
Getting Started in Farm Management AccountingPart II: Mapping out a farming future

In the case of breeding livestock, you must take account of replacing them byincluding a figure for herd or flock depreciation. In the example, gross margin fora dairy enterprise shown in appendix 1 (on page 29) the replacement cost (herddepreciation) is shown as the difference between the cost of a down-calving heiferand the value of a cull cow, spread over the useful life of the breeding animal:
Depreciation also reduces the enterprise output.
Output examples would be sales of milk, calves, beef, grain, potatoes.
What are variable costs?
Enterprise variable costs are costs that:
• change in direct proportion with changes in the scale of the enterprise;
• can be allocated to a specific enterprise; and
• you will no longer incur if a particular enterprise ends.
Examples of variable costs
Activity – Working out your gross margins
Now that you have selected your mix of enterprises to test for profit viability, use theblank gross margin templates in Appendix 2 (page 32) to construct the gross marginbudget for your business. Examples of gross margins for crop and livestock enterprisesare shown in Appendix 1 (page 29).
Templates are provided in Appendix 2 for both crop and livestock enterprises:
1 First enter your decisions regarding land area, physical and financial performancein the Performance Details section.
2 Multiply yield (per hectare or per head) x price to estimate the primary productvalue (£ per hectare or head) of enterprise output.
Livestock . Crops
Concentrate feed (including home-grown) Seed
Forage costs (any fodder, seed, fertilisers and sprays you have bought, and sundry forage costs) Sprays and chemicals
Vet and medical charges Fertiliser
Sundry variable costs Sundry variable costs
Cost of down-calving heifer (£) (A) . 700
Value of cull cow (£) (B) 320
Useful life in dairy herd (years) (C) 4
Yearly cow depreciation (£) (A – B) ÷ (C) 95
17
Whole farm planning – making major changes to your current system
3 Next complete the remaining output items per head or per hectare (if any) andenter the variable cost data to arrive at the gross margin per head or per hectare.
4 Finally, multiply these figures by the number of head or hectares allocated toarrive at the enterprise gross margin.
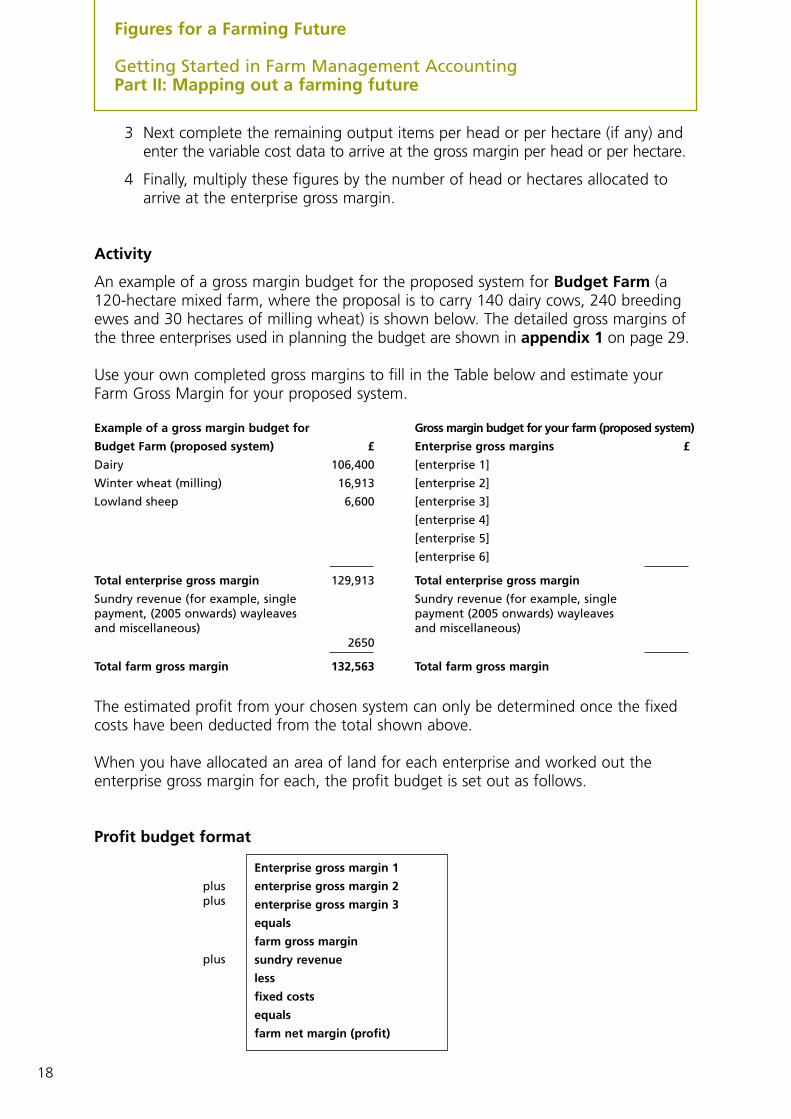
Activity
An example of a gross margin budget for the proposed system for Budget Farm (a120-hectare mixed farm, where the proposal is to carry 140 dairy cows, 240 breedingewes and 30 hectares of milling wheat) is shown below. The detailed gross margins ofthe three enterprises used in planning the budget are shown in appendix 1 on page 29.
Use your own completed gross margins to fill in the Table below and estimate yourFarm Gross Margin for your proposed system.
Example of a gross margin budget for Gross margin budget for your farm (proposed system)
Budget Farm (proposed system) £ Enterprise gross margins £
Dairy 106,400 [enterprise 1]
Winter wheat (milling) 16,913 [enterprise 2]
Lowland sheep 6,600 [enterprise 3]
[enterprise 4]
[enterprise 5]
[enterprise 6]
Total enterprise gross margin 129,913 Total enterprise gross margin
Sundry revenue (for example, single Sundry revenue (for example, single payment, (2005 onwards) wayleaves payment (2005 onwards) wayleaves and miscellaneous) and miscellaneous)
2650
Total farm gross margin 132,563 Total farm gross margin
The estimated profit from your chosen system can only be determined once the fixedcosts have been deducted from the total shown above.
When you have allocated an area of land for each enterprise and worked out theenterprise gross margin for each, the profit budget is set out as follows.
Profit budget format
plusplus
plus
Enterprise gross margin 1
enterprise gross margin 2
enterprise gross margin 3
equals
farm gross margin
sundry revenue
less
fixed costs
equals
farm net margin (profit)
18
Figures for a Farming Future
Getting Started in Farm Management AccountingPart II: Mapping out a farming future

Identifying Fixed costs
Any cost that does not meet all the conditions for being a variable cost is called a fixedcost (or overhead cost). You may still have to pay a fixed cost (for example, rent) evenif a particular enterprise ended. You need to deduct fixed costs from the farm grossmargin to get at the farm net margin or profit figure.
The fixed costs shown in the profit budget for Budget Farm (on page 22) represent thetotals for each category of cost. These categories are expanded in the following tableto show the individual fixed costs they contain.
How do I estimate the fixed costs for my profit budget?
• Labour
You have already considered whether you will need extra labour for yourproposed system (see page 14). If necessary, adjust your current labour coststo make a fair assessment of the cost of labour for your budget.
It may well be worthwhile seeking specialist advice on this, particularly if the proposedchange entails introducing an enterprise which is quite different to the current farmingsystem. For example, introduction of a poultry enterprise on a cereal farm.
There are published sources of whole farm management data that can also help. Datafrom the Farm Business Survey and publications of the type listed at the end of thisbooklet indicate typical levels of labour costs for different farm types, such as dairyfarms, cereal farms, cattle and sheep farms etc, and also for different farm sizes.However, make sure you seek advice if you are at all unsure how to interpret the data.
• Power and machinery costs
As with labour costs, it will probably be worth seeking specialist advice on howpower and machinery costs will be affected by the type of change you areconsidering, particularly if the proposed change entails introducing an enterprisewhich is quite different to the current farming system. Again, data from theFarm Business Survey and other publications can also help as a guide by showingtypical levels of power and machinery costs for different farm types.
Labour . Regular labour and any casual labour.
Power and machinery (running costs) Equipment repairs, fuels, electricity, contract and hire,vehicle licences, insurance and depreciation (of machineryand equipment), and machinery and equipment leasing costs
Miscellaneous fixed costs Property repairs and maintenance, Council Tax, water rates,property insurances and depreciation (of buildings andproperty improvements).Office and phone expenses, professional fees, subscriptionsand sundry overhead costs.
Rent and finance costs Rents and grass-keep charges, interest on all borrowings(loans, mortgages, overdrafts, hire purchase), quota leasing,
19
Whole farm planning – making major changes to your current system

If, however, the proposed change involves only a change in the size of thecurrent farming system, for example an expansion of the dairy herd on a dairyfarm, or an increase in the cropped area on a cereal farm, it is also possible tobroadly estimate the effect of the change on power and machinery costs byconsidering these costs as a proportion of output. In the first booklet ‘Using thefarm accounts to point the way’, you would have used the technique ofexpressing costs as a proportion of total output to compare your costs withtypical levels from farms in the Farm Business Survey. As a result, you will havea measure of the power and machinery costs as a percentage of output for yourexisting system. (See the section on fixed costs within part 1 of this series, ‘Usingthe Farm Accounts to Point the Way’).
Activity
However, if you do not have this measure to hand, work out your existing power andmachinery costs as a percentage of your existing output as follows.
You can add together the enterprise output shown in your gross margins for eachenterprise (see appendix 2 on page 32) and also, from 2005 onwards, include thedecoupled single farm payment. Adding all these together will give the gross output ofyour new system. To then estimate the power and machinery costs for your newsystem, use the same percentage as for your existing system, but it will be a percentageof the expected output of your new system*.
* This method is less suitable where quite different type of enterprises might beintroduced. For example, if a cereal farm were considering a potato enterprisethe power and machinery costs associated with growing potatoes are likely tobe larger than those from growing cereals. In this situation it would be best toseek specialist advice regarding the fixed cost implications.
Budget Farm Your Farm. (present system) . (present system)
Existing power and machinery costs (A) 31,139
Current gross output (B) 155,694
Power and machinery as a percentage of currentoutput(A) X 100 20%(B)
20
Figures for a Farming Future
Getting Started in Farm Management AccountingPart II: Mapping out a farming future

Activity
Estimate the gross output of your new system and work out the power and machinerycosts for your new system by filling in the following table.
Miscellaneous fixed costs
There may be no reason to believe that your miscellaneous fixed costs will be differentunder the new system. If you think they will be different, adjust them. Otherwise, youcan leave them as they are.
Rent and finance costs
If you have not already assessed your existing rent and finance costs while filling in part 1 ofthis series, you can get them from your latest profit and loss account. If extra land is requiredfor the proposed plan, do not forget to allow for the extra rent costs that would result.An accurate assessment of the extra borrowing requirement might only be possible after youhave prepared a cash flow (see page 25).
On page 14 of this booklet you considered the need for extra borrowing for your newsystem. You must include any extra interest on this borrowing in rent and finance costs.
The average amount of interest you may pay in each year of a five-year loan (for every£1000 you borrow) is shown in the following table at row (A). The average annualrepayments and total annual payments are also shown.
• Add any extra interest from row (A) above to your existing rent and financecosts to estimate the total to include in your budget.
Five-year loan . Interest rate
For every £1000 you borrow 4% 5% 6% 7% 8% 9% 10%
Average interest payment each year (A) £25 £31 £37 £44 £50 £57 £64
Average annual repayment of capital £200 £200 £200 £200 £200 £200 £200
Total annual payment £225 £231 £237 £244 £250 £257 £264
Gross output Budget Farm Your Farm
. (proposed system) . (proposed system)
Enterprise 1 (for example, dairy) £165,900
Enterprise 2 (for example, wheat) £23,963
Enterprise 3 (for example, sheep) £12,840
Enterprise 4
Enterprise 5
Enterprise 6
Expected farm gross output (B) £202,703
Power and machinery cost as a percentage of output in your existing system (A) 20%
Power and machinery costs for your profit budget (A) X (B) £40,541
100
21
Whole farm planning – making major changes to your current system
Note: at Appendix 3 on page 35 there is a more comprehensive table whichsets out annual payments for a wide range of interest rates and lengths of loan.
Activity
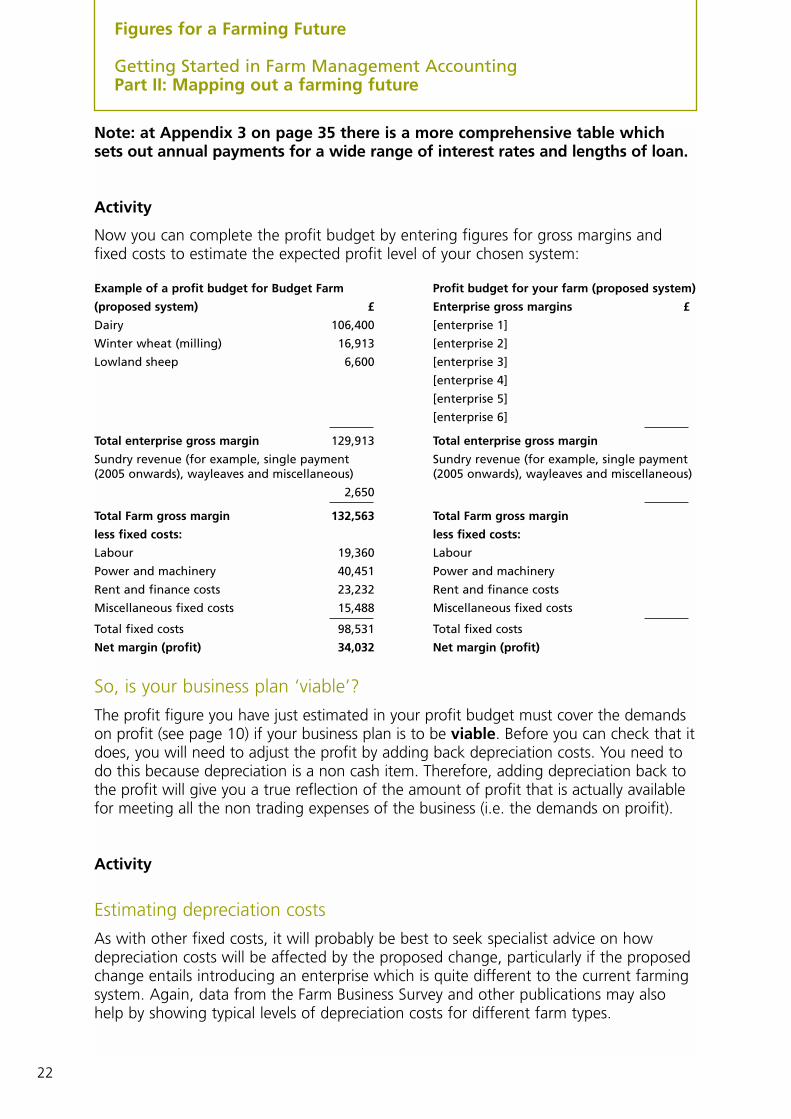
Now you can complete the profit budget by entering figures for gross margins andfixed costs to estimate the expected profit level of your chosen system:
Example of a profit budget for Budget Farm Profit budget for your farm (proposed system)
(proposed system) £ Enterprise gross margins £
Dairy 106,400 [enterprise 1]
Winter wheat (milling) 16,913 [enterprise 2]
Lowland sheep 6,600 [enterprise 3]
[enterprise 4]
[enterprise 5]
[enterprise 6]
Total enterprise gross margin 129,913 Total enterprise gross margin
Sundry revenue (for example, single payment Sundry revenue (for example, single payment (2005 onwards), wayleaves and miscellaneous) (2005 onwards), wayleaves and miscellaneous)
2,650
Total Farm gross margin 132,563 Total Farm gross margin
less fixed costs: less fixed costs:
Labour 19,360 Labour
Power and machinery 40,451 Power and machinery
Rent and finance costs 23,232 Rent and finance costs
Miscellaneous fixed costs 15,488 Miscellaneous fixed costs
Total fixed costs 98,531 Total fixed costs
Net margin (profit) 34,032 Net margin (profit)
So, is your business plan ‘viable’?
The profit figure you have just estimated in your profit budget must cover the demandson profit (see page 10) if your business plan is to be viable. Before you can check that itdoes, you will need to adjust the profit by adding back depreciation costs. You need todo this because depreciation is a non cash item. Therefore, adding depreciation back tothe profit will give you a true reflection of the amount of profit that is actually availablefor meeting all the non trading expenses of the business (i.e. the demands on proifit).
Activity
Estimating depreciation costs
As with other fixed costs, it will probably be best to seek specialist advice on howdepreciation costs will be affected by the proposed change, particularly if the proposedchange entails introducing an enterprise which is quite different to the current farmingsystem. Again, data from the Farm Business Survey and other publications may alsohelp by showing typical levels of depreciation costs for different farm types.
22
Figures for a Farming Future
Getting Started in Farm Management AccountingPart II: Mapping out a farming future

If, however, the proposed change involves only a change in the size of the currentfarming system, for example an expansion of the dairy herd on a dairy farm, or anincrease in the cropped area on a cereal farm, then it should be possible to make anestimate by calculating the depreciation costs as a proportion of output as shownbelow. This means following the same method as was shown for power and machinerycosts on page 20. In these cases you can estimate your depreciation costs as apercentage of your existing output as follows.
To estimate the depreciation costs for your new system, use the same percentage as foryour existing system, but it will be a percentage of the expected output of your newsystem.
Activity: Estimate the gross output of your new system and work out the depreciationcosts for your new system by filling in the following table.
Note: This method of estimating depreciation costs will not be suitable if yournew enterprise demands much higher levels of investment in machinery and/orbuildings than your current system. In such cases the much higher levels ofcapital investment will result in significantly higher levels of depreciation costthan your current system. Examples are the introduction of a dairy enterpriserequiring investment in cow and milking accommodation and forageconservation machinery. Another example is the introduction of an intensiveindoor pig or poultry enterprise. In this type of situation it would be betterto seek specialist advice.
Gross output Budget Farm Your Farm
. (proposed system) . (proposed system)
Expected farm gross output (B) £202,703
Depreciation cost as a percentage of output inyour existing system (A) 8%
Depreciation cost for your profit budget(A + B) X 100
100 £16,216
Budget Farm Your Farm
(current system) (current system)
Existing machinery depreciation costs (A) 8,178
Existing buildings depreciation costs (B) 4,278
Total Depreciation (A + B) 12,456
Existing Gross output (C) 155,694
Depreciation as a percentage of output(A + B) X 100
(C) 8%
23
Whole farm planning – making major changes to your current system

Activity
Having estimated the depreciation costs, adjust the profit figure from your budget to betterreflect the amount of profit that would be made available through your trading activities.
If the profit before depreciation is at least equal to the demands of drawings, tax,capital repayments and reinvestment, the business plan should be viable
Activity
Fill in the table below to assess how profitable your proposed business plan is.
In the far right hand column of the table on page 10 you have identified your profit‘target’ for the proposed system. Enter this figure at row (A) in the table above.
If (B) – (A) is a positive figure, the business plan is viable. A surplus of profit over andabove the demands on profit is important because it is a kind of ‘profit reserve’. Thisreserve could help your business to stay viable even after a sudden fall in product prices.
If (B) – (A) is a negative figure, the business plan is not viable. The deficit has to bemade up from other sources of funds, such as an increase in the overdraft, or you orsomeone else investing private funds.
At this point you should also check that the profit before depreciation underyour proposed system is greater than under the present system. To estimatethe profit before depreciation under the current system refer to the sectionon the Trading and Profit and Loss Account within the first booklet “Using theFarm Accounts to Point the Way”. If the profit before depreciation under theproposed system is not higher than that under the current system then there islittle point in adopting the plan.
The example of Budget Farm shows that the proposed plan is viable, because the demandson profit are higher than the cash created through trading. It may be possible to makerealistic adjustments to the profit budget to be viable. If not, you will need a new plan.
Budget Farm Your Farm
. (proposed system) . (proposed system)
Profit before depreciation (B) (from above table) 50,248
Profit target (A) (from page 10) 47,355
(B) – (A) £ 2,893 £
Profit adjustment Budget Farm Your Farm
. (proposed system) . (proposed system)
Profit (from budget) 34,032
Plus depreciation 16,216
equals profit before depreciation £ 50,248 £
24
Figures for a Farming Future
Getting Started in Farm Management AccountingPart II: Mapping out a farming future

If your planned system is not viable, can you adjust your planning assumptionsrealistically, or is it back to the drawing board for a new plan? Remember that foreach new plan, the demands on the business in terms of funds needed forreinvestment (as estimated on page 10) and loan repayments should be considered.
6 Test that the plan’s cash flow is viable (does it create enoughcash to fund the plan?)
What is cash flow?
Cash flow is concerned with all the money entering or leaving your business duringthe financial year, whether it relates to trading, capital or private items of income andexpenditure (spending). For example, loan payments shown in the cash flow willinclude interest (a trading item) and repayments (a capital item).
A transaction will only appear in the cash flow if it involves a transfer of cash. So, anyinternal transfers of materials or produce between enterprises (for example, home-grownbarley fed to beef cattle) will not appear in the cash flow because no money changeshands. Similarly, depreciation is not shown because it is a non-cash item of expense.
Planning cash flow
It is essential to consider the cash implications of your proposed plan, to make sure thatmonthly cash balances (cash flow) during and after putting the new system into practiceare adequate. It will also show you the peak borrowing requirement of your business plan.
You need to prepare a cash-flow budget to cover the development period until thenew system is fully up and running. For some systems it may take three years (ormore) to do this, while for others it may only take two years or even less.
The cash-flow budget is an important tool for monitoring and controlling the progress of yourplans, because budget figures in the cash flow are compared each month with the actualflow of cash through the business shown on your bank statements. No transaction will appearon the cash-flow statement until the money has actually entered or left the business.
It is important to pay careful attention to the timing of receipts and payments whendeveloping the cash-flow budget. For example, wheat sold off the farm in August willcreate cash-flow income at the end of September or the beginning of October.
Preparing a cash flow
When preparing a cash flow for the first time it can seem quite complex and it is easyto make mistakes. It is best to seek specialist help when preparing your first cash flow.There are cash flow templates towards the end of the booklet which can be used as abasis for your own cash flows.
Does your profit budget show it is viable? . Yes �� . No ��If ‘No’, can you make realistic changes to achieve viability? Yes �� No ��
If ‘No’, you need to consider another plan
25
Whole farm planning – making major changes to your current system

Activity
Cash-flow viability is shown if:
• you can put the plan into practice without going over the overdraft limit agreedby the bank; and
• once the system is fully working (for example, in year 2 or 3) the cash flowshould show a yearly surplus of cash income over expenditure so that the totallevel of borrowing reduces over time.
Once you have put the business plan into practice, you should compare the monthlycash-flow budget figures with the actual flow of cash shown on bank statements.This will allow you to monitor the progress of your plans and give you the chance totake action (if necessary) to keep the plans on course to meet your goals.
Activity
Assess whether your plan’s cash flow is viable.
8 Assessing your proposed changes for riskIt is important that you consider risk. You need to assess how vulnerable your futurebusiness is to risk, and consider measures you could take to off-set risk. At this point,you may find it helpful to refer back to the section on risk on pages 7 and 8 earlier inthis booklet.
Sensitivity analysis
Sensitivity analysis is a way of assessing how well your business can cope with theeffects of negative economic conditions (for example, lower prices or poor harvestyield). Would your business still be viable under these circumstances?
You should consider the main items of income and expenditure for your particularbusiness and how vulnerable the business would be to unexpected changes in them.For example, fertilizer and agrochemical costs are a major cost item for an arable farmbusiness. If you have considerable bank loans, mortgages or an overdraft, how would asudden rise in interest rates affect your profits? Or, what would be the effect of, forexample, a fall in the price of milk or an increase in the cost of feed?
Whenever undertaking sensitivity analysis, only one assumption should be changed at atime to see what effect it will have on the forecast results. If more than one assumptionis changed, it can be confusing as to which of the assumptions has made the biggestchange to the forecast results.
Does your cash-flow budget show it is viable? . Yes �� . No ��If ‘No’, can you make realistic changes to achieve viability? Yes �� No ��
If ‘No’, you need to consider another plan
26
Figures for a Farming Future
Getting Started in Farm Management AccountingPart II: Mapping out a farming future

Activity
Assess your risk and circle the appropriate description.
Not too vulnerable Vulnerable Very vulnerable
• Can you take any steps to reduce risk? For example:
– convert shorter-term borrowings to lower-cost longer-term borrowings?
– branch out into different farm activities?
– give better or personal service?
– enter into fixed price agreements for output or input items?
Activity
Identify below any anti-risk measures you could consider.
1.
2.
3.
4.
27
Whole farm planning – making major changes to your current system

Financial summary of your proposed changesNow it is decision time.
Activity
Summarise the expected financial effects of your plan.
If you have assessed your plan as fully viable, you will need to monitor your cash flowcarefully and compare the actual figures with your forecasts each month. Monitoringprogress can allow you to have control over the progress of your plans. This is goodmanagement and will make your goals easier to achieve.
If your efforts to ‘tweak’ your plans have been unsuccessful, you will need tochange your mix of chosen activities and start the process again.
Capital . If you need extra capital (see page 11) . . Notes
How much? £
Where from?
Is the capital available? Yes �� . No ��Profit Estimated profit (before depreciation)
see page 24) £
Is the estimated profit (before .depreciation) greater than under the Yes �� . No ��current system and is it adequate to meet the profit target identified on page 10?
Cash flow Is the cash-flow budget within overdraft .limits (page 26)? Yes �� . No ��
Risk Have you planned any anti-risk measures .(page 27)? Yes �� . No ��
Did you answer ‘Yes’ to all the questions? You have met all the requirements for fullviability, so you can put the plan intopractice.
Did you answer ‘No’ to one or two questions? Your plans may be potentially viable. Do youneed to make some realistic adjustments toyour plans to achieve viability?
Did you answer ‘No’ to three or four questions? Your plans are probably not viable. Theplanned system does not meet the necessarylevels of financial performance. You need tochoose and test another plan.
28
Figures for a Farming Future
Getting Started in Farm Management AccountingPart II: Mapping out a farming future

Examples of gross margins (used for planning the profit at BudgetFarm on pages 18 and 22)
Dairy£ £ Performance details
For each cow Total
Enterprise output: Number of cows 140
Milk 1,170 163,800 Yield (litres a cow) 6,500
Calf 45 6,300 Average milk price (pence a litre) 18
Dairy Premium (2004 only)* 65 9,100
Cull cows (for example, £320 a cow at 80 11,200 Stocking rate25% replacement rate) (cows for each hectare
of forage) 2
less
Replacement cost (for example, heifer at £700 and 25% replacement rate) 175 24,500
Gross output 1,185 165,900
Variable costs:
Concentrates (for example, 1.75 tonnes at £120
a tonne) 210 29,400 Concentrate fed a litre (kg) 0.27
Miscellaneous variable costs (bedding,vet and medical fees, AI and recording fees, and dairy consumables) 135 18,900
Total variable costs 345 48,300
Gross margin (before forage) 840 117,600
less
Forage costs (fodder, seed, fertilizer and sprays) 80 11,200
Gross margin for each cow 760 106,400
Gross margin for each hectare of forage 1,520 106,400
* From 2005 onwards, Dairy Premium will be part of the decoupled single payment. As, however, the singlepayment will not be attributable to any particular enterprise, the payment should not be included in enterpriseoutput, nor the enterprise gross margin. It should, however, be included within total farm output and henceprofit, as indicated in the example of a profit budget on page 22.
29
Appendix 1Examples of gross margins

Winter wheat (milling)£ £ Performance details
For each hectare Total
Enterprise output: Hectares 30
Grain 543.75 16,313 Yield (tonnes a hectare) 7.25
Straw 30.00 900 Yield (tonnes – total) 217.50
Arable area payments (2004 only)* 225.00 6,750 Value (£ a tonne) £75
Gross output 798.75 23,963
Variable costs:
Seeds 40.00 1,200
Fertilisers 80.00 2,400
Sprays 105.00 3,150
Sundry crop costs 10.00 300
Total variable costs 235.00 7050
Enterprise gross margin 563.75 16,913
*From 2005 harvest onwards, arable area payments will be zero. In 2005 a decoupled single payment will beintroduced. As, however, the single payment will not be attributable to any particular enterprise, the payment shouldnot be included in enterprise output, nor the enterprise gross margin. It should, however, be included within totalfarm output and hence profit, as indicated in the example of a profit budget on page 22.
Pork production£ £ Performance details
Per head Total
Enterprise output: Number of head to be sold 500
Finished pig sales 54.00 27,000 Average price/pig
(£ a head) 54
less
Cost of livestock purchases or transfers
from breeding enterprise (or both) 32.00 16,000
Gross output 22.00 11,000
Variable costs:
Concentrates 14.00 7,000
Miscellaneous variable costs(bedding, vet and medical fees, AIand recording fees, consumables) 4.00 2,000
Total variable costs 18.00 9,000
Gross margin for each pig sold 4.00 2,000
30
Figures for a Farming Future
Getting Started in Farm Management AccountingPart II: Mapping out a farming future

Lowland sheep£ £ Performance details
For each ewe Total
Enterprise output: Number of ewes 240
Lamb sales 49.50 11,880 Lambs sold or ewes put
Ewe premium (2004 only)* 13.00 3,120 to tup 1.50
Wool 2.00 480 Average price a lamb (£) 33.00
Cull ewes and rams 4.00 960 Stocking rate (ewes for each hectare) 12
less
Ewe and ram replacements
(see note 2 below) 15.00 3,600
Gross output 53.50 12,840
Variable costs:
Concentrates 8.00 1,920
Vet and medical fees 5.00 1,200
Miscellaneous 6.00 1,440
Forage costs 7.00 1,680
Total variable costs 26.00 6,240
Gross margin for each ewe 27.50 6,600
Gross margin for each hectare 330.00 6,600
*From 2005 onwards, beef and sheep premiums will be zero. In 2005 a decoupled single payment will beintroduced. As, however, the single payment will not be attributable to any particular enterprise, the payment shouldnot be included in enterprise output, nor the enterprise gross margin. It should, however, be included within totalfarm output and hence profit, as indicated in the example of a profit budget on page 22.
Note 1: The figures used here assume that ewe replacements are bought. If ewe lamb replacements are home-reared,the replacement cost will only be for replacement tups, and the value of lamb sales for each ewe will be lower.
Note 2: Flock depreciation is shown as the price of replacements less the value of culls. In this example, depreciation is£11 for each ewe, but this figure will depend on:
• the average life of a ewe;
• the value of cull ewes;
• death rates;
• the costs of replacing ewes;
• ram:ewe ratio;
• the life of the ram; and
• the cost of ram replacements.
31
Appendix 1Examples of gross margins

Gross margin templates (for developing your budget on page 22)
Crop 1 – gross margin£ £ Performance details
For each hectare Total
Enterprise output: Hectares
Product 1 (A) x (B) Yield (tonnes a hectare) (A)
Product 2 Yield (total tonnes)
Arable area payments (2004 only)* Value (£ a tonne) (B)
Gross output (C)
Variable costs:
Seeds
Fertilisers
Sprays
Sundry crop costs
Total variable costs (D)
Enterprise gross margin (C) – (D)
*From 2005 harvest onwards, arable area payments in will be zero. In 2005 a decoupled single payment will beintroduced. As, however, the single payment will not be attributable to any particular enterprise, the payment shouldnot be included in enterprise output, nor the enterprise gross margin. It should, however, be included within totalfarm output and hence profit, as indicated in the example of a profit budget on page 22.
Crop 2 – gross margin£ £ Performance details
For each hectare Total
Enterprise output: Hectares
Product 1 (A) x (B) Yield (tonnes a hectare) (A)
Product 2 Yield (total tonnes)
Arable area payments (2004 only)* Value (£ a tonne) (B)
Gross output (C)
Variable costs:
Seeds
Fertilisers
Sprays
Sundry crop costs
Total variable costs (D)
Enterprise gross margin (C) – (D)
*From 2005 harvest onwards, arable area payments will be zero. In 2005 a decoupled single payment will beintroduced. As, however, the single payment will not be attributable to any particular enterprise, the payment shouldnot be included in enterprise output, nor the enterprise gross margin. It should, however, be included within totalfarm output and hence profit, as indicated in the example of a profit budget on page 22.
32
Appendix 2Gross margin templates

Gross margin for livestock (fattening)Enterprise name:
£ £ Performance details
Per head Total
Enterprise output: (B) (A) x (B) Number of head to be sold (A)
Average price for each unit Product 1 of output (£ a head) (B)
Stocking rate (head of forage to each hectare)
Plus product 2 (if any) If applicable (S)
Plus subsidy (if this applies)
less
Cost of livestock purchases or transfers from breeding enterprise (or both)
Gross output (C)
Variable costs:
Concentrates or other feeds (for example,brewer’s grains)
Miscellaneous variable costs (bedding, vet and medical fees, AI and recording fees, consumables)
Total variable costs (D)
Gross margin (before forage) (C) – (D) (E)
less
Forage costs, if any (for example, purchased fodder, seed, fertilisers, sprays and additives) (F)
Gross margin (per head) (E) – (F) (G)Gross margin for each hectare of forage (G) x (S)
33
Appendix 2Gross margin templates
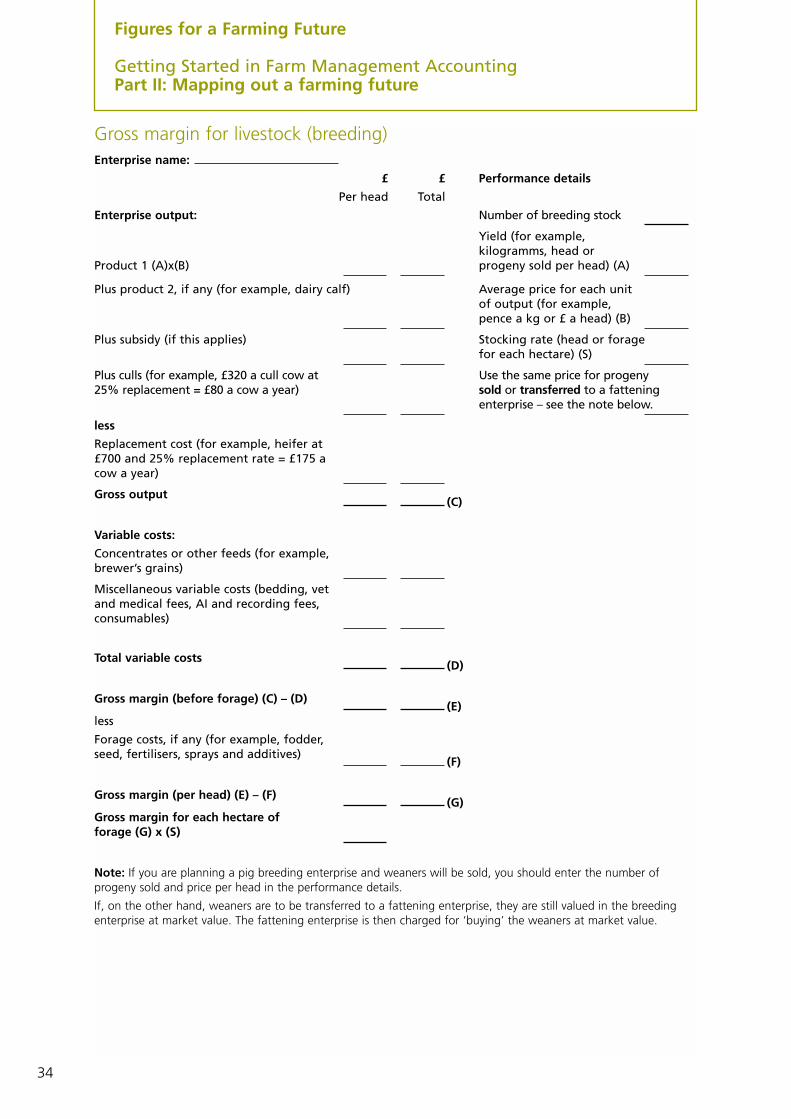
Gross margin for livestock (breeding)Enterprise name:
£ £ Performance details
Per head Total
Enterprise output: Number of breeding stock
Yield (for example, kilogramms, head or
Product 1 (A)x(B) progeny sold per head) (A)
Plus product 2, if any (for example, dairy calf) Average price for each unit of output (for example, pence a kg or £ a head) (B)
Plus subsidy (if this applies) Stocking rate (head or forage for each hectare) (S)
Plus culls (for example, £320 a cull cow at Use the same price for progeny25% replacement = £80 a cow a year) sold or transferred to a fattening
enterprise – see the note below.
less
Replacement cost (for example, heifer at £700 and 25% replacement rate = £175 a cow a year)
Gross output (C)
Variable costs:
Concentrates or other feeds (for example,brewer’s grains)
Miscellaneous variable costs (bedding, vet and medical fees, AI and recording fees, consumables)
Total variable costs (D)
Gross margin (before forage) (C) – (D)(E)
less
Forage costs, if any (for example, fodder,seed, fertilisers, sprays and additives)
(F)
Gross margin (per head) (E) – (F)(G)
Gross margin for each hectare of forage (G) x (S)
Note: If you are planning a pig breeding enterprise and weaners will be sold, you should enter the number ofprogeny sold and price per head in the performance details.
If, on the other hand, weaners are to be transferred to a fattening enterprise, they are still valued in the breedingenterprise at market value. The fattening enterprise is then charged for ‘buying’ the weaners at market value.
34
Figures for a Farming Future
Getting Started in Farm Management AccountingPart II: Mapping out a farming future

Table showing average annual payments of interest and repaymentsof capital for each £1,000 borrowed
For example, if £10,000 has been borrowed to be paid back over 16 years at an interest rate of 7%, theaverage total annual payment will be approximately £1,060 (= 10 X £106), of which the interest will beapproximately £440 (= 10 X £44), and the repayment of capital will be approximately £630 (=10 X £63).
Interest rate 3% 4% 5% 6% 7% 8% 9% 10% 12% 14% 16% 18% 20%
Termof loan(years)
Interest 18 25 31 37 44 50 57 64 77 91 105 120 134Repayment 200 200 200 200 200 200 200 200 200 200 200 200 200
5 Total (£ p.a.) 218 225 231 237 244 250 257 264 277 291 305 320 334
Interest 18 24 30 36 43 49 56 63 76 90 104 119 134Repayment 167 167 167 167 167 167 167 167 167 167 167 167 167
6 Total (£ p.a.) 185 191 197 203 210 216 223 230 243 257 271 286 301
Interest 18 24 30 36 43 49 56 62 76 90 105 119 134Repayment 143 143 143 143 143 143 143 143 143 143 143 143 143
7 Total (£ p.a.) 161 167 173 179 186 192 199 205 219 233 248 262 277
Interest 17 24 30 36 42 49 56 62 76 91 105 120 136Repayment 125 125 125 125 125 125 125 125 125 125 125 125 125
8 Total (£ p.a.) 142 149 155 161 167 174 181 187 201 216 230 245 261
Interest 17 23 30 36 42 49 56 63 77 91 106 121 137Repayment 111 111 111 111 111 111 111 111 111 111 111 111 111
9 Total (£ p.a.) 128 134 141 147 153 160 167 174 188 202 217 232 248
Interest 17 23 30 36 42 49 56 63 77 92 107 123 139Repayment 100 100 100 100 100 100 100 100 100 100 100 100 100
10 Total (£ p.a.) 117 123 130 136 142 149 156 163 177 192 207 223 239
Interest 17 24 30 36 42 50 57 64 78 94 109 126 142Repayment 83 83 83 83 83 83 83 83 83 83 83 83 83
12 Total (£ p.a.) 100 107 113 119 125 133 140 147 161 177 192 209 225
Interest 18 24 30 37 43 50 57 65 80 96 112 129 146Repayment 71 71 71 71 71 71 71 71 71 71 71 71 71
14 Total (£ p.a.) 89 95 101 108 114 121 128 136 151 167 183 200 217
Interest 18 24 30 37 44 51 58 66 81 98 114 132 149Repayment 63 63 63 63 63 63 63 63 63 63 63 63 63
16 Total (£ p.a.) 80 86 92 99 106 113 120 128 143 160 176 194 211
Interest 17 23 30 36 43 51 58 66 82 99 116 134 152Repayment 56 56 56 56 56 56 56 56 56 56 56 56 56
18 Total (£ p.a.) 73 79 86 92 99 107 114 122 138 155 172 190 208
Interest 17 24 30 37 44 52 60 67 84 101 119 137 155Repayment 50 50 50 50 50 50 50 50 50 50 50 50 50
20 Total (£ p.a.) 67 74 80 87 94 102 110 117 134 151 169 187 205
35
Appendix 3Table showing average annual payments of interest and repayments of capital for each £1,000 borrowed

36
Inte
rest
rat
e %
Trad
ing
inco
me
(fo
r ex
amp
le,
wh
eat,
milk
an
d s
ub
sid
ies)
New
loan
cap
ital
Priv
ate
cash
intr
od
uce
d
Selli
ng
ass
ets
Tota
l in
com
eA
An
nu
alTo
tal
Mo
nth
1M
on
th 2
Mo
nth
3M
on
th 4
Mo
nth
5M
on
th 6
Mo
nth
7M
on
th 8
Mo
nth
9M
on
th10
Mo
nth
11M
on
th12
Inco
me
Appendix 4Cash-flow template for year 1
Cas
h-f
low
tem
pla
te –
inco
me
item
s an
d t
ota
l in
com
e

37
Appendix 4Cash-flow template for year 1
Trad
ing
exp
ense
s
Var
iab
le c
ost
s
Seed
Fert
ilise
rs
Spra
ys
Feed
(in
clu
din
g f
ora
ge)
Sun
dry
var
iab
le c
ost
s
Fixe
d c
ost
s
Lab
ou
r
Pow
er a
nd
mac
hin
ery
run
nin
g
cost
s
Ren
t an
d f
inan
ce c
har
ges
Mis
cella
neo
us
fixe
d c
ost
s
Oth
er e
xpen
ses
Loan
pay
men
ts (
incl
ud
ing
in
tere
st)
Purc
has
e o
f as
sets
Dra
win
gs
Tax
Tota
l exp
end
itu
re
(bef
ore
inte
rest
) B
Cas
h s
urp
lus
or
def
icit
(b
efo
re in
tere
st)
G(A
-B)
Op
enin
g b
ank
bal
ance
F
Clo
sin
g b
ank
bal
ance
(b
efo
re in
tere
st)
F+G
Ave
rag
e b
alan
ce
Ove
rdra
ft in
tere
stC
Tota
l exp
end
itu
reD
(B
+C
)
Cas
h s
urp
lus
or
def
icit
E (
A-D
)
Clo
sin
g b
ank
bal
ance
F+E
Year
lyTo
tal
Mo
nth
1M
on
th 2
Mo
nth
3M
on
th 4
Mo
nth
5M
on
th 6
Mo
nth
7M
on
th 8
Mo
nth
9M
on
th10
Mo
nth
11M
on
th12
Exp
end
itu
re
Cas
h-f
low
tem
pla
te c
on
td.–
exp
end
itu
re it
ems,
cas
h s
urp
lus
or
def
icit
an
d c
losi
ng
ban
k b
alan
ce

Budget A financial document for forecasting gross margins, cash flow and profit.
Cash flow The flow of cash into and out of the business over a period of time, resulting in acash surplus (profit) or deficit (loss) for each period, for example month, threemonths, year and so on.
Capital The funds needed to run the business. The funds needed to finance the productioncycle are called working capital. Fixed capital is invested in land, buildings, machineryand breeding livestock.
Depreciation Spreading the net cost (i.e. purchase cost less estimated trade in value) of a capitalitem over its expected useful life. Depreciation is a non-cash item of expense, soprofit does not truly reflect the amount of cash created through trading.
Enterprise A specific farm activity, for example, feed barley, malting barley, dairy herd or livery.
The full value of the revenue of an enterprise, including subsidies (see ‘Grossoutput’).
Feasibility A test to see if resources are available to put a business plan into practice.
Fixed costs Any cost that is not attributable directly to an enterprise.
Goals Personal, financial, physical and social considerations used to plan the direction of thebusiness.
Gross margin The difference between the gross output and the variable costs of an enterprise.It allows planning and monitoring of an enterprise while avoiding the difficulty ofallocating fixed costs. As a result, it is not a profit figure.
Gross output The full value of everything produced by an enterprise or a business, includingsubsidies.
Hectare An area of 100 x 100 metres, equivalent to 2.47 acres.
Management The decision-making process of planning, monitoring and controlling the progress ofa business to achieve goals.
Net margin Gross margin less fixed costs.
The process of planning and testing changes to part of the business activity in orderto improve performance.
Profit A measure of the trading performance of the business. The yearly surplus of tradingincome over expenditure.
An assessment of the cost structure of the business in relation to output.
Revenue Trading income.
Risk An assessment of how vulnerable the business is to internal and external factors.
A technique for assessing the ability of your business to cope with the effects ofnegative economic conditions (for example, lower prices).
Variable costs Items of trading expenditure that can be allocated to a particular enterprise, and varyin scale depending on the size of the enterprise.
Viable A viable business has enough profit and cash flow, and has considered anti-risk measures.
The total of the enterprise gross margins.
A detailed look at the business and its current goals, aiming to choose a workableand viable system and budget for it.
Whole farmplanning
Whole farmgross margin
Sensitivityanalysis
Proportionalanalysis
Partial planning
Enterpriseoutput
38
Glossary

Reference sources for whole farm management data:(This list may not be exhaustive but has been compiled to the best of our knowledge at the time ofpublication)
Regional level data from the Farm Business Survey is published annually by the following ‘FBS Centres’:
Rural Business Research UnitAskham Bryan CollegeAskham BryanYork YO23 3 FRTel: 01904 772219
Rural Business UnitCentre for Rural Economics Research16-21 Silver StreetCambridge CB3 9EPTel: 01223 337166
Centre for Rural ResearchThe University of ExeterLafrowda HouseSt German’s RoadExeter EX4 6TLTel: 01392 263836
Farm Survey SectionImperial College LondonWye CampusWyeAshfordKent TN25 5AHTel: 0207 594 2925
Centre for Agricultural, Food and Resource EconomicsSchool of Economic StudiesDover Street BuildingThe University of ManchesterOxford RoadManchester M13 9PLTel: 0161 275 4822
School of Agriculture, Food and Rural DevelopmentUniversity of NewcastleNewcastle upon Tyne NE1 7RUTel: 0191 222 6900
Rural Business Research UnitUniversity of NottinghamSutton Bonington CampusLoughborough LE12 5RDTel: 0115 951 6070
39
Reference sources for whole farm management data

Department of Agriculture and Food EconomicsThe University of Reading4 Earley GateWhiteknightsPO Box 237Reading RG6 6ARTel: 01189 875123
Institute of Rural SciencesUniversity of Wales, AberystwythLlanbadarn CampusAberystwythCeredigion SY23 3ALTel: 01970 622253
Further sources:
Farm Accounts in EnglandFarm and Animal Health Economics DivisionDepartment for Environment, Food and Rural AffairsErgon House17 Smith SquareLondon SW1P 3JRTel: 0207 238 3266www.defra.gov.uk/esg/default.htm
Farm Incomes in ScotlandAnalytical Services DivisionScottish Executive Environment and Rural Affairs DepartmentPentland House47 Robb's LoanEdinburgh EH 14 1TYTel: 0131 556 8400www.scotland.gov.uk
The Agricultural Budgeting and Costing BookAgro Business Consultants LtdFreepost LE52722 Nottingham StreetMelton MowbrayLeicestershire LE13 0BRTel: 01664 567676
The Farm Management HandbookFarm Management Handbook SalesScottish Agricultural CollegeWest Mains RoadEdinburgh EH9 3JGTel: 0131 535 4305
Farm Management PocketbookImperial College Londonc/o 2 Nottingham StreetMelton MowbrayLeicestershire LE13 1NWTel: 01664 564508
40
Figures for a Farming Future
Getting Started in Farm Management AccountingPart II: Mapping out a farming future

PB9062 Part 2
www.defra.gov.uk www.scotland.gov.uk


![[XLS]tax.vermont.govtax.vermont.gov/sites/tax/files/documents/SPAN Data List... · Web view015-005-10947 015-005-10091 015-005-11649 015-005-10773 015-005-11222 015-005-10889 015-005-11109](https://img.dokumen.tips/doc/110x75/5ac161e67f8b9a5a4e8d129a/xlstax-data-listweb-view015-005-10947-015-005-10091-015-005-11649-015-005-10773.jpg)