Embed Size (px)
Citation preview

Getting Out The Vote: Outreach Strategies to Increase Engagement
and Participation In the 2018 City of Vancouver Election
Paul Hendren, MPA candidate
School of Public Administration
University of Victoria
January 2018
Client: Rosemary Hagiwara, Deputy Chief Election Officer
City of Vancouver
Supervisor: Dr. Kimberly Speers
School of Public Administration, University of Victoria
Second Reader: Dr. Emmanuel Brunet-Jailly
School of Public Administration, University of Victoria
Chair: Dr. Tara Ney
School of Public Administration, University of Victoria
i
Executive Summary
Introduction
The prolonged decline of voter turnout in Canada, as well as other democratic nations, is a topic
of interest and concern among academics, civic organizations, and governments. As Dalton
(2008) notes, public participation in politics is “broadly considered to be a defining element of
democratic citizenship” and voting is widely considered to be one of the foundational activities
of a democracy (p. 78). Common arguments advanced by scholars whose works support
increasing political participation, are that higher-rates of participation increases the
representativeness of government bodies, and by extension their perceived legitimacy and citizen
support for political decisions (Bennett & Resnick, 1990; Michels, 2011; Nakhaie, 2006; Verba,
1967).
Municipal elections are held in the city of Vancouver every four years with residents voting to
elect one Mayor and 10 City Councillors; six Park Board Commissioners; and nine School Board
Trustees. After declining between the 2002 and 2008 elections, voter turnout in Vancouver has
increased from a low of 31% in 2008 to 43.4% in the 2014 election (City of Vancouver, 2014).
The higher level of turnout in 2014 correlates with an increase in public outreach leading up to
the election, and the Election Office has received direction to further expand outreach
programming for 2018. A key driver for expanding outreach is the report released by the
Independent Election Task Force established by City Council, which identified continuing to
increase voter engagement and turnout as priority actions for the Election Office (Independent
Election Task Force, 2017, p. 7).
The purpose of this project is to examine how public outreach programs can be used to increase
political participation. The research question is: How can the City of Vancouver use public
outreach to increase citizen engagement and participation in the 2018 civic election? Findings
and recommendations will be used by the Election Office, to develop a strategic outreach plan
with activities to address barriers to voting and increase voter participation in time for the
election on October 20.
Methodology and Methods
This project combines various research methods and data sources in order to better understand
voter behaviour and barriers to voting. Research was conducted in three phases starting with a
literature review of academic and government studies to get a comprehensive overview of topics
that are important to the research question, including studies of political engagement, voter
behaviour, and factors known to affect voter turnout.
The second phase involved the analysis of demographic data and socioeconomic indicators for
Vancouver’s 23 local areas, and comparisons to voter turnout in the 2014 election to look for
correlations. Finally, jurisdictional scans of other government election agencies were conducted
to identify smart practices used in election outreach programs. Data for the jurisdictional scans

ii
was collected through interviews with outreach program managers at Elections Canada,
Elections BC, City of Toronto, and City of San Francisco; and by reviewing program documents.
Key Findings
Findings from the literature review, analysis of demographic data, and jurisdictional scan were
complimentary in identifying key barriers to voting, underrepresented populations with low rates
of participation, and methods for increasing voter participation through outreach.
A notable finding from the literature review was the lack of a universal theory or model of voter
behaviour that can be applied to increase participation in elections. The literature review
demonstrated that voter behavior is influenced by a range of social, economic, and physical
factors that need to be addressed in order to change voter behaviour in different populations. The
review of factors that affect voter participation identified key barriers including lack of
knowledge and information, socioeconomic factors, negative attitudes towards the political
system, and physical access barriers.
A finding of concern identified in the literature review and analysis of demographic data is that
low voter turnout tends to be disproportionately concentrated among certain populations.
Comparisons of demographic data and socioeconomic indicators for Vancouver’s 23 local areas
to voter turnout in the 2014 election showed lower rates of turnout in areas with:
high proportions of young adults (18-34);
Indigenous peoples;
new citizens;
people who do not speak English;
people who have low incomes or are homeless;
renters; and
people who are socially isolated.
The same analysis showed turnout was higher in neighbourhoods with older populations, as well
as areas with higher household incomes and education levels.
The jurisdictional scans provided insight into smart practices for increasing participation in
elections. A core set of outreach activities were identified, including consulting with community
organizations and service providers to identify barriers; increasing the availability of information
and positive social cues to vote by sending outreach staff to events; and forming partnerships
with community and non-profit organizations to increase the distribution of information to
people in underrepresented groups.

iii
Options to Consider and Recommendations
This report proposes recommendations for expanding the City of Vancouver’s election outreach
program in 2018. Recommendations are informed by the smart practices identified in the
literature review and jurisdictional scans of other election outreach programs. Recommendations
were also selected based on their alignment with the Election Offices’ objectives to:
provide accessible and timely election information and services to citizens;
increase overall voter turnout by improving engagement with low voting communities
and demographics;
reduce barriers for voters with disabilities; and
be strategic, data driven and innovative (personal communication, 2017).
Key Recommendations
Develop a project plan to implement the recommendations in this report that includes
project timeline, required staff and roles, budget and other required resources.
Conduct focus groups with City of Vancouver advisory committees and survey local
community organizations ahead of the election to improve engagement and collect
recommendations for reducing barriers to voting.
Hire a team of culturally diverse and multilingual outreach staff to attend community
events to register voters; educate residents on the roles and responsibilities of the City of
Vancouver and elected officials; promote the City’s Plan Your Vote tool; and distribute
information on how to vote.
Work with community organizations to increase election awareness, voter registration,
and the distribution of informational materials.
Conduct targeted outreach to populations with low voter turnout, including young adults
(18-34); Indigenous peoples; new citizens; people who do not speak English; people who
have low incomes or are homeless; persons with disabilities; renters; and people who are
socially isolated.
Consider paid partnerships with organizations that have experience engaging people in
low voting demographics like Civix, Check Your Head, and Samara.
Pilot service agreements with community organizations to run peer based outreach
programs targeted to communities that are harder to reach through traditional outreach
channels due to trust issues, as well as cultural and language barriers.
Increase outreach in neighbourhoods that had the lowest rates of voter turnout in the 2014
election: Downtown, Renfrew-Collingwood, Victoria-Fraserview, Marpole, Oakridge,
and Strathcona.

iv
Hire a company to conduct a scientifically valid post-election survey that is
representative of Vancouver residents, to better understand reasons for electors voting or
not voting; voter experience and satisfaction with the voting process; barriers that are
preventing people from voting; and knowledge of the election and sources of
information.
v
Table of Contents
Contents 1.0 Introduction ............................................................................................................................................ 1
1.1 Background and Problem Definition ....................................................................................................... 1
1.1.1 Review of Election Outreach Campaigns for 2011 and 2014 Vancouver Elections ......................... 2
1.1.2 Planning For Outreach in the 2018 Vancouver Election .................................................................. 3
1.2 Problem Definition .................................................................................................................................. 4
1.3 Project Client ........................................................................................................................................... 5
1.4 Project Objective and Research Question .............................................................................................. 5
1.5 Organization of Report ............................................................................................................................ 5
2.0 Literature Review .................................................................................................................................... 6
2.1 Concepts and Theoretical Frameworks .................................................................................................. 6
2.1.1 Rational Choice Model ..................................................................................................................... 6
2.1.2 Political Efficacy ............................................................................................................................... 7
2.1.3 Voter Knowledge.............................................................................................................................. 7
2.1.4 Social Capital Theory ........................................................................................................................ 8
2.1.5 Norms of Citizenship & Civic Duty ................................................................................................... 8
2.1.6 Expressive Voting Theory ................................................................................................................. 9
2.2 Factors That Affect Voting ...................................................................................................................... 9
2.3 Demographic & Social Determinants of Political Participation ............................................................ 10
2.3.1 Age ................................................................................................................................................. 10
2.3.2 Education ....................................................................................................................................... 11
2.3.3 Economic well-being ...................................................................................................................... 11
2.3.4 Family Composition ....................................................................................................................... 12
2.3.5 Citizenship ...................................................................................................................................... 12
2.4 Literature Review Summary .................................................................................................................. 12
3.0 Methodology and Methods .................................................................................................................. 14
3.2 Methods ................................................................................................................................................ 14
3.2.2 Interview Process ........................................................................................................................... 15
3.2.3 Data Analysis .................................................................................................................................. 15
4.0 Demographic Profiles of Vancouver Neighbourhoods and Voters ....................................................... 17
4.1 Vancouver Demographics and Voter Turnout ...................................................................................... 17
4.1.1 Voter Turnout ................................................................................................................................ 17

vi
4.1.2 Age ................................................................................................................................................. 17
4.1.3 Indigenous People in Vancouver ................................................................................................... 18
4.1.4 Immigration Status ......................................................................................................................... 18
4.1.5 Language ........................................................................................................................................ 19
4.1.6 Income and Education ................................................................................................................... 19
4.1.7 Social Connections and Civic Engagement ..................................................................................... 19
4.1.8 Voter Registration .......................................................................................................................... 20
4.2 Summary of Data Analysis .................................................................................................................... 20
5.0 Findings: Voter Engagement and Outreach Jurisdictional Scans .......................................................... 21
5.1 Elections Canada - Voter Outreach in the 42nd General Election ......................................................... 21
5.1.1 Outreach Planning ......................................................................................................................... 21
5.1.2 Program Operation ........................................................................................................................ 22
5.1.3 Targeted outreach example: Facilitating First Nation Information on Voting............................... 23
5.1.4 Targeted Outreach Example: Engaging First Time Voters with Samara ........................................ 24
5.1.5 Program Assessment...................................................................................................................... 25
5.2 Elections BC - Voter Outreach in the 2017 Provincial Election ............................................................. 26
5.2.1 Outreach Planning ......................................................................................................................... 26
5.2.2 Program Operations ....................................................................................................................... 27
5.2.3 Targeted Outreach Example: Indigenous Outreach ...................................................................... 29
5.2.4 Targeted Outreach Example: Youth ............................................................................................... 29
5.2.5 Targeted Outreach Example: People with Disabilities ................................................................... 29
5.2.6 Program Assessment...................................................................................................................... 30
5.3 City of Toronto Election Services - Voter Outreach in the 2014 General Election ............................... 31
5.3.1 Outreach Planning ......................................................................................................................... 31
5.3.2 Program Operation ........................................................................................................................ 33
5.3.3 Targeted Outreach Example: Animator Program to Reach Tenants ............................................. 34
5.3.4 Targeted Outreach Example: Increasing Election Accessibility ..................................................... 35
5.3.5 Program Assessment...................................................................................................................... 35
5.4 City of San Francisco - Voter Outreach in the 2016 Consolidated General Election ............................ 36
5.4.1Outreach Planning .......................................................................................................................... 36
5.4.2 Program Operation ........................................................................................................................ 38
5.4.3 Targeted Outreach Example: Youth and High School Students ..................................................... 39
5.4.4 Targeted Outreach Example: Voters with Limited English and New Citizens ................................ 40

vii
5.4.5 Program Assessment...................................................................................................................... 40
5.5 Summary of Findings from Jurisdictional Scans .................................................................................... 41
5.5.1 Outreach Planning ......................................................................................................................... 41
5.5.2 Outreach Activities ......................................................................................................................... 42
5.5.3 Outreach Program Evaluation ........................................................................................................ 44
6.0 Discussion and Analysis: Linking Theories of Political Participation and Jurisdictional Scans to a Voter
Outreach Strategy for the City of Vancouver.............................................................................................. 45
6.1 Addressing Barriers to Voting In Vancouver: Current Challenges ........................................................ 45
6.2 Universal Outreach: Reaching All Eligible Voters .................................................................................. 45
6.3 Targeted Outreach: Reaching Populations With Higher Barriers to Participation ............................... 46
6.3.1 Low Income/Level of Education ..................................................................................................... 47
6.3.2 Youth and Young Adults ................................................................................................................. 47
6.3.3 New Citizens and People With Low English Proficiency ................................................................ 48
6.3.4 Indigenous Peoples ........................................................................................................................ 49
6.3.5 Renters ........................................................................................................................................... 49
6.3.6 Persons Living Alone and Community Social Connections ............................................................ 50
7.0 Voter Outreach Options to Consider and Recommendations .............................................................. 51
7.1 Planning................................................................................................................................................. 51
7.2 Operations ............................................................................................................................................ 52
7.3 Program Evaluation ............................................................................................................................... 54
8.0 Moving Forward: Implementing the Recommendations and Meeting the Preferred Outcomes ........ 55
9.0 Conclusion ............................................................................................................................................. 58
References .................................................................................................................................................. 60
Appendices .................................................................................................................................................. 65

1
1.0 Introduction
The City of Vancouver is granted authority to hold municipal elections every four years by the
Province of British Columbia through the Municipal Elections Act and Vancouver Charter.
Vancouver has a population of 631,486 residents and approximately 440,000 registered voters
(Statistics Canada, 2017), who are eligible to vote to elect one Mayor and 10 City Councillors;
six Park Board Commissioners; and nine School Board Trustees.
Voter turnout in the 2014 election was 43.4%, the largest turnout since 2002, when 50% of
Vancouver residents voted (Chan, 2014, para. 11). Voter participation in the 2014 election was
considered to be successful when looked at in comparison to turnout levels in other years. Voter
participation declined between the 2002 and 2008 Vancouver elections, with the lowest turnout
in 2008 at 31%, as shown in Appendix 1. The higher level of turnout in 2014 correlates with a
number of new strategies implemented by staff aimed at increasing voter turnout, including
increasing public outreach; however, no data is available to measure the direct impact of specific
initiatives.
Staff in the City’s Election Office have received direction from City Council to expand the
public outreach program for the municipal election in 2018. The direction comes in part from a
report released by the Independent Election Task Force established by City Council in 2016,
which identified continuing to increase voter engagement and turnout as priority actions for staff
(Independent Election Task Force, 2017, p. 7). As recommended in the report, a new election
outreach lead position has been created. The outreach lead is responsible for developing an
outreach strategy for the 2018 election and fostering partnerships with local community
organizations to “inform all potential voters about the role of local government and the many
opportunities to vote, as well as, engage with traditionally low voting communities in
Vancouver” (Hagiwara, 2017, p. 4).
This report uses academic research and jurisdictional scans of other government election
agencies, to identify smart practices of successful voter outreach campaigns. Research findings
will assist in developing an outreach strategy that the election outreach lead can implement to
increase public awareness of the election, provide citizens with the information they need to
make an informed decision about voting; and, by extension of expanding public outreach,
support the goal of increasing voter turnout.
1.1 Background and Problem Definition
Increasing voter knowledge, reducing barriers, and reaching people in diverse communities are
key election goals that have been referenced in recent reports to the City. The Engaged City Task
Force report stated that increasing electoral engagement among young people, newcomers and
new immigrants is foundational to creating a truly engaged city (2014, p. 31); while the Healthy
City Strategy lists increasing voter engagement as an important component of community
connectedness (2015, p. 11). Members of the Independent Election Task Force also made a
number of recommendations related to voter engagement and outreach that are discussed in more
detail later in this section.

2
1.1.1 Review of Election Outreach Campaigns for 2011 and 2014 Vancouver Elections
The outreach strategy for the 2011 Vancouver election included community wide engagement to
increase overall voter turnout, with a targeted focus on increasing youth participation. The
objectives for the outreach strategy were:
increase voter turnout above the average 30%;
encourage participation of youth between the ages of 20-30 in the municipal election;
register 1,500 new voters; and
support city wide outreach efforts as part of the overall outreach strategy from the
Elections Office (Personal communication, 2017).
In order to achieve the outreach objectives staff attended events, distributed information in high-
traffic public spaces, and ran a series of community information events where staff presented an
overview of the voting process and the responsibilities of municipal government. There were two
distinct phases to the outreach. The first phase ran from the beginning of September into the first
week of October and focused primarily on advance voter registrations (Personal communication,
2017). The second phase ran from late October until Election Day on November 19th and
focused on giving eligible first time voters information on what to expect at polling stations and
ways to get informed (Personal communication, 2017).
The City of Vancouver’s election outreach program increased significantly in 2014, with staff
implementing several new strategies and initiatives aimed at increasing voter engagement and
turnout. New initiatives in 2014 included:
making voting convenient and easy for voters by introducing a “Vote Anywhere” model;
increasing voting opportunities by providing more advance voting hours and locations
and providing conveniently located voting places on election day;
enhancing access for persons with disabilities and seniors;
engaging voters by providing easy to access election information and online tools to
assist in voting, as well as implementing innovative communication and social media
strategies; and
strengthening the delivery of the election by enhancing the election official recruitment
process, increasing the focus on youth recruitment, and through state-of-the art
technology and equipment (MacKenzie, 2014, p. 5).
To help inform as many electors as possible outreach staff developed a list of 280 civic and
community organizations that were enlisted to help distribute informational materials. Two
months before the election groups on the list were sent posters and postcards with voting dates
and information to distribute through their networks (MacKenzie, 2014, p. 16).

3
Informational materials were also distributed at community celebrations and cultural events. A
team of culturally diverse outreach workers attended 33 events in the two months before the
election, to raise awareness and increase peoples’ knowledge of important voter information
including registration, the different ways to vote, eligibility requirements, and how to use the
new Plan Your Vote tool (MacKenzie, 2014, p. 19). Outreach workers attended a range of events
across the city to engage with diverse groups, including community days in different
neighbourhoods, farmers markets, homelessness action week, neighbourhood house activities,
events on university campuses, and giving out information around transit hubs (p. 19).
Voter turnout in the 2014 election increased from 34.6% in 2011 to 43.4% (McKenzie, 2015,
p.2) While it is not possible to measure the effects of each new initiative implemented in 2014 on
voter turnout individually, increased outreach is credited in part for the higher rates of
participation. Beyond the new initiatives, the Chief Election Officer acknowledged in the final
report that there are factors which affect voter turnout that are beyond the influence of election
staff, including how electors feel about the candidates running for office, as well as levels of
voter fatigue and apathy (McKenzie, p. 5).
1.1.2 Planning For Outreach in the 2018 Vancouver Election
An Independent Election Task Force was established by Council in 2016, with a mandate to
recommend changes “concerning the delivery of municipal elections in the city of Vancouver
that will lead to improved public confidence in the electoral processes at the municipal level and
increase voter engagement – with a key goal being to increase voter turnout to at least 60% by
2025” (Independent Election Task Force, n.d., How We Work). A key deliverable of the Task
Force was to bring citizens’ perspectives to the implementation of the six measures of public
confidence and voter engagement they identified, which are:
political equality;
representation of diverse viewpoints;
accountability of elected representatives;
voter satisfaction;
voter political knowledge; and
voter turnout (Independent Election Task Force, 2017, p. 9).
In their report the Task Force recommended that the City undertake the following actions to
increase voter turnout:
invest in additional elections outreach resources to develop partnerships and align
strategies to deploy the Plan Your Vote tool with civic groups throughout the city;
implement post-election polling to better understand the effectiveness of the different
voter engagement tactics and tools; and

4
increase positive voting cues by equipping non-partisan civic groups to use their existing
networks to augment overall positive voting cues throughout the City (Hagiwara, 2017, p.
5).
After the Independent Election Task Force presented their recommendations to Council on
January 24, 2017, staff were directed to review the report recommendations and report back to
Council with an assessment. The staff response to the Task Force’s recommendations related to
outreach, included committing to hire a dedicated outreach lead who will be responsible for
designing and managing a program to inform all potential voters about the role of the City of
Vancouver, the many opportunities to vote, and directly engage with traditionally low voting
communities (Hagiwara, 2017, p . 4). Additionally the outreach lead is responsible for
developing partnerships, increasing positive voting cues, and implementing the City’s first post-
election survey to gather feedback on voter behaviour and experience (Hagiwara, 2017, pgs. 5 &
6).
In addition to the activities outlined in the report to Council, there are a number of departmental
objectives for 2018 that election outreach activities are expected to align with, including:
providing accessible and timely election information and services to citizens;
increase overall voter turnout by improving engagement with low voting communities
and demographics;
reduce barriers for voters with disabilities; and
be strategic, data driven and innovative (J. Nelson, Personal communication, 2017).
1.2 Problem Definition
The general problem this report addresses is lower than desired citizen participation in
Vancouver’s civic elections. While voter turnout has been increasing since the election in 2008,
staff need to build on the innovative work done during past elections in order to work towards
the voter turnout goal of at least 60% by 2025 (Independent Election Task Force, 2017, p. 7). To
support continued increases in turnout, election staff need to continue working to identify and
remove barriers and engage citizens across the city’s diverse demographics.
Numerous scholars consider finding ways to improve the voting process and increase
participation in elections important goals for maintaining healthy democratic systems (Bennett &
Resnick, 1990; Michels, 2011; Nakhaie, 2006; Verba, 1967). Common arguments advanced by
scholars whose work supports increasing political participation are that higher-rates of
participation increases government legitimacy and citizen support for political decisions.
Gludovatz (2012) writes that high-rates of non-voting affect the political system, as the views of
the most partisan citizens become overrepresented and gain unequal levels of influence to
advance policies that favour narrow interests (p. 13). This view argues that in a system requiring
votes for elected officials to maintain power, the needs of groups with lower-levels of
participation can become underrepresented in political decision making.

5
Based on the theoretical foundation that high-levels of political participation are important for
the functioning of healthy and representative democracies, this report uses research and data
analysis to identify election outreach smart practices and recommendations for increasing elector
participation in the 2018 Vancouver election.
1.3 Project Client
This report is being produced for the Election Office, in the City Clerks Department at the City
of Vancouver. The client for this project is Rosemary Hagiwara, Deputy Chief Election Officer,
who is responsible for ensuring that elections are conducted in accordance with the governing
Vancouver Charter and Election By-law (MacKenzie, 2015, p. 3).
Municipal elections in Vancouver are governed by provincial legislation and some changes to
the election process that have the potential to increase participation, including online voting,
extending voting rights to permanent residents, and electoral reform, cannot be implemented
without permission from the Government of British Columbia. Focusing on the election in 2018,
this report limits its recommendations for outreach activities to those that are within the current
jurisdiction of the City of Vancouver to implement.
1.4 Project Objective and Research Question
The objective of this project is to examine political participation and voter engagement through
public outreach campaigns, in order to develop recommendations for a Vancouver-specific
outreach strategy with activities that can be implemented in time for the 2018 civic election on
October 20. The research question addressed in this report is: How can the City of Vancouver
use public outreach to increase citizen engagement and participation in the 2018 civic election?
1.5 Organization of Report
This report starts with a review of academic research on theories and models of voter behaviour.
The literature review is followed by analysis of demographic profiles and social indicators in
different neighbourhoods across the city that are compared to voter turnout in the 2014 election.
The third section of the report includes four jurisdictional scans of election outreach programs
run by government election agencies, including an analysis of patterns of effectiveness. In the
final section, insights from the literature review, demographic analysis, and jurisdictional scans
are used to inform recommendations for the Election Office to include in the 2018 voter outreach
strategy.

6
2.0 Literature Review This literature review is focused on academic studies on the topics of political engagement, voter
behaviour, and factors known to affect voter turnout. The aim is to present a broad overview of
these topics by examining academic literature from industrialized democracies including Canada,
the United States, and the United Kingdom. The review is organized by concepts and theoretical
frameworks of voter behaviour, followed by factors that affect voter behaviour, and finally the
demographic and social determinants of political participation.
Concepts and theories of voter behaviour are broadly classified into rational and non-rational
factors that affect voting. The rational theories of voter behaviour considered are: rational choice,
political efficacy, voter knowledge, and social capital theory. Non-rational factors that affect
voting include norms of citizenship and civic duty, and expressive voting theory.
The section on factors that affect voting looks at studies and surveys of both voters and non-
voters that have identified factors shown to have an influence on voter intention and turnout. The
final section considers studies that have identified correlations between socio-demographic
factors and voting behaviour.
Published journal articles were identified by searching key terms in databases including:
Cambridge University Press; Hathi Trust; JSTOR; Sage Journals; Summon 2.0 database; Taylor
and Francis Online; and Wiley Online Library. The keywords searched for were: political
participation; voter behaviour; voter turnout; voter engagement; political efficacy; political
knowledge; barriers to voting; voter and non-voter characteristics. In addition to journal articles
the literature review also includes information from surveys conducted by Elections Canada and
two studies of voters in Vancouver.
For the literature review the author found a diversity of theories related to voter behaviour, which
position voter decisions as dynamic and influenced by a range of social, demographic, and
political factors. The author did not find one universal model of voter behaviour, but noted a
variety of theories and models that include a spectrum of factors.
2.1 Concepts and Theoretical Frameworks
2.1.1 Rational Choice Model Standard rational choice explanations of voter participation focus on the costs and benefits of
voting to an individual, predicting that a person will decide to vote if the expected benefits from
voting exceed the costs (Downs, 1957). In the standard account of this theory “benefit from
voting equals the utility difference between the preferred candidate and the alternative,
multiplied by the likelihood of being the pivotal vote” (Downs 1957; Tullock 1968; as cited in
Gerber and Rogers, 2009, p. 180).
In a survey of non-voters Pammett and LeDuc (2003) operationalized rational choice theory on
measures of civic duty, competitiveness of the race, personal importance of voting, and the effect
of these factors on how people perceived the value of their vote (p. 22). The survey results

7
showed a correlation between how valuable people felt their vote was and voting, with two thirds
of non-voters reporting feeling that their vote would make “little or no difference in their local
constituency” (p. 41).
Thinking of voters as rational actors underscores the importance of understanding peoples’
orientation to the political system and their political choices. For instance, if a person views all
political parties as being the same, or a race as not competitive between candidates, they are less
likely to vote because both of these orientations will decrease motivation to vote versus taking
part in a competing activity.
2.1.2 Political Efficacy
Political efficacy fits within rational conceptions voter behaviour and as defined by Campbell,
Gurin, & Miller (1954) is "the feeling that individual political action does have, or can have, an
impact upon the political process" (p. 187). The traits associated with political efficacy are
categorized as being internally or externally driven, with the concept of internal efficacy
capturing feelings of being able to affect political change through skills and knowledge and a
sense of duty towards voting (Lambert, Curtis, Kay, & Brown, 1988; Dalton, 2008), while
external efficacy is used to look at how people feel about the responsiveness of the political
system and the likelihood that they will get the results they want from voting (Southwell &
Everest, 1998).
Studies have confirmed that efficacy is a strong predictor of political participation, including
people feeling knowledgeable about the political system, understanding the voting process, and
being able to achieve a desired result by voting (Lambert, Curtis, Kay, & Brown, 1988;
Southwell & Everest, 1998). A study by Pammett and LeDuc (2003) looked at the effects of
political efficacy on voting and found that among Canadian voters in the 2000 federal election
people were “less likely to cast a ballot if they feel they have no influence over government
actions, do not feel voting is an essential civic act, or do not feel the election is competitive
enough to make their votes matter to the outcome” (p. 1).
2.1.3 Voter Knowledge
Voter knowledge also falls under the rational model of voter behaviour, and is an important
dimension of internal efficacy. Voter knowledge is associated with the concept of information
costs and that the more difficult it is for people to obtain information on candidates and how to
vote the less likely they are to participate (Lambert, Curtis, Kay, & Brown, 1988; Stewart,
MacIver, & Young, 2008). An important implication of research related to voter knowledge is
that increasing access to information related to an election can increase participation by lowering
the information cost people incur when preparing to vote.
Studies have found close links between levels of education and voter knowledge (O’Neill, 2006;
Stewart, MacIver, & Young, 2008). In her assessment of why people with higher levels of
education vote more often, O’Niell (2206) notes that “education can provide the skills and
knowledge that lower the costs associated with selecting among candidates in elections, with

8
developing an understanding of political issues and debates, and with assessing the quality of
governance” (p. 7).
2.1.4 Social Capital Theory
As described by Nakhaie (2206) social capital describes a person’s depth of community
involvement, including number of social connections and membership in different organizations
(p. 365), and is considered a rational external factor that influences political decision making.
The theory of social capital is based on the idea that community based social networks reduce the
costs of political participation through the sharing of information about political parties,
candidates, and the electoral process (Smets and Ham, 2013, p. 350).
Social capital theory became of interest to political scholars as a way to look at how changes in
civic participation and commitment to civic life affect voter behaviour, including a study by
Pammett and LeDuc (2003), which showed that voting is connected to community involvement
“to the extent people are declining the opportunities to vote in Canada, they are also illustrating a
lowered commitment to the Canadian community” (p. 44). In a 2006 study, Nakhaie looked at
the influence of social capital on voter turnout in federal, provincial, and municipal elections in
Canada. Using data from the 2001 ‘National Survey of Giving, Volunteering and Participation,
Nakhaie found that social networks help build commitment to democratic values and provide
opportunities to “organize an individual's interests in the political process, and to enhance citizen
involvement in politics through political information, friendly pressures and influence” (p. 364).
Analysis of the survey data also found that the “effects of social capital measures on voter
turnout are more consistent than those of socio-economic statuses and demographics” (p. 382).
Appendix 2 shows the frequency distribution or voting turnout for all variables in Nakhaie’s
study, including religious participation, community rootedness, volunteering and charitable
giving.
The next two sections focus on non-rational theories and concepts related to voter behaviour,
including how changing norms of citizenship are affecting feelings of civic duty and internal
efficacy, and theories of voting as an expression of identity.
2.1.5 Norms of Citizenship & Civic Duty
Drawing on data from the 2005 ‘Citizenship, Involvement, Democracy’ survey, Dalton (2008)
found a positive correlation between older Americans and duty-based citizenship norms that
decreases in younger generations, but is replaced by an increase in engaged citizenship (p. 83).
Analysis of the data showed that people who feel a sense of duty-based citizenship vote because
they feel it is the right thing to do, while people with a more engaged sense of citizenship seek
out activities that provide more direct access to the political system and the ability to be more
self-expressive in communicating their values (p. 82). Instead of voting, politically engaged
youth are more likely to be active in more direct forms of political action, including joining
community groups to address local problems and contacting political representatives directly
through online channels (Dalton, 2008, p. 92).

9
Findings from the Statistics Canada ‘General Social Survey’ (GSS) support Dalton’s conclusion
that a societal shift is taking place between older and younger generations of voters; with
feelings of voting as a civic duty declining among youth who increasingly prefer to express their
political opinions in different ways. Analyzing data from the GSS, Turcotte notes that voter
turnout rates for older Canadians remain high, even among respondents who are less educated
and expressed a low-level of interest in politics (pgs. 14 & 15). Conversely voter turnout was
found to be low among younger Canadians with the same characteristics, supporting the theory
that older voters are more likely to go to the polls out of a sense of civic duty, while younger
generations need to feel informed of the issues and more connected to a sense of political action.
2.1.6 Expressive Voting Theory
In contrast to the theories of voters being motivated by rational self-interest, Rogers, Gerber, and
Fox (2012), explore conceptions of voting “as self-expressive social behavior that is influenced
by events occurring before and after the actual moment of casting a vote” (p. 2). They look at
voting as a self-expressive act that lets people display their political and social values, and note
that it is increasingly common for people to share their identity as a voter through social media
and other public expressions of planning to vote or having voted (p. 14).
An experiment by Bryan, Walton, Rogers, and Dweck (2001), demonstrated that linguistic cues
used in ‘Get Out The Vote’ (GOTV) messages are more effective at increasing turnout when
they strengthen voter identity. Messages that framed voting as an act of personal identity were
found to be more effective than those that talked about voting as a behaviour (p. 1). This finding
affirms that voting is seen by many people as a socially desirable activity that is linked to
internal and external positive self-images “symbolic of a person’s fundamental character - rather
than as simply a behaviour” (p. 1).
2.2 Factors That Affect Voting
This section of the literature review considers the factors that studies have shown affect voter
intention and turnout. Researchers agree that voter intention and participation are affected by a
range of factors that for most people change over the course of their life. There is also agreement
that no single factor on its own is able to explain or predict voter behaviour, and that those who
seek to understand and influence eligible voters, need to consider a variety of causal mechanisms
including demographic, economic and social indicators.
A survey conducted by Elections Canada after the federal election in 2015, found that the top
reasons for not voting among eligible citizens are “not being interested in politics (31.8%),
followed by being too busy (23.5%)” (Elections Canada, 2016, p. 2). The table in Appendix 3
shows the full list of percentages of reasons reported for not voting, broadly categorized under
“everyday life or health reasons (47.9%), political reasons (39.5%), electoral process-related
reasons (7.6%) and all other reasons (5.1%)” (p. 3).
Many of the factors associated with not voting identified in the Elections Canada survey, are also
present in Gludovatz’s (2012) study of self-declared non-voters after the 2011 Vancouver
election. Gludovatz reported that many non-voters in Vancouver are “disengaged in their

10
communities, distrust politics, do not understand the role of municipal government, and are
mistrustful that voting will make a difference or that the government will represent them” (p. 2).
Additionally Gludovatz noted that many voters felt that voting was too complicated because of
the large number of political candidates on the ballot, and lack of information about candidates’
political positions (p. 2).
Findings from an Election Day exit poll of voters in Vancouver following the 2005 election also
highlight the importance of voters being informed of the candidates and the responsibilities of
local government. The exit survey by Stewart, MacIver, and Young (2008), tested the political
knowledge of voters and found that of the 664 respondents, the mean voter correctly identified
74% of listed candidates as incumbents or non-incumbents; and on a test of jurisdictional
knowledge answered by 645 respondents, the mean voter correctly identified 89% (p. 406). The
test results confirmed that Vancouver voters tend to have high levels of political knowledge, and
led the authors’ to hypothesize that “increasing non-voters' political knowledge levels could very
well increase their participation rates” (p. 404).
The exit poll survey by Stewart et al (2008) found that talking with friends or family about
politics and interacting with neighbours increased knowledge of both candidates and the political
system, and that “Education, income, ancestry, home ownership, home language, and place of
birth are shown to be related to both knowledge tests” (p. 407). The results also indicated that
“Attending a community meeting and reading newspapers are related to incumbent-test scores,
while interacting with local government and television viewing habits relate to jurisdiction-test
scores” (p. 407).
2.3 Demographic & Social Determinants of Political Participation
The research reviewed for this report illustrates that socio-demographic factors correlate with
voting behaviour and that age, education, income, place of birth, and time spent in a community
all relate to the likelihood that a person will vote. Socio-demographic findings reported in the
GSS include lower rates of voting among eligible voters in the 25-to-34 age group, people with
lower levels of education, recent immigrants, parents with children under the age of 5, and
Indigneous people (Turcotte, 2015, p. 14). Conversely, the survey showed that “seniors,
university graduates, people whose personal income was higher and who were homeowners, and
people who were married or in a common-law union” were most likely to have voted (Turcotte,
2015, p. 14). Appendix 4 shows the full list of factors associated with the probability of having
voted in the 2013 Canadian federal election.
2.3.1 Age A number of studies indicate that of all the demographic factors age is the most strongly
connected to voter turnout, with participation rates declining down the age spectrum from seniors
to youth. Responses collected as part of the GSS showed that of all the demographic factors “age
group is the factor with the greatest impact on voting” and that in the 2011 federal election “the
proportion of young adults aged 25 to 34 who reported having voted in the last federal election
was 70%, compared with 92% of seniors aged 75 and older (a difference of 22 percentage
points)” (Turcotte, 2015, p. 14).

11
Looking at reasons why voter turnout is lower for youth, Pammett and LeDuc (2003) found that
over a third of youth reported feelings of not being connected with politics. Reasons for feeling
disconnected included: lack of representation; not having enough information on candidates,
political parties and issues; or a clear understanding of how political operations affects their lives
(p. 51).
Beyond generational differences, age is also used to look at voting behaviour during the different
stages of a person’s life cycle. Research by O’Neill (2006) found that politics often becomes
more important to people at different stages in their life and that significant events like starting a
family and purchasing a home increase the likelihood voting as people become more invested in
their local community (p. 13).
2.3.2 Education
Studies have confirmed the existence of a link between education and voting. In the 2011 federal
election, the voting rate among people with a university degree was “78%, compared with rates
of 60% or lower among those with a high school education or less” (Uppal & LaRochelle-Côté ,
2015, Age, education and family status). The chart in Appendix 5, shows that having a lower
level of education is correlated with lower rates of voting for people of all ages (Turcotte, 2015,
p. 14).
In her consideration of the importance of education to political participation, O’Neill (2006)
writes that education increases both the cognitive skills and affective determinants that impact
the likelihood a person will become a voter, with benefits that include increasing “one’s sense of
civic duty but also results in higher levels of political efficacy and political interest, which
increase the desire to participate” (p. i). The flip side of higher levels of education increasing the
accessibility of politics and voting, is that marginalized populations who have less access to
education because of socio-economic inequalities, also experience a political information
inequality that can limit their participation (Nakhaie, 2006, p. 367).
2.3.3 Economic well-being
A number of factors can be considered in the category of economic well-being including
employment, income, and homeownership. A Statistics Canada study on factors associated with
voting shows that employed people are more likely to vote than people who are unemployed and
suggests that higher amounts of household wealth positively correlate with voting rates (Uppal &
LaRochelle-Côté , 2015, Economic well-being).
Uppal & LaRochelle-Côté (2015) found that homeownership and voting are positively
correlated, with 71% turnout for home owners versus 54% for renters, and suggests that home
ownership can be used as a proxy indicator for household wealth (Economic well-being).
Beyond being a source of significant wealth for many Canadians, homeownership has also been
shown to correlate with higher turnout because people who own their homes are more likely than
renters to be on the registered voters list and receive important voter information by mail (Geys,
2005, p. 644). In addition Geys found that homeowners tend to be more rooted in their

12
communities and have lower information costs due to their established social networks, and
familiarity with local issues and candidates (p. 644).
2.3.4 Family Composition
Studies by Statistics Canada have shown that the presence of young children can negatively
affect voter turnout among parents who cite busy schedules as a reason for not voting (Uppal &
LaRochelle-Côté, 2015, Age, education and family status). Analysis of the data also showed that
voter rates were the most impacted for single parents, as only 36% of single parents with
children under five years of age voted, compared to 60% of couples with children in the same
age range (Age, education and family status). Another study on the effects of children on voting
showed that while people with children are likely to have an increased awareness of social needs
and sense of civic duty, they also have less free time to engage in politics and vote (Denver,
2008; Solt, 2008; as cited in Smets and Ham, 2013, p. 350).
2.3.5 Citizenship
Immigration status has been shown to affect voter participation, with recent immigrants less
likely to vote than more established immigrants and people who are born in Canada. Uppal and
LaRochelle-Côté (2015) reported that voting rates in the 2011 Canadian federal election were
“51% for recent immigrants, 66% for more established immigrants and 67% for Canadian-born”
(Immigration status). Reasons for recent immigrants voting less are often attributed to
differences in political culture, including coming from a country with a non-democratic system
of government and the high information costs of learning about a new political system
(Immigration status). As Gludovatz (2012) points out, new citizens “have to work harder to
obtain and understand municipal political knowledge, and as such have lower-levels of trust in
themselves as citizens to make informed voting decisions” (p. 47).
Research by Black (2001) found that voter turnout is lowest among immigrants who recently
arrived and that length of time spent in a new country can be a more important factor affecting
voter turnout than ethnicity (Immigrants and minorities as voters). This finding is explained by
the fact that social capital and political knowledge are both acquired over time for new
immigrants, as they work with settlement agencies and integrate into communities.
2.4 Literature Review Summary
In a meta-analysis of individual-level research on voter turnout, Smets and Ham (2013)
recognize the “fact that so many different theoretical explanations exist and have found empirical
support points to the possibility that multiple causal mechanisms explain turnout and that
different causal mechanisms may be prominent for different voters in different contexts” (p.
345). The range of theories and variables shown to affect voter behaviour in this literature review
supports the case for political participation being a function of a variety of factors, including
demographic, socio-economic status and life cycle explanations.
Some of the theories examined in the literature review position voting as a rational choice
(Tullock 1968; Southwell & Everest, 1998; Stewart, MacIver, & Young, 2008), while other
13
researchers went beyond rational considerations of self-interest to consider the effects of
emotion, identity, and social desirability (Dalton, 2008; Rogers, Gerber, and Fox, 2012). In
addition to individual attributes, voter behaviour is influenced by events taking place within the
electoral context, including the salience of issues, closeness of the competition, and the
presentation of a clear difference of choice between candidates (Pammett and LeDuc, 2003).
It is the author’s conclusion that outreach strategies intended to increase voter intention and
political participation need to account for the various motivations and factors, both rational and
non-rational, identified in the literature review. The main concept from the literature that
influenced the author’s approach to researching voter outreach is the need to account for the
demographic and socioeconomic determinants that influence behaviours and decisions related to
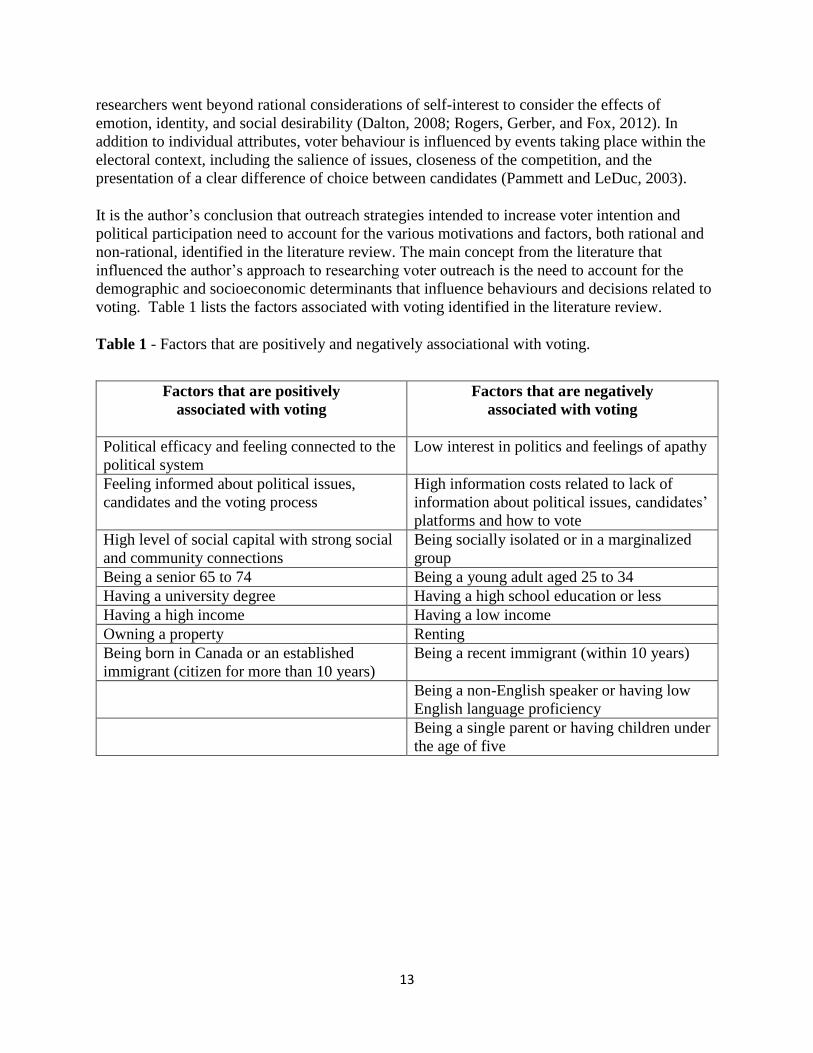
voting. Table 1 lists the factors associated with voting identified in the literature review.
Table 1 - Factors that are positively and negatively associational with voting.
Factors that are positively
associated with voting
Factors that are negatively
associated with voting
Political efficacy and feeling connected to the
political system
Low interest in politics and feelings of apathy
Feeling informed about political issues,
candidates and the voting process
High information costs related to lack of
information about political issues, candidates’
platforms and how to vote
High level of social capital with strong social
and community connections
Being socially isolated or in a marginalized
group
Being a senior 65 to 74 Being a young adult aged 25 to 34
Having a university degree Having a high school education or less
Having a high income Having a low income
Owning a property Renting
Being born in Canada or an established
immigrant (citizen for more than 10 years)
Being a recent immigrant (within 10 years)
Being a non-English speaker or having low
English language proficiency
Being a single parent or having children under
the age of five

14
3.0 Methodology and Methods
The methodology for this project is applied research to identify recommendations for increasing
political engagement and participation in the 2018 City of Vancouver election. Methods used to
identify and develop recommendations include a literature review, analysis of demographic data,
and jurisdictional scans of four outreach programs run by government election agencies. The
literature review identified key theories of voter behaviour and factors that are known to affect
voting. Information in the literature review was used to develop the list of questions used during
interviews for the jurisdictional scans of outreach programs, as well as analysis of the outreach
programs themselves. The objectives of the research methodology and methods are to identify
smart practices and recommendations for the City of Vancouver’s 2018 election outreach plan by
collecting information on current theories of voter participation and examples of outreach
programs. The research done in this report meets the appropriate standards of ethics as outlined
by the University of Victoria Research Regulations Involving Human Participants and received
approval certificate 17-185, on June 12, 2017.
3.1 Methodology
The purpose of this report is applied research with a focus on contributing to theories to add
insight and formulate problem-solving interventions (Patton, 2015, p. 250). The theoretical
approach guiding the research is pragmatism (Patton, 2015, p. 152), as the researcher is seeking
practical and useful answers that can provide direction for increasing political participation
during the 2018 City of Vancouver election.
In this report smart practices are defined as “selective observation of a set of exemplars across
different contexts in order to derive more generalizable principles and theories of management”
(Overman & Boyd, 1994, p. 69). Smart practices are evaluated to look at their adaptability and
relevance in the context of achieving the City of Vancouver’s election outreach goals (Manela &
Moxley, 2008, p. 12).
3.2 Methods
Research for this report was conducted in three phases. The author started by conducting a
literature review of key theories and models of voter behaviour that are used to inform election
outreach practices. In the second phase the author gathered data on key demographics and social
indicators in Vancouver’s 23 local areas that were compared to voter turnout by area in the 2014
election to identify correlations. Demographic data was also used to understand how the smart
practices identified in the literature review and jurisdictional scans can be applied to work in
Vancouver.
The final research phase involved interviews with election outreach managers in government
election agencies, and analysis of outreach program documentation to write four jurisdictional
scans. The objective of the interviews and document analysis was to obtain information on
current practices in election outreach planning, operation, and evaluation to identify examples of
smart practices.

15
3.2.1 Research Participants
The election outreach programs run by Elections Canada, Elections BC, City of Toronto, and
City of San Francisco were selected to study as jurisdictional scans using instrumental-use
multiple-case sampling (Patton, 2015, p. 528). These electoral agencies were selected to be part
of the jurisdictional scan based on their having an active and documented election outreach
program; having experienced an increase in voter participation in a recent election; and serving a
diverse electorate that is demographically similar to Vancouver. Before selecting the four
jurisdictions, the author did online research of major cities in Canada to look at available
information related to election outreach, as well as some large cities in the United States before
deciding on the four jurisdictions in the report.
Each participant was emailed a general overview of the project and invitation to participate as
seen in Appendix 6. Participants who responded to the invitation were sent a consent form to
sign, that included a waiver of confidentiality to have responses attributed to themselves and
their employer.
3.2.2 Interview Process
Participants were sent the set of interview questions in Appendix 7, in advance of the phone
interview. The questions were used to guide semi-structured interviews and obtain information
related to the planning, operation, and evaluation of each organization’s outreach program. The
author used a semi-structured interview format to facilitate a guided discussion on the research
topics, while also allowing for the inclusion of open-ended and probing questions (Walliman,
2005, p. 285). The semi-structured interview format worked well for generating comparable
qualitative data, while also giving the author discretion to explore topics not included in the
initial list of questions.
The author took hand-written notes during each interview and participants were sent a copy of
the comments attributed to them in the jurisdictional studies to review in order to ensure
accuracy. Participants requested minor revisions that were made in all four studies.
3.2.3 Data Analysis
Findings from the literature review on political engagement, voter behaviour, and factors that
affect voter turnout were used to inform the interview questions used during the jurisdictional
scan. Additionally the author looked for parallels between findings in the literature review and
the outreach strategies and activities identified in the jurisdictional scans to confirm that the
outreach recommendations are supported by academic studies of voter behaviour.
Data from Statistics Canada on key demographics and social indicators in Vancouver’s 23 local
areas were compared to voter turnout by area in the 2014 election to identify correlations. This
data was used to identify general trends between demographics and social indicators, and voter
turnout. Acknowledging the limitation of not being able to isolate the effects of a single
demographic or social indicator from other characteristics present in local areas, the author

16
linked findings to complimentary results found in the literature review to strengthen the validity
of identified trends.
Content analysis was conducted on the jurisdictional scans to look for patterns of effectiveness
and outreach activities were compared to generate cross-case patterns and findings (Patton, 2015,
p. 539). Outreach programs and activities were considered successful based on their taking place
during an election in which voter participation increased and through confirmation of their
perceived effectiveness from outreach managers. The identification of patterns across
jurisdictions is used to support recommendations for the City’s outreach strategy.
3.3 Limitations and Delimitations
The main limitation of this study is low external validity from the use of purposeful sampling
strategies and small sample sizes. There are also many factors that are known to influence voter
turnout and in many cases it was not possible to isolate cause and effect relationships between
demographics or social indicators and turnout, or specific outreach activity and turnout. In
acknowledgement of this limitation, recommendations are provided with in-depth data to
consider their effectiveness for use in Vancouver.

17
4.0 Demographic Profiles of Vancouver Neighbourhoods and Voters
To be effective public engagement and outreach strategies need to be crafted with an
understanding of the populations they are intending to engage. Understanding the unique
attributes of the people who live in Vancouver’s different neighbourhoods, and looking at data
on past voting behavior, is foundational to designing an election outreach plan that will
effectively deliver information to people across the city’s diverse populations.
This section considers demographic information, social indicators, and voter data from the 2014
election to consider how smart practices from the literature review and jurisdictional scans can
be adapted to work in the Vancouver context. Basing recommendations for the outreach program
on demographic data aligns with the election office’s departmental goal of being strategic and
data driven.
In this section the author identifies correlations between prominent demographic characteristics
of local areas and voter turnout. A limitation of this method is that the effect of a single
demographic characteristic on turnout cannot be considered in isolation from other
characteristics in the local area, so it is not possible to say with certainty that there is a cause and
effect relationship. Acknowledging this limitation, when a correlation between a local area
demographic characteristic and voter turnout is noted, the author also links the finding to results
from studies in the literature review to strengthen the case that there is a correlation between the
variables.
4.1 Vancouver Demographics and Voter Turnout
4.1.1 Voter Turnout
Appendix 8 shows the percentage of registered voters, by local area, who cast their ballot in the
2014 Vancouver election. The turnout by local areas shows generally higher rates of
participation in neighborhoods on the west side of the city. Four of the top five neighbourhoods
with the highest rates of voter turnout are on the west side, while the two neighbourhoods with
the lowest turnout are on the east side. Although turnout tended to be higher on the west side of
the city than the east side, there were some exceptions like the west side neighbourhoods of
Oakridge and Marpole, which both had low rates of voter participation.
Dunbar-Southlands had the highest turnout at 57.4%, followed by West Point Grey and Riley
Park. The lowest voter turnout was Downtown with 34.1% voter turnout, followed by Renfrew-
Collingwood and Victoria-Fraserview.
4.1.2 Age
Appendix 9 shows median age distributions across Vancouver neighbourhoods ranging from a
low of 36 to a high of 49 years-of-age. Overall the population in Vancouver is aging with the
highest median ages by neighbourhood in Strathcona, Oakridge, Shaughnessy, Arbutus-Ridge,
and Kerrisdale (City of Vancouver, 2015a, p. 11). Downtown and Mount Pleasant have the

18
youngest median ages, with half of their residents under 36, followed by Kitsilano, the West
End, and Sunset.
The chart of voter turnout by age in Appendix 10 shows that voter participation in 2014 was
consistently higher among older voters. Adults aged 45-54 cast the most ballots while people 65
– 74 had the highest voter turnout at 58.4%. Youth aged 18-24 cast the smallest number of
ballots, while people in the 25-34 age group had the lowest voter turnout at 31%. Another
interesting finding in the data is that while 25-34 year-olds had the lowest rate of voter turnout,
they also had the highest percentage of registered voters. These findings related to voter turnout
and age are consistent with responses collected as part of the GSS survey, which found that of all
demographic factors age group has greatest impact on voting (Turcotte, 2015, p. 14).
4.1.3 Indigenous People in Vancouver
Vancouver is located on the unceded homelands of the Musqueam, Squamish, and Tsleil-
Waututh First Nations, and the city has a sizable urban Indigenous population comprised of
people with diverse identities. Appendix 11 shows that in 2011, the neighbourhoods with
greatest estimates of Indigenous people, were found in Dunbar-Southlands (where the
Musqueam Indian Band reserve land is located), Grandview-Woodland, Strathcona, the
Downtown Eastside, and Mount Pleasant (City of Vancouver, 2015a, p. 21). In 2011 there was
an estimated total of 12,000 Indigenous people in Vancouver and 775 living on the Musqueam
reserve land (p. 21).
A comparison of areas in Vancouver that have high estimates of Indigenous persons, with the
map of voter turnout shows a correlation between areas with high proportions of Indigenous
persons and lower turnout. This correlation was strongest in the Downtown and Strathcona
neighbourhoods. While there are numerous other demographic and socioeconomic factors that
are relevant to turnout in these areas, the existence of a correlation is supported by the results of
the GSS, which reported that lower voting rates were observed for Indigenous people in
Canadian federal elections (Turcotte, 2015, p. 14).
4.1.4 Immigration Status
Of the municipalities in Metro Vancouver in 2011, Vancouver was the city with the greatest total
number of recent immigrants. In 2011, approximately 42,000 people living in Vancouver had
arrived in Canada within the past five years (City of Vancouver, 2015a, p. 25). Appendix 12
shows the neighbourhoods with the highest concentrations of new immigrants (arrived within the
last five years), with the highest percentages in Arbutus Ridge, Kerrisdale, and Sunset. A
comparison of these neighbourhoods to the map of voter turnout in the 2014 election shows a
correlation between higher proportions of recent immigrants in a neighbourhood and lower voter
turnout, including Arbutus Ridge, Sunset, Downtown, Oakridge, and Marpole.
The observation of a correlation between the number of recent immigrants in a neighbourhood
and turnout is supported by findings from research by Uppal and LaRochelle-Côté (2015), which
found that immigration status affects voter participation, with recent immigrants less likely to
vote than more established immigrants (Immigration status).

19
4.1.5 Language
A diversity of languages are spoken in Vancouver with “94 individual mother tongues, and 93
individual languages mainly or regularly spoken at home” (City of Vancouver, 2015a, p. 27).
Appendix 13 shows the top ten languages spoken at home in Vancouver.
Of the 15 largest cities in Canada, in 2011 the largest proportion of residents unable to converse
in English or French were residents of Vancouver. Approximately 8% (46,000) residents did not
speak English or French, with the highest rate of non-ability in official languages among seniors
(City of Vancouver, 2015a, p. 28). Appendix 14 shows the percentage of population without
knowledge of English or French by local area, with the highest concentrations noted on the east
side of Vancouver in Renfrew-Collingwood, Kensington-Cedar Cottage, Victoria-Fraserview,
and Hastings-Sunrise (City of Vancouver, 2015a, p. 29).
When looked at in comparison to the map of voter turnout, there is a correlation between lower
rates of voter turnout and areas that have higher percentages of residents without knowledge of
English or French, particularly in the areas of Strathcona, Victoria-Fraserview, and Renfrew-
Collingwood. This finding fits with the results of a survey of Vancouver voters by Stewart,
MacIver, and Young (2008), which found a statistical relationship between people who do not
speak English having lower knowledge of both candidates and the political system than people
who do speak English (p. 407).
4.1.6 Income and Education
Compared to other large Canadian cities, Vancouver has the highest rate of people with low
incomes at 20% of tax filers in 2012 (City of Vancouver, 2015b, p. 9). In 2010, 15% of
individuals in Vancouver fell into the bottom 10% of Canada’s income distribution, while 14%
were in the top 10% (City of Vancouver, 2015b, p. 7). While the highest concentrations of
individuals with incomes in the top 10%, and people with post-secondary degrees, live on the
west side of the city, the map in Appendix 15 shows that people in the bottom 10% of
nationwide incomes live in neighbourhoods across the city and are not just confined to the east
side.
An overall correlation was observed between areas with higher incomes and people with post-
secondary education, and higher voter turnout as seen in West Point Grey, Dunbar-Southlands,
and Kerrisdale. In comparison, Strathcona, Downtown, and Oakridge, the three neighbourhoods
with the highest proportions of people in the bottom 10% of Canada-wide family incomes, had
the lowest rates of voter turnout in the city. These findings are consistent with research by Uppal
& LaRochelle-Côté (2015) and Turcotte (2015) that confirmed a correlation between lower
levels of income and voting.
4.1.7 Social Connections and Civic Engagement
A 2011 report by the Organization for Economic Co-operation and Development found that in
Canada there are “significant differences in the scope and strength of social support networks
between different demographic and socio-economic groups” and that lower-income groups, older

20
persons, and people with less education tended to report weaker social support networks and
were at higher risk of social isolation (City of Vancouver, 2015c, p. 3). A survey by the
Vancouver Foundation in 2012, found that in Metro Vancouver “groups reporting the weakest
level of social connectivity were people aged 25-34, newcomers and people living in high-rise
apartments” (City of Vancouver, 2015c, p. 3).
Additionally, Vancouver has the third highest proportion of persons living alone among large
Canadian Cities at 17% in 2011 (City of Vancouver, 2015a, p. 18). As shown in Appendix 16 the
largest concentrations of persons living alone in Vancouver are in areas near the downtown core,
with the highest percentages in the West End, Downtown, Strathcona, and Fairview (City of
Vancouver, 2015a, p. 18). When analyzed in comparison to the map of voter turnout, there is a
correlation between areas with higher percentages of persons living alone and lower rates of
voter participation, including the West End, Downtown, Strathcona, and Marpole. The
observation of this correlation is supported by the findings of a study by Nickerson (2008),
which reported voting is contagious among cohabitants and that people living alone are less
likely to have a plan to vote (p. 54).
4.1.8 Voter Registration
The graph in Appendix 17 shows the neighbourhoods with the highest number of registrations at
polling stations on Election Day. When compared with the map showing the proportion of
people renting in different areas of the city in Appendix 18, a correlation is observed between
neighbourhoods with higher proportions of renters having more unregistered voters than areas
with more homeowners. The observation of this correlation was strongest in the areas of
Downtown, West End, Mount Pleasant, Grandview-Woodland, and Fairview. Finding this
correlation fits with the research by Geys (2005), which found that homeownership is positively
correlated with voting and that people who own their homes are more likely than renters to be on
the registered voters list and receive important voter information by mail (p. 644).
4.2 Summary of Data Analysis
When voter turnout is compared with the demographic data and social indicators collected for
local areas around Vancouver, correlations can be observed between higher rates of voter turnout
and neighbourhoods with older populations, as well as areas with higher household incomes and
education levels. Turnout tended to be lower in neighbourhoods with higher proportions of
young adults (18-34); Indigenous peoples; new citizens; people who do not speak English;
people who have low incomes; renters; and people who live alone.
With turnout in neighbourhoods across Vancouver ranging from a low of 34.1% to a high of
57.4%, election staff will need to increase participation in all neighbourhoods in order to achieve
the turnout goal of 60% by 2025. The findings from this demographic and socioeconomic
analysis of voters in Vancouver has implications for both where and how election outreach
should take place that are discussed in depth in Section 6.0.

21
5.0 Findings: Voter Engagement and Outreach Jurisdictional Scans
Research for jurisdictional scans was conducted to explore how other government election
offices (municipally, provincially, and federally) engage electors in their jurisdictions. The four
jurisdictional scans below look at the planning, operations and evaluation of outreach programs
run by Elections Canada, Province of BC, City of Toronto, and City of San Francisco.
Data included in the jurisdictional scans was gathered through interviews with outreach program
managers and reviewing program reports and other documentation.
5.1 Elections Canada - Voter Outreach in the 42nd General Election
Elections Canada, is an independent, non-partisan agency that reports directly to Parliament.
Outreach is part of the organization’s mandate including conducting public information
campaigns on voter registration and voting; and running education programs for students on the
electoral process (Our mission, mandate, values, n.d.).
Outreach and electoral engagement are central to the work of Elections Canada, providing
residents, including 25,939,742 eligible voters, with “electoral education and information
activities so they can make informed decisions about their engagement in the electoral process”
and working to “improve the electoral framework by consulting and sharing electoral practices
with other stakeholders” (Office of the Chief Electoral Officer, 2016a, p. 15).
5.1.1 Outreach Planning
Elections Canada operates under the Fair Elections Act, which restricts staff from doing any
outreach activities designed to address voter motivations. Under the statute, the activities of
outreach staff are restricted to informing voters, addressing administrative and access barriers,
and educating students on broader issues related to the importance of voting (L. Drouillard,
personal communication, July 28, 2017). Working within these parameters the main goal of
outreach is to inform all Canadians about the election, including when and where to vote,
through the Electoral Reminder Program (ERP) (L. Drouillard, personal communication, July 28,
2017). See Appendix 19 for a summary of Electoral Reminder Program activities.
Target demographics of underrepresented voters were identified by researching academic
studies; reviewing administrative data collected from voters, including riding and census data
mapping; and post-election surveys of voters and non-voters to get insights into the experiences
of different demographics (L. Drouillard, personal communication, July 28, 2017). In the Survey
of Electors Following the 42nd General Election, Elections Canada used an oversampling method
to understand the experiences of people in groups that are historically underrepresented including
young adults, Indigenous electors, people born outside of Canada, and people with disabilities
(Hughes, 2016, p. 1).
In 2015, Elections Canada chose to use a more streamlined set of outreach materials with
universal messages in order to focus more on translation and formatting. Community relations
officers (CROs), were relied on to deliver more targeted messaging to people who are less

22
knowledgeable of the electoral process; less likely to have the identification required to vote; and
less likely to be registered and receive information by mail (Office of the Chief Electoral Officer,
2016b, p. 37). Planning for targeted outreach involved identifying community organizations and
the populations they serve in order to let them know about special services of interest to their
members, like talking to organizations representing persons with disabilities about the
availability of accessible voting tools and services (L. Drouillard, personal communication, July
28, 2017).
The only groups that had national messages targeted to them in 2015 were students and First
Nations. Students received information on how to vote, including the rules for voting when
living outside of the riding they are registered in. Materials for students included the “Get Ready
to Vote” and “Four Different Ways to Vote” collateral pieces shown in Appendixes 20 and 21.
Indigenous electors received targeted messages about changes to voter identification
requirements that made it more difficult for people prove their address (L. Drouillard, personal
communication, July 28, 2017).
5.1.2 Program Operation
Head office staff began doing outreach for the election in January, 2015, contacting partner
organizations and finalizing service contracts (L. Drouillard, personal communication, July 28,
2017). At the national level staff focused on developing partnerships with umbrella organizations
that are able to share information with community groups across Canada (L. Drouillard, personal
communication, July 28, 2017).
The outreach program was supported by 60 groups, including other departments that shared
election materials. Starting in spring 2015, partners “helped to distribute more than 11 million
hardcopy information products and held 105 events to inform target groups on when, where and
the ways to register and vote” (Office of the Chief Electoral Officer, 2016b, p. 39). Within the
Government of Canada the Citizenship and Immigration Office supported outreach by
distributing over 10,000 information kits to new Canadians at Citizenship Ceremonies, while
Service Canada put out postcards and posters, and added digital banners to their screens at
service points (L. Drouillard, personal communication, July 28, 2017).
Staff also managed paid contracts with the organizations below to provide outreach services
including distributing materials and giving presentations:
Samara Vote PopUp to engage new voters using a simulated voting experience to
demystify the process;
Assembly of First Nations to research community specific barriers and distribute relevant
information to band administrators;
Canadian Ethnocultural Council to distribute information to cultural organizations across
Canada in multiple languages;
Canadian National Institute For The Blind to distribute informational materials in braille
and other formats; and

23
ABC Life Literacy to create plain language materials distributed to persons with low
levels of literacy (L. Drouillard, personal communication, July 28, 2017).
Key election messages were communicated in phases to support important activities in the
election calendar. Key messages included:
Phase 1 – Registration (September 1 to October 1);
Phase 2 – Receipt of voter information cards (October 2 to 6);
Phase 3 – Advance polls (October 7 to 12); and
Phase 4 – Election day (October 13 to 19) [(Office of the Chief Electoral Officer, 2016b,
p. 42].
Using the message calendar allowed Elections Canada staff and partner organizations to
coordinate and focus communications on important actions, instead of trying to deliver all of the
information at once. Key messages were communicated through advertisements in traditional
media, on social media, in Electoral Reminder Program materials, and through 60 partner
organizations.
Elections Canada increased the amount of information available online in 2015, with the use of
videos and infographics; providing accessibility information on polling stations; and a new voter
lookup and registration tool (L. Drouillard, personal communication, July 28, 2017). Through a
partnership with Facebook, Canadians of voting age received a special message in their
newsfeeds on Election Day encouraging them to declare their status as a voter and get more
information by being redirected to the Elections Canada website. During the campaign 814, 373
Facebook users clicked the “I’m a Voter” link and over 150, 000 people clicked for more
information (Office of the Chief Electoral Officer, 2016b, p. 40).
At the electoral district level CROs focused on making connections with seniors groups, long-
term care facilities, and organizations serving homeless persons. CROs were responsible for
connecting people who experience high-barriers to voting directly with voter services like mobile
polls, and focused their outreach on people who are less likely to receive information about
voting from print or online sources (L. Drouillard, personal communication, July 28, 2017).
CROs were active during a three week period leading up to the election setting up kiosks;
making presentations; hosting discussion groups; distributing informational materials; and
liaising with local organizations and facilities. In total, 1,201 CROs were hired to do outreach
and equipped with tool kits that included informational materials, PowerPoint presentations,
Electoral Reminder Program materials, t-shirts, and pens (Office of the Chief Electoral Officer,
2016, p. 39).
5.1.3 Targeted outreach example: Facilitating First Nation Information on Voting
Elections Canada partnered with the Assembly of First Nations (AFN) to inform their members
about the election and conduct research to fill information gaps (Assembly of First Nations,
2016, p. 2). Research shows that Indigenous people have a lower rate of voter participation than

24
the overall Canadian population (44% compared to 61.4% between 2004 and 2011), and
qualitative data gathered by the AFN “suggests that numerous barriers contribute to this
outcome, including a lack of culturally relevant information (e.g., political and language
barriers), the need to prove residency and identification, and a lack of information regarding
Elections Canada programs and services” (p. 4).
In addition to previously identified barriers, identification requirements for voters changed in
2014. The changes prohibited the use of voter information cards (VIC) as a piece of
identification, and electors could no longer be vouched for if they had no identification (Office of
the Chief Electoral Officer, 2016b, p. 29). These changes made it imperative for Elections
Canada to ensure that information about the new requirements was being received in Indigenous
communities, as the attestation process that replaced vouching and the exclusion of the VIC as a
piece of identification made it more difficult for many Indigenous electors, especially people
living on reserve, to prove their civic address (Assembly of First Nations, 2016, p. 9).
Outreach activities and key messages developed specifically for Indigenous electors and
delivered through AFN communication channels and community networks included:
fact sheets highlighting critical information, including changes to the identification and
vouching rules and the availability of the Letter of Confirmation of Residence (Assembly
of First Nations, 2016, p. 11);
YouTube “how to” video for both electors and band administrators (Assembly of First
Nations, 2016, p. 10);
in-person outreach to deliver key messages, listen to concerns, and let people know they
can request a polling station for their community (Assembly of First Nations, 2016, p.
11);
hiring 285 Indigenous elders and youth to work at polling places to explain the voting
process, answer questions, and provide interpretation services (Office of the Chief
Electoral Officer, 2016b, p.29); and
pre and post-election surveys used to measure the impacts of AFN and Elections Canada
outreach efforts, and provide data on First Nation experiences during elections (Assembly
of First Nations, 2016, p. 16).
Survey results indicate the outreach campaign with AFN was successful, with 74% of Indigenous
respondents indicating they felt very knowledgeable of where and when to vote, while only 1%
considered themselves to be not knowledgeable (Assembly of First Nations, 2016, p. 28). These
results compare favourably to results from previous elections in which 41% of respondents
considered themselves very knowledgeable, while 10% rated themselves as not knowledgeable
(p. 28).
5.1.4 Targeted Outreach Example: Engaging First Time Voters with Samara
Elections Canada collaborated with Samara Canada on the Vote PopUp program targeted to first-
time voters. A downloadable Vote PopUp kit was available online so community groups could

25
recreate a polling place to foster interest in the election and demystify the voting process (Beebe
& Marti, 2015, p. 4). Elections Canada supplied ballot boxes, voting screens, and informational
materials so community organizations could create the experience of voting at a polling place
and give out accurate information (p. 4).
While Vote PopUp addressed the mechanics of voting, by getting participants to cast ballots,
staff also engaged participants in discussions about the issues that matter to them and helped
connect their interests and concerns to the electoral process to make the experience meaningful
(Beebe & Marti, 2015, p. 4).
In the 104 days the tool kit was available before the election, it was downloaded by 456 people
in 76 towns and cities across the country. Over 300 community groups were involved in Vote
PopUp activities in varied locations including homeless shelters, settlement agencies, mobile
libraries, and farmers’ markets (Office of the Chief Electoral Officer, 2016b, p. 39).
5.1.5 Program Assessment
Outreach activities were part of the larger ERP program, which was evaluated using surveys
measuring changes in knowledge of the election, how to vote, and perceptions of trust in
Elections Canada as the main source of information (L. Drouillard, personal communication,
July 28, 2017).
The list below shows the frequency of activities undertaken as part of the ERP:
partnerships with 59 civic and community organizations;
1,201 community relations officers worked with youth, seniors, Indigenous Canadians,
homeless person and ethnocultural communities;
more than 11 million hardcopy information products distributed;
105 events to inform target groups on when, where and the ways to register and vote;
voter identification requirements and voter’s guide published online in 31 heritage and 12
Indigenous languages; and
targeted multimedia advertising including 489 digital screens on university campuses and
reaching ethnocultural audiences through 100 print publications in 30 different languages
(Office of the Chief Electoral Officer, 2016b, pgs 38, 39, 41, & 42).
The ERP evaluation found that elector knowledge of registration and the voting process
increased significantly over the course of the election period with 44% of respondents reporting
feeling well informed about where and when to vote just after the election was called, which
increased to 86% in the post-election survey (Office of the Chief Electoral Officer, 2016c, p. 12).
Measures of knowledge regarding the various ways to vote showed that 62% of respondents felt
well informed at the start of the ERP program and that by the end of the campaign this
proportion increased to 73% (p. 12). Evaluation results also showed that electors’ perception of
Elections Canada as a key source of trusted information increased during the campaign from
26
34% to 45%, which also marks an increase over the 30% observed following the 41st general
election (p. 14).
17,711,983 people voted in the 42nd general election on October 19, 2015, resulting in the
highest voter turnout (68.3% of eligible voters) in more than 20 years (Office of the Chief
Electoral Officer, 2016a, p. 1). While Elections Canada reports voter turnout for each election it
is not a performance indicator for the outreach program, as the organization’s mandate is to
inform electors about voting.
Evaluation reports were also conducted with partner organizations. A key piece of feedback
received from partners was the importance of communicating registration and voter information
separately to avoid confusion and the recommendation to start outreach earlier (L. Drouillard,
personal communication, July 28, 2017).
5.2 Elections BC - Voter Outreach in the 2017 Provincial Election
Elections BC is the independent, non-partisan Office of the Legislature responsible for
administering electoral processes across British Columbia and managing public outreach. In the
lead-up to the Provincial General Election on May 9, 2017, Elections BC staff implemented a
strategic outreach program designed to remove administrative barriers to electoral participation
for all eligible voters, while also targeting outreach to historically underrepresented groups
whose members face more barriers to voting.
The outreach program was designed to remove barriers for the 3.4 million eligible voters in BC,
by encouraging people to register and update their registration; promoting election employment
opportunities for individuals across British Columbia, especially youth; and raising awareness of
voting dates, locations, and identification requirements (M. Callas, personal communication,
June 29, 2017).
5.2.1 Outreach Planning
The planning and execution of Elections BC’s “Strategic Outreach and Public Education Plan”,
was a collaboration between the departments of Communications, Executive Services, Human
Resources, and Electoral Operations as shown in Appendix 22. Communications staff supported
outreach through the production of informational materials, as well as raising awareness of the
election though traditional advertising channels and social media.
HQ Outreach was responsible for developing and managing the overall outreach strategy, the
new Youth at the Booth program, and developing partnerships with community organizations.
An outreach coordinator was hired in June 2016, to develop a formal strategy that “identifies
target groups and organizations, how they are connected to individuals with identified barriers to
electoral participation, and specific engagement strategies” (A. Foster, personal communication,
May 9, 2016). Through research it was determined that targeted outreach efforts would be
focused on reaching people in the populations below, through partnerships with service providers
and educational presentations:

27
post-secondary students;
youth (18-24 years old);
new Canadians;
individuals who are homeless;
Indigenous people; and
people with disabilities (A. Foster, personal communication, May 8, 2017).
During the planning phase the outreach coordinator organized meetings with stakeholders to
discuss barriers to voting, how to best deliver information, and issues of importance to
community members. Feedback from stakeholder meetings was used in the development of
informational materials for outreach to target populations based on their needs and identified
barriers to voting. Examples of information being tailored to specific groups include focusing
communications to people experiencing homelessness on registration and identification
requirements; informing new Canadians that voter registration and voting materials are available
in 16 languages; and promoting voter registration and the Youth at the Booth employment
program at high schools (M. Callas, personal communication, June 29, 2017). Elections BC staff
also helped create resources for people with low literacy skills that were made available in The
Westcoast Reader newspaper for adult learners of English.
District electoral officers (DEOs) working in Electoral Operations contributed to outreach
activities at the local level by preparing profiles of their electoral districts. DEOs worked from
the bottom up in communities collecting information used to complete ED Profile Work
Packages that included:
general description of the electoral district, including geography, demographics,
population; remote locations, and high mobility areas;
inventory of post-secondary institutions, First Nation communities and Friendship
Centres, ethnocultural communities, homeless facilities, and site-based voting areas; and
accessibility review of voting places for advance, general, or mobile voting (M. Callas,
personal communication, July 5, 2017).
The information collected by the outreach coordinator and DEOs was used to help determine
how to strategically provide electoral information, registration services, and voting opportunities
to different groups across every district. The information also informed background sheets
containing details about organizations or communities and their previous contact with Elections
BC. The background sheets were provided to senior staff to review before attending meetings or
making presentations at community events; a practice that helped strengthen relationships (A.
Foster, personal communication, June 29, 2017).
5.2.2 Program Operations
Elections BC ran two major Communications outreach campaigns leading up to Election Day.
Outreach started with a voter registration drive using the “I Register” theme, and was followed

28
by the “I Vote” general election awareness campaign. Activities to support both campaigns were
targeted to a universal audience of all eligible voters, with additional programming taking place
to ensure information was reaching people in the target groups with the greatest barriers to
participation. The strategy of running two outreach campaigns helped ensure that everyone in
BC, including people in groups that are harder to reach through mainstream media channels, had
the information required to register and vote if they chose to do so.
DEOs implemented outreach plans in their districts to support the two major communications
themes by providing people with information on registration, employment opportunities,
identification, and voting. Outreach operations in districts included registration drives and
attending events to connect with target groups.
During the registration and information campaigns the outreach coordinator worked to engage
partner organizations in assisting the spread of information among their networks. A key
component of the outreach program involved engaging with organizations that provide services
to individuals with identified barriers to electoral participation and leveraging their existing
networks for the purposes of providing voter registration information; increasing awareness of
voting processes, different ways to vote, identification requirements; and promoting employment
opportunities (A. Foster, personal communication, May 9, 2016).
Partners who were identified as being able to provide services to individuals with barriers to
electoral participation were formally contacted by email or with a letter inviting them to support
outreach activities, and follow up phone calls were made to assess interest and arrange meetings.
Over 500 letters were sent to organizations across the province, including public libraries,
Service BC offices, BC Housing offices, Chambers of Commerce, and organizations that serve
new Canadians (M. Callas, personal communication, June 29, 2017). These organizations were a
critical link to ensuring information about voting, identification, registration, and jobs were
communicated to their clients/members.
Staff found that presentations worked best when scheduled to take place as part of an event or
workshop that was already planned. This approach helped ensure audiences for presentations and
by partnering with service organizations presenters were able to focus their material on specific
needs. An example of this partnership approach is working with Inclusion BC to give a
presentation on accessible voting options at one of their workshops (M. Callas, personal
communication, June 29, 2017).
Elections BC also established formal agreements with organizations able to provide services
province-wide, and have established relationships with target communities. Agreements were
undertaken with Check Your Head and CIVIX to engage youth; Samara Canada’s Vote PopUp
program, which demystifies the voting process for new voters; and The Westcoast Reader, which
is a source of information for individuals with low literacy and adult learners of English (A.
Foster, personal communication, May 8, 2017).

29
5.2.3 Targeted Outreach Example: Indigenous Outreach
The outreach coordinator contacted Métis and First Nation organizations via letters and email.
As a result, Elections BC staff met with and gathered feedback from representatives from the
First Nations Leadership Council; BC Assembly of First Nations; First Nations Summit; and the
Union of BC Indian Chiefs. Discussion topics included voter registration, identification
requirements, the voting process, and the best ways to share information with community
members. At the meeting, Elections BC also sought feedback on the event strategy as it related to
First Nation communities and invited ongoing communication and feedback. Insights from the
meeting and further conversations included the importance of representation in materials to
members of Indigenous communities and a preference for receiving information by fax. Based
on this feedback and the experience of Elections Canada in 2015, Elections BC provided
informational materials to include in the First Nations Leadership Council’s 2017 Election
Package, which they distributed via fax, online, and in print, and included images of Indigenous
people in other materials as seen in Appendix 23 (A. Foster, personal communication, May 8,
2017).
5.2.4 Targeted Outreach Example: Youth
Elections BC engaged youth through their new Youth at the Booth employment program, and
formal partnerships with CIVIX and Check Your Head. Over 200 schools participated in the
Youth at the Booth program, which offers high school students (15 years and older) employment
opportunities to work as election officials at voting places. The goals of the program are to
engage youth in the electoral process, while Elections BC also benefits from the skills these
young people bring (M. Callas, personal communication, June 29, 2017). Appendix 24 shows
stats of the number of youth working as election officials for the last four elections. While there
was a significant increase in youth worker participation in 2017 that correlates with the
implementation of the Youth at the Booth program, it is not possible to confirm that the increase
is a direct result of the program.
To engage and inform youth, Check Your Head distributed Elections BC’s informational
materials, assisted youth in registering to vote, organized a field trip for youth to attend all-
candidate debates, and organized a youth voter engagement event where youth learned about the
election, the voting process, and the issues from a non-partisan perspective.
CIVIX engaged youth in a parallel election, giving students around the province who are under
the voting age the opportunity to vote for the same candidates who were running in the general
election. Through the program students got to learn about government, research the parties and
candidates, and experienced voting (A. Foster, personal communication, May 8, 2017).
5.2.5 Targeted Outreach Example: People with Disabilities
Elections BC worked with a number of accessibility organizations, including Access for Sight-
Impaired Consumers and Disability Alliance BC, on the development of a telephone voting
option for voters who have vision loss or who have a disability that restricts their ability to vote

30
independently at other voting opportunities. This provided an additional option for voters who
have difficulty leaving their homes due to a disability. The telephone voting option was
promoted using recorded audio messages on the CNIB Voice Blast network and via distribution
channels within the accessibility community. Over 1,050 voters called to cast their ballots via
telephone.
5.2.6 Program Assessment
Elections BC tracks quantitative measures of estimated activity frequencies:
• 2 million enumeration notices sent to households in BC;
• targeted door-to-door enumeration resulted in over 80,000 voter registration
lookups, including 6,000 new registrations and 16,000 updates;
• over 500 registration drives in community spaces;
• 55 visits to post-secondary institutions;
• Outreach visits in 125 First Nations; packages with voter information sent to First
Nation communities that the DEOs were not able to contact or no outreach was
planned;
• site-based voting at 620 long-term care facilities;
• 65 visits to local homeless shelters;
• over 200 schools participating in Youth at the Booth;
• letter campaign to 500+ organizations encouraging them to share information with
their members;
• distribution of hundreds-of-thousands of informational pamphlets, bookmarks,
maps and other items to organizations across the province; and
• four formal partnership agreements (A. Foster, personal communication, May 8,
2017).
While Elections BC tracks and publishes voter turnout numbers, it is not used as a measure for
judging the success of the outreach program. The objective of the outreach program is not to
increase voter turnout, which is driven by many factors that outreach is not able to impact, but to
get information into the hands of voters and remove administrative barriers to voting so people
can vote if they choose to (A. Foster, personal communication, June, 29, 2017).
In the future Elections BC plans to increase its in-house outreach and public education capacity,
with a mandate to focus on creating a long-term strategy that supports civic education and
partnerships. The outreach team also plans to collaborate with schools to develop new digital
civic education tools for teachers (A. Foster, personal communication, May 8, 2017).

31
5.3 City of Toronto Election Services - Voter Outreach in the 2014 General Election
The Municipal Elections Act, 1996 (MEA) requires the City Clerk to prepare for and conduct the
City’s elections for municipal council and school boards every four years, with the most recent
general election on October 27, 2014 (Election Services, 2014a, p. 21). Working out of Election
Central, the City of Toronto outreach team is responsible for engaging, informing, and educating
Toronto’s 1.8 million eligible voters (Election Services, 2014a, p. 6).
For the 2014 election, the outreach program was designed to raise awareness of voting
opportunities and the different services provided by the City of Toronto. To increase awareness
outreach staff distributed information at events and through partner organizations; staff also
worked to make voting more accessible by identifying and removing barriers for people in
groups with higher barriers to voting, including persons with disabilities.
5.3.1 Outreach Planning
The election outreach team was responsible for developing and managing the outreach plan
including key messages, fostering partnerships with community organizations, and identifying
groups of electors to engage through intentional outreach. The main objectives of the 2014
outreach program were:
raise awareness of the election and give people the information they need to exercise their
right to vote;
build partnerships with community organizations and people already doing outreach work
in the city;
engage residents in learning about the election at events; and
make the voting process accessible (C. Boughannam, personal communication, July 27,
2017).
While the outreach objectives are universal applying to all residents, outreach staff focused on
engaging the following demographics.
tenants;
students and youth (including youth outside of the school system);
educators;
homeless persons;
persons with disabilities;
seniors;
residents of long-term care facilities; and
ethnocultural groups (C. Boughannam, personal communication, July 27, 2017).

32
Based on the outreach objectives, Election Services focused their effort on educating residents on
eligibility to vote, where and how to vote and to inform them of the voting process. Getting on
the Voters List and advance vote days were also important messages. Increasing awareness of
the different ways to vote fit within the strategy of making voting more accessible for people
who indicate they are too busy to vote or will be out of the city on Election Day.
Staff tailored messages to each of the intentional outreach groups as shown in Table 2.
Table 2 – Examples of targeted election messages
Tenants Call to action for tenants to check that they
are on the voters list at their current address
Homeless persons Information about identification
requirements and how to vote for people
who do not have a permanent address
Persons with disabilities and seniors Information on accessible voting options
Youth Information for first time voters
Promotion of election employment
opportunities in high schools through the
Student Connect program and at youth
employment agencies to reach youth
outside of the school system
University students Registering to vote, identification
requirements, and eligibility to vote while
temporarily staying outside of the riding
they consider to be their home
(C. Boughannam, personal communication, July 27, 2017).
In addition to targeted messages, staff addressed communication barriers by having materials
translated into 24 different languages. Translated materials were available online, from staff at
events, and people could request printed copies be mailed to them (C. Boughannam, personal
communication, July 27, 2017).
Between elections, staff organized community consultations to continuously identify barriers to
voting, and researched new processes and technologies that can be used to improve the voting
process. Important feedback from consultations included that it may create a negative voting
experience for homeless people if they have to declare they do not have a permanent address. Staff
plan to address this by working with the City's Shelter Support and Housing Administration
division to provide letters to shelter residents that can be used as identification. (C. Boughannam,
personal communication, July 27, 2017). Staff also heard from university students that they find it
challenging to prove their address if they live in residence and often feel confused about their
eligibility to vote if they are temporarily staying outside of the riding they live in (C. Boughannam,
personal communication, July 27, 2017). Having insight into this barrier for students allowed staff
to create and distribute materials focused on addressing this knowledge gap.

33
5.3.2 Program Operation
The Election Services Office employs one manager of election services, two outreach staff, and
two communications staff who are permanent employees. The primary responsibilities of
outreach staff include consulting and building partnerships with members of the Outreach
Network; doing research to identify and address barriers to voting; designing and distributing
informational materials; and giving presentations to increase civic and election knowledge (C.
Boughannam, personal communication, July 27, 2017).
To increase civic knowledge, staff in Election Services help run a program called ‘My Local
Government’ that educates residents on the roles and responsibilities of elected officials, how
decisions are made, and how residents can participate in the political process. Through this
program civic education is done both leading up to and between elections, with the goal of
helping people understand the programs and services they are able to vote for on Election Day
(C. Boughannam, personal communication, July 27, 2017).
One of the key goals of the 2014 election was to raise awareness of the election among voters,
candidates, and the media (Election Services, 2014a, p. 20). To do this Election Services
launched the public outreach campaign in the year leading up to the election by reaching out to
634 community organizations and activating the Outreach Network to help communicate general
election information on when, where and how to vote (p. 21).
Members of the Outreach Network are divided into three groups that meet separately. Staff find
that bringing together smaller groups of service providers in the network, who work with
members of the same community, creates more collaboration (C. Boughannam, personal
communication, July 27, 2017). The groups within the network are: 1. youth serving community
organizations 2. organizations that work with persons with disabilities, and 3. organizations that
serve ethnocultural and other groups. Ethnocultural service organizations are combined with
other more general service organizations, since people in cultural groups receive the same
universal information about the election that has been translated into different languages.
Outreach Network groups meet four times during election years and meetings are made
accessible with ASL interpreters and personal support workers (C. Boughannam, personal
communication, July 27, 2017). Meetings are scheduled to coincide with big announcements like
the start of recruitment for election workers; voter registration; candidate nomination period; and
voting days (C. Boughannam, personal communication, July 27, 2017). Collateral materials
distributed through the network include postcards and posters letting people know where, when,
and how to vote.
Organizations that employ community outreach workers are able to request election training and
receive an Election Kit in order to conduct their own education sessions through the Train the
Trainer program. Network members can also request staff give ‘Election 101’ presentations or
attend events to give out information.
In the lead up to the 2014 election staff attended 85 events to distribute information and answer
questions from the public (Election Services, 2014a, p. 20). Outreach staff engaged people at
34
events with a trivia competition, and giveaways including branded lanyards and USBs loaded
with election information. The set up for events included a selfie booth where youth, who were
not old enough vote in the election, held a “ I pledge to vote in…” sign on which they could
write the year of the first election they will be eligible to vote (C. Boughannam, personal
communication, July 27, 2017).
The outreach campaign also focused on getting information to people who are not likely to be
reached through mainstream media channels. Interactive formats and contests were used to
encourage youth to share information through their online social networks, including a poster
and “why voting matters to you” video contest (C. Boughannam, personal communication, July
27, 2017). Outreach staff also made a point of attending events where they could connect with
people in target demographic groups, and included information for Citizenship Ceremonies to
get information to new Canadians.
5.3.3 Targeted Outreach Example: Animator Program to Reach Tenants
Election Services runs an Animator program to reach tenants in apartment buildings with low
voter participation. Buildings are selected to be part of the program based on voter turnout and
number of residents in an area, including having buildings in close proximity to each other so
staff can easily visit multiple sites.
For the program animators are assigned to a building (or cluster of buildings), and their role is to
knock on doors and have a brief discussion with residents about the election, registering to vote,
and promote lobby-intercept events where staff help people check if they are on the voters list
(C. Boughannam, personal communication, July 27, 2017).
For the lobby-intercept events, animators set up a computer station and helped residents use the
VoterLookup tool, and added people to the voters list if they were not registered or needed to
update their information. Staff found the best time to schedule intercept events was in the
evening to catch residents as they get home from work, and the best location was near the
elevators to maximize foot traffic.
The Animator program was run in partnership with Toronto Community Housing Corporation
(TCHC), which helped with the recruitment and management of staff. The TCHC animator
program was run with 14 staff, and 18 staff were hired for the Tower Renewal program. During
the program animators worked in teams of two and reached approximately 8,900 people (C.
Boughannam, personal communication, November 14, 2017). TCHC promoted animator jobs to
their residents, and animators were selected in consultation with non-profit organizations in each
of the communities. When possible youth who lived in the targeted buildings were hired to work
as animators. Another key hiring criteria was for animators to speak the predominant languages
of the people in the buildings being visited.
Animators were hired to do 10 hours of work, which included one hour of training, five hours of
pre-event promotion (knocking on doors, distributing VoteLookup flyers, and putting up
posters), and four hours for the lobby-intercepts. Animators were provided with an honorarium

35
of $150 for working the required hours (C. Boughannam, personal communication, July 27,
2017).
5.3.4 Targeted Outreach Example: Increasing Election Accessibility
Starting in 2010, Election Services began issuing reports on election accessibility and tracking
the progress of initiatives in this area. Commitments to accessibility included continuing to work
with the Disability Issues Committee and organizations that represent persons with disabilities;
reaching out to persons with disabilities who are not affiliated with organizations; and increasing
awareness of accessible voting options (Election Services, 2014b, p. 4).
To help achieve the commitments to accessibility, Election Services established the Accessibility
Outreach Network, which met five times in 2014 to identify barriers to voting; establish new
communications channels to inform persons with disabilities not reached through service
organizations; schedule events and workshops to demonstrate accessible voting equipment; and
provide election information in accessible formats including braille, large print, and videos with
ASL and captioning (Election Services, 2014b, pgs. 6 & 8).
Responses to the 2014 post-election survey indicate that outreach efforts directed to persons with
disabilities are having a positive impact. 75% of the respondents identified as persons with
disabilities, rated the information available before Election Day as good or excellent (Election
Services, 2014b, p. 12). This high rating of being informed correlates with a 160% increase in
the use of VAT electronic ballot marking machines (an assistive device that includes audio,
Braille, keypad, sip/puff, and rocker paddles), and 150% increase in proxy vote certificates
issued (p. 12). Staff also noted comments from individuals that illustrated the impact of direct
outreach, with an attendee at one of the accessible equipment demonstrations telling staff that
they did not think they could vote until they had the chance to test the sip/puff feature on the
VAT (C. Boughannam, personal communication, July 27, 2017).
5.3.5 Program Assessment
The outreach program was assessed on quantitative measures of the number of people reached,
as well as awareness, knowledge, and public satisfaction metrics collected in the post-election
survey (Election Services, 2014a, p. 21). The measures tracked by staff are listed below, and
Appendix 25 shows communications and outreach charts with comparisons to 2010 election
numbers:
85 community events attended;
634 partners engaged;
107,000 promotional materials distributed; and
2,863 Twitter followers, 1,460 fans of Facebook, and 697,000 visits to the election
website (Election Services, 2014a, pgs. 20 & 21).
Voter participation in the election was 56% with 991,754 ballots cast, a 19.8% increase in
turnout compared to 2010 (Election Services, 2014a, p. 6). While Election Services tracks and

36
publishes voter turnout numbers, it is not used as a measure for judging the success of the
outreach program, as turnout is highly dependent on the candidates and how important people
feel the issues are (C. Boughannam, personal communication, July 27, 2017).
Election Services conducts a post-election survey that includes measures of satisfaction with the
voting experience, as well as feedback on the voting process including barriers to voting (Ipsos,
2014, p. 3). Measures related to outreach included “knowledge of the voting process and
available options; awareness of accessible services; and sources of voting information” (p. 3).
The survey results show an increase in voter knowledge and election awareness among residents.
The proportion of electors indicating they were very knowledgeable of when, where, and how to
vote on Election Day and alternate options such as advance voting increased from 38% in 2010,
to 45% in 2014 (Ipsos, 2014, p. 18). Persons with disabilities reported increased awareness of the
following accessible services compared to 2010: advance voting (14 percentage points),
availability of additional staff to assist voters (5 percentage points), and the option to appoint a
proxy voter to vote on their behalf (8 percentage points) (Ipsos, 2014, p. 32).
Staff received positive feedback from residents on their outreach efforts and the one on one
interactions with the public in their communities went a long way. (C. Boughannam, personal
communication, July 27, 2017).
In the future, Election Services staff plan to further divide Outreach Network meetings into
smaller groups specific to the demographic groups they serve, and find more ways to empower
members to design their own programs and serve as election ambassadors (C. Boughannam,
personal communication, July 27, 2017). Ideas for future grassroots programing include a peer-
to-peer program designed and run by youth.
5.4 City of San Francisco - Voter Outreach in the 2016 Consolidated General Election
The mandate of the San Francisco Department of Elections is to conduct “all federal, state, and
local elections in the City and County of San Francisco in a manner that is free, fair, and
functional” (J. Fox, personal communication, July 5, 2017, p. 1). Within the department, the
Outreach and Education division is responsible for engaging and informing citizens, distributing
information, and ensuring the department is compliant under statutory outreach mandates. The
City of San Francisco has 864,816 residents, of which 513,573 are eligible voters (p. 24).
5.4.1Outreach Planning
The theme of the outreach program for the City of San Francisco Consolidated General Election
on November 8, 2016, was “Engaging the Unengaged”; the unengaged being the 195,000
residents who were eligible to vote, but not registered (J. Fox, personal communication, July 5,
2017).
The main objectives of the outreach program were:

37
increase community access to election information and services, specifically for limited-
English proficient Chinese, Spanish, and Filipino-speaking voters in order to connect
with diverse populations in ways that are culturally-competent;
attract new voters outside of the voting electorate, specifically people between the ages of
18 and 24, who may not have voted previously;
engage registered voters from historically low voter turnout communities, including
voters with different learning styles; and
involve the public in observing the election processes in order to build and maintain trust
about voting and the election process with community leaders (J. Fox, personal
communication, July 5, 2017).
Outreach strategies were designed to reach all eligible voters, with special emphasis on the
communities defined by the Voting Rights Act and San Francisco’s Language Access Ordinance:
Chinese, Spanish, and Filipino speakers with limited English;
people with disabilities;
new citizens;
seniors and long-term care residents;
youth/first-time voters;
eligible and ex-offenders;
low income communities with low voter turnout; and
military and overseas voters (J. Fox, personal communication, July 5, 2017).
In addition to reaching voters in protected categories, the outreach office prioritized addressing
information barriers related to the size of the ballot which contained a number of offices, one
district measure, 24 local measures, and 17 state measures (J. Fox, personal communication, July
5, 2017). The complexity and size of the ballot made it important to focus outreach on voter
education to help people understand the different measures and where to get additional
information to help make their selections. A three step “Prepare – Plan – Participate” message
was included on materials and in advertisements to encourage citizens to register, review the
voter information pamphlet, and choose a voting option including mail, advance voting or at a
polling place on election day (J. Fox, personal communication, July 5, 2017).
Outreach staff increased efforts to seek advice from trusted community leaders on how to reach
people in different groups with relevant information. Consultation included “small-group
meetings seeking advice, merchant walks to involve the business community, new advertising
venues, and adjusted materials to better provide culturally competent election information” (J.
Fox, personal communication, July 5, 2017). Important feedback received during consultations
included facilitating question-and-answer sessions, and creating campaign materials that include
video, radio, infographics, and using plain language to convey messages to voters who are not

38
responding to more formal methods of communication (J. Fox, personal communication, July 5,
2017).
5.4.2 Program Operation
The Department of Elections outreach office has two full-time permanent staff, the outreach
manager and outreach assistant manager, who work on partner engagement and voter outreach
year-round. Additional staff are hired to start working 10 weeks before the election as outreach
intensifies, including five community coordinators who attend events and are available to give
presentations in English, Cantonese, Mandarin, Spanish, and Filipino (J. Fox, personal
communication, July 5, 2017).
In addition to attending events and giving presentations, community coordinators work with
partners to share information about voter registration, voting procedures, ballot choices, and how
to vote-by-mail. Partners include community-based organizations in the Voter Information
Network (VIN), members of the Civic Family, and community partnerships (J. Fox, personal
communication, July 5, 2017).
Community partners are engaged through the VIN, which was established in 2008. The VIN
includes over 400 active community-based organizations representing San Francisco’s diverse
communities (J. Fox, personal communication, July 5, 2017). VIN members include non-profit
and community groups, seniors organizations, and single room occupancy building managers,
who all receive letters inviting them to participate in the election, submit feedback on the
outreach plan, and request materials and presentations (J. Fox, personal communication, July 5,
2017).
A few months before the election, all VIN organizations received posters and flyers to display,
and a request to share information with their networks via newsletters, meetings, websites and
on social media (J. Fox, personal communication, July 5, 2017). Staff have found that
maintaining an engaged community network is an important way to get information to diverse
groups of citizens, and is also an important source of information on events and opportunities to
give presentations.
Outreach materials are also distributed through the Civic Family network that includes recreation
facilities, libraries, police and fire departments, and local schools. The outreach office also
participates in a regional Bay Area Voter Outreach Committee, in which 11 counties collaborate
to promote elections and share outreach best practices (J. Fox, personal communication_ July 5,
2017).
Elections outreach staff produced and distributed materials designed to help people prepare to
vote, including a booklet with information on candidates and measures that included a sample
ballot for people to fill out and bring with them to vote at the polling station (J. Fox, personal
communication, July 5, 2017). Because of the unusually large and complex ballot, outreach staff
communicated to people that they do not have to vote for every initiative on the ballot, and gave
assurances that it is okay to be selective in focusing on the issues they feel are the most
important.

39
A set of informational materials were produced in large-print versions to send organizations
serving people with visual impairments. Materials included “Get Out The Vote” cards (Prepare –
Plan – Participate); election flyers (key dates, registration, and voting options); “Promote the
Vote” posters; ballot worksheets; and voter information pamphlets (J. Fox, personal
communication, July 5, 2017).
During the time the public outreach program was active from July 1 to November 8, staff
attended 207 events and gave 69 presentations. Appendix 26 lists a summary of all outreach
activities. Outreach staff set up resource tables at public events where they provided election
information, registered voters, recruited poll workers, and answered questions about the voting
process. Staff used a trivia wheel to engage people in learning about the election and gave out
small prizes including vote buttons, pens, and magnets branded with the “Be A Voter” logo (J.
Fox, personal communication, July 5, 2017).
During the outreach period multilingual outreach staff were available seven days a week to share
information and answer questions. At the invitation of community groups and residential
facilities, outreach staff gave presentations on how to register and vote. Staff also ran a Ballot
Answer Table that was designed to be set up for 1-2 hours in high-traffic areas at service
agencies, residential buildings, and in schools. The Ballot Answer Table was helpful for reaching
people unable to commit the time required to attend a presentation and allowed staff to offer
information in a variety of formats including print, video, and one-on-one discussions (J. Fox,
personal communication, July 5, 2017). The table was set up in some unique locations including
the “lobby of the McKesson Corporation as thousands of employees arrived in the morning; the
Twitter Building lobby at lunch time; Golden Gate University during class breaks; and the
Veteran’s Hospital during visiting hours” (J. Fox, personal communication, July 5, 2017).
To achieve the objective of increasing youth participation the outreach office recruited students
over 16 to work at polling stations, contacted teachers offering to have outreach staff give a
presentation in their class, and coordinated a high school ambassadors program of peer-to-peer
student outreach. Staff also engaged university students by having a presence at events on
campus and reaching out to professors to schedule brief presentations at the start of lectures.
5.4.3 Targeted Outreach Example: Youth and High School Students
In February, elections outreach staff launched the Youth Voting Collaboration, made up of
representatives from the Youth Commission; Department of Children; Youth and Their Families;
Transitional Age Youth initiative; and the public library (J. Fox, personal communication, July 5,
2017). Representatives from the different organizations were asked to share their feedback on
how to best engage youth, what events staff should attend, language needs, popular media
sources, and community influencers to work with.
In August, outreach and poll worker recruitment staff met with representatives from the school
district to discuss election activities for high school students, including organizing High School
Voter Registration Weeks (last 2 weeks of September), and guidance on the best way to recruit
1,000 San Francisco high school students to work at polling stations (J. Fox, personal
communication, July 5, 2017).

40
Poll worker recruitment and outreach staff visited 29 high-schools to “share voting information,
ask students to participate as High School Poll Workers, and recruit and train High School
Ambassadors to register voters and find other creative methods to help “get out the vote” at their
schools” (J. Fox, personal communication, July 5, 2017). Election information was sent to 120
high schools including requests to schedule a time for a poll worker recruiter to set up a
recruitment table on campus in a high traffic area like the cafeteria (J. Fox, personal
communication, July 5, 2017).
5.4.4 Targeted Outreach Example: Voters with Limited English and New Citizens
Outreach was targeted to people with limited or no English through focused-community
collaborations and setting up the new Ballot Answer Table in target communities to distribute
materials in multiple languages. Outreach staff conducted 41 Ballot Answer Table events over
four months, tailoring available information to expected audiences and scheduling community
coordinators able to provide answers in multiple languages (J. Fox, personal communication,
July 5, 2017).
In partnership with the United States Citizenship and Immigration Service, outreach staff
attended 20 citizenship ceremonies in 2016 (J. Fox, personal communication, July 5, 2017). Staff
attending the ceremonies explained voting rights, gave out flyers, and registered new citizens on
the voters list.
The outreach office piloted a Merchant Walks program to reach Chinese-speaking voters in low-
voter-turnout neighborhoods. Staff went to commercial corridors in target neighbourhoods and
did street outreach to engage voters who may not see materials elsewhere, and gave out Chinese-
language elections posters and flyers to 195 merchants (J. Fox, personal communication, July 5,
2017).
5.4.5 Program Assessment
The success of the outreach program was assessed in part by tracking the number of events and
presentations attended, voter registrations and materials distributed. Appendix 26 provides
counts for all of these activities. Staff also tracked events and presentations by type and
language, with the results shown in Appendixes 27 and 28.
The outreach program was successful in reaching a large number of residents, while also
reaching people in target communities with information in multiple languages. The number of
registered voters increased by 66,745 people between November 2016 and November 2017 (J.
Fox, personal communication, July 5, 2017), and the election set a new record for number of
voters with 513, 573 registered voters and total turnout of 414,528 or 80.71% (J. Fox, personal
communication, July 5, 2017).
In the future the Election Office plans to establish a smaller group of VIN members who will
serve as a formal advisory committee. Members of the committee will provide staff with advice
on how to continue reaching and informing people in demographics that are underrepresented at
the polls.

41
5.5 Summary of Findings from Jurisdictional Scans
Analysis of the outreach programs studied in this report showed a foundational set of objectives
and activities included in the election outreach programs run by Elections Canada, Province of
BC, City of Toronto, and City of San Francisco. The similarities noted in program objectives and
activities were consistent, even though the electoral agencies researched varied in size and were
responsible for doing outreach to populations of different sizes; ranging from 25,939,742 eligible
voters across Canada, to 513,573 eligible voters in the City of San Francisco. Analysis found that
the large electoral agencies engaged in outreach activities that are similar to smaller
municipalities, with the main program differences being in scale of implementation.
The outreach programs researched in the jurisdictional scans had similar planning processes,
program operations, and evaluation metrics as outlined in Table 3.
Table 3: Core outreach program similarities observed in the jurisdictional scans
Outreach
Objectives
Target Populations Outreach Activities Measurements
Increase awareness
of election
Youth Surveys/consultations # of people reached
Ensure people know
how to vote and
available options
Indigenous Partnerships with
community
organizations
# of materials
distributed
Civic literacy and
understanding of
municipal
government
New citizens Events/presentations Activities by
language, area and
demographic
Identify and address
barriers
Persons with
disabilities
Distribute collateral
materials
Pre and post-election
surveys
Engage
demographics with
low turnout
Low-
income/homeless
Translated materials Voter turnout
Educators Branded SWAG
5.5.1 Outreach Planning
High level objectives shared by the outreach programs included informing voters of the election
and how to vote; educating residents about government services and the importance of voting;
identifying and addressing barriers to voting; and engaging eligible voters in populations with
lower levels of participation.
Program managers identified research, surveys, and consultations as key activities during
planning, and used information from these sources to inform outreach strategies. Information
gathered during planning often resulted in process changes to remove barriers and develop
targeted activities to improve participation rates in populations with low turnout.

42
As shown in Table 4 outreach managers were mostly consistent in the populations they identified
for targeted outreach.
Table 4: Target populations for election outreach identified in jurisdictional scans
Jurisdiction Young
people
(18-24)
Indigenous
persons
New
citizens
Persons
with
disabilities
Homeless
persons
Educators
Elections
Canada ✔ ✔ ✔ ✔ ✔ ✔
Elections
BC ✔ ✔ ✔ ✔ ✔ ✔
City of
Toronto ✔ ✔ ✔ ✔ ✔ ✔
City of San
Francisco ✔ ✔ ✔ ✔ ✔
In addition to the groups listed in Table 4, City of Toronto did targeted outreach to tenants and
City of San Francisco included ex-offenders in their list of target populations.
5.5.2 Outreach Activities
Table 5 lists the main outreach activities undertaken by the election agencies in the jurisdictional
scans to achieve program objectives.
Table 5: Activities undertaken by the election agencies to achieve program objectives
Jurisdiction Partnerships
with community
organizations
Outreach at
events
Translated
materials
Presentations Survey of
electors
Elections
Canada ✔ ✔ ✔ ✔ ✔
Elections BC ✔ ✔ ✔ ✔ ✔
City of Toronto ✔ ✔ ✔ ✔ ✔
City of San
Francisco ✔ ✔ ✔ ✔
All of the election offices produced collateral materials with election information to distribute at
events and through partner organizations. Information on materials was often categorized as
universal (general messages for all electors) or targeted to address barriers faced by a specific
audience. Universal information focused mainly on letting people know when and where to vote,
while Table 6 lists common examples of targeted messages designed to address specific barriers
to voting.

43
Table 6: Examples of targeted election messages
Target Audience Targeted Messages
Homeless persons voter registration
identification requirements
how to vote without a permanent
address
Persons with disabilities and seniors accessible voting provisions
accessibility information about voting
locations
Youth voter registration
election employment
eligibility to vote and proof of address
while living in residence
New citizens voter registration
access to voting materials in different
languages
Tenants voter registration
In all of the outreach programs studied, partnerships were formed with non-profit and
community organizations in order to increase the distribution of election information. In addition
to helping raise election awareness and increase voter knowledge, partner organizations were
consulted to help identify barriers to voting faced by the populations they serve and advise on
outreach activities. Outreach staff maintained lists of partner organizations categorized by the
populations they serve, which allowed them to easily send out information about special services
of interest to their members.
The other main outreach activity used to raise election awareness and inform voters was having
staff attend events to give out information and answer question about the election. Outreach staff
set up resource tables at events where they registered voters, recruited election workers, and
answered questions about the voting process. Events attended included a mix of large community
events and smaller targeted events. Outreach staff attended targeted events to connect with
electors who are less likely to receive information about voting from print and digital
communications, and connect people with services designed to reduce barriers to voting.
During outreach campaigns key messages were delivered in phases to not overwhelm electors
with too much information at once. Outreach typically started with voter registration drives and
civic information on government services, followed by election information. Elections Canada
communicated key messages in phases to support specific activities including registration,
receipt of voter information cards, and advance polls; while City of Toronto scheduled meetings
with Outreach Network members to coincide with big announcements including election worker
recruitment, voter registration, candidate nominations, and voting days.

44
5.5.3 Outreach Program Evaluation
All outreach programs were assessed on quantitative measures of the number of people reached,
events attended, presentations given, and materials given out. Quantitative measures were also
categorized to look at activities by neighbourhood, languages, and target populations reached.
Elections Canada and Elections Toronto published survey results used in part to evaluate
outreach activities. Elections Canada did both pre and post-election surveying to measure
changes in knowledge of the election, how to vote, and perceptions of trust in the information
they released. City of Toronto conducted a post-election survey with measures related to
outreach including, knowledge of the voting process and different ways to vote, awareness of
accessible services, and sources of election information.
While all of the election offices researched publish voter turnout numbers, outreach managers at
Elections Canada, Elections BC, and City of Toronto mentioned that they do not use turnout as a
performance indicator for their outreach programs. Reasons for not evaluating outreach programs
against changes in turnout included, peoples’ decision to vote being impacted by factors that are
hard to address through outreach, and turnout being outside the scope of their outreach objectives
to get information to voters and remove barriers.

45
6.0 Discussion and Analysis: Linking Theories of Political Participation and
Jurisdictional Scans to a Voter Outreach Strategy for the City of Vancouver
6.1 Addressing Barriers to Voting In Vancouver: Current Challenges
In this report, both scholars of voter participation and election outreach managers have identified
structural and motivational barriers to voting that need to be addressed in order to increase public
participation in elections. To be strategic voter outreach plans need to use a mix of theories and
data to consider the unique needs and values of different demographics and neighbourhoods, and
reach out to people in a way connects their values and sense of citizenship to the political
process. One of the key findings from the outreach campaigns studied in this report is that all of
the government election agencies delivered universal messages to inform eligible voters in their
jurisdiction of the basic information required to vote, while also using outreach to deliver
targeted messages designed to address barriers to voting.
This section first considers how the information in this report from the literature review,
demographic analysis, and jurisdictional scans can be applied to designing strong universal
outreach practices, and is followed by ideas for more targeted outreach.
6.2 Universal Outreach: Reaching All Eligible Voters
All of the election agencies looked at in the jurisdictional scans ran universal outreach campaigns
designed to raise awareness that an election is taking place and give people the information they
need to feel knowledgeable about the political system and voting process. Creating clear
informational materials that are distributed through multiple communications channels is
important for lowering information costs for all voters, particularly in Vancouver which has an at
large system of political representation that results in complicated ballots which have included
over 120 candidate choices in the past.
Beyond ensuring that people have basic information about voting, outreach is an effective tool
for providing positive social cues and information that helps people connect the issues they care
about to services provided by government in a way that makes their vote feel personally
meaningful and increasing feelings of external efficacy. As noted in the report by the
Independent Election Task Force (2017), positive social cues help create awareness and positive
social pressure that helps increase voter intention (p. 22). Using outreach to increase positive
social cues is supported by the results of an experiment by Gerber (2009), which found that get
out the vote messages that emphasize low voter turnout are less effective than high turnout
messages that create descriptive social norms resulting in positive social pressure (p. 178).
Research suggests that voter intention for people in Vancouver, who are part of demographic
groups and neighbourhoods with higher historical rates of turnout, can be increased through
small noticeable reminders to vote like information cards in the mail; text messages reminding
them to vote (Dale and Strauss, 2009, p. 787); and exposure to positive cues on social media

46
(Bond et al., 2012, p. 295). Neighbourhoods in Vancouver that will benefit from this type of
outreach are areas that had higher levels of participation in the 2014 election, and those with
higher proportions of residents who own their homes, as well have higher household incomes
and education levels. Local areas that fit this profile include Dunbar-Southlands, West Point
Grey, Riley Park, Kerrisdale, and Shaughnessey.
To increase positive social cues, outreach in areas of Vancouver with high proportions of people
who are consistent voters and have established being a voter as part of their identity, should be
designed to encourage people to publicly share their intention to vote and reasons for voting on
social media. A Facebook experiment by Bond et al (2012), highlights the value of encouraging
people to share positive social cues with friends on social media with the finding that social cues
shared between friends to vote exerted about four times more influence than information only
appeals (p. 295).
A final finding that can be applied to creating universal messages includes using linguistic cues
that frame voting as an act of personal identity, instead of talking about it as a behaviour. Bryan
et al (2001) found that messages to get people to vote are more effective when they framed
voting as a way for people to express their political and social values using self-relevant nouns
like in the question “How important is it to you to be a voter in the upcoming election?” versus
“How important is it to you to vote in the upcoming election?” (p. 1).
6.3 Targeted Outreach: Reaching Populations With Higher Barriers to Participation
Research findings in this report suggest that in person outreach is an effective way to reach
people who are not regular voters and experience higher barriers to participation. Rogers et al
(2012) found that the interactive nature of face-to-face communication causes people to pay
closer attention to the information they are being given, making it an effective method for
reaching people with lower levels of knowledge about the voting process (p. 6). Roger’s finding
also suggests that interpersonal contact can be most effectively targeted to people who are not
regular voters, as consistent voters need less persuasion and can be effectively reached through
other less intensive means like print and online advertising campaigns. Doing in person outreach
to support people who have never voted before, or are not consistent voters, can help establish
voting habits that will have long-term positive effects, including increasing the likelihood that a
person will vote in subsequent elections, as they become more interested in and comfortable with
the voting process (Coppock and Green, 2016, p. 1044).
Based on the research in the literature review, and comparisons of voter turnout data to local area
demographics and social indicators, outreach for the election in 2018 will have the greatest
impact if it is targeted to neighbourhoods that have had lower rates of turnout in past elections
and have higher proportions of people who:
have low-incomes and levels of education;
are between the ages of 18-34;
are new Canadian citizens;
47
have low English proficiency;
identify as Indigenous;
live alone; and
rent.
6.3.1 Low Income/Level of Education
Considerations of socioeconomic differences are important to note in Vancouver, in which
incomes are more polarized than in other large Canadian cities. There are neighbourhoods in the
city that have significant proportions of people with low incomes and low voter turnout like
Strathcona, Downtown, Arbutus Ridge, Oakridge, and Marpole (City of Vancouver, 2015b, p. 9).
As noted by Nakhaie (2006) and Verba (1972) voter behaviour is influenced by socioeconomic
differences, with studies showing that people who have lower incomes, less education, and
weaker social networks in their community are less likely to trust governments or receive
information about elections. Nakhaie (2006) notes that people with lower levels of income and
education can benefit significantly from sharing political information through outreach, as they
are less likely to have access to this type of information through their personal social networks
and have lower levels of trust in the political system (p. 367).
Examples from the jurisdictional scans of outreach addressing barriers related to political
knowledge and attitude toward the political system, include sending outreach staff to community
events and coordinating communications with partner organizations to correct the imbalance of
information received by people in marginalized communities. Elections Canada addressed
communication barriers by having election materials translated in plain language and distributing
them through organizations that work with people who have low levels of literacy. Outreach staff
at the City of Toronto are building trust with people who do not have a fixed address through
consultation on identification issues and changing their process to allow letters to be used in
place of verbal declarations.
6.3.2 Youth and Young Adults
Studies have shown that age is the factor with the greatest impact on voting, with turnout
decreasing in younger age groups (Turcotte, 2015, p. 14). While overall the population in
Vancouver is ageing, there are certain areas with high proportions of youth and low turnout,
including Downtown, Sunset, Renfrew-Collingwood, West End, and Kensington.
The research findings of Pammett and LeDuc (2003) can help explain why people who are
between 18-34 have low rates of voter participation, as they reported that over a third of youth
feel disconnected from politics because of a lack of representation; not having enough
information on candidates, political parties, and issues; or a clear understanding of how political
operations affect their lives (p. 51). Pammett and LeDuc also noted younger voters do not have
the same sense of civic duty as older generations and to be effective outreach needs to frame
voting as an important form of political action and provide youth with examples of community
action influencing policy (p. 38).

48
Voter data from the 2014 Vancouver election in Appendix 10 shows that young adults between
18-34 had the lowest turnout. The data also shows that 18-24 year olds have the lowest rates of
voter registration, while 25-34 year olds have a much higher proportion of registered voters who
are choosing not to vote. Additionally, 18-24 year olds who are registered are more likely to vote
and the impact of being registered on voter turnout then declines for people who are 25 and
older. The outreach implications of these findings are that young adults in the 18-24 age group
will benefit from outreach focused on voter registration, while outreach to people who are in 25-
34 age group should focus on addressing other barriers, including increasing access to
information on candidates and activities that help connect government operations to issues they
care about.
Examples of outreach targeted to youth and young adults from the jurisdictional scans include
Elections Canada and Elections BC increasing the civic literacy of future voters through their
partnership with Civix to deliver the Student Vote program. Election offices also sent outreach
staff to events on university campuses to register new voters and recruit students to work on
Election Day. To help youth connect the issues they care about to services provided by the city,
Toronto Election Services ran contests on social media to get youth talking about why voting
matters to them.
6.3.3 New Citizens and People With Low English Proficiency
In 2011, Vancouver was the municipality in metro region with the greatest total number of recent
immigrants and the largest proportion of residents unable to converse in English of cities in
Canada (City of Vancouver, 2015a, p. 28). Areas in Vancouver with high proportions of recent
immigrants, and non-English speakers, that also had low turnout in 2014, include Victoria-
Fraserview, Renfrew-Collingwood, Oakridge, Marpole, and Arbutus Ridge.
Research by Gludovatz (2012) and Black (2001) found that recent immigrants face higher
barriers to voting related to knowledge and communications, as they must learn about the new
political system and local issues; and depending on the political system where they immigrated
from, may have low levels of trust in governments. Additionally people who do not speak
English, or have lower levels of English proficiency, face additional knowledge barriers if they
are unable to access translated information about the electoral process.
Examples of outreach to new citizens in the jurisdictional scans include Elections Canada, City
of Toronto, and City of San Francisco sending outreach staff to attend citizenship ceremonies to
give out information on the local political system and register newly eligible voters. Outreach
staff also partnered with settlement agencies to distribute election information and help people
access translated materials.
All four electoral offices researched in the jurisdictional scans provided access to translated
materials, with Elections Canada publishing voter identification requirements and the voter’s
guide online in 31 heritage and 12 Indigenous languages. To ensure staff were able to provide
culturally accessible information at events and during presentations, City of San Francisco hired
diverse staff who spoke English, Chinese, Spanish and Filipino.

49
6.3.4 Indigenous Peoples
In 2011, there was an estimated total of 12,000 Indigenous people in Vancouver and 775 living
on the Musqueam reserve land (City of Vancouver, 2015a, p. 21). A comparison of areas in
Vancouver with high estimates of Indigenous people to the map of voter turnout, showed a
correlation between areas with high proportions of Indigenous persons and lower turnout,
particularly around the downtown core, including the Downtown and Strathcona local areas.
Considerations of barriers to voting faced by Indigenous people need to acknowledge the
historical factors that define how many community members relate to the political system. As
O’Niell notes (2006), Indigenous people have faced significant historic barriers to their political
participation including, “the requirement of giving up status to participate in elections, which
was in place up until 1960” and current socio-demographic factors that are impacting turnout
including the “relatively young average age of the Aboriginal population, and their lower socio-
economic status” (p. 15). Ladner (2003) also notes that some Indigenous Canadians continue to
feel alienated from the Canadian political system due to the country’s history of colonialism.
Elections Canada used outreach to address barriers to voting faced by Indigenous people related
to knowledge and communications, as well as attitude towards the political system. Targeted
outreach included, working with the Assembly of Frist Nations to research community specific
barriers and using the findings to develop culturally relevant information (Assembly of First
Nations, 2016, p. 4), and hiring Indigenous elders and youth to work at polling stations to explain
the voting process and provide interpretation services (p. 29). Elections BC also consulted with
Métis and First Nation organizations, and used the feedback received to produce informational
materials that were included in the First Nations Leadership Council’s 2017 Election Package.
6.3.5 Renters
In Vancouver there are high proportions of renters concentrated in certain areas like Downtown,
West End, Strathcona, Marpole, and Kensignton-Cedar Cottage, which also had low voter
turnout in the 2014 election. A study by Uppal & LaRochelle-Côté (2015) found that voter
turnout is lower among people who rent, and Geys (2005) noted lower turnout for renters which
he attributed to people who rent being more transitory and having higher information costs due
to being less familiar with local candidates and issues (p. 644). One reason that turnout may be
lower for people who rent is that they are less likely to be registered at their current address and
may miss important information sent by mail
Programming registration drives in areas with high proportions of people who rent can address
knowledge barriers related to missing important information sent to registered voters. The City
of Toronto addressed this barrier through their Animator program and had outreach staff set up
computer stations in the lobbies of rental buildings to help residents check their registration
status and make updates. Running a similar program in Vancouver, targeted to areas with high
rates of registration at voting locations in 2014, will help ensure more people receive their Voter
Information Card and will not experience issues related to having to show identification to
register at the voting station.

50
6.3.6 Persons Living Alone and Community Social Connections
A survey by the Vancouver Foundation in 2012, reported that people aged 25-34, newcomers,
and people living in high-rise apartments in Metro Vancouver experience weak levels of social
connectivity (City of Vancouver, 2015c, p. 3). Social connections within communities affect
voter turnout, as noted by Smets and Ham (2013) using the theory of social capital to show that
people use their networks to become informed about political parties, candidates, and the
electoral process; and that isolated people have higher barriers to voting, because they miss out
on these social sources of information (p. 350). In person outreach can increase social capital for
people in isolated groups by creating opportunities to engage in conversation with staff about
government services and voting process, while also providing positive social cues and help
people feel more connected to the democratic process.
In addition to people in certain groups being more likely to experience weak social connections,
Vancouver also has a high proportion of people living alone in certain areas, including
Downtown and the West End. A comparison of areas with high percentages of people living
alone to the map of voter turnout showed a correlation between living alone and lower rates of
voter participation. This finding fits with research conducted by Nickerson and Todd (2010),
which found that people are more likely to vote if they have a plan, and people who live in
multiple-eligible-voter households are more likely to have a plan than people living alone (p.
198). Nickerson and Todd found that phone calls made to encourage people to vote are more
effective when the people being contacted are encouraged to create a plan to vote and that this
intervention had the largest impact on people living in single-eligible-voter households in which
turnout increased by 9.1 percentage points (p. 194). The implications of these results for outreach
are that activities which encourage people to plan when, where, and how they will vote, will
increase voter intention. The results of Nickerson and Todd’s study also suggest that this type of
intervention will be the most effective in areas where people live on their own.

51
7.0 Voter Outreach Options to Consider and Recommendations
The following are general recommendations flowing from the literature review and jurisdictional
scans. Recommendations are presented to assist the client in planning, operating, and evaluating
an election outreach program that aligns with the objectives of City of Vancouver Election
Office:
1. providing accessible and timely election information and services to citizens;
2. increasing overall voter turnout by improving engagement with low voting communities
and demographics;
3. reducing barriers for voters with disabilities; and
4. being strategic, data driven and innovative (J. Nelson, personal communication, 2017)
7.1 Planning
Conducting focus groups with the City’s advisory committees and doing a survey of local
community organizations ahead of the election is a recommended activity to improve
engagement and reduce barriers to voting. Focus groups should include the advisory committees
below to explore the key issues and barriers to voting experienced by the populations they
represent:
Children, Youth and Families;
Cultural Communities;
LGBTQ2+ ;
Persons with Disabilities;
Urban Aboriginal Peoples;
Women; and
Seniors.
To be as accessible as possible, election focus groups and workshops should be held in
accessible spaces with ASL interpretation and personal support workers provided for attendees
when required.
The survey of community organizations should identify the populations served by each
organization, barriers to voting experienced by the people they work with, and ways they can
support election outreach activities in 2018. Information collected in the survey can be used to
build a database of community organizations categorized by the populations they serve, making
it easy for outreach staff to send targeted information to people in different groups.

52
Information and feedback collected from the focus groups and survey should be analyzed to
identify recommendations staff can implement to reduce barriers and increase electoral
participation in the 2018 election. Using the data collected from focus groups and the survey in
planning for the outreach program, will help meet the department’s objective to be strategic, data
driven and innovative.
The other outreach programs researched demonstrate that paid partnerships can be used to
increase engagement with low voting communities and demographics. During outreach planning
the election office should explore the services available from organizations that have experience
engaging people in low voting demographics including Civix and Check Your Head for
engaging youth, and Samara for doing outreach to new voters.
7.2 Operations
It is recommended that the election office provide accessible and timely election information and
improve engagement with low voting communities by hiring a team of outreach staff to attend
community events and develop partnerships with civic and community organizations to increase
the distribution of information. To increase the accessibility of information staff on the outreach
team should be multilingual and able to deliver information in the top four home languages
spoken in Vancouver, which are Cantonese, Mandarin, Punjabi, and Tagalog. Outreach staff
should also ensure translated versions of information materials are available. In addition to
translating materials into other languages, barriers for voters with disabilities can be reduced by
making materials available in large print format and with braille. Having materials translated into
plain language can also reduce information barriers for persons with disabilities, including
cognitive impairments and adult learners of English.
Based on smart practices observed in the jurisdictional scans it is recommended that outreach
activities be designed to connect all eligible voters with basic information about the election,
with additional programming focused on reaching people in neighbourhoods and populations
with the greatest barriers to voting. The academic research and jurisdictional scan data looked at
in this report strongly suggests that election outreach in Vancouver should be targeted to
neighbourhoods that have high proportions of young adults 18-24; people with low-incomes or
are experiencing homelessness; new citizens; Indigenous people; renters; and people who live
alone. Table 7 lists targeted messages designed to address barriers to voting experienced by
people in populations with low turnout.

53
Table 7: Targeted election messages
Target Audience Targeted Messages
Homeless persons voter registration
identification requirements
how to vote without a permanent
address
Persons with disabilities and seniors accessible voting provisions
accessibility information about voting
locations
Youth voter registration
election employment
eligibility to vote and proof of address
while living in residence
New citizens voter registration
access to voting materials in different
languages
Tenants voter registration
Person’s Living Alone Plan Your Vote tool
Starting outreach earlier than in 2014, will give staff more time to connect with people in low
voting communities and demographics, while also having a presence at larger events to get
information to all eligible voters. Based on the demographic data and turnout numbers in 2014,
targeted outreach should be focused on reaching people in the following areas: Downtown,
Renfrew-Collingwood, Victoria-Fraserview, Marpole, Oakridge, and Strathcona.
It is recommended that the first phase of outreach start in May, 2018, and focus primarily on
increasing voter registration, and having people update their information, as well as activities
that increase general knowledge of the role of municipal government. Activities during this
phase will be most effectively targeted to youth, new Canadians, areas with high proportions of
renters and people who registered at voting stations in 2014.
It is recommended that the second outreach phase run from September, 2018 to Election Day.
Activities during this phase should be focused on informing all residents of basic voter
information, including when, where, and the different ways to vote. During this phase outreach
staff should take iPads to events and encourage people to use the City’s Plan Your Vote tool that
assists with selecting a voting location and candidates. Outreach events and locations should be
selected based on having high foot traffic to reach a large number of residents or the ability to
reach people in low voting demographics.

54
While public outreach is taking place, staff should maintain regular contact with community
organizations informing them of key initiatives, encouraging the distribution materials through
their networks, and requesting assistance to identify events to attend and opportunities to give
election presentations. It is recommended that the election office pilot service agreements with
community organizations to run peer based outreach programs encouraging voter registration
and use of the Plan Your Vote tool. Peer based outreach will be most effectively targeted to
communities that the outreach team will have trouble connecting with due to trust issues, as well
as cultural and language barriers; recommended communities for the pilot program are urban
Aboriginal people and new citizens.
7.3 Program Evaluation
To track and evaluate outreach performance staff should record counts of important activities
such as events attended and people talked to; number of partner organizations supporting
outreach; amount of informational materials distributed; and people who registered to vote or
used the Plan Your Vote tool at an outreach event. These quantitative activity counts can be
further analyzed by tracking outreach provided in different languages and targeted to specific
neighbourhoods and demographics. The election office can also track number of barriers to
voting identified through outreach that were addressed in time for the election.
It is recommended that the election office hire a company to conduct a scientifically valid post-
election survey that is representative of Vancouver residents. The survey should be designed to
better understand reasons for electors voting or not voting; voter experience and satisfaction with
the voting process; barriers that are preventing people from voting; and knowledge of the
election and sources of information. Conducting post-election surveys and benchmarking data
will help make future outreach programs more strategic and data driven, as staff will be able
track changes in participation in target demographics, increases or reductions in reported
barriers, and the effectiveness of different information sources for increasing voter knowledge.

55
8.0 Moving Forward: Implementing the Recommendations and Meeting the
Preferred Outcomes
Implementing the recommendations in this report will require considerable lead time, as well as
staff and financial resources. Table 8 shows a high-level outline for a project plan to implement
the recommendations between January to Election Day on October 20th, 2018.
Table 8: Project plan for implementing the outreach recommendations in this report
Activity Timeline Resources Outcomes
Hold focus groups
with City Advisory
Committees and
survey partner
organizations on
barriers to voting
and suggestions for
outreach program
January-February,
2018: Survey open
and hold focus
groups
March, 2018:
Report on key
findings and
recommend actions
that can be taken in
time for the
election
Outreach staff to
run focus groups
Online survey
program
Improve engagement with
low-voting
communities/demographics
Reduce barriers for voters
Be strategic and data
driven
Develop collateral
materials and
include feedback
from focus groups
in design
Have materials
translated into
Cantonese,
Mandarin, Punjabi,
and Tagalog
February-May,
2018
Budget for graphic
designer and
printing
Provide accessible and
timely information
Increase public awareness
of election & positive
social cues
Engage with the
public at events and
in public spaces
Deliver
presentations on
election
information with
partner
organizations
March-April, 2018:
Hire and train
outreach staff
May-August, 2018:
Promote
registration and
civic education
August-October 20,
2018: Promote Plan
Your Vote tool and
Salaries for
multilingual staff to
do 570 hours of
public outreach
Training for
outreach staff
Tablets for staff to
do voter registration
and use Plan Your
Vote tool
Provide accessible and
timely information
Increase public awareness
of election & positive
social cues
Increase knowledge of
municipal government
responsibilities

56
information on how
to vote
Branded outreach
booth and uniforms
for staff
SWAG items to
incentivize people
to register or use
Plan Your Vote tool
Improve engagement with
low-voting
communities/demographics
Increase number of
registered voters
Increase use of Plan Your
Vote tool
Work with
community
organizations to
increase election
awareness, voter
registration, and the
distribution of
informational
materials
January-February,
2018: Survey
organizations to
identify populations
served, barriers and
preferred types of
outreach support
May-October 17,
2018: Accept
requests from
community
organizations to do
outreach at events
and give
presentations
September, 2018:
Host Voter
Engagement
Design Lab for
non-partisan
organizations to
coordinate get out
the vote activities
September, 2018:
Distribute election
collateral to partner
organizations
Online form for
partners to request
outreach staff
attend an event or
give a presentation
Provide accessible and
timely information
Improve engagement with
low-voting
communities/demographics
Reduce barriers for voters
Contract
organizations that
have experience
engaging people in
low-voting
demographics like
January-April,
2018: Request for
proposals and
procurement
Budget for
contracts
Provide accessible and
timely information
Improve engagement with
low-voting
communities/demographics

57
Civix, Check Your
Head, and Samara
September to
October 20, 2018:
Program operation
Increase public awareness
of election & positive
social cues
Pilot service
agreements with
community
organizations to run
peer- based
outreach programs
targeted to new
citizens and
Indigenous people
February, 2018:
Call for proposals
from community
organizations
July, 2018: Voter
registration drive
Sept 20-Oct 20,
2018: Plan Your
Vote promotion
Budget for
contracts
Training and access
to City of
Vancouver election
collateral materials
Provide accessible and
timely information
Improve engagement with
low-voting
communities/demographics
Increase public awareness
of election & positive
social cues
Post-election
survey of voters
and non-voters
January-April,
2018: Procurement
and survey design
October 21-
November 5, 2018:
Survey voters and
non-voters
Budget to hire
company to conduct
a scientifically valid
post-election survey
that is
representative of
the diversity of
Vancouver
residents
Reduce barriers for voters
Increase ability to be
strategic and data driven in
future elections
An important feature of the outreach plan presented in Table 8 is the collection of data that will
allow staff to better evaluate the outreach program and understand the impact of activities.
Collecting data for the first time with a post-election survey will allow election staff to establish
benchmarks that can be tracked over future elections. Recommended benchmarks to monitor
include changes in participation within target demographics, increases or reductions in reported
barriers, and the effectiveness of different information sources for increasing voter knowledge.
Tracking and analyzing changes in survey data after each future election will increase the ability
of election staff to evaluate connections between outreach activities and outcomes. Benchmarked
survey data can be used to identify cause and effect relationships between demographic variables
and turnout, as well as outreach activities and turnout. Identifying cause and effect relationships
will allow staff to better evaluate the effectiveness of outreach activities and direct resources in
future outreach programs accordingly.

58
9.0 Conclusion
The objective of this research project was to examine political participation and voter
engagement through public outreach campaigns, in order to develop recommendations for a
Vancouver-specific outreach strategy to increase participation in the 2018 civic election. Data for
this report was gathered through a literature review identifying key theories and studies of voter
behaviour and participation, and analysis of demographic and social indicators in local areas
around Vancouver in relation to voter turnout. In addition, interviews were conducted with
election outreach managers working in government election offices to learn about their processes
for planning, operating, and evaluating election outreach campaigns.
The literature review identified a number of key concepts and theoretical frameworks of voter
behaviour, along with demographic and social determinants that effect turnout. The review
revealed a diversity of theories related to voter behaviour, which position voter decisions as
dynamic and influenced by a range of social, demographic, and political factors. Based on this
research it is the author’s conclusion that outreach cannot be done effectively without
understanding the various barriers and motivations experienced by people in different
demographic and socioeconomic groups, and how these factors influence trends in participation.
Demographic and social indicator data for local areas in Vancouver was analyzed and compared
to voter turnout in the 2014 election to understand how smart practices from the literature review
and jurisdictional scans can be adapted to work in the Vancouver context. Analysis found
correlations between higher rates of voter turnout and neighbourhoods with older populations, as
well as areas with higher household incomes and education levels. Analysis also showed that
turnout tended to be lower in neighbourhoods with higher proportions of young people, new
citizens, people who do not speak English, and renters. The findings from the demographic and
socioeconomic analysis of voters in Vancouver was used to recommend a targeted strategy for
doing outreach to underrepresented demographics and areas of the city.
The smart practices identified in the jurisdictional scans provided rich information about current
election outreach practices and specific examples of outreach activities that can be used to reach
all eligible voters, as well as people in populations with high barriers to voting. Importantly the
jurisdictional scan revealed a core set of outreach activities common to the four programs studied
that include consulting with community organizations and service providers to identify barriers;
increasing the availability of information and positive social cues to vote by sending outreach
staff to events and busy public spaces; and forming partnerships with community and non-profit
organizations to increase the distribution of information and reach people in underrepresented
groups.
The research in this report confirms that outreach can be used to reduce barriers to voting
including lack of knowledge and information, socioeconomic and physical access barriers, and
negative attitudes towards the political system. The studies in the literature review and smart
practices identified in the jurisdictional scan have demonstrated how outreach programs can be
designed to address a broad range of barriers to political participation and it is the
recommendation of the author that the outreach activities listed below be included in the City of
Vancouver’s 2018 election outreach program.

59
Key Recommendations
Develop a project plan to implement the recommendations in this report that includes
project timeline, required staff and roles, budget and other required resources.
Conduct focus groups with City of Vancouver advisory committees and survey local
community organizations ahead of the election to improve engagement and collect
recommendations for reducing barriers to voting.
Hire a team of culturally diverse and multilingual outreach staff to attend community
events to register voters; educate residents on the roles and responsibilities of the City of
Vancouver and elected officials; promote the City’s Plan Your Vote tool; and distribute
information on how to vote.
Work with community organizations to increase election awareness, voter registration,
and the distribution of informational materials.
Conduct targeted outreach to populations with low voter turnout, including young adults
(18-34); Indigenous peoples; new citizens; people who do not speak English; people who
have low incomes or are homeless; persons with disabilities; renters; and people who are
socially isolated.
Consider paid partnerships with organizations that have experience engaging people in
low voting demographics like Civix, Check Your Head, and Samara.
Pilot service agreements with community organizations to run peer-based outreach
programs targeted to communities that are harder to reach through traditional outreach
channels due to trust issues, as well as cultural and language barriers.
Increase outreach in neighbourhoods that had the lowest rates of voter turnout in the 2014
election: Downtown, Renfrew-Collingwood, Victoria-Fraserview, Marpole, Oakridge,
and Strathcona.
Hire a company to conduct a scientifically valid post-election survey that is
representative of Vancouver residents, to better understand reasons for electors voting or
not voting; voter experience and satisfaction with the voting process; barriers that are
preventing people from voting; and knowledge of the election and sources of
information.
60
References
Assembly of First Nations. (2016). Facilitating First Nation Voter Participation for the 42nd
General Election. Retrieved August 6, 2017, from
http://www.elections.ca/res/rec/eval/pes2015/afn/afn_e.pdf
Beebe, J. & Marti, J. (2015). Vote Pop Up: Igniting Voter Participation in the 42nd General
Election. Retrieved August 6, 2017, from
https://issuu.com/samaracanada/docs/samara_vote_popup_report_2015/1?ff=true&e=146
83212/32144868
Bennett, S., & Resnick, D. (1990). The Implications of Nonvoting for Democracy in the United
States. American Journal of Political Science, 34(3), 771-802. doi:10.2307/2111398
Black, Jerome. (2001). Immigrants and Ethnoracial Minorities in Canada: A Review of their
Participation in Federal Electoral Politics. Retrieved June 11, 2017, from
http://www.elections.ca/content.aspx?section=res&dir=eim/issue4&document=p4&lang=
e
Bond, R. M., Fariss, C. J., Jones, J. J., Kramer, A. I., Marlow, C., Settle, J. E., & Fowler, J. H.
(2012). A 61-million-person experiment in social influence and political
mobilization. Nature, 489(7415), 295. doi:10.1038/nature11421
Bryan, C., Walton, G., Rogers, T., & Dweck, C. (2011). Motivating voter turnout by invoking
the self. Proceedings of the National Academy of Sciences of the United States of
America, 108(31), 12653-12656. Retrieved from
http://www.jstor.org.ezproxy.library.uvic.ca/stable/27979066
Campbell, A. (1954). The voter decides. Evanston, Ill.: Row, Peterson. Retrieved August 17,
2017, from https://hdl.handle.net/2027/mdp.39015057170832
Chan, K. (2014). Voter turnout for Vancouver municipal election highest since 2002. Retrieved
August 17, 2017, from http://www.vancitybuzz.com/2014/11/voter-turnout-vancouver-
municipal-election-increases-44/
City of Vancouver. (2015a). Vancouver Demographic Profile. Retrieved August 26, 2017, from
http://vancouver.ca/files/cov/factsheet2-home-for-everyone.PDF
City of Vancouver. (2015b). Making Ends Meet and Working Well. Retrieved August 26, 2017,
from http://vancouver.ca/files/cov/factsheet5-making-ends-meet.PDF
City of Vancouver. (2015c). Cultivating Connections. Retrieved August 26, 2017, from
http://vancouver.ca/files/cov/factsheet7-cultivating-connections.PDF

61
City of Vancouver. (2015d). A Home For Everyone. Retrieved August 26, 2017, from
http://vancouver.ca/files/cov/factsheet2-home-for-everyone.PDF
City of Vancouver. (2014, October 14). Vancouver’s Historical Voter Turnout [Tumblr].
Retrieved from http://cityofvancouver.tumblr.com/post/100020801267/we-had-the-data-
so-we-made-it-visible-heres
Coppock, A. and Green, D. P. (2016), Is Voting Habit Forming? New Evidence from
Experiments and Regression Discontinuities. American Journal of Political Science, 60:
1044–1062. doi:10.1111/ajps.12210
Dale, A., & Strauss, A. (2009). Don't Forget to Vote: Text Message Reminders as a Mobilization
Tool. American Journal of Political Science, 53(4), 787-804. Retrieved from
http://www.jstor.org.ezproxy.library.uvic.ca/stable/20647951
Dalton, R. J. (2008), Citizenship Norms and the Expansion of Political Participation. Political
Studies, 56: 76–98. doi:10.1111/j.1467-9248.2007.00718.x
Elections Canada. (2016). Turnout and Reasons for Not Voting During the 42nd General
Election: Results from the Labour Force Survey. Retrieved May 31, 2017, from
http://www.elections.ca/content.aspx?section=res&dir=rec/eval/pes2015/lfs&document=i
ndex&lang=e
Elections Canada. (2015). The Electoral Reminder Program and information to specific groups
of electors. Retrieved May 8, 2017, from
http://www.elections.ca/content.aspx?section=ele&dir=erp&document=index&lang=e
Election Services. (2014a). 2014 Toronto Election Report. Retrieved August 3, 2017, from
https://www1.toronto.ca/City%20Of%20Toronto/City%20Clerks/Elections/Library/Files/
Reports/PostElectReport_Jan2016.pdf
Election Services. (2014b). 2014 Municipal Election Report on Accessibility. Retrieved August
3, 2017, from
https://www1.toronto.ca/City%20Of%20Toronto/City%20Clerks/Elections/Accessibility/
Files/final_2014_accessibility_report.pdf
Engaged City Task Force. (2014). Engaged City Task Force Final Report. Retrieved from
http://vancouver.ca/files/cov/final-report-engaged-city-task-force-2014.pdf
Gerber, A., & Rogers, T. (2009). Descriptive Social Norms and Motivation to Vote: Everybody's
Voting and so Should You. The Journal of Politics, 71(1), 178-191.
doi:10.1017/S0022381608090117
Get Ready to Vote. (n.d.). Retrieved August 6, 2017, from
http://www.elections.ca/content.aspx?section=vot&dir=fir/getready&document=index&l
ang=e

62
Gludovátz, N. (2012). The Non-voting Majority: A Study of Non-voting in the 2011 Vancouver
Municipal Election. Retrieved from https://dspace.royalroads.ca/handle/10170/585
Hagiwara, R. (2017). Independent Election Task Force Report – Report Back. Retrieved July 4,
2017, from: http://council.vancouver.ca/20170628/documents/pspc1.pdf
Healthy City Strategy. (2015). Healthy City Strategy – Four Year Action Plan. Retrieved from
http://vancouver.ca/files/cov/Healthy-City-Strategy-Phase-2-Action-Plan-2015-2018.pdf
Hughes, D. (2016). Survey of Electors Following the 42nd General Election. Retrieved August 6,
2017, from http://www.elections.ca/res/rec/eval/pes2015/surv/surv_e.pdf
Independent Election Task Force (2017). Independent Election Task Force Final Report.
Retrieved from: http://council.vancouver.ca/20170124/documents/rr3AppendixA.pdf
Independent Election Task Force. (n.d.). Retrieved April 15, 2017, from
http://vancouver.ca/your-government/election-task-force.aspx
Ipsos. (2014). City of Toronto Municipal Election 2014 Post Election Survey. Retrieved August
3, 2017, from
https://www1.toronto.ca/wps/portal/contentonly?vgnextoid=e30d3a919246c510VgnVC
M10000071d60f89RCRD
Ladner, Kiera. (2003). The Alienation of Nation: Understanding Aboriginal Electoral
Participation. Retrieved June 11, 2017, from
http://elections.ca/res/rec/part/paper/aboriginal/aboriginal_e.pdf
Lambert, R. D., Curtis, J. E., Kay, B. J., & Brown, S. D. (1988). The social sources of
political knowledge. Canadian Journal of Political Science / Revue Canadienne De
Science Politique, 21(2), 359-374.
MacKenzie, J. (2015). 2014 Municipal Election Review. Retrieved from
http://council.vancouver.ca/20150721/documents/a4.pdf
Manela, Roger and David Moxley (2002). Best Practices as Agency-Based Knowledge in Social
Welfare. Administration in Social Work 26 (4):1-23
Michels, A. (2011). Innovations in democratic governance: how does citizen participation
contribute to a better democracy? International Review of Administrative
Sciences. 77(2), 275 – 293.
Nakhaie, M. R. (2006). Electoral participation in municipal, provincial and federal elections in
Canada. Canadian Journal of Political Science, 39(2), 363. Retrieved from
http://search.proquest.com.ezproxy.library.uvic.ca/docview/204610557?accountid=14846
Nickerson, D., & Rogers, T. (2010). Do You Have a Voting Plan? Implementation Intentions,
Voter Turnout, and Organic Plan Making. Psychological Science, 21(2), p. 194 – 199.
10.1177/0956797609359326

63
Nickerson, D. (2008). Is Voting Contagious? Evidence from Two Field Experiments. The
American Political Science Review, 102(1), 49-57. Retrieved from
http://www.jstor.org.ezproxy.library.uvic.ca/stable/27644497
Office of the Chief Electoral Officer. (2016a). 2016-17 Report On Plans and Priorities. Retrieved
August 6, 2017, from http://www.elections.ca/res/rep/rpp/rpp2016/rpp2016_e.pdf
Office of the Chief Electoral Officer. (2016b). 2016-17 Report On the 42nd General Election of
October 19, 2015. Retrieved August 6, 2017, from
http://www.elections.ca/res/rep/off/sta_2015/pdf/stat_report2015_e.pdf
Office of the Chief Electoral Officer. (2016c). Retrospective Report on the 42nd General Election
of October 19, 2015. Retrieved August 6, 2017, from
http://www.elections.ca/res/rec/eval/pes2015/ege/pdf/ege_e.pdf
O’Neill, B. (2006). Human Capital, Civic Engagement and Political Participation: Turning Skills
and Knowledge into Engagement and Action. Retrieved June 9, 2017, from
https://www.researchgate.net/publication/255589258_Human_Capital_Civic_Engagemen
t_and_Political_Participation_Turning_Skills_and_Knowledge_into_Engagement_and_A
ction
Our mission, mandate, values. (n.d.). Retrieved August 6, 2017, from
http://www.elections.ca/content.aspx?section=abo&dir=mis&document=index&lang=e
Overman, E. & Boyd, J. (1994). “Best Practice Research & Postbureaucratic Reform.” Journal of
Public Administration Research & Theory 4 (1):67-83
Pammett, J., & LeDuc, L. (2003). Explaining the Turnout Decline in Canadian Federal Elections:
A New Survey of Non-voters. Retrieved May 28, 2017 from
http://www.elections.ca/res/rec/part/tud/TurnoutDecline.pdf
Pasek, J., Feldman, L., Romer, D., & Jamieson, K. (2008). Schools as Incubators of Democratic
Participation: Building Long-Term Political Efficacy with Civic Education, Applied
Developmental Science, 12:1, 26-37, DOI: 10.1080/10888690801910526
Rogers, T., Gerber, A. S., & Fox, C. R. (2012). Rethinking Why People Vote: Voting as
Dynamic Social Expression. In Behavioral Foundations of Policy. Retrieved June 17,
2017, from https://scholar.harvard.edu/todd_rogers/publications/rethinking-why-people-
vote-voting-dynamic-social-expression
Patton, M. (2015). Qualitative Research & Evaluation Methods. Thousand Oakes, United States
of America.
Smets, K., and Ham, C. (2013). The embarrassment of riches? A meta-analysis of individual-
level research on voter turnout, Electoral Studies, Volume 32, Issue 2, June 2013,
Pages 344-359, ISSN 0261-3794, https://doi.org/10.1016/j.electstud.2012.12.006
Southwell, P. L., & Everest, M. J. (1998). The electoral consequences of alienation:

64
Nonvoting and protest voting in the 1992 presidential race. The Social Science Journal,
35(1), 43-51.
Statistics Canada. 2017. Vancouver, CY [Census subdivision], British Columbia and Canada
[Country] (table). Census Profile. 2016 Census. Statistics Canada Catalogue no. 98-316-
X2016001. Ottawa. Released February 8, 2017. http://www12.statcan.gc.ca/census-
recensement/2016/dp-pd/prof/index.cfm?Lang=E (accessed April 14, 2017).
Statistics Canada. 2012. Vancouver, British Columbia (Code 5915022) and Canada (Code 01)
(table). Census Profile. 2011 Census. Statistics Canada Catalogue no. 98-316-XWE.
Ottawa. Released October 24, 2012. http://www12.statcan.gc.ca/census-
recensement/2011/dp-pd/prof/index.cfm?Lang=E (accessed April 14, 2017).
Stewart, K., MacIver, P., & Young, S. (2008). Testing and Improving Voters' Political
Knowledge. Canadian Public Policy / Analyse De Politiques, 34(4), 403-417. Retrieved
from http://www.jstor.org.ezproxy.library.uvic.ca/stable/25463631
Turcotte, M. (2015). Spotlight on Canadians: Results from the General Social Survey. Retrieved
May, 20, 2017, from http://www.statcan.gc.ca/pub/89-652-x/89-652-x2015006-eng.htm
Uppal, S. & LaRochelle-Côté, S. (2015). Factors Associated With Voting. Retrieved May 11,
2017, from http://www.statcan.gc.ca/pub/75-001-x/2012001/article/11629-
eng.htm#archer
Verba, S. (1967). Democratic Participation. The Annals of the American Academy of Political
and Social Science, 373, 53-78. Retrieved from
http://www.jstor.org.ezproxy.library.uvic.ca/stable/103735
Voter Turnout at Federal Elections and Referendums. (n.d.). Retrieved August 6, 2017, from
http://www.elections.ca/content.aspx?section=ele&dir=turn&document=index&lang=e
Walliman, N. (2005). Your Research Project (2nd ed.). London, England: Sage Publications.
Young, S. (2006). Vancouver's informed electorate: Voter knowledge in the 2005 municipal
election. Retrieved June 17, 2017, from http://summit.sfu.ca/item/2364
4 Ways to Vote. (n.d.). Retrieved August 6, 2017, from
http://www.elections.ca/content.aspx?section=vot&dir=fir/ways&document=index&lang
=e

65
Appendices
Appendix 1: Historical chart o voter turnout in Vancouver elections.
(City of Vancouver, 2014)

66
Appendix 2: Frequency distribution of voter turnout for all variables.
(Nakhaie, 2006, pgs. 372 & 373)

67
Appendix 3: Reasons for not voting in the 2015 federal election.
(Elections Canada, 2016, p. 3)

68
Appendix 4: Factors associated with the probability of having voted in the 2013 federal election.
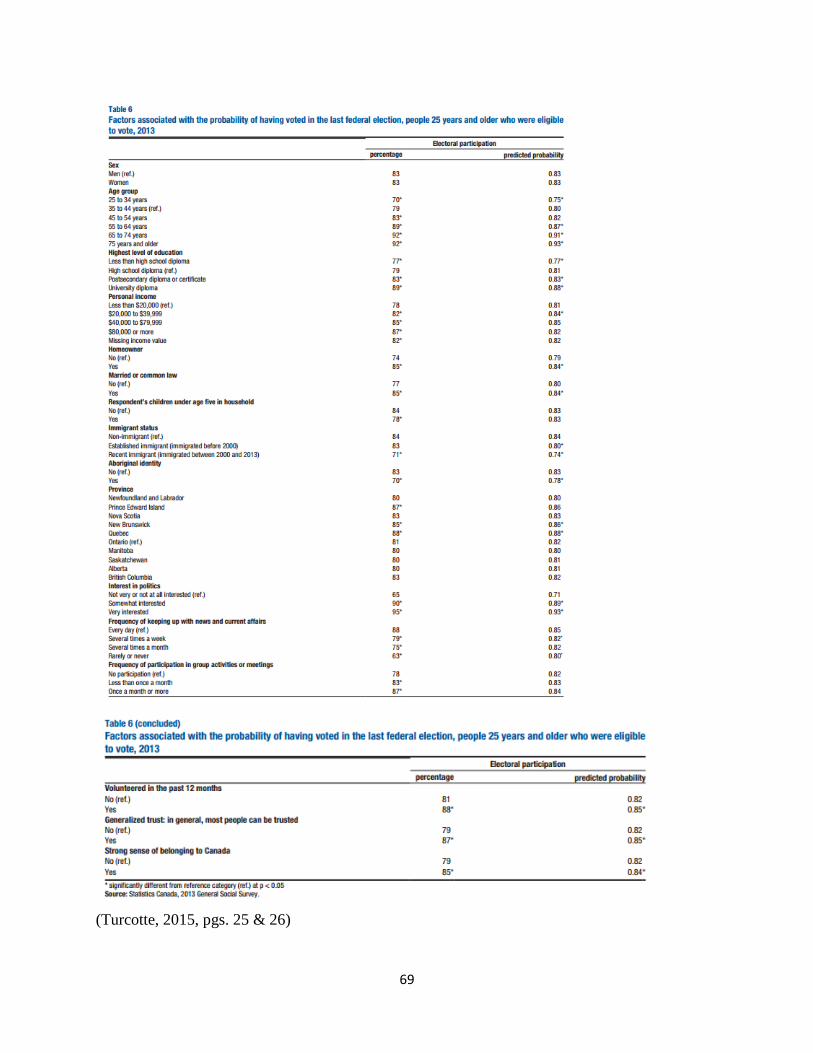
69
(Turcotte, 2015, pgs. 25 & 26)

70
Appendix 5: Canadians who voted in the 2013 federal election, by age group and level of
education.
(Turcotte, 2015, p. 14)

71
Appendix 6: Invitation to Participate in Master’s Project.
Dear [Name]
I would like to invite you to participate in a study entitled Getting Out The Vote: Strategies to Increase
Voter Turnout In the 2018 City of Vancouver Election. The client for the study is the City of Vancouver
and the research is being conducted as part of the requirements for me to receive a Master of Public
Administration from the University of Victoria.
The purpose of this research project is to address low voter turnout in Vancouver’s civic elections. The
research question the report will address is: How can the City of Vancouver engage citizens to increase
voter turnout past 43.4% in the 2018 civic election?
You have been selected to participate based on the voter engagement work you did in [location and
date of campaign]. If you choose to participate the researcher would like interview you about your work
on the voter engagement campaign and share documentation that will aid in the analysis of patterns of
effectiveness.
The final report will use academic research on theories of voter engagement, and case studies of
successful voter outreach campaigns, to inform an outreach strategy that City staff can implement to
increase public engagement and voter turnout in the 2018 municipal election.
If you’re interested in participating or have additional questions, you can contact me at 604-362-1690 or
email [email protected]. All potential participants will be sent a Participant Consent Form to
sign before any data is collected.
Sincerely,
Paul Hendren
Election Outreach Lead
City of Vancouver
604-362-1690

72
Appendix 7: Jurisdictional scan participant interview questions.
Planning
1. What were the goals and objectives for the voter engagement campaign?
2. Which barriers to voting was the campaign designed to address?
3. Which target demographics was the campaign designed to engage?
4. How were target demographics identified?
5. How were activities and messages tailored to engage people in the target demographics?
6. What was the budget for the campaign?
7. How many staff worked on the campaign and what were their roles?
8. Which other departments in the organization provided support?
9. What was the timeline for implementing the campaign?
Operation
1. What types of outreach activities were implemented as part of the campaign?
2. What were the key messages and communication channels used in the campaign?
3. How were online and digital tools incorporated as part of the campaign?
4. How did you involve non-profit organizations and community groups in the campaign?
Review
1. How did you measure the success of the campaign?
2. How did the public respond to the campaign?
3. What feedback did your receive from partner organizations?
4. Was the budget sufficient for meeting the campaign goals and objectives? If not, how
much would you add to the budget and what would the extra funds be spent on?
5. Was the timeline sufficient for meeting the campaign goals and objectives? If not, what
would be an optimal timeline?
6. What was the most successful aspect of the campaign?
7. What changes would you make if you were to run the campaign again?

73
Appendix 8: Map of registered voter turnout by local area in Vancouver for the 2014 election.
(MacKenzie, 2015, p. 2)

74
Appendix 9: Map of age distributions across Vancouver neighbourhoods.
(City of Vancouver, 2015a, p. 11)
Appendix 10: Voter turnout by age in the 2014 Vancouver election.
(Personal communication, 2014)
0.00%
10.00%
20.00%
30.00%
40.00%
50.00%
60.00%
70.00%
0
10,000
20,000
30,000
40,000
50,000
60,000
70,000
80,000
90,000
100,000
18-24 25-34 35-44 45-54 55-64 65-74 75+
Total Voted Total Registered Electors Percentage Voter Turnout

75
Appendix 11: Persons with Aboriginal identity across Vancouver neighbourhoods.
(Personal communication, May 14, 2017)
Appendix 12: Percentage of persons who immigrated to Vancouver in the last five years across
neighbourhoods
(City of Vancouver, 2015a, p. 26)

76
Appendix 13: Top ten languages spoken at home in Vancouver.
(Personal communication, May 14, 2017)
Appendix 14: Percentage of population without knowledge of English or French by local area in
Vancouver.
(City of Vancouver, 2015a, p. 29)

77
Appendix 15: Percent of Vancouver population in bottom 10% of Canada-wide family incomes
by local area.
(City of Vancouver, 2015b, p. 7)
Appendix 16: Percentage of persons living alone across Vancouver neighbourhoods.
(City of Vancouver, 2015a, p. 18)
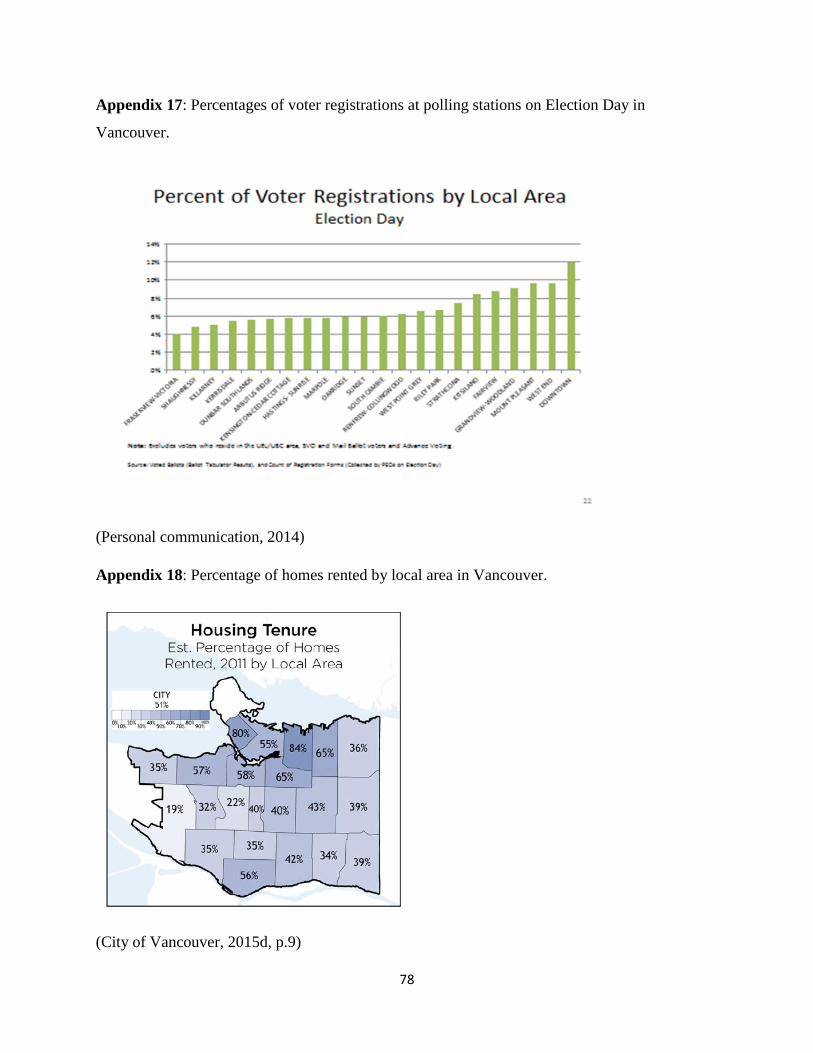
78
Appendix 17: Percentages of voter registrations at polling stations on Election Day in
Vancouver.
(Personal communication, 2014)
Appendix 18: Percentage of homes rented by local area in Vancouver.
(City of Vancouver, 2015d, p.9)
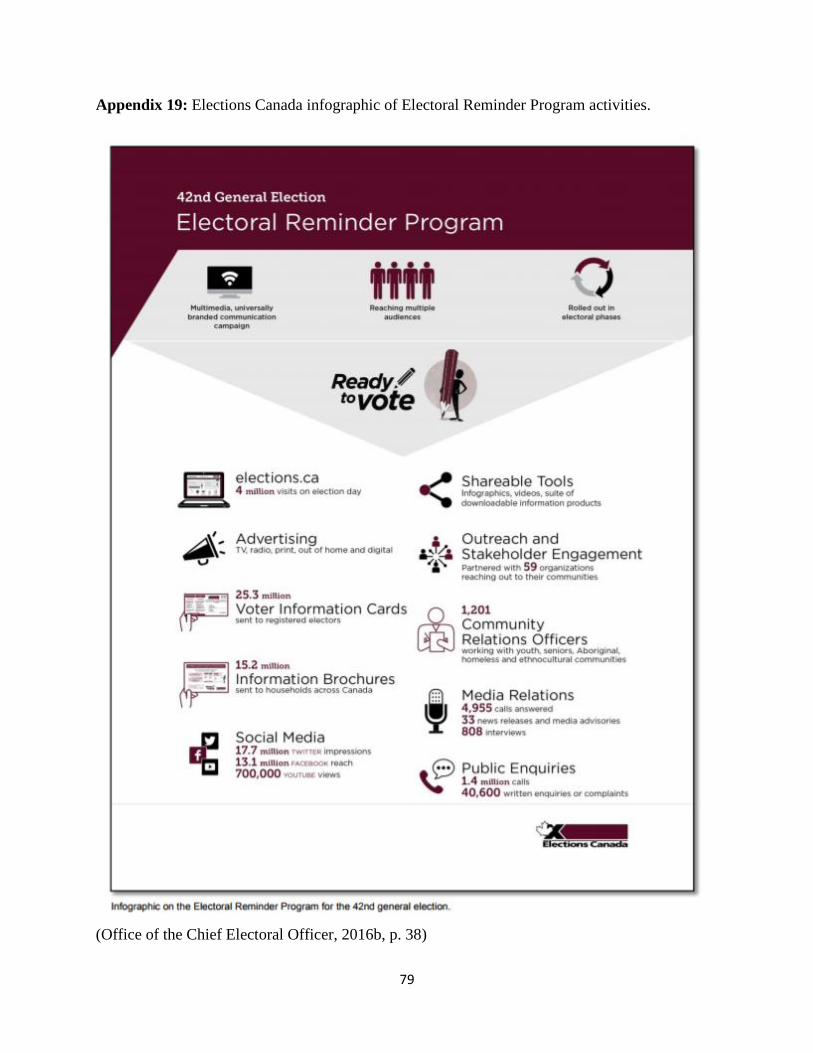
79
Appendix 19: Elections Canada infographic of Electoral Reminder Program activities.
(Office of the Chief Electoral Officer, 2016b, p. 38)

80
Appendix 20: Elections Canada ‘Ready to Vote’ flyer used in 42nd General Election
(Get Ready to Vote, n.d.)
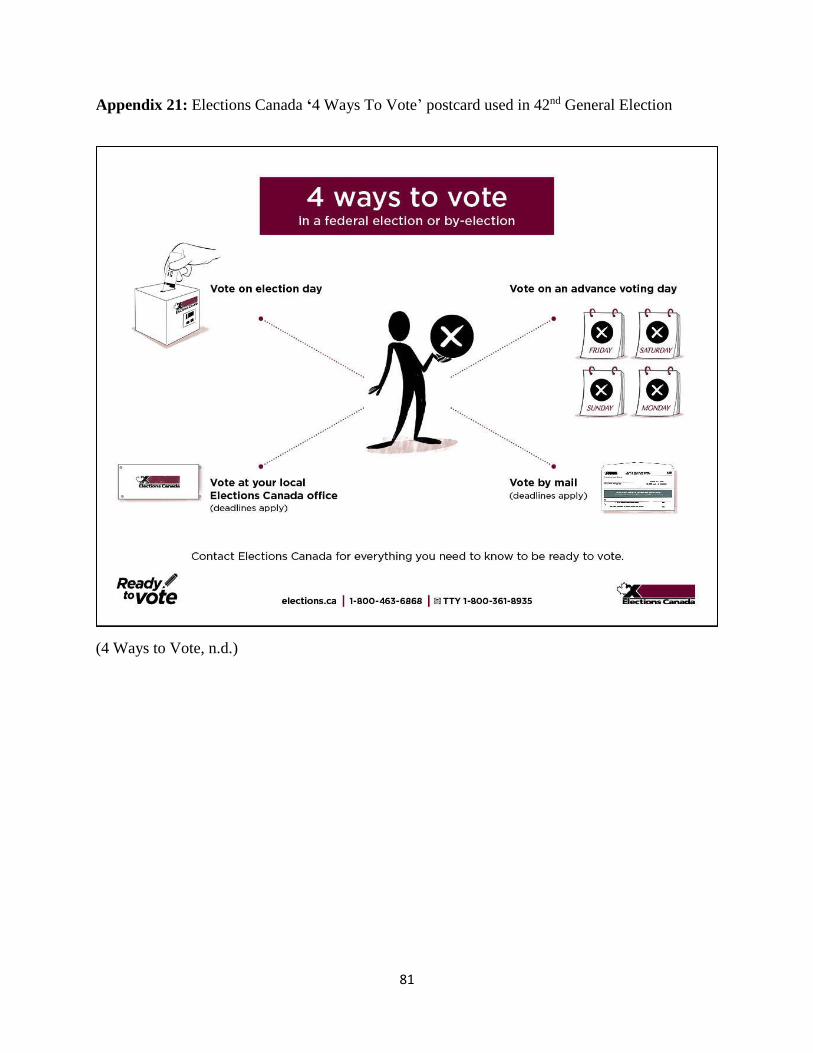
81
Appendix 21: Elections Canada ‘4 Ways To Vote’ postcard used in 42nd General Election
(4 Ways to Vote, n.d.)

82
Appendix 22: Elections BC outreach and public education program organization diagram.
(A. Foster, personal communication, May 8, 2017).
2017 Strategic Outreach and
Public Education Program
HQ Outreach
Formal partnerships, YATB and meetings
with community groups, etc.
Communications
Public information, advertising & social
media etc.
Electoral Operations
D2D, registration drives, youth and
cultural outreach etc.

83
Appendix 23: Image from the First Nations Leadership Council, 2017 BC Election package.
(A. Foster, personal communication, May 8, 2017).
Appendix 24: Number of youth election workers in provincial general election (2005-2017).
2017 2013 2009 2005
Total # of
officials 23,369 33,106 35,684 29,531
# under age 19 4,348 2,924 1,844 2,106
% under age 19 19% 9% 5% 7%

84
Appendix 25: Communications and outreach graphs from City of Toronto, 2014 election.
(Election Services, 2014a, p. 48)

85
Appendix 26: Summary of City of San Francisco election outreach activities
July 1-Novermber 8, 2016
(J. Fox, personal communication, July 5, 2017, p. 24)
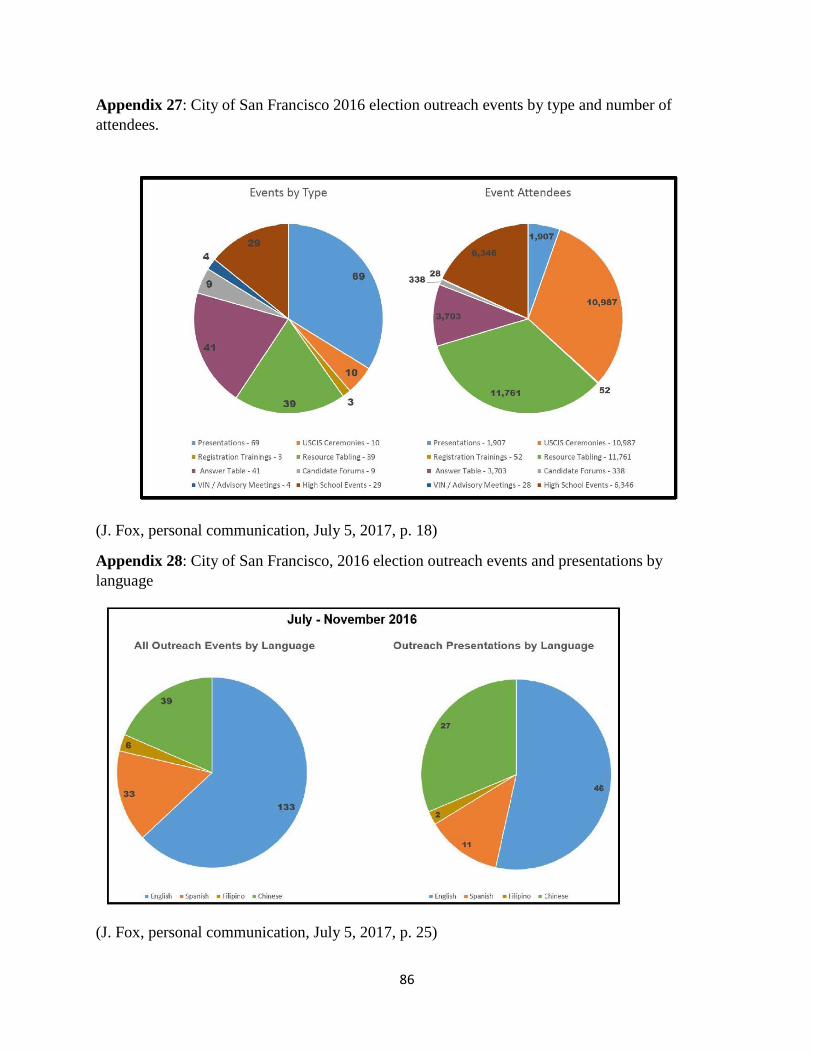
86
Appendix 27: City of San Francisco 2016 election outreach events by type and number of
attendees.
(J. Fox, personal communication, July 5, 2017, p. 18)
Appendix 28: City of San Francisco, 2016 election outreach events and presentations by
language
(J. Fox, personal communication, July 5, 2017, p. 25)

87