Embed Size (px)
Citation preview

Getting More from Lean and
Six Sigma Projects by
Engaging Employees through
Visual Communication
Lab Quality Confab 2014
CS-PATHway
Today’s Speaker Christine Nyght PhD Quality Manager Department of Pathology and Laboratory Medicine Cedars-Sinai Medical Center Lean Six Sigma Master Black Belt Acknowledgements • Co-Author: V Kazarov MBA, Manager of Anatomic Pathology • D Frishberg MD, Vice-Chair of AP • M Amin MD, Chairman • K Clark MHA, Administrative Director • 500 Employees • 70 MDs and PhDs
2
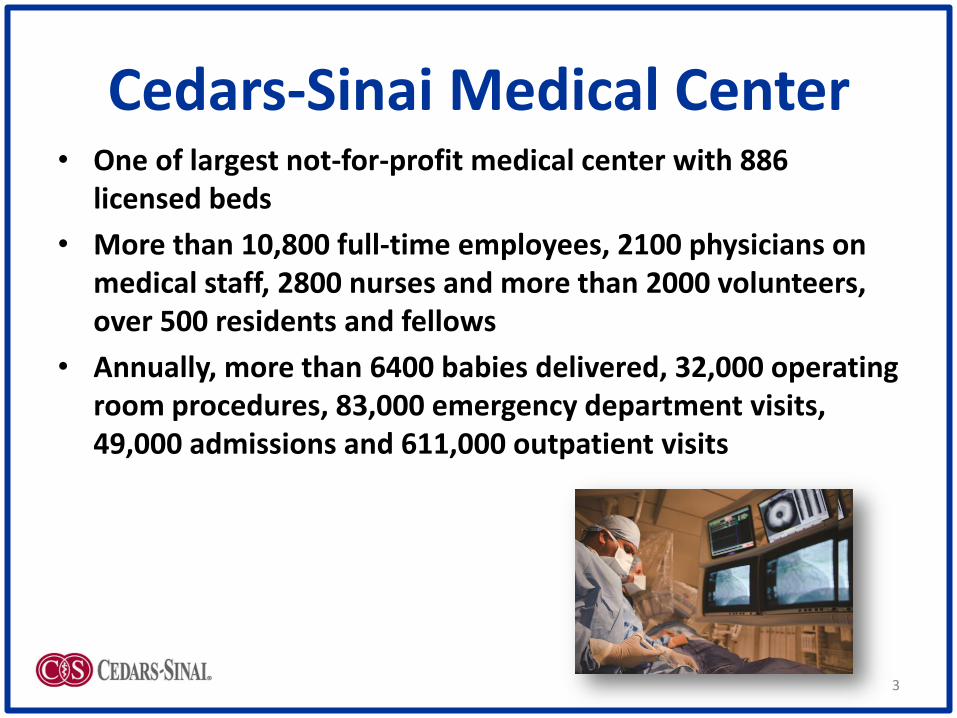
Cedars-Sinai Medical Center • One of largest not-for-profit medical center with 886
licensed beds
• More than 10,800 full-time employees, 2100 physicians on medical staff, 2800 nurses and more than 2000 volunteers, over 500 residents and fellows
• Annually, more than 6400 babies delivered, 32,000 operating room procedures, 83,000 emergency department visits, 49,000 admissions and 611,000 outpatient visits
3

Serving the Los Angeles community
4

Recognized as a Leading Hospital
5

Department of Pathology and Laboratory Medicine
• 5 million tests
• 170 outreach requisitions
• Full service anatomic pathology services, including >1000 heart biopsies per year
• Core competency: Clinical Effectiveness
• Quality Systems, Lean and
Six Sigma are core strategies
for “Performance Excellence”
(Value Creation & Delivery)
CS-PATHway 6

QMS based on CLSI guidelines
CS-PATHway
Lean and Quality Management Systems are complementary
7

QMS Provides Stability for Improvement
Stability in 4’Ms required 8

What is employee engagement?
What is visual communication?
What is visual management?
Benefits of visual display
Examples of visual display
CS-PATHway
Today’s Agenda
Engagement/Empowerment is a cultural enabler for Lean Culture.
9

Improvements in healthcare often involve
developing organizational capabilities
Communication with the workforce is essential
for aligning improvement strategies to day-to-
day operations
Employee
engagement is a
critical factor that
can determine
success or
failure.
Background
10

• Commitment, both
emotional and intellectual,
to accomplish work,
mission, and vision of the
organization.
• Contributing factors are
multifactorial such as
trust, motivation,
communication,
development,
recognition, etc.
What is Employee Engagement?
11

• Visual Communication is any device used in the work environment to tell us at a glance how work should be done and whether it is deviating from the standard i.e. gaps: target vs. actual
• What can we monitor visually? Almost anything:
Quality performance:
Productivity
Safety
Efficiency
Accuracy
Employee Performance:
Absenteeism
Interaction
Communication
Teamwork
Visual Communication
12

• Step 1: Displaying goals and objectives in the
workplace
• In this day of computerized reports, often
communication is ineffective, with frontline
employees having no link between activity and
organizational objectives.
• Up-to-date “Quality Corners”
communication board is a
first step.
Visual Management
13

• Visual Management is taken to higher
levels (not virtual).
– An improvement tool that utilizes visual
aids, for understanding at a glance.
• Visual Control. Any communication tool…that
tells us at a glance how work should be done
and whether it is deviating from the standard.
14
Visual Management in Lean
Visual Control: Toyota Way Principle #7
14

Communication with Visible Goals
• 5 year • 1 year • Hospital MBOs • Department (1) Visual Display makes a Public
Commitment, and Communicates.
(2) Must connect people to the goals.
(3) Leadership is a cultural enabler for Lean Culture.
(4) Engagement requires communicating alignment.
15

Visual Quality Awareness Modules
• Online training modules with quizzes
• 12 QSEs plus lean wastes
• Awareness training for all employees (1 module per month) for a year
• What is Quality in Health Care? • Who is our Customer? • What is a Process? • What is a Nonconforming Event?
(1) Without Knowledge/ Awareness you will NOT get Engagement (they will be detached)
(2) Enlighten first with “WHY”
16

• Predates Lean to cavemen • Link between visual graphs and
efficiency noted early in the industrial age in the United States (1910-30), e.g., Gantt chart and Shewart charts
• Toyota mastered standardized procedures; and simple visual instructions at the workbench – 1930s-40s
• Ishikawa taught the Basic 7 QC Tools – 1940s-50s
• Kanban, 5S, Andon - 1950s
Visual Communication History
Prehistoric human caveman drawing
35,000 years ago
Armies carrying banners, prehistoric to 1900 AD
Humans are visually, tactilely and audibly oriented. Best visuals are right at the work site.
17

Visual Electronic Documents
• Visual procedures off the shelf and available at the point-of use
• Streamlined with redundant procedures eliminated
• Simple visual instructions for important procedures
• Used in Training
• Basis for Training Checklists (Visual Management)
• Enabler for better Forms (Visual Management)
• Simple visual instructions for important procedures approved as Attachment (Visual Management)
18

Three main categories of “Root Causes” of Error and Variations in Quality
• Inadequate procedure
- missing, incomplete, poorly written or incorrect, outdated, etc.
• Inadequately followed procedure
- lack of training, inaccessible procedure, multiple versions, etc.
• Inadequate system
19

• Procedures should have Step-by-Step Instructions.
• It is better to use a table format in your SOPs
Step Action
1 Turn power off.
2 Open front door.
3
4
Standard Operating Procedures (SOPs)
20

1. Flowchart
aka “Process Flow Map (PFM)”
2. Cause & Effect Fishbone
aka “Ishikawa Diagram”
3. Check Sheet
4. Graph
for example, Run Chart
5. Histogram
6. Pareto Chart
7. Control Chart
8. Scatter Diagram
- No heavy statistics required:
Basic Quality Control Tools
21

Quality Corners in Lab Sections
CS-PATHway
(1) Humans are motivated by work that keeps them informed about how their efforts affect the outcome; (2) GOALS and METRICS are Top Motivators for human beings.
Graphs and Charts
Organizational Goals
22

Quality Corners, cont
PDSA Forms posted
23

Visual Dashboard
Visual Instructions
24

Visual Quarterly Report-Outs
• Visual PowerPoint Presentations
• Facts and data required
• Focus becomes IMPROVEMENT
• Helps Accountability
• Recognition for the “doers” (not bosses)
• Platform for Information Sharing (Yokoten)
= “best practice sharing”
25

Visual Graphs and Charts
Intra-Operative Blood Ordering Workflow Phlebotomist Staffing-by-Workload
26

Lean Six Sigma Yellow Belt Course
• Employees learn to identify waste, read/make charts and graphs, PDSA
CS-PATHway 27

• In Lean, all forms of visual aids are used: electronic dashboards, checklists and whiteboards.
• A different kind of pilot was started in CSMC Anatomic Pathology using whiteboards.
• It’s not about boards!
• It’s how they are used….
28
Visual Management using White Boards
28

It’s Not about the Boards
Rounding on Staff is an excellent tool to teach managers to talk to staff (based on Studer).
Thedacare Daily Huddle Board Pilot
Focus on Problem solving
29

Visual Management involves and aligns the team and compels action
Seeing as a group • Production Status • Inventory Levels • Machine Availability
Acting as a Group • Consensus on rules and
objectives • Involvement in
improvement activities
Knowing as a Group • Delivery Commitments • Goals and schedules • Management rules
30
Based on: Greif, M. (1991). The Visual Factory

Goal: Leveled Production
31

Time Target
(Goal)
Blocks
Cut
How
many
blocks
were cut
today?
10am 245 200
11am 369 375
12pm 495 500
Hour-By-Hour Boards
CS-PATHway 32

Refined White Board – Grossing Room Voice of Operations
33

Teamwork:
•Unity/constancy of purpose
•Alignment & Shared Mental Models
•Communication & Situational Awareness
Plus:
•Employee Involvement
•Employee development
Intangible Benefits seen in AP
CS-PATHway 34

Tangible Benefits seen in AP • Employees are engaged and working together:
1. Employee Commitment scores (how content): Improved on survey
2. Employee Engagement scores (how engaged): Improved on survey
• Work Cell Productivity Project Accomplishments:
– Increased Productivity by 15%
– Reduced budget by 2 FTEs
– Improved Biopsy Turn Around Time by 57%
– Site Errors Reduced 57%
– Specimen ID Errors Reduced 35%
CS-PATHway 35

Visual Display and Controls:
Quality Improvement Initiative
• Designed visual controls to slow down staff and document employee verification of specimen identity information throughout the lab processes
36
Lean Paradox: Be More Like the Tortoise Than the Hare

AP Approach: Accessioning
Improving accuracy of computer Data Entry step (Accessioning)
Defined current state: 6% error rate
Defined goal: below 2%
Engaged Staff through Visual Communication
Unannounced quarterly audits
CS-PATHway 37

Visual Controls: Accessioning
Data Entry Tech highlights or places “√” mark on
requisition next to:
Date of Service
Patient name
MRN
Ordering & cc MD
Specimen Source
Provided visual controls to see at a glance that data entry verification steps were made and accurately entered into the computer system
Results: 70% reduction in errors; process implemented permanently.
38

Visual Controls: Slide Labeling
Example: Histology
Tech places “dots” on slide label next to:
• case number
• patient name
Provided visual controls to see at a glance that specimen labeling verification steps were made
Results: Practically ZERO errors in slide labeling errors; procedures implemented permanently until bar-code read system CS-PATHway
39

Specimen Labeling
Visual Controls: Grossing Room
Before
After
40

Visual Control in Mistake-Proofing
One type of Mistake-Proofing: • Inspections involving self-checking and
successive checking (by downstream process) • Simple, informative and very effective • MYTH BUSTER: Lab people often mistake this to
be “inefficient”; some plants conduct 100% successive inspection of priority processes.
• Provides quick detection and containment of defects (Jidoka pillar)
“Built-In Quality”: includes Mistake-Proofing by workcell employees
41

AP Celebrating Successes through Visual Recognition Systems
• Staff Meetings: PowerPoint Presentations
• Luncheons
• AP Community Board Postings
– Standing Ovations
– Lab Exemplar Award
– Safety Star Award
– Massage Therapy
– Spot Bonuses
CS-PATHway 42

Other Visual Tools in Lean
• 5S (to visually see the abnormality)
– In Immunopathology, excessive waste of motion reduced and 2 FTEs were redeployed to other tasks
• Kanban (a visual “sign”)
- Successive inventory system in Immunopathology
- Under consideration for several areas
• One-Page PDSA form (A-3 reporting)
- (for problem solving and visual communication)
• Color Coding, Andon lights, tape on floor, etc. (visual cues)
CS-PATHway 43

CONCLUSIONS from AP
• Visual Communication using Whiteboards is a valuable tool to improving communication and increasing teamwork in the medical laboratory.
• Visual Display is essential to quality and performance improvement initiatives.
• Dashboards and White boards are complementary (not competing) tools
CS-PATHway 44

Lessons Learned
VISUAL MANAGEMENT (Enabling)
ALTERNATIVE
Transparency Information held in the boss’ office
Discipline for correct procedure Blame-and-shame, yelling
Continuous Improvement Status quo or major capital investment
Visual aids for job facilitation No help for workers
On-the-job effective training Ineffective training – waste of time
Shared ownership Management dictation
Management by facts Subjective judgment, wishful thinking
Unification, constancy of purpose Fragmentation, local optimization, fiefdoms, silos, etc.
CS-PATHway 45

The Power of Visual Communication through
Infographics
From: The Toyota Way
Involvement
Foundation
46