Embed Size (px)
Citation preview

Seismic Stratigraphy I - February 8
Basic concepts Seismic data Seismic stratigraphic concepts
Seismic stratigraphy of non-glacial and glacial margins Overview and examples
Seismic Stratigraphy II - February 13
Regional seismic stratigraphy and core data Antarctic Peninsula
Weddell Sea Prydz Bay Wilkes Land Ross Sea
Seismic Stratigraphy III - February 20
• Student presentations• Seismic Stratigraphy II wrapup• Special topics: Seismic stratigrapher’s cookbook (Ross Sea Atlas), backstripping, Pliocene? event
Assignment:Review:* Text Chapter 5 * Cooper et al. (1991)* Bartek et al. (1991)
Assignment:* Stoker et al. (1997) * Boulton (1990)
Assignment:* Rebesco et al. (2006)

• The core continues to deliver an impressive stratigraphy and range of glacimarine facies. ……
• The cycles continue from the previous week with five, 30-50m-thick cycles between 241-376mbsf dominated by diamictite (glacials) with thinner intervening diatomites (interglacials) …..
• Ultimately we hope the differing degrees of paleoenvironmental changes can be related to external forcings, such as climatic changes, so we can determine what the critical trigger points or thresholds can be for the Ross Ice Shelf and West Antarctic Ice Sheet systems.
Glacial-to-interglacialcycles
Excerpt from the Dec. 3, 2006 “weekly report” (quoted from Ross Powell and Tim Naish):
http://andrill.org/report/

First results of the 2006 drilling season – the lithostratigraphic recordhttp://andrill.org/report/
Glacial diamictite Interglacial diatomite
Glacial-to-interglacialcyclesOpen-ocean deposition
LAST CLASS – ROSS POWELL (Co-chief on ANDRILL)

Student Presentations

Wilkes Land margin – seismic and drilling

Crosses strike line
Crosses dip line
Wilkes Land margin
The vertical scales are not the same for the strike line and dip line.
There are 2 DSDP drill sites along this segment of the Antarctic margin.
Reflection geometries are similar to other Antarctic margin segments.
Recent seismic surveys by Australia and Russia allow regional mapping of the unconformities.
2004
Eocene?
Late Olig.- E.Mio.?
E.Mio.?

Wilkes Land margin
Middle-late Eocene
From Hayes et al., 1975
Leitchenkov, 2005, pers.com
CS4 = WL4
CS3 = WL3

Russian data:1986-1995 & 2000-2005
Leitchenkov (2005)
Recent seismic surveys by Russia and Australia further
illustrate general similarities in reflection geometries for
Neogene sections.
Similarites in acoustic geomtries on the East Antarctic margin

Leitchenkov, 2005, pers.comm.
Regional depositional features derived from seismic surveys
(from Leitchenkov, 2005)

DRIFT FORMATION ON THE CONTINENTAL RISE
From Kuvaas et al., 2004 & Leitchenkov pers.comm.
Rebesco et al. 1997

Ross Sea– seismic and drilling
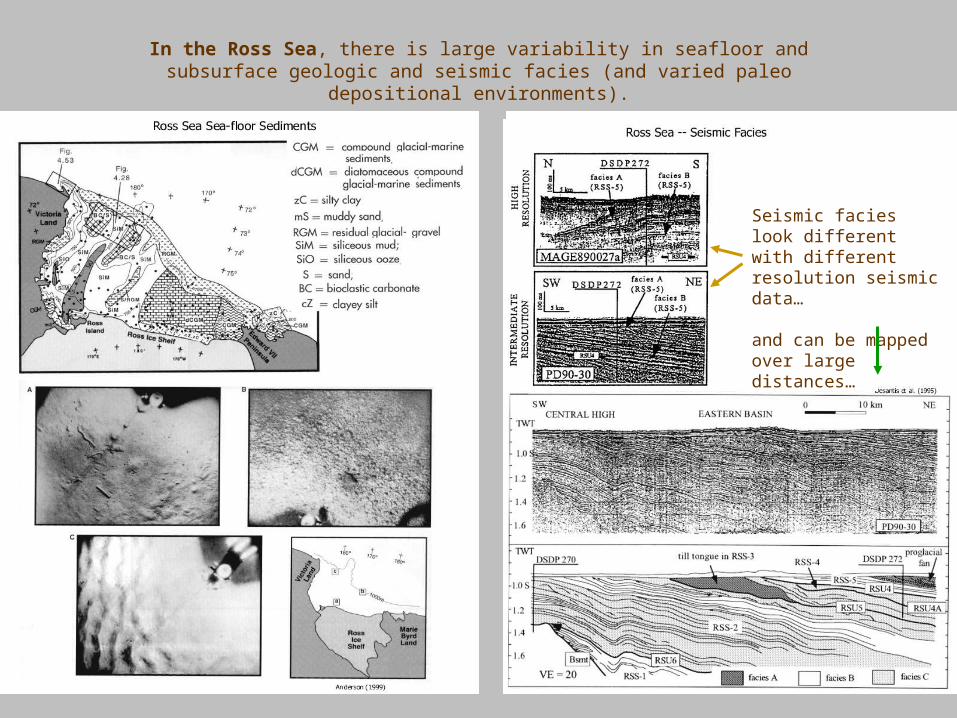
In the Ross Sea, there is large variability in seafloor and subsurface geologic and seismic facies (and varied paleo depositional environments).
Seismic facies look different with different resolution seismic data…
and can be mapped over large distances…

MCSData
SCSData
Brancolini et al.(submitted)
The seismic facies map shows that there are regional systematic variations in sediment deposits.
Ross Sea Seismic Facies Map

Ross Sea drilling: recovered mostly marine glacial rocks, indicating that the Ross Sea has been submerged and that glaciers have been nearby since at least early Oligocene time.
ANDRILLCape Roberts
CRP
AnDr
Barrett et al. (in press)Anderson (1999)

Seismic Interpreter’s Cookbook
With examples from the Ross Sea Stratigraphic AtlasAGU Antarctic Research Series, V. 68, 1995

Examine data bases and select seismic profiles
Regional Mapping Seismic Interpretation techniques
Facies A: partly reflective bodies bounded by oblique clinoforms that downlap onto erosional surfaces.
Facies B: stratified, with high-amplitude, continuos parallel and sub-parallel reflectors.
Facies C: intermediate in character between Facies A and B.
Identify and define seismic facies
Identify unconformities and seismic units using seismic geometries.
Brancolini et al. (1995)
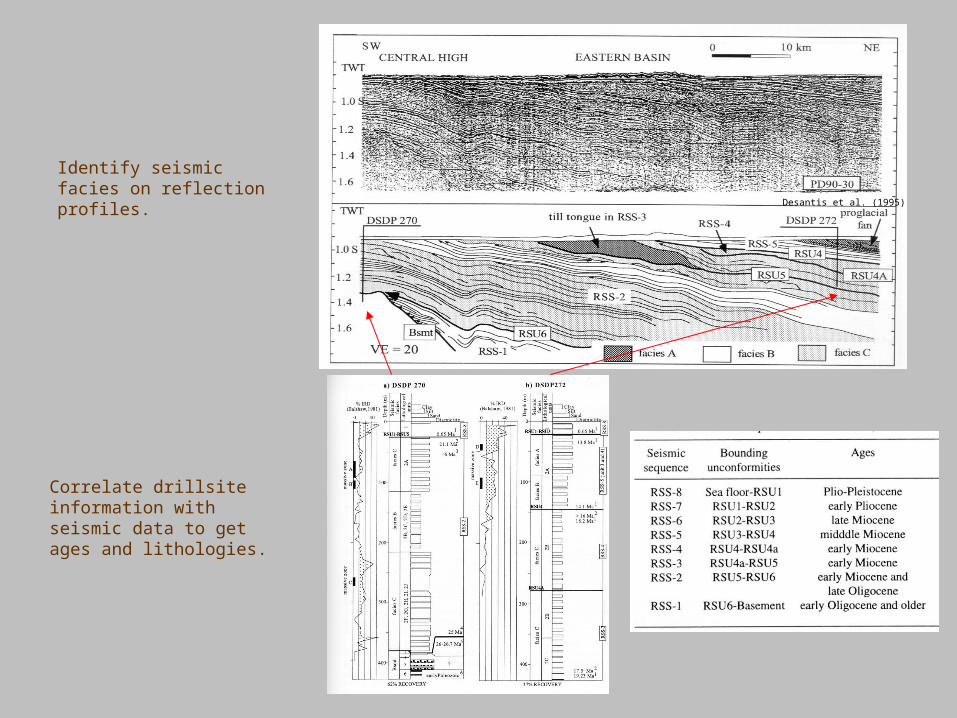
Identify seismic facies on reflection profiles.
Correlate drillsite information with seismic data to get ages and lithologies.
Desantis et al. (1995)
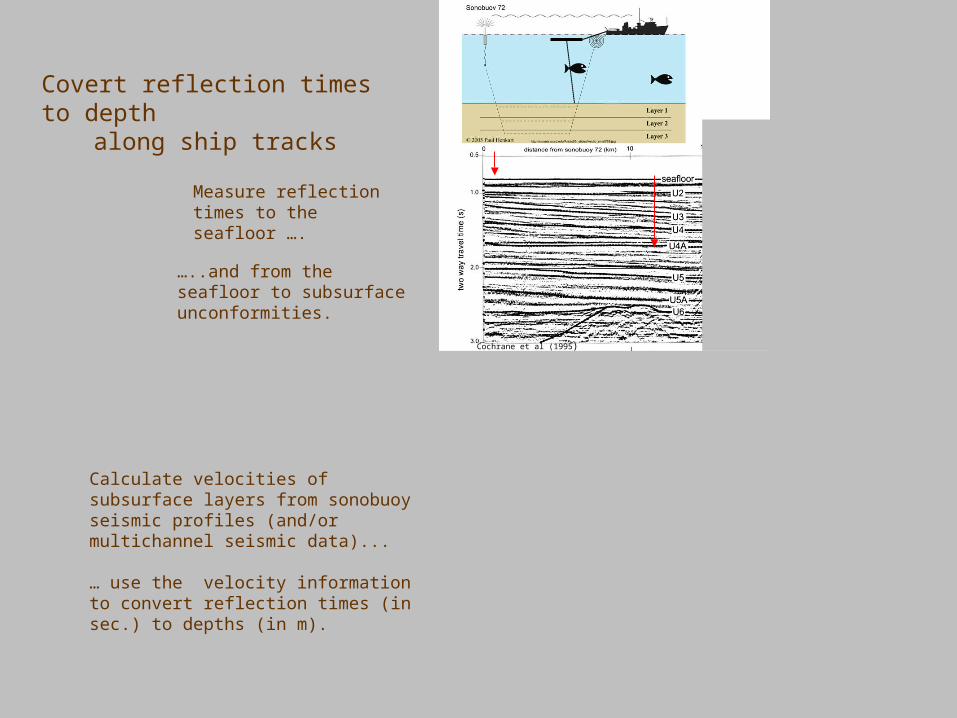
Sonobuoy seismic profile
Measure reflection times to the seafloor ….
…..and from the seafloor to subsurface unconformities.
Calculate velocities of subsurface layers from sonobuoy seismic profiles (and/or multichannel seismic data)...
… use the velocity information to convert reflection times (in sec.) to depths (in m).
Covert reflection times to depthalong ship tracks
Cochrane et al (1995)

Use velocity information to convert the travel-time map to a depth map (I.e., a structure map).This is atlas plate 19b.
Use total travel times to make a travel-time map (I.e., a pseudo structure map). This is atlas plate 19a.
Subtract seafloor depths from total depths to get a sediment thickness map (isopach map).This is atlas plate 22b)
Use water depths from all tracklines to make a bathymetric map of the sea floor. This is atlas plate 1a.

Use seismic characteristics to make facies maps for different time periods.
Late Oligocene-Early Miocene time:Evidence of local glaciers on basement highs in the middle of the Ross Sea
Desantis et al. (1995).
Middle Miocene time:Evidence of widespread glaciers on highs and across the eastern Ross Sea.

The bathymetric map shows the morphology of the seafloor, and the evidence of large ice streams that carved wide troughs.
Depth maps (I.e., structure contour map) show locations of depressions and rises in the mapped surface.
In this map, at RSU-6 time there may have been a broad structural depression with local basement highs beneath the Eastern Ross Sea.
Isopach maps give the thickness of sedimentary deposits between two reference horizons. These maps help to establish where sediments came from and where they now rest.
In this map, the reference horizons are the seafloor and unconformity RSU-6. The thickest sediments lie beneath the outer shelf in a basin that trends E-W.
Why do the thickest sediments trend E-W, but the ridges and troughs on the seafloor trend N-S?
Backstripping Taking the “clothes layers” off the shelf

Laura De SantisGiuliano Brancolini
Angelo Camerlenghi
Michele Rebesco2-D backstripping modelling 2-D backstripping modelling
of three Antarctic continental margins of three Antarctic continental margins (Ross Sea, Antarctic Peninsula, Prydz Bay)(Ross Sea, Antarctic Peninsula, Prydz Bay)


Paleodepth informationPaleodepth information
DecompactionDecompaction
Sediment porositySediment porosity
Compaction coefficentCompaction coefficent
Sediment thicknessSediment thickness
Isostatic reboundIsostatic rebound
Lithosphere Elastic Lithosphere Elastic
ThicknessThickness
Thermal post rift subsidenceThermal post rift subsidence
Age of:Age of:
- Post rift onset- Post rift onset
- Units boundaries- Units boundaries


The sea floor is landward The sea floor is landward deepening and overdeepeneddeepening and overdeepened
The sea floor is seaward The sea floor is seaward deepening and not overdeepeneddeepening and not overdeepened
The sea floor is seaward The sea floor is seaward deepening and not overdeepeneddeepening and not overdeepened
Sub-aerial conditionSub-aerial condition
The Eastern Ross Sea Margin

END OF LECTURE