Embed Size (px)
Citation preview
1 | US DOE Geothermal Office eere.energy.gov
Public Service of Colorado Ponnequin Wind Farm
Geothermal Technologies Office 2015 Peer Review
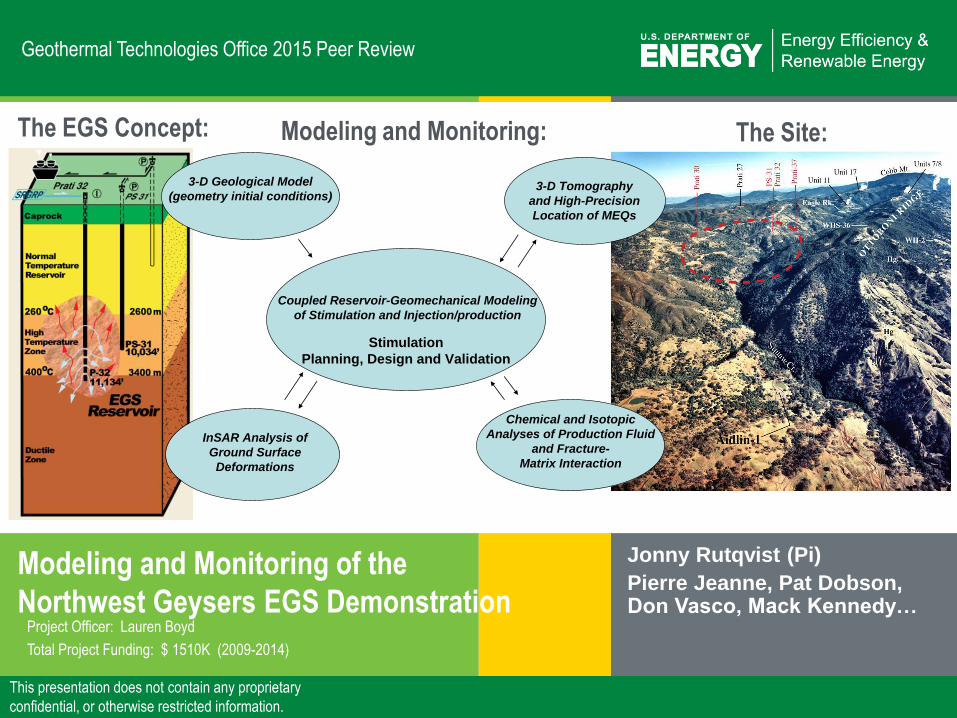
Modeling and Monitoring of the
Northwest Geysers EGS Demonstration
Jonny Rutqvist (Pi)
Pierre Jeanne, Pat Dobson, Don Vasco, Mack Kennedy…
Project Officer: Lauren Boyd
Total Project Funding: $ 1510K (2009-2014)
This presentation does not contain any proprietary
confidential, or otherwise restricted information.
The EGS Concept: The Site: Modeling and Monitoring:
Coupled Reservoir-Geomechanical Modeling
of Stimulation and Injection/production
3-D Geological Model
(geometry initial conditions)3-D Tomography
and High-Precision
Location of MEQs
InSAR Analysis of
Ground Surface
Deformations
Chemical and Isotopic
Analyses of Production Fluid
and Fracture-
Matrix Interaction
Stimulation
Planning, Design and Validation

2 | US DOE Geothermal Office eere.energy.gov
Other technical objectives are:
• To investigate how cold-water injection under low pressure affects fractured
high temperature rock systems
• To investigate the technology to monitor and validate stimulation and
sustainability of such an EGS
Injection wells Micro-seismic locations
Create an Enhanced Geothermal System (EGS) by directly and
systematically injecting cold water under low pressure into NW Geysers high
temperature zone (HTZ)
Similar to “inadvertently” created
EGS in the oldest Geysers
production area to the southeast
of the EGS demonstration area
Project Objectives

3 | US DOE Geothermal Office eere.energy.gov
The NW Geysers EGS Demonstration Project Overview
• Timeline:
– Phase I Pre-stimulation phase started June 2009 (100% complete)
– Phase II Stimulation phase along with injection October 2011 (100% complete); Final report delivered March 2015
– Phase III Long-term monitoring and validation
• Budget:
– LBNL’s Modeling, field data collection (e.g. InSAR and. seismic
tomography) for FY2009 to FY2014: $1510K (250 K per year)
– LBNL’s FY2015 work is financed by a carryover of about $240K from
FY2014 used to support Calpine’s Phase II final reporting, publication of
Phase II results in journals, and completing geochemical sampling
• Calpine Corporation manages field work and real-time monitoring using data
from LBNL’s seismic network
• LBNL performs modeling of stimulation and injection/production and analyze
field data for planning, design and validation of the EGS stimulation
4 | US DOE Geothermal Office eere.energy.gov
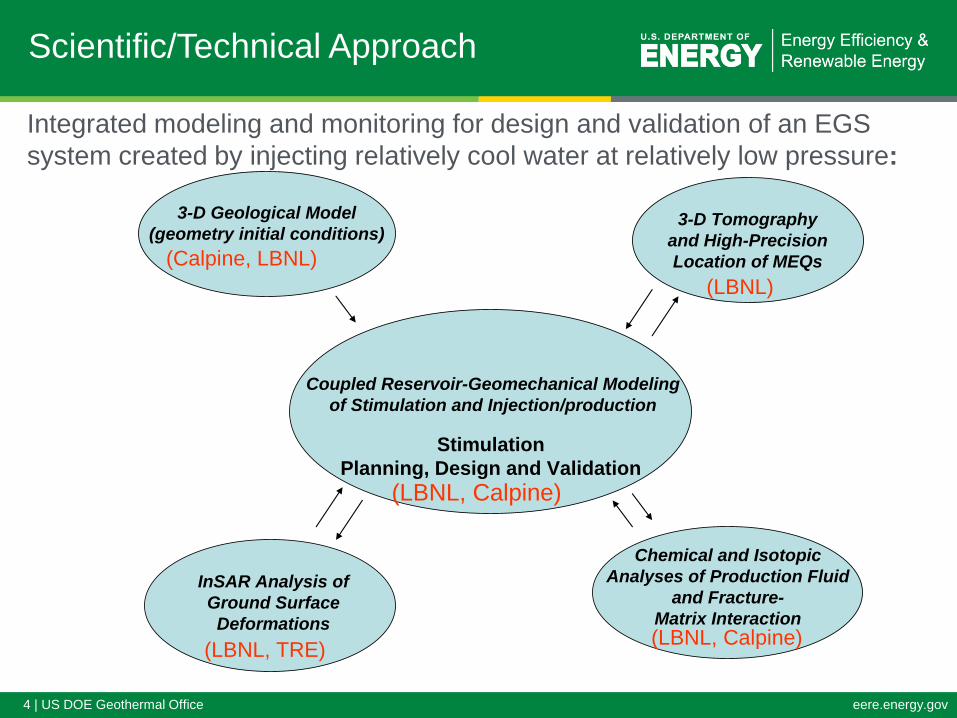
Coupled Reservoir-Geomechanical Modeling
of Stimulation and Injection/production
3-D Geological Model
(geometry initial conditions)3-D Tomography
and High-Precision
Location of MEQs
InSAR Analysis of
Ground Surface
Deformations
Chemical and Isotopic
Analyses of Production Fluid
and Fracture-
Matrix Interaction
Stimulation
Planning, Design and Validation
(LBNL, TRE)
(LBNL, Calpine)
(LBNL, Calpine)
(Calpine, LBNL)
(LBNL)
Integrated modeling and monitoring for design and validation of an EGS
system created by injecting relatively cool water at relatively low pressure:
Scientific/Technical Approach

5 | US DOE Geothermal Office eere.energy.gov
Geomechanical Modeling Approach
FLAC3D
Geomechanical Simulator
TOUGH
Multiphase Flow
Simulator
FLAC3D
Geomechanical Simulator
TOUGH
Multiphase Flow
Simulator
1) Use TOUGH and FLAC3D to
calculate stress changes as a
result of “cold” water injection
2) From stress changes
calculated the likelihood of
MEQ in different areas around
the injection
The rock mass at The Geysers is near-critically stressed for shear failure: a
small stress change can cause fracture shear and a microseismic event

6 | US DOE Geothermal Office eere.energy.gov
TIME (days)
PR
ES
SU
RE
(MP
a)
PR
ES
SU
RE
(PS
I)
0 50 100 150 200 250 300 3500
1
2
3
4
5
6
7
8
0
200
400
600
800
1000
P-32
PS-31
TIME (days)
INJE
CT
ION
RA
TE
(m3/d
ay)
INJE
CT
ION
RA
TE
(gp
m)
0 50 100 150 200 250 300 3500
2000
4000
6000
8000
0
200
400
600
800
1000
1200
1400
Pre-Stimulation Model Prediction
x
0
2000
4000
6000
8000
10000
y
0
2000
4000
z
-7000
-6000
-5000
-4000
-3000
-2000
-1000
0
Y
X
Z
Hornfels (HTZ)
NTR
CAP ROCK
Felsite (HTZ)
240 oC
280 oC
PS-31
360 oC
20 oC
P-32
Model and Initial Temperature Injection Plan (March 2012)
Calculated pressure
• Maximum downhole pressure 8 MPa < σ3,
(≥ 24 MPa)
• Staged injection and “gentle” progressive
stimulation of the HTZ in steps
7 | US DOE Geothermal Office eere.energy.gov
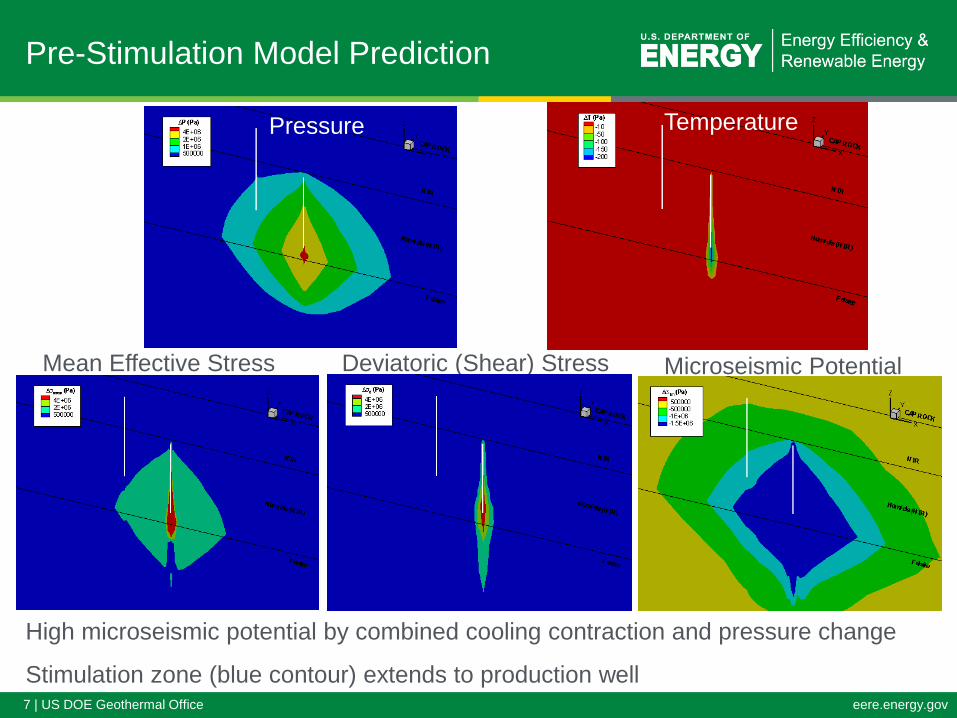
Pre-Stimulation Model Prediction
Microseismic Potential Mean Effective Stress Deviatoric (Shear) Stress
High microseismic potential by combined cooling contraction and pressure change
Stimulation zone (blue contour) extends to production well
Temperature Pressure

8 | US DOE Geothermal Office eere.energy.gov
Pre-Stimulation Model Prediction
Vertical cross-section Horizontal cross-section
The extent of the stimulation zone reasonably predicted
Predicted and observed extent of stimulation zone after 3 months of injection
9 | US DOE Geothermal Office eere.energy.gov
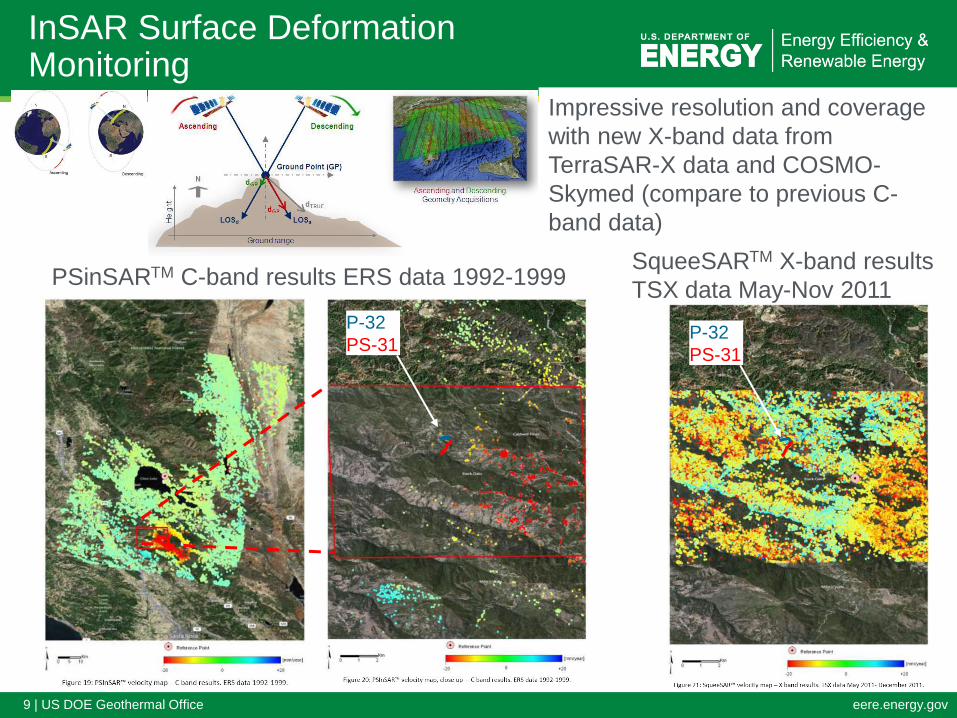
InSAR Surface Deformation Monitoring
Impressive resolution and coverage
with new X-band data from
TerraSAR-X data and COSMO-
Skymed (compare to previous C-
band data)
PSinSARTM C-band results ERS data 1992-1999 SqueeSARTM X-band results
TSX data May-Nov 2011
P-32
PS-31 P-32
PS-31

10 | US DOE Geothermal Office eere.energy.gov
Interpretative Modeling
PS
-31
PR
ES
SU
RE
CH
AN
GE
(PS
I)
0
50
100
150
200
TIME (days)
P-3
2IN
JE
CT
ION
RA
TE
(GP
M)
-120 -100 -80 -60 -40 -20 0 20 40 60 80 100 120 140 160 180
-1000
-500
0
500
1000
TIME (days)
DIS
PL
AC
EM
EN
T(m
m)
-120 -100 -80 -60 -40 -20 0 20 40 60 80 100 120 140 160 180
0
5
10
15 TSX DATA AT AOYCB
TSX DATA AT AOXGB
MODELING, K = 16 GPa
MODELING, K = 34 GPa
PS-31 PRESSURE MODELING
P-32 INJECTION RATE DATA
PS-31 PRESSURE DATA
P-32 INJECTION RATE MODELING
The comparison of model and observed responses was used to constrain hydraulic
and mechanical model parameters
P31
pressure
P32
Injection
Displacement
Ground surface
11 | US DOE Geothermal Office eere.energy.gov
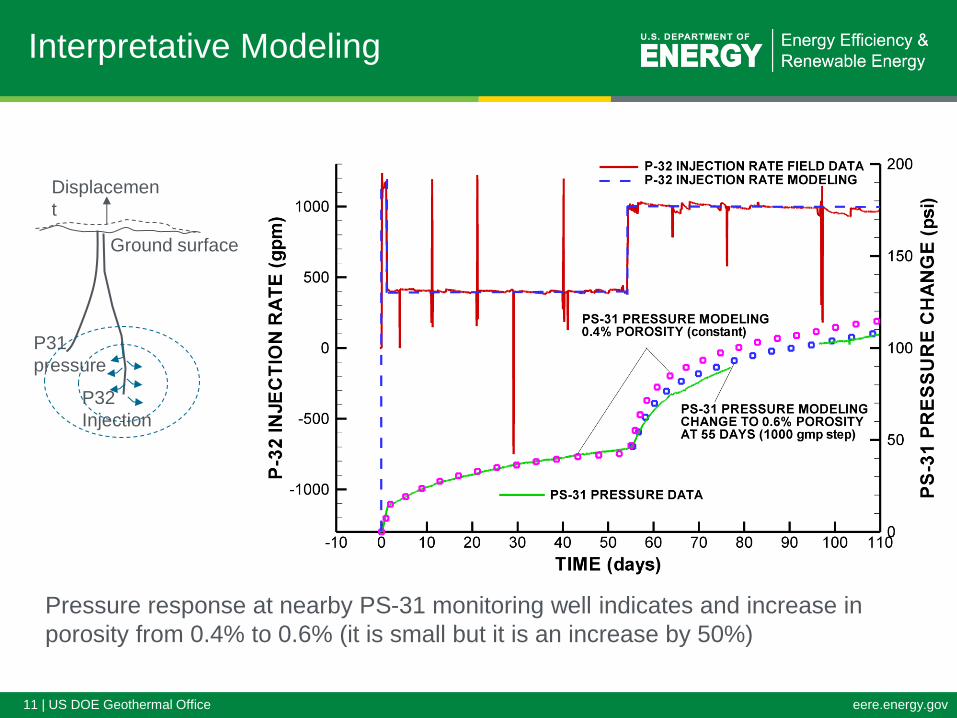
Interpretative Modeling
P31
pressure
P32
Injection
Displacemen
t
Ground surface
Pressure response at nearby PS-31 monitoring well indicates and increase in
porosity from 0.4% to 0.6% (it is small but it is an increase by 50%)

12 | US DOE Geothermal Office eere.energy.gov
Identification of Shear-zone Network
Daily evolution of microseismicity after injection rate increase:
First 2 weeks of injection Following increase to max rate
Indicates both permeable reservoir-crossing shear zones and impermeable
reservoir bounding shear zones (also note correlation with steam entries)
13 | US DOE Geothermal Office eere.energy.gov
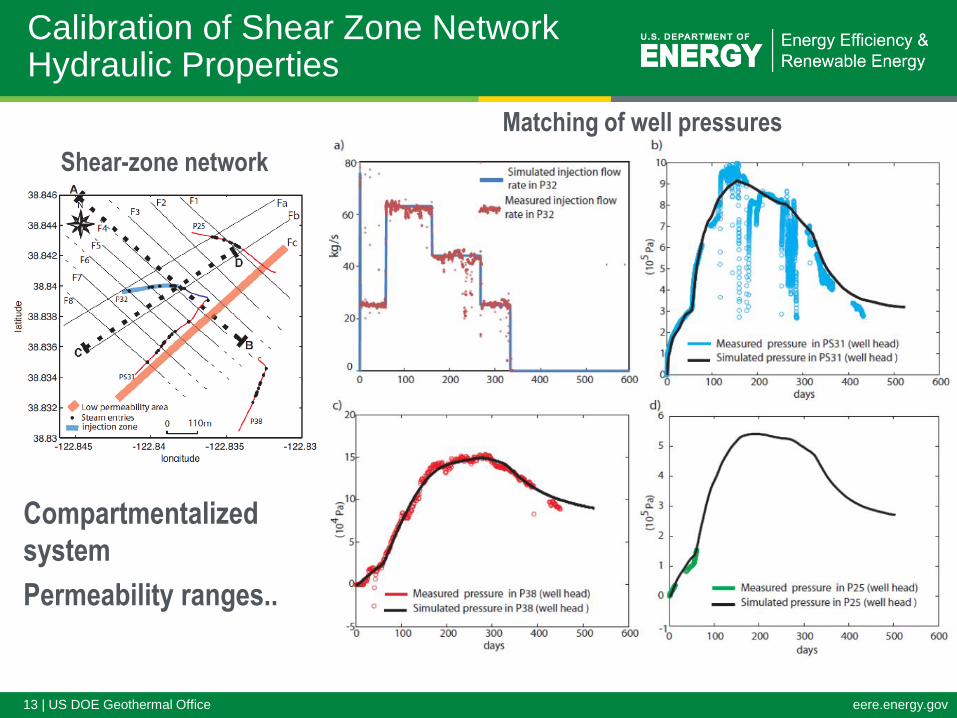
Calibration of Shear Zone Network Hydraulic Properties
Shear-zone network
Matching of well pressures
Compartmentalized
system
Permeability ranges..

14 | US DOE Geothermal Office eere.energy.gov
Observed and Modeled Compartmentalized Stimulation zone
Shear-zone network
Observed seismicity (top) and modeled seismicity (bottom)
Compartmentalized system
15 | US DOE Geothermal Office eere.energy.gov
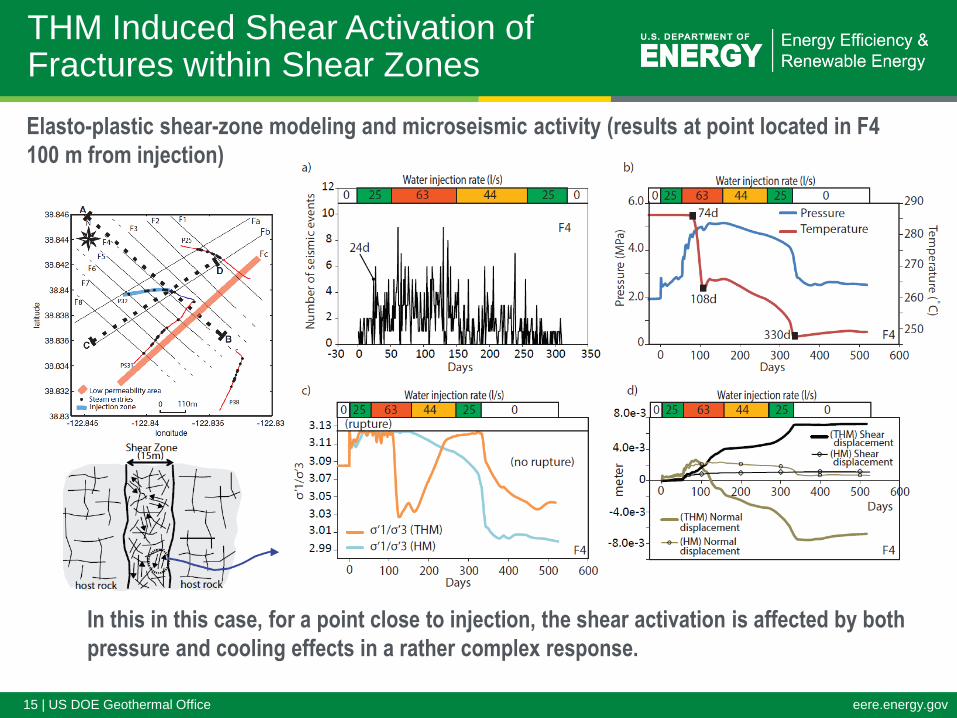
THM Induced Shear Activation of Fractures within Shear Zones
Comp Elasto-plastic shear-zone modeling and microseismic activity (results at point located in F4
100 m from injection)
In this in this case, for a point close to injection, the shear activation is affected by both
pressure and cooling effects in a rather complex response.

16 | US DOE Geothermal Office eere.energy.gov
Seismic Tomography
Evolution of the P-wave distribution
Evolution of the S-wave distribution
23 surface
stations within
5.7km X 6.0km
area around the
injection well
LBNL Geyser Stations
5 additional P-32
Test of ..
Anomaly in both P and S-wave velocity around injection well
17 | US DOE Geothermal Office eere.energy.gov
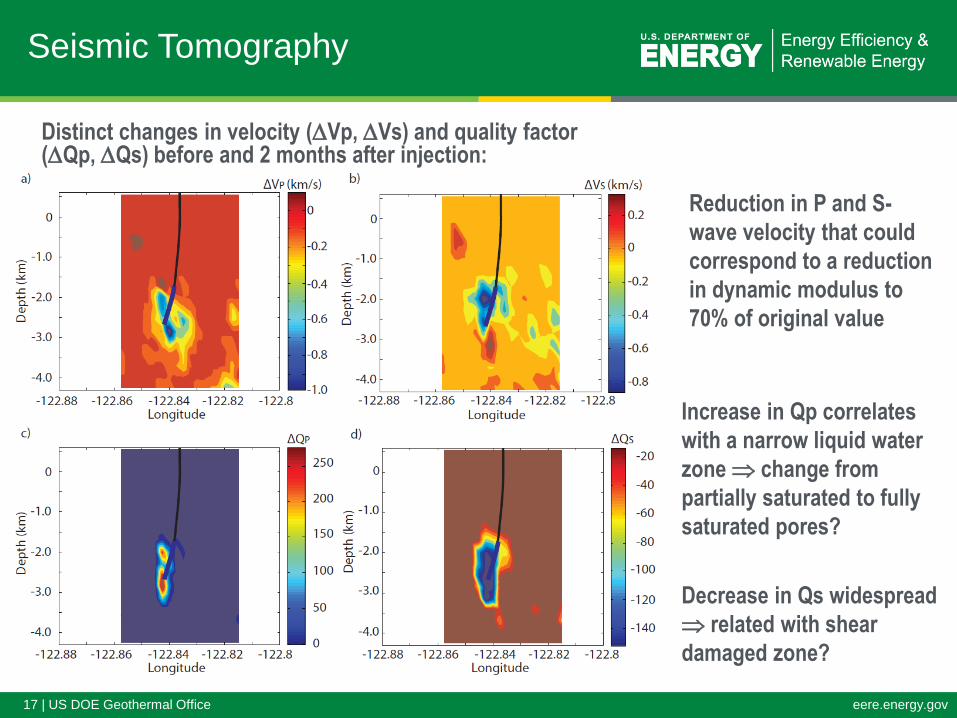
Seismic Tomography
Reduction in P and S-
wave velocity that could
correspond to a reduction
in dynamic modulus to
70% of original value
Increase in Qp correlates
with a narrow liquid water
zone change from
partially saturated to fully
saturated pores?
Decrease in Qs widespread
related with shear
damaged zone?
Distinct changes in velocity (Vp, Vs) and quality factor (Qp, Qs) before and 2 months after injection:

18 | US DOE Geothermal Office eere.energy.gov
Accomplishments, Results and Progress
1) Pre-stimulation modeling guided injection design for establishing an EGS
encompassing the P-32/PS-31 injection/production pair
2) Pre-stimulation model prediction showed reasonable match with observed seismic
cluster and reservoir pressure
3) Better than expected InSAR resolution in difficult terrain
4) Stimulation volume confirmed by high resolution seismic tomography
5) Identified microseismicity being caused by small but rapid pressure changes as
well as near-well cooling effects confirming critically-stressed rock hypothesis
6) The integrated modeling/monitoring characterized properties of an EGS with
reservoir-crossing and bounding shear zones.
7) The stimulation zone was characterized by substantial mechanical softening and
porosity changes attributed to stimulation-induced shear failure
8) 11 journal papers published 2013 to 2015
In FY2015, provided critical input to the Phase II milestone report related to 1)
estimated stimulation volume, 2) change in reservoir properties, 3) cause and
mechanisms of induced seismicity, 4) evaluation of monitoring techniques.
19 | US DOE Geothermal Office eere.energy.gov
Relevance/Impact of Research
The key to the success of making EGS a factor in the US energy mix is
to learn how to effectively stimulate a rock mass on a kilometer scale
and how to effectively design, predict, and monitor such a system:
• The technology of heat mining of these deep untapped resources
below conventional hydrothermal systems is an innovative and
unconventional EGS approach developed in this project
• The work investigates effective injection schemes that optimize
stimulation caused by cooling shrinkage and pressure effects, while
minimize the potential for notable earthquakes
• The technology developments and lessons learned in this project
(related stimulation techniques, modeling and monitoring) will be
directly applicable to EGS developments in any other fractured rock
system where the goal is to stimulate an existing fracture network
• 11 journal publications have been produced associated with the NW
Geysers EGS Demonstration in the past 2 years

20 | US DOE Geothermal Office eere.energy.gov
Summary and Future Directions
The work to-date concludes Phase II of the Geysers EGS Demonstration
Project (stimulation phase).
We have developed a 3D model of the system, including the P-32 and
PS-31 injection/production well pair and the nearby production P-25 well.
The model could in the future be readily used to interpret system
responses during production and long-term monitoring (Phase III of the
project, once the PS-31 main production well is put back into production).
Ideally, with continued sustained injection, the stimulation will move
progressively downwards for increasing heat mining deep within the high
temperature reservoir and underlying felsite.
This could be verified with monitoring of microseismic evolution, reservoir
pressure, repeated seismic tomography, and interpretive modeling of
injection/production.