Embed Size (px)
Citation preview
Presented at Short Course VIII on Exploration for Geothermal Resources, organized by UNU-GTP, GDC and KenGen, at Lake Bogoria and Lake Naivasha, Kenya, Oct. 31 – Nov. 22, 2013.
1
GEOTHERMAL TRAINING PROGRAMME Kenya Electricity Generating Co., Ltd.
GEOTHERMAL MAPPING USING TEMPERATURE MEASUREMENTS
Godwin M. Mwawongo Geothermal Development Company
P. O. Box 100746, Nairobi 00101 KENYA
ABSTRACT
Shallow temperature gradient holes are reliable in mapping geothermal prospects with heat loss features as surface manifestation. The sun least affects ground temperatures at 1 m depth and temperatures in the North rift are least affected by seasonal changes. Over 10,736 MWt is lost naturally from Menengai to Paka along the Kenyan rift. Most of the geothermal surface manifestations associated with the heat loss are oriented in the NW-SE with a few located in the NE-SW direction. Estimated down-hole temperature at I km depth is over 200oC. Fluid flow in the prospects from Lake Baringo to Paka is from East to West with an outflow to the north.
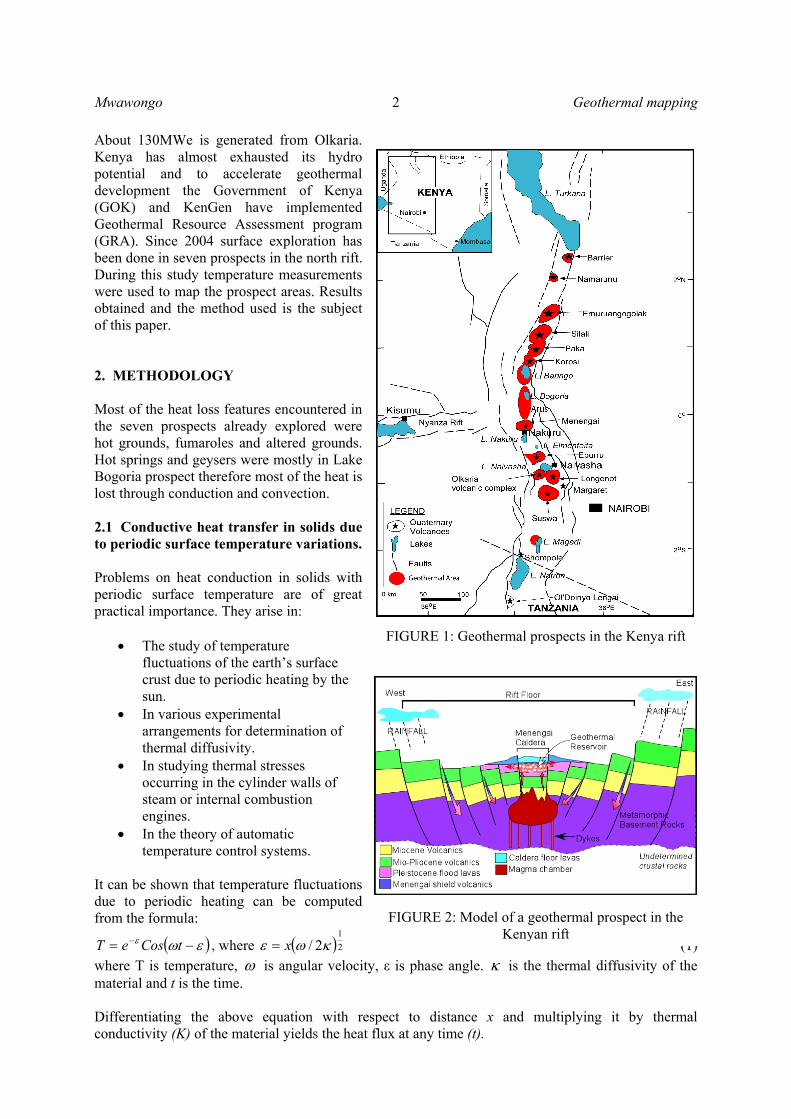
1. INTRODUCTION Kenya is located in East Africa where the Great African Rift virtually splits the landmass into two. 14 geothermal prospects have been identified within the Kenyan Rift Valley starting from Barrier in the north to Lake Magadi in the south with a potential of over 3,000 MWe (Figure 1). The rift is a graben and during the formation of the prospects, hot rocks were brought closer to the surface and with intensive faulting and presence of water, the geothermal systems were formed as shown in the model in Figure 2. Faults form areas of leakage resulting in the formation of surface manifestations related to the geothermal system below. Surface manifestations include hot grounds, hot springs, geysers, altered grounds and fumaroles. These features continuously transport mass and heat from the geothermal system underground to the atmosphere. This heat is referred to as natural heat loss of the system. The heat is lost by conduction, convection and very little by radiation. Ground temperatures can be used to map prospect areas with heat loss features. Areas with geothermal system are also associated with high local heat fluxes and high temperature gradients, which is above the normal geothermal gradient of 30oC/km. During surface exploration, heat loss survey done is aimed at assessing the amount of heat being lost naturally from a prospect and is used to conceptualize the amount of energy that could be concealed and the relationship between the geological structures and the discharging features. Heat loss method is used indirectly to determine the size of the reservoir as large heat loss mirrors a large reservoir. Results from heat loss survey are an important input in numerical simulation of the prospect if the reservoir is proven.
Mwawongo 2 Geothermal mapping
About 130MWe is generated from Olkaria. Kenya has almost exhausted its hydro potential and to accelerate geothermal development the Government of Kenya (GOK) and KenGen have implemented Geothermal Resource Assessment program (GRA). Since 2004 surface exploration has been done in seven prospects in the north rift. During this study temperature measurements were used to map the prospect areas. Results obtained and the method used is the subject of this paper. 2. METHODOLOGY
Most of the heat loss features encountered in the seven prospects already explored were hot grounds, fumaroles and altered grounds. Hot springs and geysers were mostly in Lake Bogoria prospect therefore most of the heat is lost through conduction and convection. 2.1 Conductive heat transfer in solids due to periodic surface temperature variations. Problems on heat conduction in solids with periodic surface temperature are of great practical importance. They arise in:
The study of temperature fluctuations of the earth’s surface crust due to periodic heating by the sun.
In various experimental arrangements for determination of thermal diffusivity.
In studying thermal stresses occurring in the cylinder walls of steam or internal combustion engines.
In the theory of automatic temperature control systems.
It can be shown that temperature fluctuations due to periodic heating can be computed from the formula:
tCoseT , where 2
1
2/ x (1)
where T is temperature, is angular velocity, ε is phase angle. is the thermal diffusivity of the material and t is the time. Differentiating the above equation with respect to distance x and multiplying it by thermal conductivity (K) of the material yields the heat flux at any time (t).
FIGURE 1: Geothermal prospects in the Kenya rift
FIGURE 2: Model of a geothermal prospect in the Kenyan rift
Geothermal mapping 3 Mwawongo
x
Tq
(2)
The conduction equation assumes a homogeneous and isotropic solid with heat flow in one-dimension. No heat is lost from the surface (Carslaw and Jaeger, 1959). 2.1 Conductive heat loss measurements Natural heat loss by conduction was estimated by obtaining temperature gradients from shallow 1 m depth holes drilled manually using 1-inch diameter spike. Temperatures were measured at the surface, at 50 cm and at 100 cm depths. Location of these holes was read from a portable Global Positioning System (GPS). Thermally active area was later estimated from 40oC isotherm at 1 m depth. The holes were drilled at an interval of 100 m – 1 km in areas of high thermal activity and 1 - 4 km in areas of low activity. Area of the hot ground and average temperature gradient is then computed. The following one dimensional heat conduction equation is used to compute the heat flow assuming that the soil’s thermal conductivity is constant at 2 W/m °C.
dy
dTAkQ (3)
where Q is conductive heat flow (watts), A is surface area of hot ground (m2), k = 2 is thermal conductivity of rock (W/m°C), T is temperature (°C) and y is depth (m). 2.2 Convective heat loss measurements Natural convective heat loss from a geothermal system occurs from hot springs, geysers, fumaroles and steaming grounds. The convective component of the total heat loss was estimated by measuring steam flow velocities from fumaroles by use of a venturimeter and water manometer. To achieve this inverted plastic trough of known diameter was used and the venturimeter placed on a conveniently drilled hole at the back of the trough. To seal for any leakages, wet mud was used. With flow velocity and temperature and steam properties known at source temperature, mass and heat flow is calculated. The following equations were used to calculate steam flow rates and heat flow from fumaroles.
)1(
)1(2
2
2
d
d
Hg
ACVt
s
w
td
(4)
where V is volumetric flow rate (m3/s), Cd is coefficient of discharge (assumed to be 0.96), g is acceleration due to gravity (9.81 m/s2), dt is venturimeter throat diameter, d is venturimeter diameter at the high pressure tapping (m), H is differential height at the manometer (m), is density (kg/m3), At is throat area (m2) and the subscripts w and s refer to water and steam respectively.
)( wssc hhVQ (5)
where Qc is convective heat flow (watts) and hs is enthalpy of steam in (J/kg) and hw is enthalpy of water at ambient temperature. Flow from hot springs and geysers was measured by use of a 90° V-notch weir or Pitot Static pressure method. For the V-notch weir, mass flow rate was computed using the formula:
Mwawongo 4 Geothermal mapping
5.201333.0 hm
(6)
where h is weir height in (cm) and
m is mass flow rate in (kg/s). Heat flow Qc in kilowatts was computed from the formula;
)( sspc hhmQ
(7)
where hsp is enthalpy at the source temperature while hs is water enthalpy at the mean surface temperature in (kJ/kg). For high flow rates average flow velocities of the resulting hot water was computed using Pitot static pressure method across the river from the formula:
gHCv d 2 (8)
where v is velocity in (m/s), H is static pressure head in (m) and Cd is coefficient of discharge (assumed to be 0.96). For cross sectional area of flow A (m2) and water density (ρw) at the source temperature, the mass flow rate can be computed from the formula:
wvAm
(9)
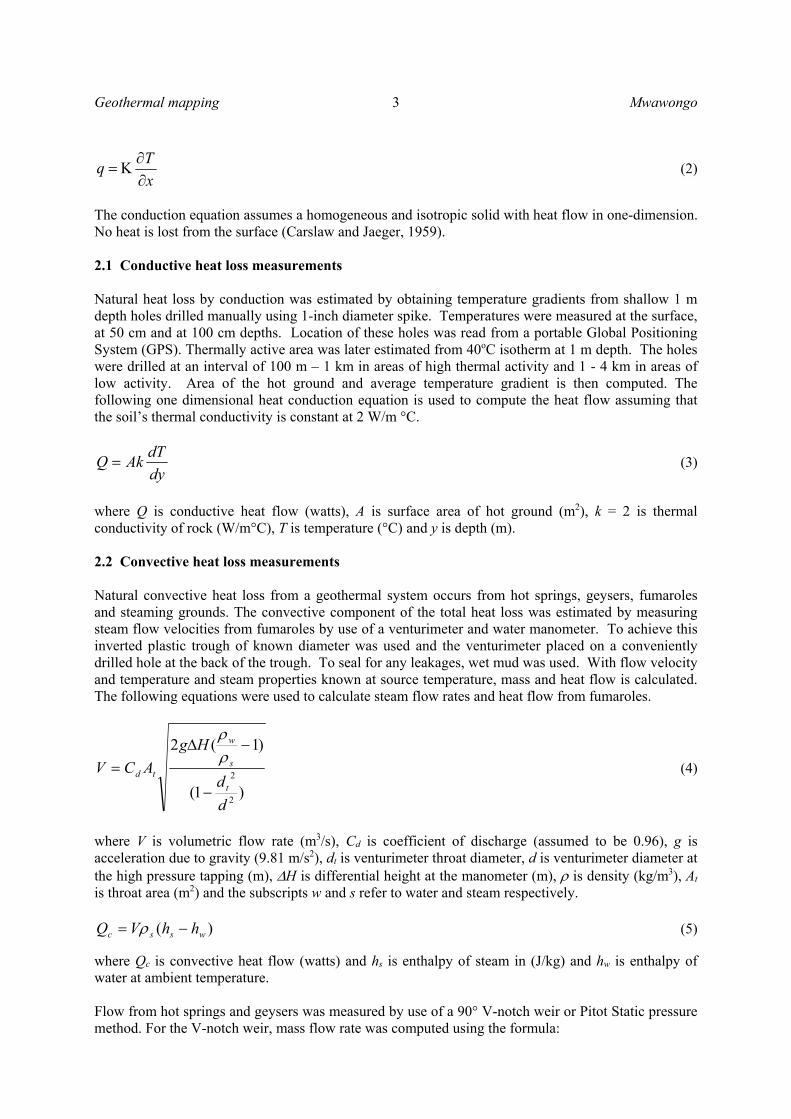
Heat flow was then computed using Equation (7). 2.3 Reliability check Temperature measurements were taken at different times of the day. Since ground surface temperatures in the north rift can reach 40°C, it was therefore prudent to check the data obtained for temperature variation due to day and night. Also control points were made in active and less active areas to check temperature variation due to seasonal change. Equation (1) was used to check a random sample of field data for temperature variation at the surface, 50 cm and 100 cm depth due to effects of the sun. Heat flux from below is assumed constant. Formation penetrated by shallow gradient holes was assumed to be a mixture of granite and soil with average thermal diffusivity of 0.008 m2/s. Variation in temperature over a 24 hour cycle was then computed assuming 12 hours of light and 12 hours of darkness in a day. Percentage deviation for the three temperature readings is plotted on Figure 3. The highest deviation was 4% on surface temperature in areas of low thermal activity and 0.1% for anomalous areas. At 100 cm depth, the
FIGURE 3: Temperature variation due to effect of daytime heating and cooling at night
0 5 10 15 20 25Time (hr)
-4
-2
0
2
4
6
% d
avia
tion
over
24
hrs
due
to d
ay a
nd n
ight
Temp variation at the surface
Temp variation at 50 cm depth
Temp variation at 100 cm depth
DayDay
Night
Geothermal mapping 5 Mwawongo
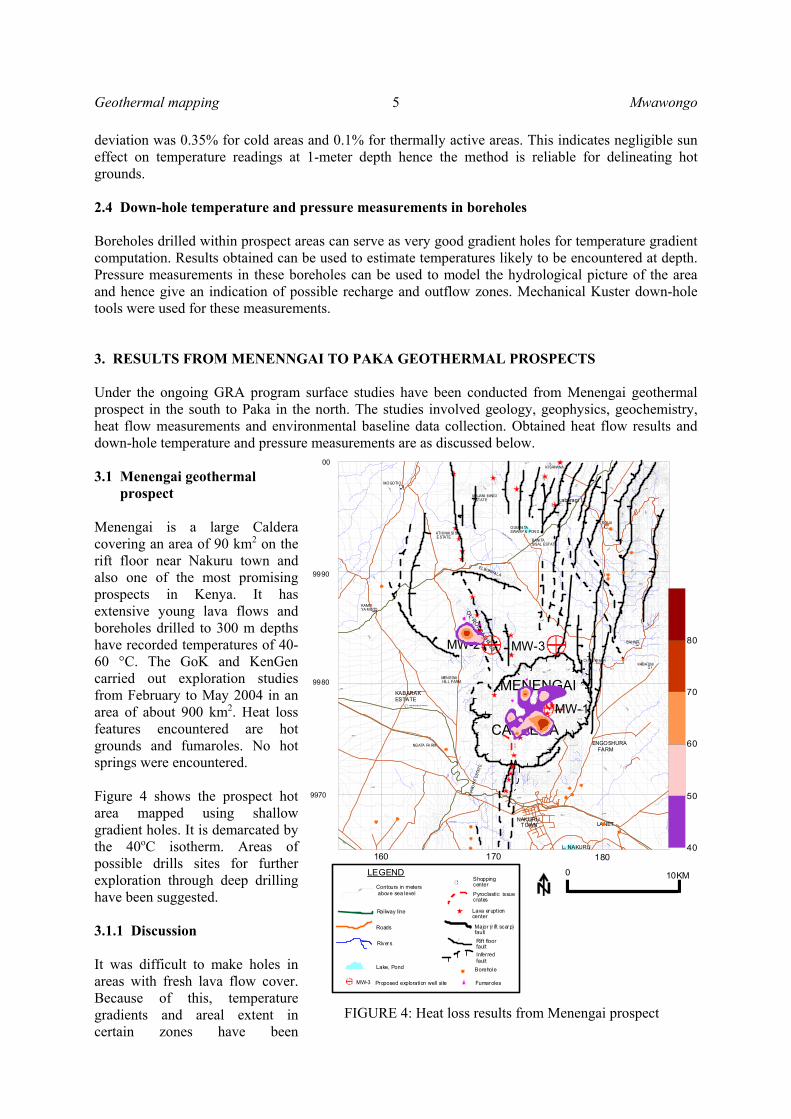
deviation was 0.35% for cold areas and 0.1% for thermally active areas. This indicates negligible sun effect on temperature readings at 1-meter depth hence the method is reliable for delineating hot grounds. 2.4 Down-hole temperature and pressure measurements in boreholes Boreholes drilled within prospect areas can serve as very good gradient holes for temperature gradient computation. Results obtained can be used to estimate temperatures likely to be encountered at depth. Pressure measurements in these boreholes can be used to model the hydrological picture of the area and hence give an indication of possible recharge and outflow zones. Mechanical Kuster down-hole tools were used for these measurements. 3. RESULTS FROM MENENNGAI TO PAKA GEOTHERMAL PROSPECTS Under the ongoing GRA program surface studies have been conducted from Menengai geothermal prospect in the south to Paka in the north. The studies involved geology, geophysics, geochemistry, heat flow measurements and environmental baseline data collection. Obtained heat flow results and down-hole temperature and pressure measurements are as discussed below. 3.1 Menengai geothermal prospect Menengai is a large Caldera covering an area of 90 km2 on the rift floor near Nakuru town and also one of the most promising prospects in Kenya. It has extensive young lava flows and boreholes drilled to 300 m depths have recorded temperatures of 40-60 °C. The GoK and KenGen carried out exploration studies from February to May 2004 in an area of about 900 km2. Heat loss features encountered are hot grounds and fumaroles. No hot springs were encountered. Figure 4 shows the prospect hot area mapped using shallow gradient holes. It is demarcated by the 40oC isotherm. Areas of possible drills sites for further exploration through deep drilling have been suggested. 3.1.1 Discussion It was difficult to make holes in areas with fresh lava flow cover. Because of this, temperature gradients and areal extent in certain zones have been
180170160
9990
9980
9970
2200
2 100
200 0
1 900
18 00
1 70 0
1 6 00
1 7 0 0
180 0
1 800
2000
1900
2000
18001 800 1 800
1 800
1800
1800
18 00
1900
2000
2 100
2 160
2100
2200
2000
2000
21 00
2 000
19 00
180 0
1900
19 00
1900
2 0 00
200 0
2100
22 00
2300
220 0
1800
170
0
1 700
1800
1800
1800
17 00
170 0
1 600
1700
200
0 2200
2200
L. NAKURU
NAKURU TOWN LANET
R . N j oro
KIA
MU
NYI
ES
TAT
E
NGATA FA RM
ME NE N GA I S TAT ION
KABARAK ESTATE
CALDERAENGOSHURA FARM
KABATI NICrater stream
BAHATI
SOLAI
BANI TASISAL ESTATE
OLBANI TA SWAMP & PON D
Olbanita stream
kabaragi
KI SANANA
MAJANI MINGI ESTATE
ATHI NAI SI SAL E STATE
EL BONWAL A
OL' R
ON
GA
I HIL
LS
MEN EGAI HILL FARM
KAMPIYA MOTO
MOGOTI O
0 10KMLEGEND
2000 Contours in meters above sea level
Roads
Railway line
Rivers
Lake, Pond
Shoppingcenter
Pyroclastic issuecrates
Lava eruption center
Major (r ift scarp) fault
Rift floorfault
Inferred fault
00
II
Borehole
FumarolesProposed exploration well site
MW-1
MW-3MW-2
MW-3
MENENGAI
40
50
60
70
80
FIGURE 4: Heat loss results from Menengai prospect
Mwawongo 6 Geothermal mapping
extrapolated from temperature contours. For all practical purposes, this is considered well enough for field measurements.
Control points indicated no significant changes in ground temperature at 1 m depth due to seasonal variation. Orientation of the high temperature areas is in a NNW-SSE direction and suggests that a major fault/fracture zone could be in this direction and allows deep hot fluids to travel close to the surface causing localised heating. Another possible structure seems to occur in NE-SW direction as can be observed from the orientation of the high temperature areas in the caldera. Total heat loss estimated from the Caldera alone is in excess of 2,690 MWt indicating possibly a big hot body underneath which can be explored further for production of steam.
Areas around Olongai and Banita have low heat flow possibly because the geothermal system in this area is older. It could be of interest to drill deep exploration wells in the Menengai Caldera and in Olongai/Banita areas with priority being in the Menengai Caldera (Ofwona 2004). Estimated power potential is over 700 MWe (Mungania et al, 2004). 3.1.2 Conclusions Over 3,536 MWt of natural heat loss occurs in the Menengai/Olbanita geothermal prospect. 2,690 MWt is lost from the Menengai Caldera out of which 2,440 MWt is by convection through fumaroles. This large heat loss could be an indicator of a huge heat source underneath this prospect. 3.2 Arus and Bogoria geothermal prospects Arus and Lake Bogoria prospects are located to the north of Menengai and are not associated with any central volcano. Heat loss survey was done from 14th February to 8th July 2005 in an area of about 2,000 km2. Earlier work at Lake Bogoria prospect was done in 1973-1974 under the sponsorship of United Nations covering an area of 31 Km2. This study was regional starting from Turkana in the north to Lake Natron in the south. Other fields incorporated in the survey included Eburru, Olkaria and Lake Magadi. Infrared aerial photographs were taken over the named prospects. At Bogoria, the survey was localized around the lake where numerous geothermal surface manifestations are located. 40oC isotherm was used to delineate the thermally active area resulting in a total heat flow of 353 MWt
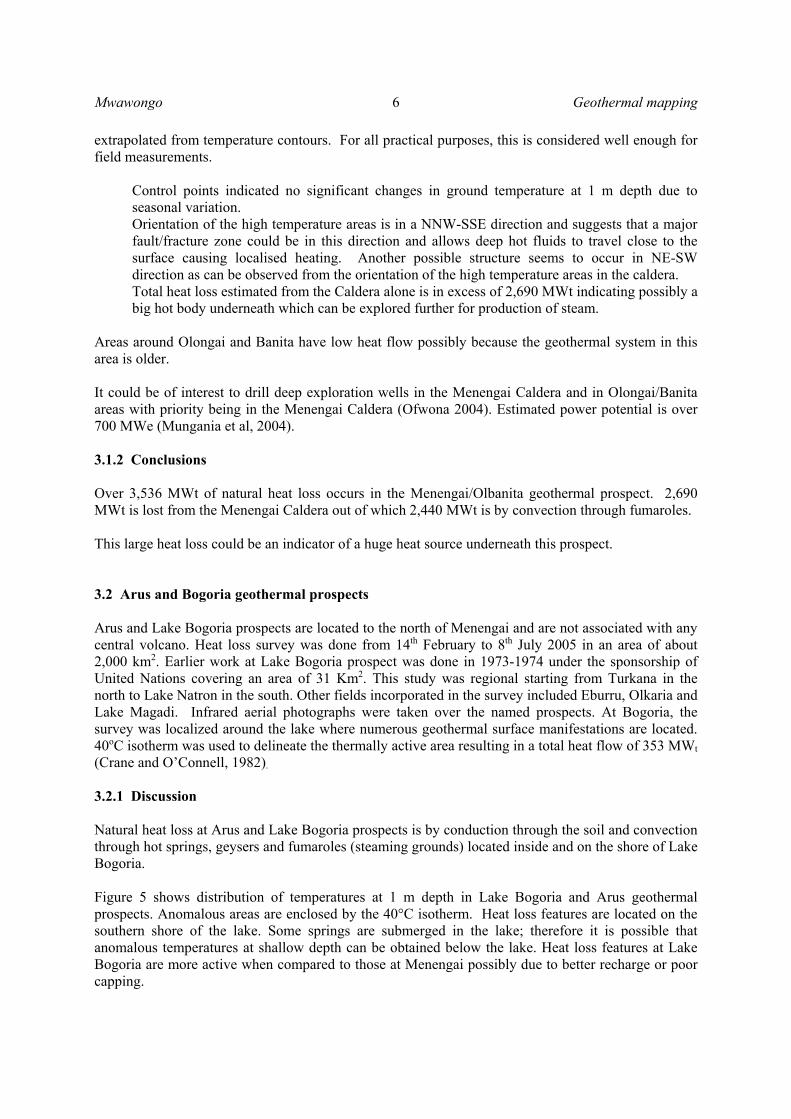
(Crane and O’Connell, 1982). 3.2.1 Discussion Natural heat loss at Arus and Lake Bogoria prospects is by conduction through the soil and convection through hot springs, geysers and fumaroles (steaming grounds) located inside and on the shore of Lake Bogoria. Figure 5 shows distribution of temperatures at 1 m depth in Lake Bogoria and Arus geothermal prospects. Anomalous areas are enclosed by the 40°C isotherm. Heat loss features are located on the southern shore of the lake. Some springs are submerged in the lake; therefore it is possible that anomalous temperatures at shallow depth can be obtained below the lake. Heat loss features at Lake Bogoria are more active when compared to those at Menengai possibly due to better recharge or poor capping.
Geothermal mapping 7 Mwawongo
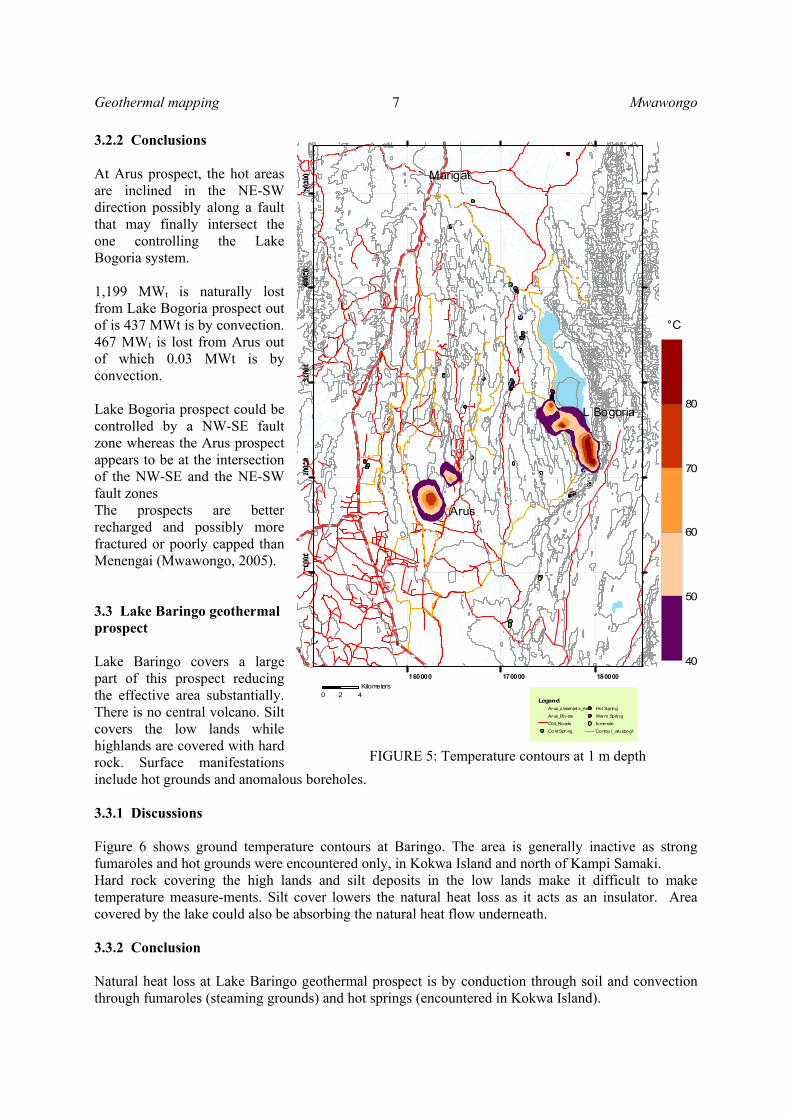
3.2.2 Conclusions At Arus prospect, the hot areas are inclined in the NE-SW direction possibly along a fault that may finally intersect the one controlling the Lake Bogoria system. 1,199 MWt is naturally lost from Lake Bogoria prospect out of is 437 MWt is by convection. 467 MWt is lost from Arus out of which 0.03 MWt is by convection. Lake Bogoria prospect could be controlled by a NW-SE fault zone whereas the Arus prospect appears to be at the intersection of the NW-SE and the NE-SW fault zones The prospects are better recharged and possibly more fractured or poorly capped than Menengai (Mwawongo, 2005). 3.3 Lake Baringo geothermal prospect Lake Baringo covers a large part of this prospect reducing the effective area substantially. There is no central volcano. Silt covers the low lands while highlands are covered with hard rock. Surface manifestations include hot grounds and anomalous boreholes. 3.3.1 Discussions Figure 6 shows ground temperature contours at Baringo. The area is generally inactive as strong fumaroles and hot grounds were encountered only, in Kokwa Island and north of Kampi Samaki. Hard rock covering the high lands and silt deposits in the low lands make it difficult to make temperature measure-ments. Silt cover lowers the natural heat loss as it acts as an insulator. Area covered by the lake could also be absorbing the natural heat flow underneath. 3.3.2 Conclusion Natural heat loss at Lake Baringo geothermal prospect is by conduction through soil and convection through fumaroles (steaming grounds) and hot springs (encountered in Kokwa Island).
GoitumetVolcano
Lake Bogoria
Marigat
0 42Kilometers
LegendArus_s teamjet s_Arc
Arus_Riv ers
Old_Roads
Cold Spr ing
Hot Spr ing
Warm Spring
fumerole
Contour_arusbog1
160000 170000 180000
L Bogoria
Arus
Marigat
40
50
60
70
80
°C
FIGURE 5: Temperature contours at 1 m depth
Mwawongo 8 Geothermal mapping
Total heat loss from the prospect is in excess of 1,049 MWt of which 941 MWt is by conduction and 108 MWt by convection. Of the total heat lost by convection, 105 MWt is lost in Kokwa Island. Heat loss features occur along NW-SE fault zones. Compared to Menengai, this heat loss is relatively low probably because the system could be older. There are indications (from alterations and old lavas) that it was once very active and has since cooled down. The prospect could be lowly ranked when compared to Menengai but nevertheless, could be explored further by deep drilling to estimate its power potential (Ofwona, 2004). 3.4 Korosi and Chepchuk
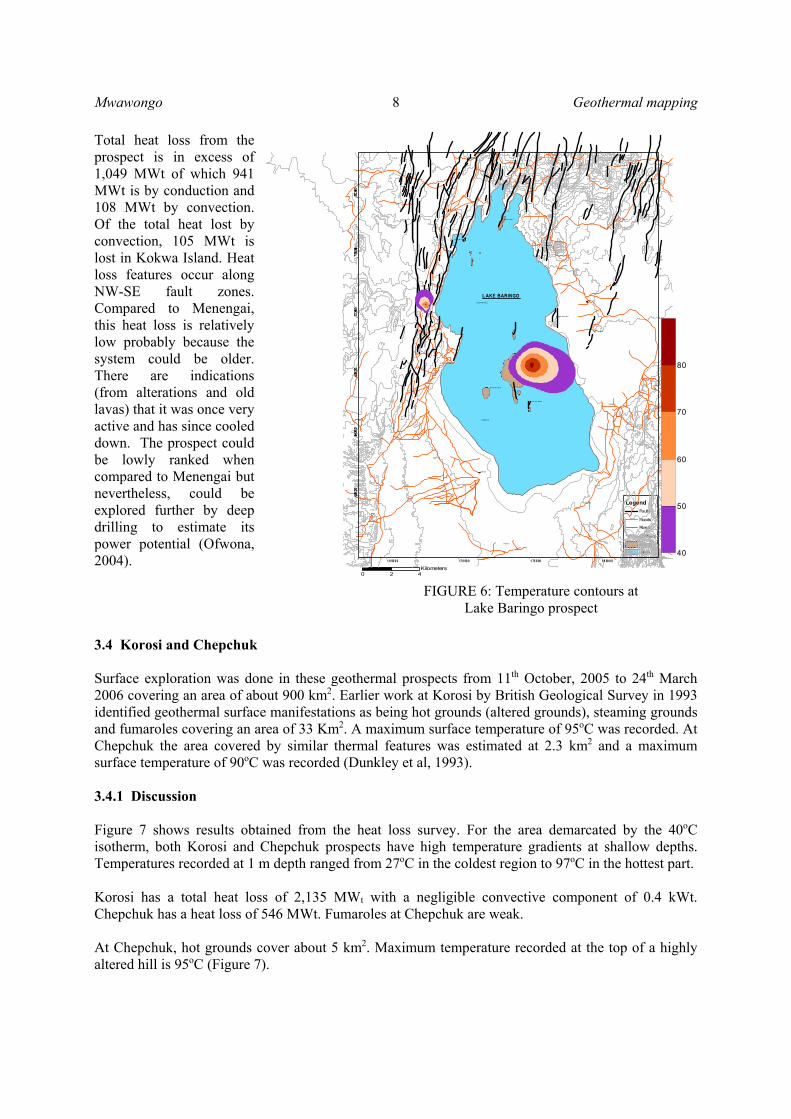
Surface exploration was done in these geothermal prospects from 11th October, 2005 to 24th March 2006 covering an area of about 900 km2. Earlier work at Korosi by British Geological Survey in 1993 identified geothermal surface manifestations as being hot grounds (altered grounds), steaming grounds and fumaroles covering an area of 33 Km2. A maximum surface temperature of 95oC was recorded. At Chepchuk the area covered by similar thermal features was estimated at 2.3 km2 and a maximum surface temperature of 90oC was recorded (Dunkley et al, 1993). 3.4.1 Discussion Figure 7 shows results obtained from the heat loss survey. For the area demarcated by the 40oC isotherm, both Korosi and Chepchuk prospects have high temperature gradients at shallow depths. Temperatures recorded at 1 m depth ranged from 27oC in the coldest region to 97oC in the hottest part. Korosi has a total heat loss of 2,135 MWt with a negligible convective component of 0.4 kWt. Chepchuk has a heat loss of 546 MWt. Fumaroles at Chepchuk are weak. At Chepchuk, hot grounds cover about 5 km2. Maximum temperature recorded at the top of a highly altered hill is 95oC (Figure 7).
LegendFaults
Roads
Rivers
Contours
Islands
Lakes
0 42Kilometers
L AKE BARINGO
E nda o
Loruk
R UGU S
KE CH I
LOR UK
N gambo
B AR IN GO
N api yet
L emuyet
S ala bani
N osug uro
K omol io n
K OKWOMO W
Loi min ange
N AK UR AT AB EM
LA KE B AR INGO
KOKW A IS LA ND
Les ukut Isl and
L ekoros I slan d
R ong ena I sla nd
Parmal ok Is lan d
KA MPI YA S AMA KI
Lon gich aro Isl and
1 6 50 0 0 17 0 00 0 1 75 0 00 1 8 00 0 0
40
50
60
70
80
FIGURE 6: Temperature contours at Lake Baringo prospect

Geothermal mapping 9 Mwawongo
3.4.2 Conclusions Natural heat loss at Korosi and Chepchuk geothermal prospects is mainly by conduction through soil and very little by convection through weak fumaroles or steaming grounds. These features are located along fault lines in both prospects. At Korosi heat loss features display a NE-SW and NW-SE trend while at Chepchuk the trend is not well defined (Mwawongo, 2005). Estimated power potential at the two prospects is over 750 MWe (Ofwona C.O. et al, 2007) 3.5 Paka Paka is a volcano built by trachyte, basalt lavas and pyroclastic deposits. Surface exploration was done from 18th September 2006 to 30th March 2007 covering an area of about 500 km2. Earlier work at Paka by British Geological Survey between 1988 and 1993 identified geothermal manifestations as being hot grounds (altered grounds), steaming grounds and fumaroles covering approximately an area of 32 Km2. Ground temperatures recorded ranged from 50.2 to 94.5oC while fumarole temperatures ranged from 74 to 97.8oC in the caldera (Dunkley et al, 1993). 3.5.1 Discussion Heat loss features in Paka (Figure 8) especially the fumaroles in the crater are bigger and more active when compared to those found at Korosi and Chepchuk prospects. This suggests better fluid recharge and less sealing of the flow paths at Paka.
0 42Kilometers
LegendContours
Lakes
Roads
Eruption_Centres
Faults
St ructure s
TYPE
I nfered Fault
Major Fault
Minor Fault
Locations
Loruk
K EC H I
N apiy e t
Lemu yet
K om olion
KO KW O MOW
Leko ros Is land
R ongena Is land
T U W A
K E C H I
D R IF T
Kot ang
K OKO R E
K OR OS IMuruas e
K OK W OM OW
A D OM EY ON
N agore t e i
T AN GU LB E I
C hepc hock
C H E B U N GU S
St eam J etsC H ES I R IM ION
S I TO/ LOC H EL
K iny ac h C ra t er
T apogh W ater ing P lac eLAK E T ILA M (Seas ona l )I mem bet W at er ing P lac e
170000 175000 180000 185000 190000
40
50
60
70
80
°C
FIGURE 7: Temperature contours at Korosi & Chepchuk
Paka Craters
Lake Tulam
0 63KilometersLegend
G ulley s
R o ads
C raters
Lak es
Structures
TYPE
In f ered Fault
Maj or F ault
Min or F ault
175000 180000 185000 190000 195000
40
50
60
70
80
FIGURE 8: Temperature contours at Paka, Chepchuk & Korosi
Mwawongo 10 Geothermal mapping
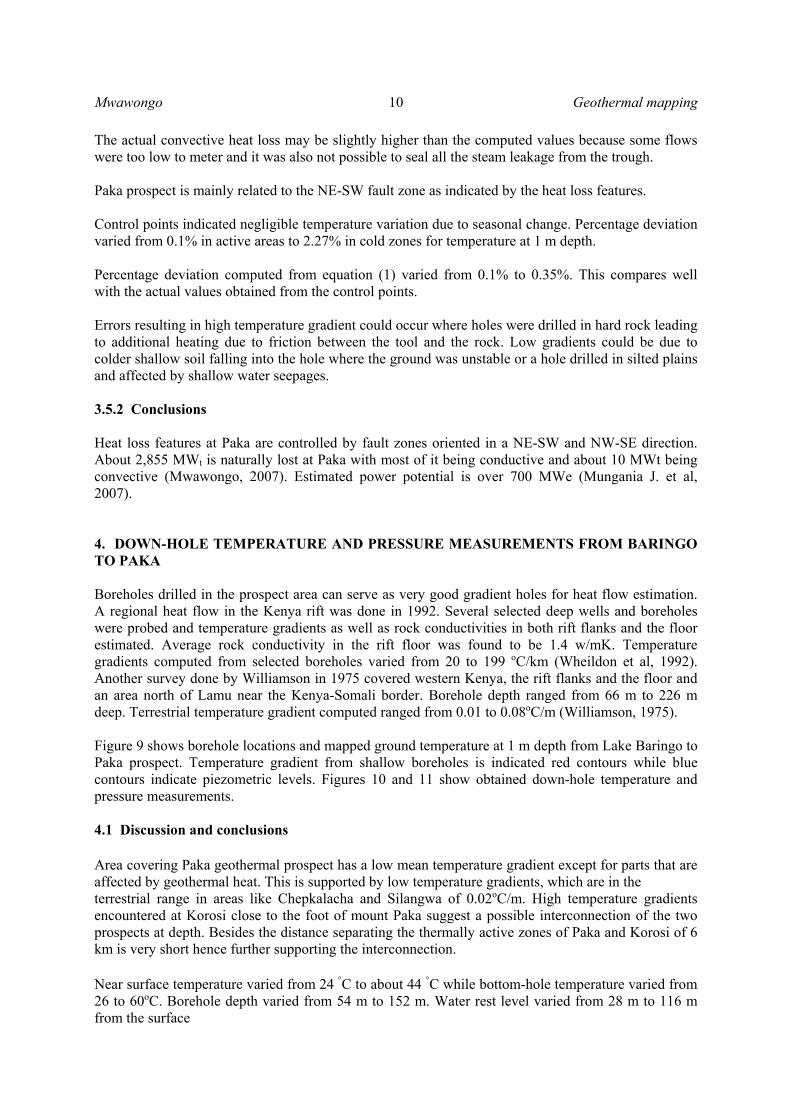
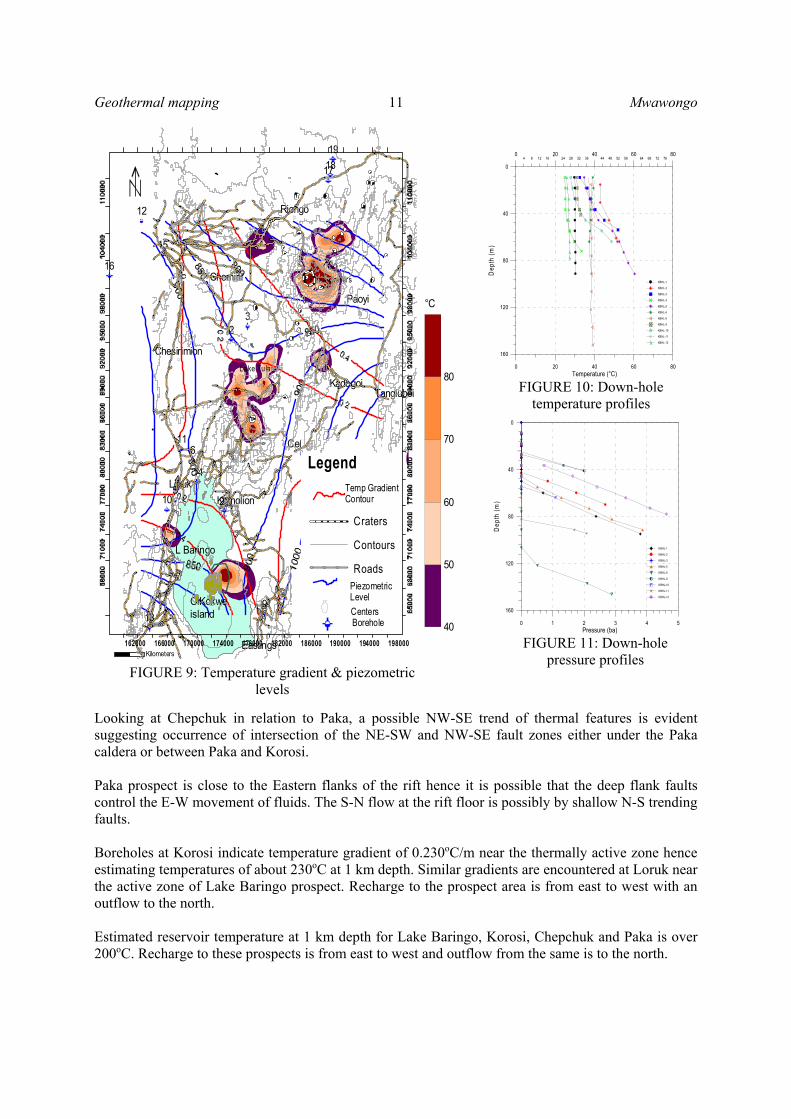
The actual convective heat loss may be slightly higher than the computed values because some flows were too low to meter and it was also not possible to seal all the steam leakage from the trough. Paka prospect is mainly related to the NE-SW fault zone as indicated by the heat loss features. Control points indicated negligible temperature variation due to seasonal change. Percentage deviation varied from 0.1% in active areas to 2.27% in cold zones for temperature at 1 m depth. Percentage deviation computed from equation (1) varied from 0.1% to 0.35%. This compares well with the actual values obtained from the control points. Errors resulting in high temperature gradient could occur where holes were drilled in hard rock leading to additional heating due to friction between the tool and the rock. Low gradients could be due to colder shallow soil falling into the hole where the ground was unstable or a hole drilled in silted plains and affected by shallow water seepages. 3.5.2 Conclusions Heat loss features at Paka are controlled by fault zones oriented in a NE-SW and NW-SE direction. About 2,855 MWt is naturally lost at Paka with most of it being conductive and about 10 MWt being convective (Mwawongo, 2007). Estimated power potential is over 700 MWe (Mungania J. et al, 2007). 4. DOWN-HOLE TEMPERATURE AND PRESSURE MEASUREMENTS FROM BARINGO TO PAKA Boreholes drilled in the prospect area can serve as very good gradient holes for heat flow estimation. A regional heat flow in the Kenya rift was done in 1992. Several selected deep wells and boreholes were probed and temperature gradients as well as rock conductivities in both rift flanks and the floor estimated. Average rock conductivity in the rift floor was found to be 1.4 w/mK. Temperature gradients computed from selected boreholes varied from 20 to 199 oC/km (Wheildon et al, 1992). Another survey done by Williamson in 1975 covered western Kenya, the rift flanks and the floor and an area north of Lamu near the Kenya-Somali border. Borehole depth ranged from 66 m to 226 m deep. Terrestrial temperature gradient computed ranged from 0.01 to 0.08oC/m (Williamson, 1975). Figure 9 shows borehole locations and mapped ground temperature at 1 m depth from Lake Baringo to Paka prospect. Temperature gradient from shallow boreholes is indicated red contours while blue contours indicate piezometric levels. Figures 10 and 11 show obtained down-hole temperature and pressure measurements. 4.1 Discussion and conclusions Area covering Paka geothermal prospect has a low mean temperature gradient except for parts that are affected by geothermal heat. This is supported by low temperature gradients, which are in the terrestrial range in areas like Chepkalacha and Silangwa of 0.02oC/m. High temperature gradients encountered at Korosi close to the foot of mount Paka suggest a possible interconnection of the two prospects at depth. Besides the distance separating the thermally active zones of Paka and Korosi of 6 km is very short hence further supporting the interconnection. Near surface temperature varied from 24 °C to about 44 °C while bottom-hole temperature varied from 26 to 60oC. Borehole depth varied from 54 m to 152 m. Water rest level varied from 28 m to 116 m from the surface
Geothermal mapping 11 Mwawongo
Looking at Chepchuk in relation to Paka, a possible NW-SE trend of thermal features is evident suggesting occurrence of intersection of the NE-SW and NW-SE fault zones either under the Paka caldera or between Paka and Korosi. Paka prospect is close to the Eastern flanks of the rift hence it is possible that the deep flank faults control the E-W movement of fluids. The S-N flow at the rift floor is possibly by shallow N-S trending faults. Boreholes at Korosi indicate temperature gradient of 0.230oC/m near the thermally active zone hence estimating temperatures of about 230oC at 1 km depth. Similar gradients are encountered at Loruk near the active zone of Lake Baringo prospect. Recharge to the prospect area is from east to west with an outflow to the north. Estimated reservoir temperature at 1 km depth for Lake Baringo, Korosi, Chepchuk and Paka is over 200oC. Recharge to these prospects is from east to west and outflow from the same is to the north.
0 20 40 60 80Temperature (°C)
0
40
80
120
160
Dep
th (
m)
4 8 12 16 24 28 32 36 44 48 52 56 64 68 72 760 20 40 60 80
KBHL-1
KBHL-2
KBHL-3
KBHL-4
KBHL-5
KBHL-6
KBHL-8
KBHL-9
KBHL-10
KBHL-11
KBHL-12
FIGURE 10: Down-hole temperature profiles
0 1 2 3 4 5Pressure (ba)
0
40
80
120
160
Dep
th (
m)
KBHL-1
KBHL-2
KBHL-3
KBHL-5
KBHL-8
KBHL-9
KBHL-10
KBHL-11
KBHL-12
FIGURE 11: Down-hole pressure profiles
Eastings
Tanglubei
Paoyi
Riongo
Loruk
Chesirimion
Chemiril
Kadogoi
Cepkalacha
Komolion
1
23
45
6 78
9
10
11
12
13
14
15
16
1718
19
2021
L Baringo
OlKokweisland
40
50
60
70
80
°C
Legend
Craters
Contours
Roads
Paka C raters
Lake Tulam
0 42Kilometers
162000 166000 170000 174000 178000 182000 186000 190000 194000 198000
Piezometric Level
CentersBorehole
Temp GradientContour
FIGURE 9: Temperature gradient & piezometric levels
Mwawongo 12 Geothermal mapping
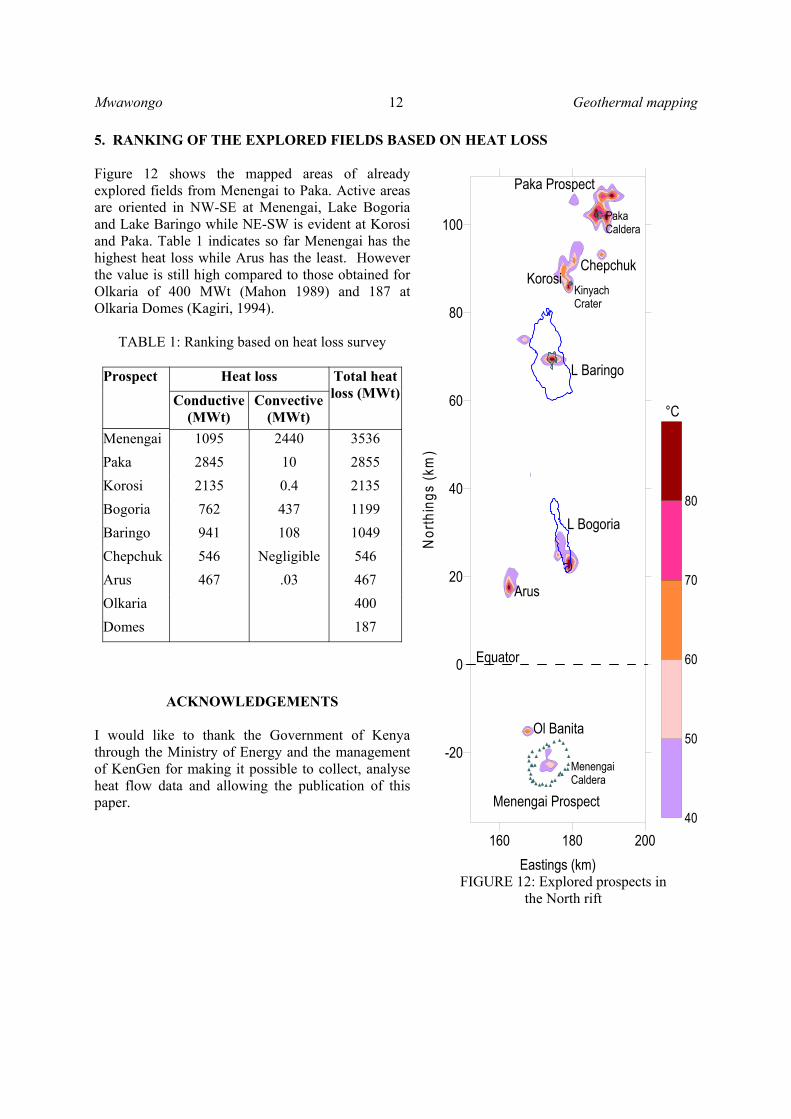
5. RANKING OF THE EXPLORED FIELDS BASED ON HEAT LOSS Figure 12 shows the mapped areas of already explored fields from Menengai to Paka. Active areas are oriented in NW-SE at Menengai, Lake Bogoria and Lake Baringo while NE-SW is evident at Korosi and Paka. Table 1 indicates so far Menengai has the highest heat loss while Arus has the least. However the value is still high compared to those obtained for Olkaria of 400 MWt (Mahon 1989) and 187 at Olkaria Domes (Kagiri, 1994).
TABLE 1: Ranking based on heat loss survey
Prospect Heat loss Total heat loss (MWt) Conductive
(MWt) Convective
(MWt)
Menengai 1095 2440 3536
Paka 2845 10 2855
Korosi 2135 0.4 2135
Bogoria 762 437 1199
Baringo 941 108 1049
Chepchuk 546 Negligible 546
Arus 467 .03 467
Olkaria 400
Domes 187
ACKNOWLEDGEMENTS
I would like to thank the Government of Kenya through the Ministry of Energy and the management of KenGen for making it possible to collect, analyse heat flow data and allowing the publication of this paper.
FIGURE 12: Explored prospects in the North rift
160 180 200
Eastings (km)
-20
0
20
40
60
80
100
Nor
thin
gs
(km
)
40
50
60
70
80
°C
PakaCaldera
ChepchukKorosi
L Baringo
L Bogoria
Arus
Ol Banita
MenengaiCaldera
KinyachCrater
Equator
Paka Prospect
Menengai Prospect
Geothermal mapping 13 Mwawongo
REFERENCES
Crane. K. and O’Connell. S., 1982: The distribution and implications of heat flow from the Gregory Rift in Kenya. Journal of Tectonophysics, pp 253-273. Dunkley. P. N., Smith .M., Allen, D.J., and Darling, W.G., (1993): The geothermal activity and geology of the north sector of the Kenya Rift Valley. British Geological Survey Research Report SC/93/1. Glover, R. I., 1972: Chemical characteristics of water and steam discharges in the rift valley. U. N. geothermal resources exploration project report. Jaeger J.C and Carslaw H. S, 1959: Conduction of Heat in Solids, Oxford science publications pp 510. Kagiri, D. N., 1994: Update of heat loss from the Domes prospect. Kenya Power Company Ltd. report. Mahon, W. A. J., 1989: The natural heat flow from and the structure of the Olkaria geothermal system. Prepared by Geothermal Energy New Zealand Ltd., for the Kenya Power Company Ltd. Mwawongo G.M, 2005: Heat loss assessment of Arus and Lake Bogoria geothermal prospects, KenGen internal report, pp 9. Mwawongo G.M, 2006: Heat loss assessment of Korosi and Chepchuk geothermal prospects, KenGen internal report, pp 19. Mwawongo G.M, 2007: Heat loss assessment of Paka geothermal prospects, KenGen internal report, pp 17. Mungaina .J, Lagat J., Mariita N.O, Wambugu J, W, Ofwona C. O, Kubo B M, Kilele D K, Mudachi V.S, Wanje C K, 2004: Menengai Prospect: Investigations for its geothermal potential. Government of Kenya and Kenya Electricity Generating Company Ltd internal report pp 91. Ofwona C.O., 2004: Heat loss assessment of Menengai-Olbanita geothermal prospect, KenGen internal report pp 17. Ofwona C.O., 2004: Heat loss assessment of Lake Baringo geothermal prospect KenGen Internal report, pp 17 Wheildon.J, Morgan .P, Williamson K.H, Evans T.R, Swanber C.A, 1994: Heat flow in the Kenya rift zone, Journal of Tectonophysics 19 pp. Williamson K. H, 1975: Terrestrial heat study in Kenya, Phd thesis, pp 290.


![[FISIKA SMA kelas XII] Penerapan Hukum Bernoulli Pada Venturimeter](https://img.dokumen.tips/doc/110x75/55cf9c83550346d033aa1468/fisika-sma-kelas-xii-penerapan-hukum-bernoulli-pada-venturimeter.jpg)


