Embed Size (px)
Citation preview

Final Report
Geothermal Exploration in
Montserrat, Caribbean
Prepared for
Minister of Communications and Works
Government of Montserrat, Caribbean
January 2010
By
EGS Inc.
Santa Rosa, California

Contents
FINAL REPORT: GEOTHERMAL EXPLORATION IN MONTSERRAT, CARIBBEAN
1.0 INTRODUCTION ...................................................................................................................... 1 1.1 Background and Proposal ............................................................................................... 1 1.2 Scope of Work ................................................................................................................. 3 1.3 Previous Work ................................................................................................................. 3 2.0 GEOLOGIC AND TECTONIC SETTING OF MONTSERRAT ......................................................... 1 2.1 Geology of the Lesser Antilles ........................................................................................ 2 2.2 Geologic Setting of Montserrat Island ............................................................................ 2 2.3 Structural and Tectonic Setting of Montserrat .............................................................. 4 2.4 Eruptive Activity and Seismicity ...................................................................................... 5 2.5 GIS and other Spatial Data Resources (EGS Task 1.0) .................................................... 6 2.6 Detailed Geology of the St. Georges Hill area (EGS Task 2.0) ........................................ 8 2.7 Geothermal Exploration on Montserrat ....................................................................... 13 3.0 GEOPHYSICS (MT and TEDM Surveys) ................................................................................... 1 3.1 Introduction .................................................................................................................... 1 3.2 Purpose and Objectives of Geophysical Exploration ...................................................... 2 3.3 Field Activities ................................................................................................................. 3 3.4 Data Collection Methodology ......................................................................................... 6 3.5 TDEM and MT Resistivity Results ................................................................................... 8 3.6 Microseismicity (MEQ) Studies ..................................................................................... 21 3.7 Shear-wave Splitting Analysis ....................................................................................... 21 3.8 Seismic tomography...................................................................................................... 24 3.9 Geothermal Resource Conceptual Model .................................................................... 31 3.10 Geophysics Summary and Conclusions ...................................................................... 34 4.0 MONTSERRAT FLUID GEOCHEMISTRY ................................................................................... 1 4.1 Sampling Background ..................................................................................................... 1 4.2 Recent sampling .............................................................................................................. 3 4.3 Analytical results ............................................................................................................. 6 4.4 Replicate sampling .......................................................................................................... 6 4.5 Major and trace element geochemistry ......................................................................... 7 4.6 Light stable isotopes ..................................................................................................... 12 4.7 Conclusions ................................................................................................................... 16 4.8 Thermal study of the Hot Water Pond ......................................................................... 19 5.0 GEOTHERMAL CONCEPTUAL MODEL AND RECOMMENDATIONS FOR FUTURE
DEVELOPMENT ...................................................................................................................... 1 5.1 Heat source ..................................................................................................................... 1

5.2 Structure / Permeability ................................................................................................. 1 5.3 Hydrogeology .................................................................................................................. 2 5.4 Geophysics ...................................................................................................................... 2 5.5 Geochemistry .................................................................................................................. 3 5.6 Conceptual model ........................................................................................................... 3 5.7 Recommendations for future geothermal development ............................................... 4 6.0 DRILLING COST ESTIMATES .................................................................................................... 1 6.1 Slim hole cost estimates ................................................................................................. 1 6.2 Overview and assumptions ............................................................................................. 2 6.3 Proposed rig type ............................................................................................................ 3 6.4 Production well ............................................................................................................. 10 6.5 Overview and assumptions ........................................................................................... 10 6.6 Proposed rig type .......................................................................................................... 11 7.0 SUMMARY AND CONCLUSIONS ............................................................................................. 1 REFERENCES APPENDICES
List of Tables
Section 3:
Table 3.1 Summary of suitable candidate events for S-wave splitting analysis. Section 4: Table 4.1 Summary of Montserrat Geochemical Analyses from Chiodini and others
(1996) and EGS/ThermoChem (2009) Table 4.2 Comparative Analytical Results for CI-rich Hot Springs, Montserrat Table 4.3 Comparative Montserrat Geothermometer Estimates Section 5: Table 5.1 Depth to groundwater / seawater interface

List of Figures
Section 1 Figure 1.1 Location Map Figure 1.2 Project Organizational Chart Section 2 Figure 2.1: Bathymetry and tectonics features of the Lesser Antilles arc Figure 2.2: Seismicity cross-section under Montserrat Figure 2.3: Montserrat bathymetry Figure 2.4: Summary geologic map of Montserrat Figure 2.5: Seismicity and main fault in the Montserrat vicinity Figure 2.6: Eruptive center alignment in the southern part of Montserrat island Figure 2.7: Epicentres location of volcano-seismic events at the start of 1995 crisis (from Aspinall et al., 1998) Figure 2.8: Garibaldi Hill cliffs, from the north of the Old Road Bay Figure 2.9: Evidence of normal faulting on Garibaldi cliffs Figure2.10: St George's Hill, from Garibaldi Hill. Figure2.11: Structural interpretation of St George's Hill. Figure 2.12: Lithologic picture Figure 2.13 The Development of the Soufriere Hills Figure 2.14 Lineament map Figure 2.15 Schematic model of hydrothermal system Section 3 Figure 3.1: Project Area Figure 3.2: Events located during A) the 1933-1937 seismic swarm [Powell, 1938] B) 1966-1967 seismic swarm [Shepherd et al., 1971] C) 1995 seismic swarm [Aspinall et al., 1998] Figure 3.3: Layout of MT equipment Figure 3.4: Typical equipment layout for TDEM measurement Figure 3.5: Map of Montserrat showing locations MT and TDEM sites Figure 3.6: Resistivity map at sea level Figure 3.7: Resistivity map at 500 mbsl Figure 3.8: Resistivity map at 1000 mbsl Figure 3.9: Conductance map at a depth of 500 to 1000m Figure 3.10: Resistivity map at 4000 mbsl Figure 3.11: Location TDEM/ MT stations and 2D profiles Figure 3.12: 2D EW resistivity through from Garibaldi Hill to White’s yard Figure 3.13: 2D NE resistivity through Centre Hills Figure 3.14: MVO seismic network in April 2006 Figure 3.15: Location of MEQ Figure 3.16: Seismic tomography map of Montserrat Figure 3.17: Vp perturbation at 2km depth on the left panel and cross-sections Figure 3.18: Integrated resistivity map at 3000 mbsl, seismic tomography map and MEQ locations

Figure 3.19: DEM and bathymetry for Montserrat with overlay of seismic velocity anomalies Figure 3.20: Integration of seismic tomography resitivity and MEQ data Figure 3.21: Integrated resistivity map at -3000 mbsl and MEQ locations Figure 3.22: Primary target area as determined from interpretation of geophysical data Section 4 Figure 4.1 Location and characteristics of Keith Consulting water wells. Figure 4.2 Ternary Cl-HCO3-SO4 plot of Montserrat spring chemistry Figure 4.3 Ternary Na-K-Mg plot of Montserrat spring chemistry Figure 4.4 Expanded Giggenbach plot) of Mg/Ca vs. K/Na Figure 4.5 Chloride-Quartz Geothermometer Enthalpy Figure 4.6 Comparative K/Mg vs. K/Ca geothermometer plot Figure 4.7 Ternary Cl-B-Li plot of Montserrat spring chemistry Figure 4.8 Ca-SO4 relationships in Montserrat spring chemistry Figure 4.9 SO4-Cl cross plot of Montserrat spring chemistry Figure 4.10 Light stable isotopes for Montserrat spring samples Figure 4.11 Complex stable isotopic relations for Montserrat spring samples Figure 4.12 Potassium/Magnesium Silica plot Figure 4.13 measurement sites, t: temperature holes, HWP; Hot Water Pond water Figure 4.14 Hydrothermal alteration area in the Hot Water Pond
List of Appendices
A. Scope of Work B. Documents in EGS Inc. Library C. Geophysics – Field Work Safety Plan D. Geophysics – MT Soundings E. Geochemistry – Geochemical Survey of Montserrat, Lesser Antilles, Field
Work Summary Report

• Section 1: Introduction: Page 1
Final Report: Geothermal Exploration
in Montserrat, Caribbean
1.0 Introduction
1.1 Background and Proposal
In late 2008, the Government of Montserrat, through the Montserrat Energy Committee,
solicited proposals from four geothermal consulting companies to complete the second
phase of geothermal exploration on the Island of Montserrat in the Caribbean. The overall
goal of the project was to assess the economic feasibility of generating electrical power
from the islands geothermal resources.
Montserrat is located in the Caribbean (Figure 1.1) and, as with many of the islands of the
Caribbean Lesser Antilles is volcanic in origin. As a result, many of the islands have the
potential for geothermal electrical power generation and geothermal exploration projects
do exist on many of the islands at various stages of development. Nevis, Saba, St Vincent, St
Lucia and Dominica have all had some degree of geothermal assessment either currently or
in the immediate past. One existing geothermal power plant is located on the French island
of Guadaloupe at Boulliante and has a total capacity of 15 megawatts electrical (MWe).
Figure 1.1 Montserrat Location Map

• Section 1: Introduction: Page 2
EGS Inc. (EGS) is a geothermal exploration company based in Santa Rosa, California, USA and
has a long history of exploration of geothermal resources throughout the world. In response
to a solicitation by the Government of Montserrat, on December 18, 2008 EGS submitted a
scope of work and cost proposal (the EGS Proposal). The basis for the original scope of work
were recommendations made in a Scoping Survey Report prepared by the Istituto di
Geoscienze e Georisorse (IGG) of Pisa, Italy on behalf of the United Nations Economic
Commission for Latin America and the Caribbean (UN ECLAC) (Principe, 2008). Having
reviewed the Scoping Survey Report, EGS suggested certain modifications to the IGG
recommendations. These modifications were reflected in the EGS Proposal and are
summarized below:
Removal of a soil CO2 flux survey considered to be impractical given the loose
permeable soils in the area and the potential contamination by CO2 from recent
volcanic activity
Modification of the proposed “geo-electric profiles” task to specify a TDEM/MT
survey.
Addition of preliminary cost estimates for various drilling options.
A major constraint in completing geothermal exploration in Montserrat is the ongoing
eruption of the Soufriere Hills volcano. Many geothermal systems around the world owe
their existence to magmatic heat sources associated with recent volcanic systems. In most
cases the volcanic systems are dormant and have had no surface eruptions within recent
geologic time. In rare cases the volcanic systems can still be active, as is the case in
Montserrat, in which case extreme care needs to be taken to ensure that all activities are
carried out in a safe and prudent manner and that all risks associated with having personnel
in an active volcanic area are minimized to the greatest extent practical.
Major personnel responsible for preparing this report, along with responsibilities and
affiliations, are presented in Figure 1.2.

• Section 1: Introduction: Page 3
Figure 1.2 Project Organization Chart
1.2 Scope of Work
A detailed scope of work for the project is presented in Appendix A and was made part of
the original Proposal by EGS to the Government of Montserrat. In summary the work plan
included:
Task 1.0 - Geological Survey and Data Acquisition
Task 2.0 – Geochemical Sampling and Interpretation
Task 3.0 – Geophysical Survey
Task 4.0 – Microearthquake (MEQ) Analysis
Task 5.0 - Final Report
In addition to the above tasks a detailed estimate of drilling costs was prepared for both a
geothermal production well and a slim hole. The purpose of these estimates was to allow
planning for future geothermal development activities and to enable the preparation of
funding documents for those activities. Preparation of the drilling cost estimates was funded
through Task 2.0 because excess budget was available as a result of a reduction of the
number of geochemical sites that could be sampled.

• Section 1: Introduction: Page 4
1.3 Previous Work
1.3.1 Geothermal Studies
A number of preliminary studies have been completed on Montserrat, aimed at evaluating
the geothermal potential of the island. These include:
A preliminary investigation by Wright et al; in 1976
United Nations/CARICOM (Caribbean Community) funded geothermal exploration
project completed by Geotermica Italiana (IGG) from 1991-1992
Report prepared by Dr. Paul Younger for Montserrat Utilities Ltd. On behalf of the
Institute for Research on Environment and Sustainability, University of Newcastle
Upon Tyne, UK.
Geothermal Scoping Study completed jointly by IGG, Geothermex in February 2008
1.3.2 Other Studies
The onset of eruptive volcanism of the Soufriere Hills volcano in 1995 has prompted a vast
amount of available data in i) peer-reviewed journals, ii) technical reports from the
Montserrat Volcanic observatory (MVO), and iii) as anecdotal and documents. Much of this
scientific data focuses on the detailed chronology and the physical nature of the eruptive
history, societal impacts and risk assessments. However within these data sources there are
many useful datasets that were be helpful in interpreting the subsurface potential for
geothermal reservoir development. EGS has spent significant time reviewing that available
data and utilizing that which can help in interpreting the nature and extent of a potential
geothermal system. A complete list of documents available to EGS and now held in EGS’s
technical library are presented in Appendix B. Where specific data has been used in this
report the appropriate citation is provided and these citations are presented in the
Reference section under report chapter headings.

• Section 2: Regional Geology: Page 1
2.0 Geologic and Tectonic Setting of Montserrat The island of Montserrat is in the northern section of the Lesser Antilles Arc in the eastern Caribbean. It is a volcanic island that includes three major volcanic centers that range in age from Pleistocene to present day.
2.1 Geology of the Lesser Antilles
The American and the Caribbean plates converge in a roughly ENE direction at the north boundary of the Lesser Antilles arc, at a known rate of 2 cm/yr (Deng and Sykes, 1995; Dixon et al., 1998; DeMets et al., 2000). This motion is absorbed by the subduction of the Atlantic sea floor under the arc (Figure 2.1) (Feuillet et al., 2002). The Lesser Antilles island arc was initiated in the early Cretaceous, it can be considered as the oldest active intraoceanic island arc in the world. The main characteristics of the arc are: old subducted oceanic crust, a slow convergence rate, low volcanic production rate, low seismicity level, and a single back-arc spreading phase (Bouysse et al., 1989).
Figure 2.1: Bathymetry and tectonics features of the Lesser Antilles arc
(from geoazur.oca.eu)
The seismicity cross section, passing thru Montserrat, and perpendicular to the Lesser Antilles arc shows clear pattern of seismicity associated with slab subduction ranging in depth from 50 to 200 km and dipping at that the clusters of seismicity fit a 50° dip of a typical Benioff zone (Bengoubou-Valerius et al., 2008)(Figure 2.2).

• Section 2: Regional Geology: Page 2
Figure 2.2: Seismicity cross-section under Montserrat (Bengoudou-Valerius et al., 2008)
2.2. Geologic Setting of Montserrat Island
Montserrat island is built on the south-central part of a submarine bank which is 200 m below sea level, and measures 15 km east-west by 25 km north-south .
Figure 2.3: Montserrat bathymetry (from the British Antarctic survey)
The island is a complex, of successive andesitic eruptive centers ranging in age from the older Silver Hills (2,580 +/- 60 ka and 1,160 +/- 46 ka) and Centre Hills (954 +/- 12 and

• Section 2: Regional Geology: Page 3
550 +/- 23 ka)( Harford et al., 2002) in the north to the currently active Soufrière and South Soufrière Hills in the southern half of the island. (Figure 2.4)
Fig 2.4 Summary geologic Map of Montserrat
The eruptive units that built the island are almost entirely andesitic. The complex of Silver Hill is composed of two-pyroxene andesite lavas and agglomerates and the two-pyroxene and hornblende-hypersthene andesite Centre Hills complex is characterized by steep-sided peaks surrounded by aprons of block, ash flow and surge deposits, a pumice lapilli fall deposit and mudflow/lahar deposits (Rea, 1974). The Soufriere Hills volcano complex andesitic occupies the southern half of the island. The summit area consists primarily of a series of andesitic lava domes emplaced along a ESE-trending zone with block-and-ash flow and surge deposits associated with dome growth predominating on the flanks (Smithsonian, 2009). Prior to 1995, the youngest dome was Castle Peak, breached by English's Crater, a 1-km-wide crater formed by a summit collapse during an eruption approximately 4000 years ago that produced a large submarine debris avalanche down the east flank.

• Section 2: Regional Geology: Page 4
Garibaldi Hill, Richmond Hill and St George’s Hill, three small parasitic or flank eruptive centers on the southwest side of the island, are the main target for the present work and are discussed in detail in later sections.
2.3 Structural and Tectonic Setting of Montserrat
Submarine bathymetry, subaerial morphology and the location of epicenters suggest that two prominent regional fault systems dominate the regional structural framework of Montserrat (Figure 2.5). The NNW-SSE striking Basse-Terre – Montserrat fault (also known as the Montserrat - Marie Galante fault) is an important regional fault system extending from south of Montserrat to the west of Guadeloupe and deforms the southern sector of Montserrat. The Redonda fault system, named for a small island located a few miles west of Montserrat, strikes WNW but is less distinct that the Basse-Terre system and has been mapped in cliff exposures on both east and west coast of Montserrat.
Figure 2.5: Seismicity and main fault in the Montserrat vicinity
The trace of the Redonda fault passes beneath Soufriere Hills and deforms old and young volcanic centers on the island and has been interpreted as the structural control for the alignment of younger volcanic centers St George’s Hill, Garibaldi Hill west of the Soufriere Hills (Figure 2.6). Wadge and Isacs (1998) suggested that the Redonda fault was a zone of deeper crustal weakness that acted as upflow path for rising magmas erupted from Soufriere Hills and regarded this fault as a preferential zone for future eruptions.

• Section 2: Regional Geology: Page 5
Figure 2.6 Eruptive center alignment in the southern part of Montserrat island.
2.4 Eruptive Activity and Seismicity
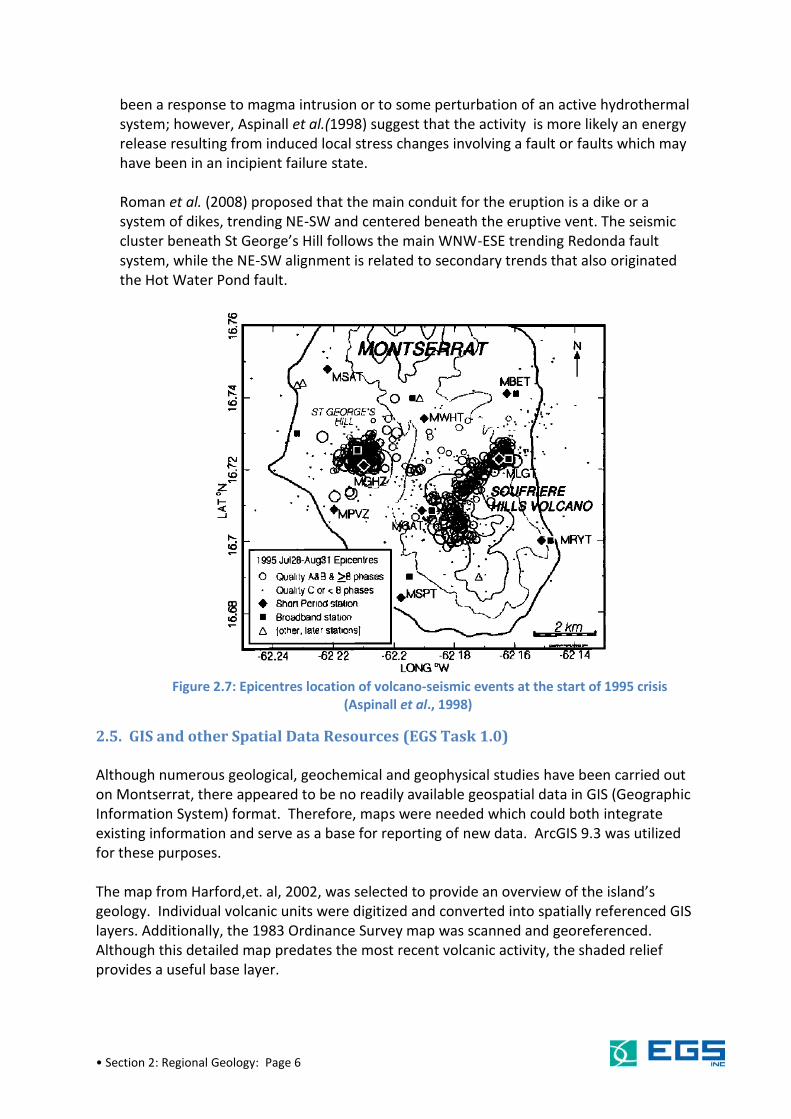
Non-eruptive seismic swarms occurred at 30-year intervals in the 20th century, but the first historical eruption on Montserrat did not take place until 1995 (Smithsonian, 2009). Three volcano-seismic crises occurred in southern Montserrat in 1897-1898 (?), 1933-1937, and 1966-1967 (Wadge and Isacs, 1988). The 1897-1898 is documented in the island’s history but remains poorly known. The earthquake foci of the 1933-1937 crises were probably localized at depth of 1-2 km below the Soufriere Hills and St George’s Hill, with depth decreasing from 5.2 to 2.8 km in the first 9 months. This crisis was mostly caused by magma movement to 4-5 km below the surface (Shepherd et al., 1971). A seismic surveillance network has been installed on Montserrat Island by the Montserrat Volcanology Observatory. This network continues to provide important information about pre-eruptive events in the under the surface. The current active eruption phase began in 1995 with small-to-moderate ash eruptions, lava dome growth and pyroclastic flows that initially forced evacuation of the southern half of the island and then destroyed the capital city of Plymouth. Between 1995-1997, a total of 9,242 seismic events were recorded. Early seismicity was generally diffuse under southern of the island and mostly restricted to depths less than 7 km. A NE-SW alignment of epicenters beneath the NE flank of the volcano is clearly identified in a map of the seismicity (Figure 2.7). A latter nest of hypocenters developed beneath the volcano and a separate distribution of seismicity began beneath St George’s Hill (Aspinall et al.1998). Hypocenters from the current eruptive period were uniformly relocated with station travel-time corrections. The data provide little direct evidence for a very shallow magma body beneath the Soufriere Hills volcano and any large magma body must presumably be located below the main body of seismic activity at depth s of 5 km or greater. St. George’s Hill is considered inactive and the clustered events in that location could have
• Section 2: Regional Geology: Page 6
been a response to magma intrusion or to some perturbation of an active hydrothermal system; however, Aspinall et al.(1998) suggest that the activity is more likely an energy release resulting from induced local stress changes involving a fault or faults which may have been in an incipient failure state. Roman et al. (2008) proposed that the main conduit for the eruption is a dike or a system of dikes, trending NE-SW and centered beneath the eruptive vent. The seismic cluster beneath St George’s Hill follows the main WNW-ESE trending Redonda fault system, while the NE-SW alignment is related to secondary trends that also originated the Hot Water Pond fault.
Figure 2.7: Epicentres location of volcano-seismic events at the start of 1995 crisis
(Aspinall et al., 1998)
2.5. GIS and other Spatial Data Resources (EGS Task 1.0) Although numerous geological, geochemical and geophysical studies have been carried out on Montserrat, there appeared to be no readily available geospatial data in GIS (Geographic Information System) format. Therefore, maps were needed which could both integrate existing information and serve as a base for reporting of new data. ArcGIS 9.3 was utilized for these purposes. The map from Harford,et. al, 2002, was selected to provide an overview of the island’s geology. Individual volcanic units were digitized and converted into spatially referenced GIS layers. Additionally, the 1983 Ordinance Survey map was scanned and georeferenced. Although this detailed map predates the most recent volcanic activity, the shaded relief provides a useful base layer.

• Section 2: Regional Geology: Page 7
The process by which these non-digital paper maps were utilized to create GIS layers is known as georeferencing. In brief, a map or image with known spatial reference is placed in the same data frame as the paper map. Points common to both maps are identified, and the software aligns the non-referenced map to the current georeferenced map. The procedure clearly carries limitations of original data accuracy and scale, but for regional applications the results are usually surprisingly good. The clear benefit of georeferencing is the ability to the place previous and new technical studies in a common analysis and reporting framework. In this way, the substantial investment represented by previous work can be maximized, and utilized to guide the best possible forward interpretations and recommendations
Digital Orthophotos and Satellite resources
Forty eight color digital orthophoto tiles were acquired from the Government of Montserrat Lands & Survey Department. These high-quality images provide a base map covering the MGPA. The images are clear to a scale of 1:1200 and usable to a scale of 1:600. Structural interpretations, sample locations, and potential drilling target locations are displayed on this base. A LANDSAT image was obtained in order to provide a base map for the entire island. The image is from the EarthSat GeoCover project. Pixel size is 14.15 meters and acquisition date is 2000 +/- 3 years. Sample locations outside the detailed air photo coverage were displayed on this base. The image is useful to a scale of 1:62,500 (one inch to the mile). The same image appears on the Microsoft Virtual Earth site, as accessed through ArcGIS. In the Virtual Earth display however, the image splits into two resolutions (with a gap in the center of the island) at scales larger than 1:55,000. Additionally, Virtual Earth provides a very generalized shaded relief image. Vector Base Several vector data sets were identified and obtained for completeness. The data source is the Digital Chart of the World, a product originally developed for the US Defense Mapping Agency. Layers include island outline, major roads, generalized contours and populated places. The products are intended primarily for regional applications, and consequently of limited value for maps at island or project scales. Data Summary
Several new GIS layers were generated for the current project, these include:
Magnetotelluric (MT) Stations
Time Domain Electromagnetic Induction (TDEM) Stations
Geochemical spring and well sample locations
Attempted geochemical spring and well sample locations

• Section 2: Regional Geology: Page 8
Previous Data, Georeferenced
Well and spring locations from Chiodini
Fumaroles
Geologic formations
o Centre Hills Units
o Silver Hills Units
o Soufriere Hills dome
o Soufriere Hills Volcanoclastics
o South Soufriere hills lavas & volcanoclastics
o Uplifted area
Geological and Geothermal Interpretations
Linears
Priority Drilling Areas
The result of georeferencing previous work, and adding new data layers, is to our knowledge
the first integrated set of geospatial information for the island.
2.6 Detailed Geology of the St. Georges Hill area (EGS Task2.0)
The area between St. Georges Hill and Garibaldi Hill (Figure 2.6) was considered the most practical place to test for a geothermal system from both a geologic, logistics and safety perspective. Two major morphological features dominate the prospect area: Garibaldi Hill and St George’s Hill. Garibaldi Hill is located south of the Old Road Bay, filled with mudflows since the last eruption, and north of the Fox’s Bay. St George’s Hill is located east of Garibaldi Hill, surrounded on its east and south part by the pyroclastic flows of the most recent eruptions.
Figure 2.8: Garibaldi Hill cliffs, from the north of the Old Road Bay

• Section 2: Regional Geology: Page 9
The best exposures of volcanic stratigraphy in the area are on the west edge of the Garibaldi Hill where high cliffs extend for approximately a mile. Wave erosion of the cliffs exposes the volcanic layers on Garibaldi Hill striking N80°E, to the north in the Old Road Bay, to S10°E. Many structural features are also visible in the cliffs including extensional (normal) faults striking i) E-W with apparent dips of approximately 45° to the south and ii) S10°E dipping at similar angles to the north (Figure 2.9). Field observations suggest that the faulting affecting Garibaldi Hill form a graben striking approximately N80W.
Figure 1.9: Evidence of normal faulting on Garibaldi cliffs
Exposed pyroclastic units are similar in the Richmond Hills to the SE with different dips to the SW suggesting that the two hills are separated by a N80W striking extensional fault that dips NE and cuts the North edge of Richmond Hill. The distinct flat topped morphology and a NW-SE bench that separates the hill in two parts of is part of the distinct morphology of St George’s Hill that contrasts with Garibaldi and Richmond Hill to the NW. While exposures are poor, the bench and division of lithologies within the hill suggests that the separation is related to offset on a normal that drops the north side of the block down (Figures 2.10 and 2.11)

• Section 2: Regional Geology: Page 10
Figure 2.10: St George's Hill, from Garibaldi Hill.
Figure 2.11: Structural interpretation of St George's Hill.
Deep erosion within the south block exposes many of the volcanoclastic layering of individual lithologic units that strike between N30 and N60°W and dip approximately 45° to the NE. The stratigraphy is obscured in the north block but a few field measurements indicate a N80W strike and a contrasting SE dip. The two different dips of the contrasting parts of St Georges Hill indicate a fault separates the two blocks. A review of aerial photography and satellite imagery suggest that a N-S fault separates two distinct volcanic blocks of St George’s Hill and Garibaldi Hill. On the same basis, a N 40-50°E fault apparently
NE SW

• Section 2: Regional Geology: Page 11
cuts Richmond Hill and was identified in cliff outcrops during the Hot Water Pond Temperature survey (see Section 4 -Geochemistry).
Figure 2.12 Lithologic Section from Cliffs at Hot Water Pond
Rea (1974) interpreted Garibaldi Hill as a parasitic eruptive center related to Centre Hills and St George’s Hill as a late-stage vent of Soufriere Hills that was the source of pyroclastic deposits in Richmond Hill. Pumice flows are rare in the Lesser Antilles having been described elsewhere only on St Lucia and Dominica and the presence of a parasitic pumice cone, St George's Hill is apparently unique in the arc.

• Section 2: Regional Geology: Page 12
Figure 2.13. The Development of the Soufriere Hills. (Diagrammatic sections running approximately NW-SE). Stage 1. Eruption of two-pyroxene andesite domes and associated pyroclastics. State 2. Eruption of hornblende-hypersthene andesite domes and associated pyroclastics. St. Georges Hill was probably active at this stage. Stage 3. Formation of English’s Crater, accompanied by eruption of hornblende-hypersthene andesite pumice flows. Stage 4. Extrusion of the Castle Peak dome within English’s Crater probably resulting in breaching of the crater wall. (from Rea, 1974)
In contrast, Harford et al. (2002) concluded that instead of being parasitic centers, the volcanic rocks in the hills were distal outflow from one of the major volcanic massifs in the highlands and that the local sequence of volcaniclastic rocks were subsequently uplifted tectonically rather than erupted locally near their source. Harford et al. (2002) note several lines of geological evidence that the hills are uplifted rather than parasitic vests. 40Ar/39Ar ages for submarine volcano units Roche’s Bluff (named Roche’s Mountain on Figure 5) and 40Ar/39Ar age of 282+/- 8ka from Garibaldi Hill are consistent with this area being an early development stage of the Centre Hills or Soufriere Hills. Smith et al. (2007) associated deposits from Garibaldi Hill with the ‘Ancient’ Soufriere Hills stage and suggested that the complex has been active for over 400 ka. There is no geologic evidence for a vent system centered on these hills based on the character of the eruptive units. St George’s Hill consists mainly of andesitic block-and-ashflow deposits, pumice-and-ashflow deposits and epiclastic deposits. Pumice-fall deposits are subordinate, in contrast to Rea’s (1974) interpretation that these units are predominantly fall deposits. Garibaldi Hill and Richmond Hill (Figure 5) are composed of similar pyroclastic and epiclastic sequences. Consequently, the predominant local lithofacies are more similar to that of modern flank environments or flank-slope deposits derived from a lava dome such as at the currently active Soufriere Hill Volcano, rather than deposits that would form around a small vent. The original bedding of Roche’s Bluff, Garibaldi Hill and St George’s Hill are broadly tilted away from Soufriere Hills

• Section 2: Regional Geology: Page 13
rather than radially distributed around a central vent. Flank deposits are laid down with typical original bed dips less than 8°. Good exposures in sea cliffs on the west coast of Garibaldi Hill show that bedding is inclined at angles up to 50° to the NW; angles greater than anticipated for rocks of similar origin and exceeding the angle of repose loose material, implying tectonic deformation. The volcaniclastic deposits exposed in the cliffs are also cut by many steeply dipping fault planes with a predominantly extensional sense of offset. Exposure on St George’s Hills is poor, but some faults can also be found in road cuts. The NW striking fault planes are consistent with the strike of the major Redondo fault system that passes through the island. A lineament map is presented in Figure 2.14.
Figure2.14 Lineamemts in the St George’s Hill/Garibaldi Hill Area
2.7 Geothermal Exploration on Montserrat Recent volcanism and prominent thermal manifestations on Montserrat highlight the promising geothermal potential of the island. The summit fumarole areas of Galway’s Soufriere, Lower and Upper Gage’s Soufriere, Tar River Soufriere on the Soufriere Hills volcano and thermal spring feeding the Hot River Pond, 1km NW of Plymouth represented the most prominent evidence of an active hydrothermal activity on the island. The geochemistry of the thermal manifestations is covered in Section 4- Geochemistry but early work by the Montserrat Volcano Observatory, Geotermica Italiana (1992), and Chiodini et al. (1996) provided additional evidence of a high temperature (>200°C) geothermal system in the Soufriere Hills area.

• Section 2: Regional Geology: Page 14
2.7.1 Field characteristics of thermal manifestations.
The following section describing the major geothermal surface manifestations has been excerpted directly from: G.Chiodini, R. Cioni, A. Frullani, M. Guidi, L. Marini, F. Prati, B. Raco, Fluid geochemistry of Montserrat Island, West Indies, Bulletin of Volcanology, Vol. 58, #5, December 1996. It has been included because subsequent to the onset of volcanism in 1995 these manifestations have been destroyed and this was the most recent and comprehensive description of those manifestations available from the literature prior to their destruction. The most important thermal manifestations of Montserrat are the four fumarolic fields located on the slopes of Soufrière Hills Volcano and the thermal springs located on the western shore of the island, approximately 1 km NW of Plymouth (Fig. 1). The largest fumarolic field is Galway’s Soufrière, on the southern flanks of Soufrière Hills Volcano, where hundreds of fumarolic vents and several mud pools and boiling pools are present in a 400- x 400-m-wide depression. The thermal water discharged from this area (>10kg/s) feeds the White River. The Gages Lower Soufrière and Gages Upper Soufrière are located on the western slopes of Soufrière Hills Volcano and extend for 200x200m each. The few vents recognizable in the lower fumarolic field seem to be the remnant of a much wider, heavily self-sealed Soufrière. Fumarolic activity is widespread in the upper fumarolic field, where hundreds of vents are present and two pools discharge approximately 8 kg/s of boiling water. The Tar River Soufrière is located on the northeastern flanks of Soufrière Hills Volcano. It consists of approximately ten fumarolic vents. A spring discharging approximately 2 kg/s of water at 42° C is located approximately 1 km downstream of the Tar River Soufrière. Outlet temperatures of all fumarolic vents (98-99° C) are close to the boiling point of water at the average atmospheric pressure (948-978 mbar) of their altitude of 570-310m. Advanced argillic alteration with deposition of alunite, kaolinite, and other clay minerals affects the rocks outcropping in and nearby the four fumarolic fields. A hard sinter deposit covers the argillified lavas throughout the Gages Upper Soufrière, whereas the past existence of a thermal spring in the Tar River Soufrière is testified by abundant blocks of amorphous silica. The Plymouth thermal manifestations consist of several seepages and pools located along the Sand Ghaut river at approximately 200 m from the coast. Total discharge is close to 5 kg/s, and maximum outlet temperature approaches 90° C. In addition to the above description there are other areas of hydrothermal manifestations that have been reported. Younger (2006) reported the observation of steam plumes rising from the oceanic shallows along the Plymouth shoreline. A hotel spa, called the Montserrat springs was built on the beach below Richmond Hill, where a bathing pool was fed with hot water obtained from a borehole, now buried under ash. Verbal descriptions of i) steaming ground in the area just south of Weekes, and ii) hot ground on Richmond Hill during

• Section 2: Regional Geology: Page 15
foundation construction several areas of older alteration have been identified in the northern portion of the island, and several hydrothermally altered clasts are known to be present in some debris avalanche and block-and-ash pyroclastic flows of the Soufriere Hills. This alteration consists in the formation of clay minerals and plyllosilicates and is evidence of the persistence of hydrothermal activity throughout the island’s evolution (Geotermica Italiana, 1992). All these surface manifestations strongly suggest that a long-established geothermal system was present in the southern portion of the island before the last volcanic crisis. The presence of thermal springs fed by deep Na-Cl waters coming from a geothermal system (reservoir temperature: 245-250°C) mixed with shallow steam heated waters, and the four fumaroles field, support this conclusion (Principe, 2008). Presented in Figure 2.15 is a working model of a generic geothermal system from andesitic volcanic settings similar to those on Montserrat. The acid sulphate hot springs at altitude correspond to the Gages and Galway’s Soufrieres on Montserrat, whereas the ‘near neutral pH chloride springs’ discharging at the topographic low on the right hand edge of the cross-section corresponds to the Hot Water Pool and other hot, saline waters formerly observed in boreholes between Elberton and O’Garra’s.
Figure 2.15: Schematic model of hydrothermal system (from Bogie et al.)

• Section 3: Geophysics: Page 1
3.0 Geophysics (MT and TEDM Surveys)
3.1 Introduction
The project area is located in the southwest part of the island of Montserrat . To learn more about the presence and characteristics of a potential geothermal resource requires the application of geophysical tools which measure physical characteristics of subsurface rocks. All geophysical surveys have been completed by the Institute of Earth Science and Engineering at the University of Auckland, New Zealand (IESE). IESE used the combined results obtained from resistivity and microearthquake seismic techniques to evaluate the geothermal potential of the project area. IESE provided EGS with a detailed geophysics report for all of its work on Montserrat titled “Imaging the Montserrat geothermal prospect using Magnetotellurics (MT) and Time Domain Electromagnetic Induction(TDEM) Measurements” prepared by Graham Ryan, Stephen Onacha, Eylon Shalev and Peter E. Malin . This chapter is primarily that report verbatim, with minor modifications of formatting and content to be consistent with this report. The island is situated on the western edge of a shallow platform between the extinct outer arc of the limestone Caribees and the active inner arc of the volcanic Caribbees. The island sits on a shallow submarine shelf with steep margins to the west and to the east. The submarine shelf surrounding the island has a width which is related to the age of the adjacent volcanic centres: 5 km wide around the Silver Hills; 3 km wide around Centre Hills; 0.5 km wide around the South Soufrière Hills and 0.1-0.3 km wide around the active Soufrière Hills. It is therefore likely that shelf development is due to sub aerial erosion during periods of sea-level low stand [Le Friant et al., 2004]. Data sets used to site geothermal wells include geological structure analysis, geochemistry, microearthquake (MEQ) and resistivity surveys, particularly time domain electromagnetics (TDEM) and magnetotellurics (MT). Although MT surveys have become one of the standard method for geothermal well targeting, IESE uses the joint geophysical imaging (JGI) approach together with geological and geochemical data to locate the best sites for both exploration and production drilling. This approach can involve the integration of seismic, resistivity, gravity, magnetics, heat flow, geology and geochemistry to evaluate the geothermal potential of an area. In this project only seismic and resistivity data was integrated. The geophysics study focused on the effective use of MT, TDEM, seismic and geological data to image the geothermal resource geometry and infer patterns of permeability. Although, the original proposal was for only 21 TDEM and 21 MT soundings, IESE acquired MT data at 28 sites and TDEM data at 22sites. The additional data acquired was based on the recognition that smaller model elements and more densely sampled MT frequencies were required to image geothermal targets. However, the most serious restriction on data acquisition was the inability to access some sites, especially those in the north and east of St George’s Hill and around the Volcano.

• Section 3: Geophysics: Page 2
3.2 Purpose and Objectives of Geophysical Exploration
The geothermal exploration project was designed to evaluate geothermal potential and to assist in recommending the next steps for consideration by the Government of Montserrat. The focus was to assist in the location of a viable geothermal resource that can be used to promote lower cost and low impact geothermal development for electricity generation. The project area covered an area in the west of the island encompassing Garibaldi Hill, Cork Hill St. George’s Hill, the northern edge of Plymouth and Foxes Bay. Data were not acquired in some areas to the north and east of St George’s Hill because the sites were not accessible. The data from the settled areas were unusable because of the electrical noise signals from the power grid. The acquired TDEM, MT and microearthquake studies and available geological and geochemistry data were used to characterize the resource geometry and propose zones of higher potential for targeting exploration wells. Although numerous published case histories from geothermal fields worldwide show that MT, usually combined with TDEM, is one of the most effective geophysical approach to target geothermal wells and assess resource capacity. There are no public domain data sets available therefore, an important component of the project was to acquire high quality data to be used to evaluate the potential of this area.
The following specific objectives were planned to achieve the overall goals.
1) Analyze, invert, and interpret all available geophysical data into a unified conceptual model.
2) Complete processing of the MT data, including correction for static shift using TDEM and inversion of the MT into images of resistivity in the subsurface.
3) Assist in establishing a geological model for the resistivity patterns in and around the project area.
4) Interpret resource geometry and average permeability patterns from correlations of the resistivity.
5) Obtain relevant seismic data from the Montserrat Volcano Observatory and British Geological Survey. Utilize the earthquake data to better delineate areas of active fracturing. Investigate the earthquake data for shear wave splitting as a complementary geophysical method for determining zones and orientations of fracture permeability in MGPA. Unfortunately the data were of insufficient quality for useable results from shearwave splitting analysis to be obtained.
6) Present the results and reports.
The project area is shown in Figure 3.1 and was chosen to provide sufficient data resolution in the proposed search areas. To provide more complete information about the geothermal system sparse measurements were also made outside of MGPA. The cost of utilizing geothermal systems varies from place to place depending upon, for example, local conditions, costs of alternative energy sources and regulatory issues. Not surprisingly however, it is the quality of the resource itself that is most important. Geothermal

• Section 3: Geophysics: Page 3
technology has improved greatly over the past 20 years with more efficient engineering, more accurate reservoir modeling and better management systems.
Figure 3.1: MGPA shown as black rectangle. The black rectangle indicates the primary measurement area chosen to obtain sufficient resolution to image the geothermal system. In order to obtain a fuller picture, measurements were also taken outside of the MGPA.
3.3 Field Activities
IESE field activities began on June 8, 2009. The first stage of the project was to carry out permitting and scouting for access to sites for data acquisition. The biggest problems were access to some sites and difficult weather conditions during thunder storms and heavy rainfall which led to equipment malfunction that resulted in considerable down time. Long inter-island shipping delays were another problem. The work was therefore not completed as scheduled.

• Section 3: Geophysics: Page 4
IESE acquired Time Domain Electromagnetic induction (TDEM) data at 22 sites and MT data at 28 sites. We also used the existing MEQ and seismic data to construct the conceptual model of the geothermal resource. Analyses of MEQ locations and seismic tomography were incorporated into the model. Seismic data for use in shearwave splitting analysis were obtained from the Montserrat Volcano Observatory (MVO) and British Geological Survey (BGS). The data were analyzed but were of insufficient quality to yield useful results from S-wave splitting analysis.
In the MT method, the resistivities of the rocks are determined from the measurements of orthogonal components of the natural time varying electrical and magnetic (EM) fields. The electrical fields are measured by two sets of orthogonal non-polarizing electrodes and the magnetic field is measured by induction coils. In this study, MT measurements are acquired at frequencies of 320-0.001Hz. EM fields propagate into the earth as coupled E and H fields which are commonly represented in the frequency domain as a four element impedance tensor. The apparent resistivity is obtained from the scaled ratio of the electric field to the magnetic field. If the subsurface is two-dimensional, EM fields are usually polarized into two modes usually referred to as TE-mode when the E fields are parallel to the direction of strike and the TM-mode when the H-field is parallel to the strike direction. One of the problems in the interpretation of MT data is the static shift. The shift is caused by shallow polarization of the EM fields by local resistivity contrasts at the scale of the measurement dipole (in this study mainly 50-70 m) that lead to a constant shift of the MT apparent resistivity curve on a log scale at all frequencies. The static shift has been removed by using TDEM data to generate an equivalent 1-D MT model at collocated sites.
In the TDEM method, a time varying magnetic field is generated by a controlled artificial source. In this method, a loop of wire is placed on the ground and a constant current transmitted through it. The current is turned on and off at predetermined times. When the current is turned off, it creates a decaying magnetic field, which induces an electric current in the Earth. This electric current distribution induces a secondary magnetic field that decays with time and the rate of decay is measured at the centre of the loop by an induction coil. The depth of penetration depends on the loop size, the number of turns in the transmitter coil and the resistivity structure in the area of study.

• Section 3: Geophysics: Page 5
Figure 3.2: Events located during A) the 1933-1937 seismic swarm [Powell, 1938] B) 1966-1967 seismic swarm [Shepherd et al., 1971] C) 1995 seismic swarm [Aspinall et al., 1998].
Despite allowances that must be made for cruder methods of earthquake location employed in earlier decades it is clear that similar fault zone systems have been active over the decades between 1933 and 1995. The swarms beneath the Soufrière Hills volcano and St. George’s Hill are the most obvious. The regional stress regime is thought to be compressive normal to the volcanic arc of the Lesser Antilles. This regime is evidenced by earthquake fault plane solutions which have a predominant NE-SW p-axis orientation. However it is thought that inflation of a NE-SW trending dike beneath the Soufrière Hills volcano periodically causes motion along faults ~90° to this direction i.e. NW-SE [Roman et al., 2008]. Current local seismicity on Montserrat is generated predominantly directly beneath the active volcanic edifice. However early in

• Section 3: Geophysics: Page 6
the eruption (mid to late 1995) there was also significant seismicity beneath St. George’s Hill and in a NE-SW trending lineament with one end at the Soufrière Hills Volcano (see Figure 3.2). The events beneath St. George’s Hill had fault plane solutions with a NNW-SSE p-axis direction giving strong evidence for open fluid pathways in this region along the indicated direction. The structural trends indicated by seismic observations are supported by observations of the geological structures. A WNW-ESE zone of structural weakness is delineated by Roche’s Bluff, the Soufrière Hills, St. George’s Hill, Garibaldi Hill and Richmond Hill. The Soufrière Hills make up the currently active dome complex but Roche’s bluff; St. George’s Hill, Garibaldi Hill and Richmond Hill appear to be areas of uplift associated with tectonic disruption. St. George’s Hill for example is made up of faulted block-and-ash-flow, pumice-and-ash-flow and epiclastic deposits and on Garibaldi Hill good exposures show normally faulted beds inclined up to 50° to the NW [Harford et al., 2002]. Geochemical evidence indicating high equilibrium pressures for gases from fumaroles around the Soufrière Hills volcano indicate a linear zone of high vertical permeability such as a fault zone [Chiodini et al., 1996] indicating that this structure is a possible pathway for magma from depth. It is clear that an active geothermal system exists beneath Montserrat as evidenced by alkali-chloride springs at Hot Water pond in Plymouth and the presence of sinters and blocks of amorphous silica at the Gages upper Soufrière and Tar River Soufrière respectively [Chiodini et al., 1996]. The main objective of this study is to identify spatially the currently important subsurface fluid flow controlling structures. This has been done using the MT and TDEM techniques and the available seismic data.
3.4 Data Collection Methodology
3.4.1 Magnetotellurics The MT method uses two sets of grounded electrical field measurement lines, Ex and Ey, and three inductive coil magnetometers, Hx, Hy and Hz, to measure the natural time varying electric and magnetic fields at the earth’s surface caused by electromagnetic waves radiated from the sun and from distant electrical storms [Vozoff, 1991]. The magnetic field varies slowly with respect to ground resistivity while the electric field is more directly related to the resistivity at each station. Impedance, a complex parameter analogous to resistance that is used when electric fields vary in time, was estimated from the electric and magnetic fields and the apparent resistivity was determined from the impedance. An MT sounding was made by computing the impedance for a range of frequencies ranging from 320 to 0.001 Hz from data acquired for 12-16 hours. The electric field of a high frequency electromagnetic wave dissipates at shallow depths whereas the field at low frequencies penetrates a much thicker and deeper section of the earth. For magnetotelluric (MT) data acquisition on Montserrat, four MTU-5A data acquisition units were used. Each acquisition unit was accompanied by three inductive coil magnetometers of the MTC-50 type to measure magnetic field variations and five non-polarising porous pot electrodes (PE4) were used to measure the electric field. The equipment was from Phoenix Geophysics Ltd. The MT data acquisition equipment layout is

• Section 3: Geophysics: Page 7
presented in Figure 3.3. The electrodes were nominally deployed 35 m from the centre of the array where the ground electrode was located however this length varied depending on space available at the site. The MT recorders were set to record for 16 hours at each site between 1600 and 0800 local Montserrat time. A reference MT station was also set to record daily between 1600 and 0800. It was therefore possible to make a maximum of three sounding each day. 28 successful MT soundings were made during the survey.
Figure 3.3: Layout of MT equipment.( Each electrode is typically placed 35 m from centre of array)
3.4.2 Time Domain electromagnetic induction (TDEM)
TDEM data was used to correct for the distortion in MT data commonly referred to as static shift, which is a distortion shared by all resistivity methods that use electrodes. This static shift is caused by heterogeneities in the properties of the rocks/soils at the location of the electrodes. Because TDEM does not use electrodes, MT is commonly supplemented by TDEM data to correct static distortion [Pellerin and Hohmann, 1990]. For TDEM data acquisition a Zonge CGT-10 transmitter powered by a 9 KW Zonge ZMG-9 motor generator controlled by a Zonge XMT-32s Transmitter controller was used to generate the input signal and the response signal was measured using a Zonge TEM/3 ferrite cored antenna. For data acquisition on Montserrat the input signal was driven through a square conductor loop of nominal side 100 m. The loop size was adjusted depending on the available space. The diagram below (Figure 3.4.) shows the typical lay out for a TDEM measurement. During measurement a driving current of between 12 and 16 A was used.

• Section 3: Geophysics: Page 8
Figure 3.4: Typical equipment layout for TDEM measurement showing transmitter TX and receiver RX; one side of the loop is nominally 100 m in length.
3.4.3 Data Collection Challenges
Conditions on Montserrat presented a number of challenges to MT data collection:
1. Acidic conditions due to the volcanic plume and ash appear to have compromised some of the electrodes which meant that some measurements needed to be repeated.
2. Montserrat is a hilly and fairly windy island, to minimise wind noise it was often necessary to partially bury cables.
3. Due to its volcanic nature the soil on Montserrat is quite rocky. It was often
impossible to completely bury the 1.4 m long magnetometer which measured the vertical component of the magnetic field. To minimise wind noise it was often necessary to mound rocks or soil around the unburied portion of the coil.
4. Due to the hazardous nature of the Soufrière Hills Volcano it was necessary to utilise
a helicopter (courtesy of the Montserrat Volcano Observatory and the British Royal Navy) to make measurements in close proximity to the active volcano.
5. Frequent tropical storms caused damage to equipment due to heavy rain and
lightning. As much as possible equipment was retrieved when there was forecast storm activity.
6. Cultural noise. Since the majority of soundings were made in the part of the island
that is currently uninhabited due to volcanic activity (The exclusion zone) interference from the electrical grid was minimal in these locations.

• Section 3: Geophysics: Page 9
3.5 TDEM and MT Resistivity Results
3.5.1 Background to the use of Resistivity in Geothermal Exploration
Resistivity methods have been used in hydrothermal exploration for many years. Calibration of this method against drilling results has been done in several geothermal fields, and it is apparent that resistivity measurements can be used as a subsurface thermometer [Arnason et al., 2000; Flovenz et al., 2005]. This indirect spatial correlation between resistivity and temperature appears to be associated with the local degree of hydrothermal alteration. Most high-temperature hydrothermal systems are associated with a low resistivity layer over the geothermal reservoir resulting from clay mineral alteration [Arnason et al., 2000; Flovenz et al., 2005]. Because resistivity methods can be used to interpret temperature, hydrothermal alteration and permeability, they offer a means for resolving the geometry of the geothermal reservoir, depth to hydrothermal reservoir, fracture zones and permeability distribution. Resistivity variations are usually related to salinity, water saturation, porosity, and cation exchange capacity in hydrated clays (Onacha et. al., 2005, 2006, 2007, and 2009). Understanding the low resistivity distribution can help determine the location of the high temperature upflow zones as targets for drilling. The interpretation of the Montserrat data will take into account the alteration patterns, the structures and the geological setting that might influence the resistivity distribution.
Resistivity variations in geothermal areas are usually related to changes in salinity, water saturation, temperature, porosity, and cation-exchange capacity in hydrated clays, particularly smectite clay and mixed-layer smectite-illite clay. Numerous case histories show that the variation in cation exchange capacity, mainly related to smectite clay content, is by far the most important factor in determining resistivity variation in geothermal fields. The emphasis of clay alteration in geothermal resistivity interpretation is sometimes called the “smectite-illite” approach based on the two predominant clay types involved in the transition from the impermeable, lower-temperature cap containing smectite clay to the higher temperature permeable reservoir where illite clay usually replaces smectite. It is therefore possible that the rocks at the Montserrat site may be altered and fractured and therefore some of the resistivity anomalies can be interpreted in terms of alteration and inferred fracture permeability. The resistivity pattern can therefore be used to infer reservoir temperature from the intensity of the alteration suggested by resistivity values. The natural state temperature pattern is the primary constraint on bulk permeability. Because low resistivity is correlated with low permeability, temperature sensitive smectite alteration can therefore be used to image the base of the low resistivity clay that can be used to give an indication of the expected reservoir temperature. In many high temperature fields, the base of the clay cap defines temperature isotherms of 180-200°C. The major problem is however distinguishing between a low resistivity due to either a saline aquifer or a relict geothermal system.

• Section 3: Geophysics: Page 10
Figure 3.5: Map of Montserrat showing locations MT and TDEM sites. Sites marked in red indicate collocated MT and TDEM measurements. Sites marked in yellow indicate MT measurements only

• Section 3: Geophysics: Page 11
3.5.2 Resistivity maps
Resistivity maps were constructed to evaluate the spatial distribution of resistivity at different depths. Conductance which is the product of resistivity and thickness was also analysed. This information has been used together with resistivity sections and existing seismic data to evaluate the geothermal potential of the target area.
Resistivity map at sea level (0 meters below sea level)
The resistivity map at 0 meters below sea level (mbsl) (Figure 3.6) shows a low resistivity anomaly to the southwest and southeast of Montserrat. The spatial distribution of the anomaly on the southeast part of Montserrat is poorly defined because of inadequate data coverage. The low resistivity anomaly on the southwest of Montserrat is associated with both NE-SW and near NW-SE trending interpreted fault zones. The low resistivity anomaly could be due to incursion of saline sea water or low resistivity clays due to hydrothermal alteration and fluid filled-fractures. The NE trending anomaly on the southwest part of MGPA follows a linear trend bound by NE trending interpreted fault zones. We expect that these fault zones extended into the ocean thus acting as conduits for channelling saline sea water. The NE fault zones could also be outflow channels for hydrothermal fluids. The intersection of the interpreted NW and NE trending fault zones might form areas of enhanced permeability that could be targets for drilling.

• Section 3: Geophysics: Page 12
Figure 3.6: Resistivity map at sea level. The low resistivity anomaly also coincides with the interpreted fault zones. Black lines indicate fault zones mapped by Chiodini (1996) and Bastien Poux (pers. comm.).
Resistivity map at 500 m below sea level (mbsl)
The resistivity map at 500 mbsl (Figure 3.) shows a low resistivity anomaly that covers a large area to the southwest and southeast of MGPA. This extensive low resistivity anomaly in the southwest near the coast is possibly related to seawater incursion as the area is near the coast and occurs at the intersection of two mapped faults. However, the possibility that

• Section 3: Geophysics: Page 13
the low resistivity is due to hydrothermal alteration to clays of pyroclastic flow deposits cannot be ruled out. The low resistivity area in the southeast is more likely due to hydrothermal alteration. Like the map at sea level, the spatial distribution of the anomaly on the southeast part of MGPA is poorly defined because of inadequate data coverage. The low resistivity anomaly on the southwest of MGPA is associated with the intersection of the NE and near NS trending interpreted fault zones. This area is also associated with hot springs which may indicate the discharge or outflow of geothermal fluids. The Centre Hills area shows high resistivity which also coincides with areas of modeled high seismic velocity bodies.
Resistivity map at 1000 m below sea level (mbsl)
The resistivity map at 1000 mbsl (Figure 3.8) shows a linear low resistivity anomaly in the target area. The low resistivity anomaly coincides with the interpreted NE and NW trending fault zones. The linear anomaly to the southwest of Montserrat is similar to that shown on the resistivity map at sea level. The low resistivity anomaly can be attributed to hydrothermal alteration along fluid filled fractures. The low resistivity anomaly on the southeast of MGPA is associated with the intersection of the NE and near NW interpreted fault zones. At -1000 m this structure is somewhat narrower than it is at shallower levels. At its coastal southern end this feature is coincident with the Hot Water Pond geothermal spring feature. This would indicate that the low resistivity feature is caused by hydrothermal alteration of the more resistive andesite, possibly by interaction with steam condensate. The shape of the feature indicates that flow is controlled by two near orthogonal intersecting fault zone systems. The direction of these structures appears to closely mirror the observed surface faulting as determined by Chiodini et al. (1996) and Bastien Poux (pers. comm.). The Centre Hills area shows high resistivity which also coincides with areas of modelled high seismic velocity bodies.
Conductance map of a depth of 500 to 1000m
The conductance map at a depth of 500 to 1000m Figure 3.) shows a high conductance anomaly associated with the intersection of the NW and NE fault zones. The high conductance could be due to both the effect of alteration and incursion of saline sea water along fault zones. The Centre Hills area shows low conductance which also coincides with areas of modeled high seismic velocity bodies. Conductance is the inverse of resistivity integrated over a given depth range and therefore gives a bulk value of the materials ability to conduct electricity representative of the entire depth range considered.

• Section 3: Geophysics: Page 14
Figure 3.7: Resistivity map at 500 mbsl. The low resistivity anomaly covers a larger area than in the map of resistivity at sea level. Black lines indicate fault zones mapped by Chiodini (1996) and Bastien Poux (pers. comm.).

• Section 3: Geophysics: Page 15
Figure 3.8: Resistivity map at 1000 mbsl. The low resistivity anomaly coincides with interpreted NE and NW trending fault zones similar to the resistivity map at sea level. Black lines indicate fault zones mapped by Chiodini (1996) and Bastien Poux (pers. comm.).

• Section 3: Geophysics: Page 16
Figure 3.9: Conductance map at a depth of 500 to 1000m. The highest conductance is found to the southwest of MGPA at the intersection of the interpreted fault zones. Black lines indicate fault zones mapped by Chiodini (1996) and Bastien Poux (pers. comm.).

• Section 3: Geophysics: Page 17
Resistivity map at 4000 m below sea level (mbsl)
The most significant feature shown in the resistivity map at 4000 mbsl (Figure 3.) is a low resistivity anomaly that occurs to the southeast of Montserrat associated with the volcano. This deep low resistivity anomaly may be associated with the magma chamber beneath the volcano.
Figure 3.10: Resistivity map at 4000 mbsl. The map shows a substantial low resistivity anomaly below St.George’s Hill and also beneath the volcano. Black lines indicate fault zones mapped by Chiodini (1996) and Bastien Poux (pers. comm.).
This implies that the interpreted heat source could be shallower beneath the volcano than previously thought. The Centre Hills and the western part of Montserrat have high resistivity. Another deep low resistivity anomaly occurs on the eastern side of the target

• Section 3: Geophysics: Page 18
area. This anomaly could also be interpreted as a heat source close to St George’s hill. This interpreted heat source may be connected at depth with the heat source under the volcano. The Centre Hills area shows high resistivity which also coincides with areas of modeled high seismic velocity bodies.
3.5.3 2-D profiles
2-D resistivity profiles were constructed along two profiles (Figure 3.6) to evaluate resistivity variations with depth. MT data was prepared for 2-D inversion first by correcting for static shifts, then choosing the modes appropriately to fit the TDEM data to orient the two MT modes relative to the strike of the profile. A variety of approaches were used to assess 2-D strike including using resistivity polarization diagrams, patterns of 1-D conductance and, most importantly, obtaining the best fit to both modes in the 2-D inversions. Because 2-D inversion proved to have more conceptual advantages with respect to 3D inversion, 2-D inversions were mainly used in the interpretation. The 2-D inversion was carried out by inverting for the two modes and the vertical magnetic field. 2-D sections of the MT data and Figure 3.8) show the resistivity distribution with depth. Figure 3.6: Location of TDEM/ MT stations and 2D profiles. Purple line indicates the NE-SW profile and the green line indicates the E-W profile. MT stations along the profile have been labelled, other MT stations have been left out for clarity
• Section 3: Geophysics: Page 19
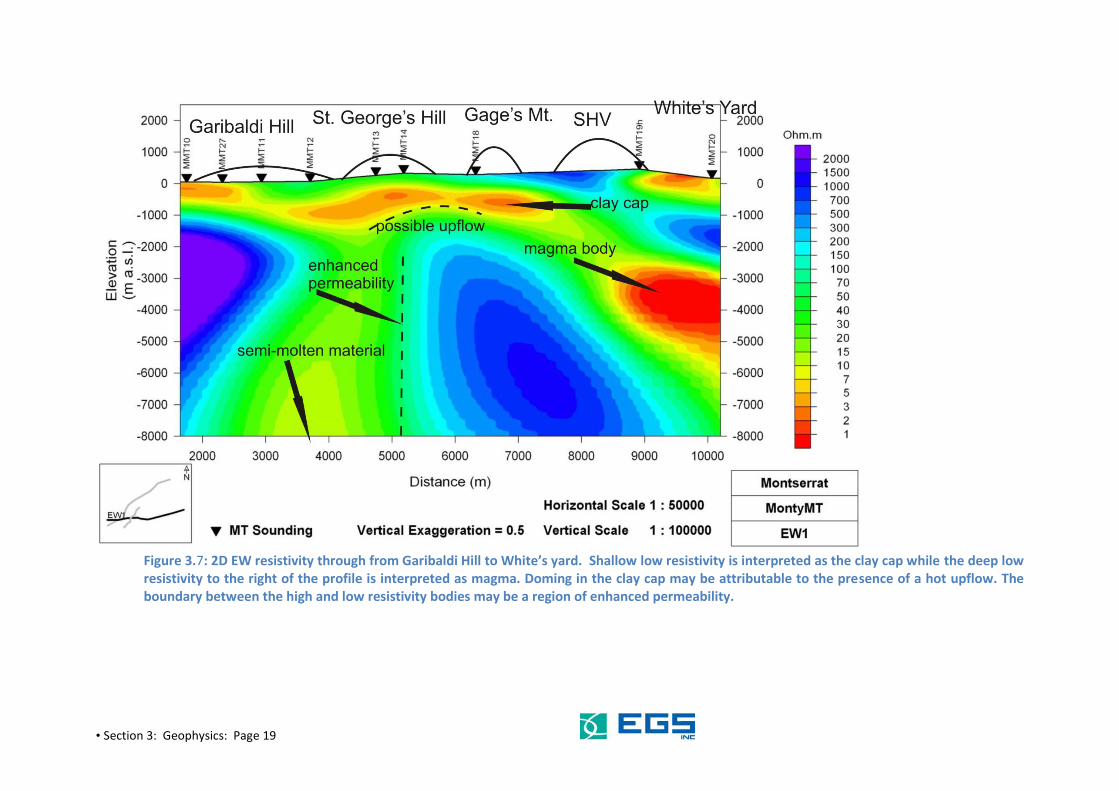
Figure 3.7: 2D EW resistivity through from Garibaldi Hill to White’s yard. Shallow low resistivity is interpreted as the clay cap while the deep low resistivity to the right of the profile is interpreted as magma. Doming in the clay cap may be attributable to the presence of a hot upflow. The boundary between the high and low resistivity bodies may be a region of enhanced permeability.

• Section 3: Geophysics: Page 20
Figure 3.83: 2D NE resistivity through Centre Hills. Shallow low resistivity is interpreted as the clay cap while the deep low resistivity to the right of the profile is interpreted as magma. The interpreted molten rock is deeper in the northern part of Montserrat.
• Section 3: Geophysics: Page 21
The approximately E-W cross-section shown goes from the coast at Foxes Bay through St. George’s Hill and the Soufrière Hills Volcano to White’s Yard. This cross-section clearly shows the low resistivity clay cap extending to site MMT18 at Lees Yard. The slight doming in this cap seen below MMT13 and MMT14 on St. George’s Hill could indicate that this is an area of intense alteration due to steam condensate from a hot up flow along the NW and NE trending fault zones. Also in the cross-section a large high resistivity body can be seen below MMT14 and MMT18, i.e. beneath Gage’s mountain, this may signify a solidified pluton (old magma chamber). It is also possible that the high resistivity body beneath Gages Mountain could still be hot and therefore hosting high temperature geothermal fluids. The low resistivity body beneath MMT19 and MMT20 at depths from -3000 to -6000 m is likely to be the andesitic magma feeding the current eruption of the Soufrière Hills Volcano. The uncertainty of using resistivity to image the geothermal system depends on the reliability of the resistivity imaging and also on how well all the data types are integrated to give a good conceptual model. Resistivity contrasts can be due to numerous geological formations that are not necessarily due to geothermal fluids.
3.6 Microseismicity (MEQ) Studies
3.6.1 Delineation of subsurface structures from earthquake locations
During the current eruption of the Soufrière Hills Volcano virtually all seismicity originates beneath the active volcanic edifice in a depth range of 1 -3 km [Roman et al., 2008]. This means that the current seismicity sheds little direct light on the structure of MGPA. However at the beginning of the eruption in mid-1995 a swarm of earthquakes originated beneath St. George’s Hill in MGPA along with swarms in other locations. To investigate structures in MGPA we use seismic data provided by the MVO and Diana Roman for the period between 1995 and 1997.
The catalogue of MEQ was replotted and integrated into the resistivity maps. MEQ occur along the interpreted NW and NE trending fault zones with the majority of earthquakes found at depths ranging from 3 to 5km (Figure 3.10). The deepest earthquakes are found to the northeast and southwest of the volcano. Another cluster of earthquakes is found around the St. George’s Hill Area also associated with fault zones and their intersections.
3.7 Shear-wave splitting analysis
The current broadband seismic network was installed in 1996 [Luckett et al., 2008]. The number of stations has varied over time as new stations have been installed and some stations have been removed, or destroyed by volcanic activity. The 2006 configuration taken from the work of Luckett et al. [2008] is shown below.

• Section 3: Geophysics: Page 22
Figure 3.94: MVO seismic network in April 2006. The observatory is located near the station MBFL [Luckett et al., 2008].
The stations of interest for this study are MBGB and MBGH located on Garibaldi Hill and St. George’s Hill respectively. These stations are the closest to the MGPA. Shear waves are elastic seismic waves in which the oscillation is transverse to the direction of propagation of the wave. For shear wave splitting to occur the elastic properties of the rock

• Section 3: Geophysics: Page 23
through which the seismic waves pass must be anisotropic. In the case of geothermal systems this anisotropy is often thought to be due to the presence of near parallel preferentially oriented fractures. Anisotropy in shear wave propagation is due to variation in the bulk elastic constants in the directions parallel and perpendicular to the fracture system. Elastic constants are larger in the parallel than the materially weaker perpendicular direction. This difference in elastic constants leads to a difference in the velocity of propagation of shear waves in the two orthogonal directions. The fast shear waves oscillate parallel to the fracture system and the slow shearwaves perpendicular to it [Crampin and Peacock, 2008]. For a seismic event to be suitable for shear wave splitting analysis the straight line angle of incidence between the event and seismometer must be less than 45 degrees [Crampin and Peacock, 2008]. For splitting to be observed the data must also be 3-component data. Seismic data collected by organisations on Montserrat including the Montserrat Volcano Observatory, Seismic Research Centre, US Geological Survey and British Geological survey show that almost all seismic events associated with the current eruption of SHV have hypocentres within a few km of the volcanic edifice and average depths of 1 - 3 Km [Roman et al., 2008]. As MGPA is roughly 5 Km away from the volcanic edifice the vast majority of seismic events are unsuitable for shear-wave splitting analysis due to the high angle ray-path to the seismometer. As discussed earlier there was a swarm of events that occurred under MGPA at the onset of the eruption in August 1995[Aspinall et al., 1998]. These events occurred beneath St. George’s Hill at depths of 0 - 7 Km (MVO data). Unfortunately, however, these events are unsuitable for S-wave splitting analysis as the early seismic network mainly comprised of single-component seismometers and shear-wave splitting analysis requires 3-component data. None of the located events were recorded by a 3-component seismometer located in MGPA. In 1996 the seismic network was modified to become a mainly 3-component broadband network [Luckett et al., 2008]. However post 1996, as stated above, most events locations were restricted to the area around SHV. Between October 1996 and October 2009 of thousands of triggered events only 24 events were located under MGPA in the 13 year time span that were geometrically suitable candidates for S-wave splitting analysis. The two seismometers which are suitably located for exploring the possibility of S-wave splitting in MGPA are MBGH and MBGB located on St. George’s Hill and Garibaldi Hill respectively. Of the 24 candidate events six events with very large location errors were rejected. Of the remaining 18 events the 13 events in which the angle between the located event origin and the either seismic station was within 45° were selected for further analysis (Table 3.1)

• Section 3: Geophysics: Page 24
Table 3.1: Summary of suitable candidate events for S-wave splitting analysis. Location of MBGH = (16.723°, -62.209°); location MBGB = (16.7318°, -62.228°) taken from [Luckett et al., 2008]. All locations are assumed to be in the WGS84 coordinate system.
Ev. No.
Lat. (°) Long. (°) Depth (Km)
Event to station angle /° (MBGH)
Event to station angle /° (MBGB)
Notes (MBGH) Notes (MBGB)
12
16.719 -62.199 3.7 16.8 42.4
No clear S-wave arrival on E component
No S-wave splitting
13 16.719 -62.197 3.6 20.1 44.8
No clear S-wave arrival on E component
No S-wave splitting
14 16.721 -62.200 3.2 16.5 44.9
No clear S-wave arrival on E component
No S-wave splitting
15 16.728 -62.194 5.7 16.3 32.4
No clear S-wave No clear S-wave on horiz. components
3 16.707 -62.200 3.4 30.2 *49.9
No clear S-wave on horiz. components
*No data
4 16.712 -62.193 3.4 31.1 *51.7 No clear S-wave arrival *No data 5 16.708 -62.192 2.6 42.9 *60.7 No clear S-wave *No clear S-wave 6 16.699 -62.226 3.8 40.2 43.7 No S-wave splitting No data 7 16.706 -62.218 2.9 36.0 *46.3 LP event No S-wave †LP event No S-wave 8 16.727 -62.217 2.7 20.3 25.1 LP event No S-wave †LP event No S-wave 9 16.722 -62.206 0.8 20.6 *72.7 LP event No S-wave †LP event No S-wave
10 16.720 -62.207 1.0 19.7 *68.7 LP event No S-wave †LP event No S-wave 11
16.731 -62.215 3.7 17.0 20.3 No clear S-wave arrival †LP event No S-wave No
S-wave
As can be seen from Table 3.1 very few of the candidate events have S-waves of sufficient quality to investigate splitting. Of events which were recorded on MBGB only two events had recognizable S-wave arrivals and only one of the events recorded on MBGH. Images of the waveforms and particle motions can be seen in appendix D. Of the few suitable events for S-wave splitting analysis very few had discernable 3- component S-wave arrivals at the stations of interest MBGB and MBGH. In these few S-wave observations no S-wave splitting was observed. There are too few high quality S-wave observations for any strong conclusions to be drawn from this study. The lack of observed splitting could be due to insufficient anisotropy; i.e. the velocity difference between the fast and slow waves is too small to produce a detectible difference. Another possibility is that the ray path avoids the fracture network. Due to the generally small magnitude of the volcanically generated seismic events signal-to-noise ratios are relatively low and the different seismic phases are obscured due to the low quality of the signal.

• Section 3: Geophysics: Page 25
3.8 Seismic tomography The data acquired from the SEA-CALIPSO experiment were used to construct a velocity tomography map (Figure 3.11) showing distinct low velocity zones (shown in red) and high velocity zones (shown in blue). The SEA-CALIPSO experiment utilised artificial seismic sources generated by a ship-borne airgun and a large array of land and sea deployed seismometers to determine variations in the velocity of seismic waves through the subsurface of Montserrat. Variations in seismic wave velocities can occur due to changes in material type (e.g. altered or unaltered material) or bulk properties (e.g. degree of melting). The Centre Hills area is associated with a velocity and resistivity high. This may mean that the Centre Hills area has massive low permeability body that could be a cooling old magma body. The Vp (P-wave velocity) perturbation map and sections (Figure 3.12) shows velocity anomalies similar to those seen in the resistivity models.

• Section 3: Geophysics: Page 26
Figure 3.105: Location of MEQ. The depth of the MEQ is colour coded with a majority occurring at a depth range of 3-5km above the deep low resistivity.

• Section 3: Geophysics: Page 27
Figure 3.11: Seismic tomography map of Montserrat. Map shows areas of anomalously high and low p-wave seismic velocity (vp)

• Section 3: Geophysics: Page 28
Figure 3.12: Vp perturbation at 2km depth on the left panel and cross-sections. High velocity areas are shown in blue while low velocity areas are shown in Red. Vp perturbation denotes variation in the p-wave seismic velocity away from the mean value for the area of study.
Combination of the resistivity data along with the seismic tomography data and MEQ data. (Figure 3.13) illustrates clearly the relationship between the low seismic velocity zone associated with MGPA and the areas of low resistivity associated with MGPA. Outside of MGPA the resistivity data is sparse. So no firm conclusions can be drawn outside of the area; however, it seems clear that the SW low velocity zone is coincident with the proposed MGPA geothermal system as determined by resistivity imaging and the southernmost high seismic velocity zone is associated with the Soufrière Hills. Outside of the area which has been resistivity mapped in detail. It seems clear that the other two major high seismic velocity zones are associated with the other two major volcanic centres on the island; the Centre Hills and the Silver Hills. One explanation for the low seismic velocity zones is that they reflect the slower seismic propagation velocities through hydrothermally altered rock. If this is the case it would support the hypothesis that within MGPA there is a geothermal system which is not directly linked to the Soufrière Hills Volcano magmatic supply. This is indicated by the fact that low velocity zone does not extend across to the Soufrière Hills. The fact that there is no low velocity zone associated with the fumaroles / soufrières associated with the Soufrière Hills could be a matter of age with the Soufrières being relatively young features associated with relatively superficial

• Section 3: Geophysics: Page 29
and localised alteration and the MGPA geothermal system being more mature and extensively altered at depth. This is however merely a hypothesis. Another intriguing feature of the low velocity zone is the SW fingering out of the low seismic velocity zone (LSVZ) in the region of Hot Water Pond; the outflow of the geothermal system.
Figure 3.13: Integrated resistivity map at 3000 mbsl, seismic tomography map and MEQ locations. Red outlined areas enclose zones of low seismic velocity and blue outlined areas enclose areas of high seismic velocity. Anomalous seismic velocity zones occur at depths between 1000 and 3000 mbsl.

• Section 3: Geophysics: Page 30
Figure 3.19 illustrates the relationship between the areas of low and high seismic velocity and the elevation and bathymetry data. We can see once again that the high velocity zones are related to the major volcanic edifices and the low velocity zones occur on the flanks but within the extended shallow submarine shelf that surrounds the island.
Figure 3.19: DEM and bathymetry for Montserrat with overlay of seismic velocity anomalies. Red outlined areas enclose zones of low seismic velocity and blue outlined areas enclose areas of high seismic velocity. Note submarine volcanoes to SE of Montserrat.
Data Integration Comparison of the resitivity at a depth of 1000 mbsl with the seismicity in the depth range 1000 to 2000m and the areas of anomalous seismic velocity show that the Low Seismic Velocity Zone (LSVZ) is reasonably coincident with the low resistivity anomaly in MGPA (Figure 3.14). The other two LSVZ in the western and eastern parts of the island also seem to coincide with areas of low resistivity but resitivity measurements in these areas are too sparse to draw firm conclusions. The data indicate that the LSVZ are possibly associated with areas of hydrothermal alteration which result in lowered seismic velocities and may indicate other zones of hydrothermal alteration either active or relict on the western and eastern parts of the island. Further measurements would be required to test this hypothesis.

• Section 3: Geophysics: Page 31
Figure 3.140: Integration of seismic tomography resitivity and MEQ data. The anomalous seismic velocity zones occur at depths between 1000 and 3000 mbsl. The depicted resistivity is at a depth of 1000m and the seismicity is that generated in the estimated depth range of 1000 to 2000m,
Comparison of the seismic locations at various depth intervals with resitivity at various depth intervals (APPENDIX E) did not reveal much detail in lateral structure. This is probably due to the relatively large location errors (of the order of 1 km and greater).there is however some indication that seismicity in MGPA may be split into two loci. One beneath a fault zone going through St. Georges Hill and another about 1 km NE probably associated with a fault zone which runs through the Belham valley. As indicated earlier the large location errors make this difficult to determine definitively. Over the ranges at which resitivity was mapped the largest percentage of hypocentres was found in the 3000 to 5000 m depth range indicating that this was the depth range at which the majority of fresh fracturing was taking place in 1995. However the resitivity structure in MGPA indicates that there are established permeable pathways for fluid up from this level to the shallower levels.
3.9 Geothermal Resource Conceptual Model
Geothermal conceptual models are used when making decisions like targeting exploration and production geothermal wells. The conceptual model for locating exploration wells could give an indication of the expected reservoir temperature, depths to the reservoir and in some cases a

• Section 3: Geophysics: Page 32
drilling strategy. The first exploration wells are then used to determine the viability of the model and the geothermal resource. The conceptual model should also give an indication of the expected up-flow, out-flow and recharge for the geothermal system. The 2D MT inversion was appropriate because the MT station data was consistent with the 2D resistivity strike after static correction using TDEM and rotation to principal directions. The 2D profile obtained has a higher resolution than the 3D inversion because of computational limitations. MEQ activity seems to be mainly associated with the intersection of the fault zones, below the volcano and around St. George’s hill. Some of the events may be associated with fluid or tectonic movement.

• Section 3: Geophysics: Page 33
Figure 3.15: Integrated resistivity map at -3000 mbsl and MEQ locations which are associated with the boundaries between low resistivity and velocity and high resistivity and velocity
In developing the conceptual model, we have taken into account that several studies indicate structurally controlled geothermal resources are usually hard to find because they are strongly controlled by subsurface structures. Manifestations of warm/hot springs result from lateral

• Section 3: Geophysics: Page 34
leakage of geothermal fluids from up-flow zones that are sealed and cooled by incursion of meteoric and sea water.
3.10 Geophysics Summary and Conclusions
The integrated data interpretation shows that the geothermal potential in this area is probably controlled by NW and SE trending fault zones. However, it is not clear which structure is more permeable. We suggest that the intersections of fault zones or termination of fault zones might be the best targets for drilling due to expected enhanced permeability. Figure 3.16 below shows the primary target area indicated by the geological and geophysical data. The target area is sited on St. George’s Hill between sites MMT13 and MMT14. This well should be drilled to the bottom of the clay cap at the boundary between the high and low resistivity zones. The zone targeted is the intersection between orthogonal fault/fracture systems as indicated by resistivity data and high MEQ activity in 1995 as well as surface fault mapping. It is proposed that this area has the highest probability of having both hot fluid and locally high permeability.
Figure 3.16: Primary target area as determined from interpretation of geophysical data.

• Section 3: Geophysics: Page 35
Appendix F shows some 3D images of the target zone. Based on the geophysics there are two possible hydrogeological models;
A. Thermal fluids may ascend below the Volcano to the east and move westwards along fault zones and also at the contacts of the different strata.
B. Geothermal fluids may also ascend via near vertical channels along the northwest and northeast trending fault zones close to St. George’s Hill. This may form as a separate geothermal system. This geothermal system may be discharging into the ocean along the fault zones and it might be necessary to conduct a submarine thermal survey.
The integrated interpretation of the geophysical data together with the available geological models indicates that upflow zones are along fault zones within the deeper volcanic rocks. The buried interpreted fault zones at depth manifest as low/high resistivity contrasts. It is uncertain which hydrogeological model (if either) is correct. There is no doubt that geothermal fluids can move long distances laterally in many geothermal systems and it is possible that water discharged by Hot Water Pond originated from either below the Volcano or close to St. George’s Hill as a separate geothermal system. We therefore recommend a drilling strategy to target interpreted high permeability zones to assess the geothermal potential. However, the lack of MT data north and east of St George’s Hill is an impediment in determining the resource size. The geothermal system on the western side of the island appears to be controlled by a near orthogonal set of fault zones. The main upflow of the system appears to be under St. George’s Hill near the NW-SE trending fault zone that bisects St. George’s Hill. The heat source for this system is possibly a hot but solidified pluton beneath Gage’s mountain. It would therefore be possible to drill wells closer to the upflow to obtain the maximum amount of energy without the complications of highly acidic geothermal fluids.