Embed Size (px)
Citation preview

Maine Department of Transportation Highway Program
GEOTECHNICAL SERIES 100 REPORT
Route 6 Milo, Sebec, Maine
Prepared by: Scott A. Hayden, C.G.
Soils Research Scientist
Piscataquis County WIN 18289.00 Soils Report No. 2013-117 Fed Project #: STP-1828(900) TEDOCS # 1270671 March 12, 2013

Map
Sca
le 1
:32
00
0
Th
e M
ain
e D
ep
art
men
t o
f Tra
nsp
ort
ati
on
pro
vid
es
this
pu
blica
tio
n f
or
info
rmati
on
on
ly.
Relian
ce u
po
n t
his
in
form
ati
on
is
at
use
r ri
sk.
It
is s
ub
ject
to
revis
ion
an
d m
ay b
e in
com
ple
te d
ep
en
din
g u
po
n c
han
gin
g c
on
dit
ion
s. Th
e D
ep
art
men
t ass
um
es
no
lia
bilit
y if
inju
ries
or
dam
ag
es
resu
lt f
rom
th
is in
form
ati
on
. T
his
map
is
no
t in
ten
ded
to
su
pp
ort
em
erg
en
cy d
isp
atc
h.
Ro
ad
nam
es
use
d o
n t
his
map
may n
ot
matc
h o
ffic
ial ro
ad
nam
es.
Th
e M
ain
e D
ep
art
men
t o
f Tra
nsp
ort
ati
on
pro
vid
es
this
pu
bli
cati
on
fo
r in
form
ati
on
on
ly.
Reli
an
ce u
po
n t
his
in
form
ati
on
is
at
use
r ri
sk.
It
is s
ub
ject
to
revis
ion
an
d m
ay b
e i
nco
mp
lete
dep
en
din
g u
po
n c
han
gin
gco
nd
itio
ns.
Th
e D
ep
art
men
t ass
um
es
no
lia
bil
ity i
f in
juri
es
or
dam
ag
es
resu
lt f
rom
th
is i
nfo
rmati
on
. T
his
map
is
no
t in
ten
ded
to
su
pp
ort
em
erg
en
cy d
isp
atc
h.
Ro
ad
nam
es
use
d o
n t
his
map
may n
ot
matc
h o
ffic
ial
road
nam
es.

Memorandum
DATE: March 12, 2013 TO: Shawn Davis DEPT: Region 4, Highway FROM: Scott A. Hayden DEPT: Highway Program SUBJECT: 18289.00 Sebec - Milo, Route 6 - Final Soils Report No. 2013-117 Project Information A subsurface investigation has been completed for the rehabilitation of a 4.5 mile portion of Route 6 in the towns of Sebec and Milo. The purpose of this investigation is to determine the existing pavement structure information and subsurface soil conditions. The investigation included the use of a drill rig, falling weight deflectometer (FWD) and ground penetrating radar (GPR). The project begins 0.05 miles west of the Sebec Village Road and extends easterly 4.57 miles to 0.01 miles west of the Billington Road. Project stationing was not provided in the field. A starting station of 10+00 (RLM 105.36, pavement joint) was designated for the purposes of this report. All references to stationing are based on stationing determined in the field using a vehicle mounted distance measuring instrument (DMI). Existing Pavement Data ARAN Data Summary The existing roadway is striped as 11.5-foot travel lanes with 7-foot paved shoulders. Pavement distress is moderate with cracking (fatigue, block, transverse, longitudinal) and rutting. It is anticipated that this pavement distress is due to poor surficial and subsurface drainage, frost effects, traffic loading, and fatigue. A summary of the 2011 ARAN data is presented in Table 1 below. A complete listing of the ARAN data is presented on the Pavement Performance Assessment Summary (PPAS) found at the back of this report.
Table 1: Summary of 2011 ARAN Pavement Data
ARAN Pavement Data Range Average
Pavement Condition Rating (PCR) 3.02 – 3.7 3.27 International Roughness Index (IRI) 110 - 220 170 Rut Depth (left) 0.2” – 0.3” 0.28” Rut Depth (right) 0.2” – 0.5” 0.36”
Highway Program Brad Foley, Program Manager

Pavement Condition Rating (PCR) PCR is defined as the composite condition of the pavement on a roadway. The PCR is compiled from the severity and extent of pavement distresses such as cracking, rutting, and ride quality. The rating system uses a scale of 5.00 (perfect) to 0.00 (fully deteriorated). The PCR is the condition of the pavement only, not necessarily a reflection of the condition of the roadway base structure. A description PCR rating follows:
Scale Value Scale Rating Description
5 Excellent New or nearly new pavements. Free of cracks, patches or rutting.
4 Good Pavements exhibit little to no visible signs of surface deterioration. Evidence of initial cracking or rutting.
3 Fair Visible defects including moderate cracking, distortion and rutting. Some patching may now be present.
2 Poor Pavement deterioration consisting of advanced cracking and severe distortion. Extensive patching and rutting also present.
1 Very Poor Extremely deteriorated pavements. Defects include severe cracking, distortion, rutting and typically very extensive patching.
The PCR rating for this project ranges from 3.02 – 3.70 with an average PCR of 3.27. The poorest values (3.02, 3.08) were encountered between stations 45+00 and 91+00. International Roughness Index (IRI) Ride quality is expressed in terms of International Roughness Index (IRI) and is measured in inches per mile. IRI is a measurement of the inches of vertical displacement experienced by a vehicle in a mile of roadway. The lower the IRI, the smoother the ride will be. A description IRI scale follows:
IRI Value (In./mile) Ride Rating
< 100 Good Ride
100 - 170 Fair Ride > 170 Poor Ride
The IRI value for this project ranged between 110 - 220 in/mile with an average IRI value of 170 in/mile. The poorest IRI values (180) were encountered between stations 104+00 and 134+00. Wheel Path Rutting Values Wheel path rutting is present throughout the project site. Rut depths varied from 0.2” – 0.5”. Rutting is worse in the outside wheel path between stations 221+00 and 250+00.

Existing HMA Thickness Existing pavement thickness estimates have been provided based on power auger borings, pavement coring and ground penetrating radar data. Coring Data – Seventeen pavement cores were obtained using a hand held, gas powered, coring machine utilizing a 2” thin wall core bit (See attached pavement core summary sheet). Pavement cores were generally conducted in the right outside wheel, centerline and right shoulder at stations 50+00, 90+00, 130+00, 170+00 and 210+00. One core was drilled in the truck lane (18.0’ left) at station 130+00. The cores were transported to the Bangor Lab where they were photographed and stored. Photographs of the cores are included at the back of this report. A summary/comparison of the existing pavement thickness derived from coring data verses the GPR data is shown below in Table 2. Power Auger Boring Data – Thirteen power auger borings were conducted through the existing pavement. The pavement surface was not found to be completely solid at all locations. An unbound pavement layer (5” – 7” thick) was found beneath the solid pavement layer at three locations (90+00, 130+00, 182+50). The solid HMA thickness range and average from the power auger borings is listed below in Table 2. GPR Data – GPR data was collected at 1 foot intervals in the left and right wheel path of both the east and west bound lanes. Pavement thickness estimates were developed using Geophysical Survey Systems Inc. (GSSI) RADAN GPR Data Processing Software. Where available, pavement core thicknesses were used to ground truth the GPR data. The GPR pavement estimate data is presented on the attached GPR Estimated Pavement Thickness summary sheets as an average pavement thickness utilizing a 100’ interval.
Table 2: Pavement Thickness Summary/Comparison
Travel Lane Centerline Shoulder Truck Lane Pavement Core Data
Range of Thickness 7.5” – 11.0” 7.0” – 12.0” 2.0” – 11.5” 9” Average Thickness 8.6” 8.7” 4.1” 9”
Power Auger Data
Range of Thickness 5.0” – 12” 10” Average Thickness 8.6” 10”
Ground Penetrating Radar Data
Range of Thickness 7.6” – 13.0” - 7.5” – 11.3 Average Thickness 10.2” - 9.1”
Subsurface Explorations Subsurface explorations were conducted by Maine DOT using a CME 45C truck mounted drill rig. Bore hole logging was performed by Maine DOT. Power Auger Borings A total of 13 power augers borings were conducted to determine the existing roadway structure and underlying subgrade soil conditions (See Boring Logs). Power auger borings were conducted using 5” solid stem augers. Soil sampling was conducted directly from the auger flights. Power auger borings were conducted in the travel lanes only.

Soil Sampling A total of 11 soil samples were collected and tested at the Maine DOT Materials and Testing laboratory, located in Bangor Maine. Grain size and water content testing was conducted on each sample. Based upon laboratory test results, soil samples were classified according to the Unified Classification System, AASHTO Soil Classification and Maine DOT Frost Susceptibility Rating. Testing results are summarized on the attached Laboratory Testing Summary Sheet at the back of this report. Existing Roadway Base Existing Base Material Type: silty gravelly SAND, A-1-b
gravelly silty SAND, A-1-b, A-4 Percent Passing #200 Sieve: 19% - 39% Range of Base Material Thickness: 19” – 52” Average Thickness: 32” Quality of Drainage (AASHTO): poor to very poor Permeability: 0.07’ – 1’ per day The existing base consists primarily of damp silty gravelly SAND (S1, S4, S11) and gravelly silty SAND (S6, S8). Generally, the gravel thickness was greater than 24-inches. Between stations 10+00 and 67+50 the base material was described as dry. However, beyond station 76+00 the base material is described as damp to moist. At station 105+00 the boring log did not differentiate a soil break between the base material and underlying subgrade soils. Instead, a gravelly silty SAND (S8) was encountered full depth. This material is very silty (39% fines) and has a less desirable soil classification (A-4) than other samples of the existing base layer. Subgrade Soils Subgrade soils are anticipated to consist primarily of moist gravelly sandy SILT similar to samples S5, S7 (glacial till). These soils are silty with nearly 50% passing the # 200 sieve. They are highly frost susceptible. These gravelly sandy SILTs are classified (AASHTO) as an A-4 soil. These soils have an affinity to water and will lose much of their stability unless properly drained and compacted. Between stations 10+00 and 67+50 subgrade soils were described as damp. However, beyond station 76+00 these soils are described as moist to wet. FWD Results FWD data was collected using a 250-foot test interval. A summary of the FWD analysis is shown in Table 3 on the following page. FWD Deflection Plots Payment Layer Deflections - FWD deflection plots for the pavement are relatively low (10mils) and uniform between stations 10+00 and 42+00. Beyond station 42+00 pavement deflections increase and become non-uniform. Deflections are highest and less uniform between stations 42+00 – 92+00, 150+00 - 167+00, 180+00 – 195+00, 205+00, and 230+00 – 250+00. Pavement conditions are generally poorer in these areas.

Subbase/Subgrade Soil Layer Deflections - FWD deflections in the subbase/subgrade soil layers generally mirror the pavement deflections. Deflections become higher and less uniform beyond station 42+00. The FWD deflection plots have been included at the back of this report. FWD Analysis An FWD analysis was conducted using the following variables:
Design Life: 12 Future 18-kip P2.5 ESALs (Design Life): 3,368,220 Initial Serviceability: 4.5 Terminal Serviceability: 2.5 Reliability Level: 90% Overall Standard Deviation: .45
Pavement depths used for DARWin analysis were taken from Ground Penetrating Radar Summary sheet. Gravel depths were obtained from power auger borings. A summary of the FWD Analysis is shown below in Table 3.
Table 3: Summary of FWD Analysis
Design Variables % Exceeds Range Average 75
Percentile
Existing SN meets or exceeds Future SN 100% Pavement Modulus (psi) 67,327 – 211,264 132,938 111,780 Subgrade Resilient Modulus (psi) 4,166 – 16,241 6,401 5,360 Pavement Performance Assessment Summary The Pavement Performance Assessment Summary (PPAS) on the following pages is a performance evaluation tool utilizing FWD and ARAN data. Based on the Pavement Performance Assessment Summary the poorest performing areas are between stations 51+00 – 53+00, 81+00 – 91+00, 150+00 – 159+00, 205+00 and 221+00 – 250+00. See attached Pavement Performance Assessment Summary (PPAS).

Pavement Performance Assessment Summary Criteria Explanation
The purpose of the PPAS is to highlight potential areas along the project that may not be performing as well as other areas. Six potential performance criteria are used to provide this relative performance assessment. The 6 criteria are listed and explained below: 1. Existing Structural Number (SN) is less than the Future Structural Number (FWD Data) - If
the existing SN is less than the future SN at any station along the project an X will be placed in the corresponding column and the box will be shaded.
2. Increased and/or Non Uniform FWD Deflections (FWD Data) – An X is placed in this column
anytime the pavement deflection (1st sensor) is greater than 15 mils, anytime the 2nd sensor is greater than 10 mils, and anytime the deflections become non uniform.
3. IRI > 150 (ARAN Data) – A complete listing of all ARAN IRI values collected for the project
are listed on the PPAS in the IRI column. If the IRI value becomes greater than 150 (indicating a reduction in ride performance) for any station the box will be shaded on the PPAS. This information includes the complete data collection from the ARAN inventory for the project rather than just the node data points supplied in projex..
4. PCR < 3.5 (ARAN Data) – A complete listing of all ARAN PCR values collected for the project
are listed on the PPAS in the PCR column. If the PCR value becomes 3.5 or less (indicating increased pavement deterioration) for any station the box will be shaded on the PPAS. This information includes the complete data collection from the ARAN inventory for the project rather than just the node data points supplied in projex..
5 & 6. Left Rut Depth / Right Rut Depth (ARAN Data) – A complete listing of all left and right rut
depth values collected along the project are listed on the PPAS in the rut depth columns. If the rut depth becomes 0.5” or greater the box will be shaded on the PPAS. This information includes the complete data collection from the ARAN inventory for the project rather than just the node data points supplied in projex..
Deficiency Column - The total number of deficient performance criteria (0 – 6) are totaled and placed in the deficient column (Def) for each station identified in the PPAS. If the total listed becomes 3 or greater the box will then be shaded. Existing and future pavement performance is likely to be reduced in areas exhibiting a greater number in the deficiency column. Additional reclamation measures may want to be considered in these poorly performing areas.

Pavement Performance Assessment Summary(PPAS)
18289.00 Sebec - MiloRoute 6
PERFORMANCE MEASURESUREMENTS GEN. PAVEMENT INFORMATIONFWD Data ARAN Data ARAN Supplied Data
Station RLM Inv Yr
Def ( ≥ 3 )
Existing SN <
Future SN
FWD Pavement Deflections
>15mils
PCR < 3.5
IRI > 150
Rut Depth > 0.5" Shoulder Type and Width Yr.
BuiltYr.
Resurf.
Left Right Left Right(in.) (in.) ft ft
10+00 105.36 2010 0 3.7 144 0.2 0.2 Paved 8 Paved 8 199111+58 105.39 2010 0 3.7 144 0.2 0.2 Paved 8 Paved 8 199112+11 105.4 2010 0 3.7 144 0.2 0.2 Paved 8 Paved 8 199113+70 105.43 2010 0 3.7 144 0.2 0.2 Paved 8 Paved 8 199114+22 105.44 2010 0 3.7 144 0.2 0.2 Paved 8 Paved 8 199115+81 105.47 2010 0 3.64 110 0.3 0.4 Paved 8 Paved 8 199116+86 105.49 2010 0 3.64 110 0.3 0.4 Paved 8 Paved 8 199123+20 105.61 2010 0 3.64 110 0.3 0.4 Paved 8 Paved 8 199125+31 105.65 2010 0 3.64 110 0.3 0.4 Paved 8 Paved 8 199139+57 105.92 2010 0 3.64 110 0.3 0.4 Paved 8 Paved 8 199141+68 105.96 2010 0 3.64 110 0.3 0.4 Paved 8 Paved 8 199145+38 106.03 2010 2 3.08 165 0.3 0.4 Paved 8 Paved 8 199146+43 106.05 2010 2 3.08 165 0.3 0.4 Paved 8 Paved 8 199151+00 106.14 2010 3 X 3.08 165 0.3 0.4 Paved 8 Paved 8 199153+00 106.18 2010 3 X 3.08 165 0.3 0.4 Paved 8 Paved 8 199169+14 106.48 2010 2 3.08 165 0.3 0.4 Paved 8 Paved 8 199171+25 106.52 2010 2 3.08 165 0.3 0.4 Paved 8 Paved 8 199174+94 106.59 2010 2 3.02 167 0.3 0.4 Paved 8 Paved 8 199175+47 106.6 2010 2 3.02 167 0.3 0.4 Paved 8 Paved 8 199176+00 106.61 2010 2 3.02 167 0.3 0.4 Paved 8 Paved 8 199181+00 106.7 2010 3 X 3.02 167 0.3 0.4 Paved 8 Paved 8 199183+92 106.76 2010 3 X 3.02 167 0.3 0.4 Paved 8 Paved 8 199184+98 106.78 2010 3 X 3.02 167 0.3 0.4 Paved 8 Paved 8 199185+50 106.79 2010 3 X 3.02 167 0.3 0.4 Paved 8 Paved 8 199188+67 106.85 2010 3 X 3.02 167 0.3 0.4 Paved 8 Paved 8 199189+20 106.86 2010 3 X 3.02 167 0.3 0.4 Paved 8 Paved 8 199191+00 106.89 2010 3 X 3.02 167 0.3 0.4 Paved 8 Paved 8 1991104+51 107.15 2010 2 3.27 180 0.2 0.3 Paved 8 Paved 8 1991105+57 107.17 2010 2 3.27 180 0.2 0.3 Paved 8 Paved 8 1991111+38 107.28 2010 2 3.27 180 0.2 0.3 Paved 8 Paved 8 1991112+43 107.3 2010 2 3.27 180 0.2 0.3 Paved 8 Paved 8 1991114+54 107.34 2010 2 3.27 180 0.2 0.3 Paved 8 Paved 8 1991118+77 107.42 2010 2 3.27 180 0.2 0.3 Paved 8 Paved 8 1991119+30 107.43 2010 2 3.27 180 0.2 0.3 Paved 8 Paved 8 1991120+88 107.46 2010 2 3.27 180 0.2 0.3 Paved 8 Paved 8 1991121+41 107.47 2010 2 3.27 180 0.2 0.3 Paved 8 Paved 8 1991122+46 107.49 2010 2 3.27 180 0.2 0.3 Paved 8 Paved 8 1991122+99 107.5 2010 2 3.27 180 0.2 0.3 Paved 8 Paved 8 1991134+08 107.71 2010 2 3.37 163 0.3 0.3 Paved 8 Paved 8 1991134+61 107.72 2010 2 3.37 163 0.3 0.3 Paved 8 Paved 8 1991135+14 107.73 2010 2 3.37 163 0.3 0.3 Paved 8 Paved 8 1991135+66 107.74 2010 2 3.37 163 0.3 0.3 Paved 8 Paved 8 1991136+72 107.76 2010 2 3.37 163 0.3 0.3 Paved 8 Paved 8 1991141+47 107.85 2010 2 3.37 163 0.3 0.3 Paved 8 Paved 8 1991150+00 108.01 2010 3 X 3.37 163 0.3 0.3 Paved 8 Paved 8 1991154+67 108.1 2010 3 X 3.37 163 0.3 0.3 Paved 8 Paved 8 1991155+20 108.11 2010 3 X 3.37 163 0.3 0.3 Paved 8 Paved 8 1991156+78 108.14 2010 3 X 3.37 163 0.3 0.3 Paved 8 Paved 8 1991158+37 108.17 2010 3 X 3.37 163 0.3 0.3 Paved 8 Paved 8 1991
Note: Dates provided in Year Built and Year Resurface are provided from the ARAN data and have not been verified.

18289.00 Sebec - MiloRoute 6
PERFORMANCE MEASURESUREMENTS GEN. PAVEMENT INFORMATIONFWD Data ARAN Data ARAN Supplied Data
Station RLM Inv Yr
Def ( ≥ 3 )
Existing SN <
Future SN
FWD Pavement Deflections
>15mils
PCR < 3.5
IRI > 150
Rut Depth > 0.5" Shoulder Type and Width Yr.
BuiltYr.
Resurf.
158+90 108.18 2010 3 X 3.37 163 0.3 0.3 Paved 8 Paved 8 1991163+65 108.27 2010 2 3.26 177 0.3 0.4 Paved 8 Paved 8 1991164+70 108.29 2010 2 3.26 177 0.3 0.4 Paved 8 Paved 8 1991175+26 108.49 2010 2 3.26 177 0.3 0.4 Paved 8 Paved 8 1991181+07 108.6 2010 2 3.26 177 0.3 0.4 Paved 8 Paved 8 1991181+60 108.61 2010 2 3.26 177 0.3 0.4 Paved 8 Paved 8 1991184+77 108.67 2010 2 3.26 177 0.3 0.4 Paved 8 Paved 8 1991185+30 108.68 2010 2 3.26 177 0.3 0.4 Paved 8 Paved 8 1991185+82 108.69 2010 2 3.26 177 0.3 0.4 Paved 8 Paved 8 1991187+94 108.73 2010 2 3.26 177 0.3 0.4 Paved 8 Paved 8 1991192+69 108.82 2010 2 3.38 152 0.3 0.3 Paved 8 Paved 8 1991193+74 108.84 2010 2 3.38 152 0.3 0.3 Paved 8 Paved 8 1991200+61 108.97 2010 2 3.38 152 0.3 0.3 Paved 8 Paved 8 1991201+14 108.98 2010 2 3.38 152 0.3 0.3 Paved 8 Paved 8 1991202+19 109 2010 2 3.38 152 0.3 0.3 Paved 8 Paved 8 1991205+00 109.05 2010 3 X 3.38 152 0.3 0.3 Paved 8 Paved 8 1991214+86 109.24 2010 2 3.38 152 0.3 0.3 Paved 8 Paved 8 1991216+98 109.28 2010 2 3.38 152 0.3 0.3 Paved 8 Paved 8 1991217+50 109.29 2010 2 3.38 152 0.3 0.3 Paved 8 Paved 8 1991221+73 109.37 2010 3 3.06 220 0.3 0.5 Paved 8 Paved 8 1991223+31 109.4 2010 3 3.06 220 0.3 0.5 Paved 8 Paved 8 1991235+00 109.62 2010 4 X 3.06 220 0.3 0.5 Paved 8 Paved 8 1991240+00 109.71 2010 4 X 3.06 220 0.3 0.5 Paved 9 Paved 8 1991243+90 109.79 2010 3 3.06 220 0.3 0.5 Paved 8 Paved 8 1991245+49 109.82 2010 3 3.06 220 0.3 0.5 Paved 8 Paved 8 1991246+02 109.83 2010 3 3.06 220 0.3 0.5 Paved 8 Paved 8 1991246+54 109.84 2010 3 3.06 220 0.3 0.5 Paved 8 Paved 8 2012247+60 109.86 2010 3 3.06 220 0.3 0.5 Paved 8 Paved 8 2012248+13 109.87 2010 3 3.06 220 0.3 0.5 Paved 8 Paved 8 2012248+66 109.88 2010 3 3.06 220 0.3 0.5 Paved 8 Paved 8 2012249+18 109.89 2010 3 3.06 220 0.3 0.5 Paved 8 Paved 8 2012249+71 109.9 2010 3 3.06 220 0.3 0.5 Paved 8 Paved 8 2012
Average 2.1 3.27 170 0.28 0.36
Note: Dates provided in Year Built and Year Resurface are provided from the ARAN data and have not been verified.

Falling Weight Deflectometer (FWD) Summary Sheet
Project #: 18289.00 Town(s): Sebec-Milo Route(s): 6/16 Date Tested: 07/9/2012 Requested By: S Hayden Direction of Testing: East # Of FWD tests: 96 # Of Power Augers/Spoons - 13 Design Life: 12 Future 18-kip P2.5 ESALs (Design Life): 3,368,220 Initial Serviceability: 4.5 Terminal Serviceability: 2.5 Reliability Level: 90% Overall Standard Deviation: .45 Locations Station (Feet) Description Comments: Pavement depths used for DARWin analysis were taken from Ground Penetrating Radar Summary Sheets.

WIN
/To
wn
:01
82
89.0
0 -
Seb
ec
,Mil
o
Rou
te:
6/1
6
Ma
in
e
DO
T,
M
at
er
ia
ls
T
es
ti
ng
&
E
xp
lo
ra
ti
on
,
21
9
Ho
ga
n
Ro
ad
,
Ba
ng
or
,
Ma
in
e
04
40
1
FW
D D
EF
LE
CT
ION
DA
TA
Rep
ort
ed B
y:C
OL
SO
N,
ST
EP
HE
N W
Teste
d:
7/9
/2012
Com
me
nts
:
PM
S R
ou
te C
ode
Rep
ort
ed:
2/2
6/2
01
3
12+50
16+00
17+79
20+00
22+50
25+00
27+65
30+01
32+50
35+01
37+51
40+00
42+50
45+01
47+50
50+00
52+51
55+00
57+51
60+00
62+50
65+00
67+50
70+00
72+52
Sta
tio
n
0
10
20
30
40
Deflections, 0.001 in
Se
ns
or #
1 (
0")
Se
ns
or #
2 (
12
")
Se
ns
or #
3 (
18
")
Se
ns
or #
4 (
24
")
Se
ns
or #
5 (
36
")
Se
ns
or #
6 (
48
")
Se
ns
or #
7 (
60
")
010
20
30
40

WIN
/To
wn
:01
82
89.0
0 -
Seb
ec
,Mil
o
Rou
te:
6/1
6
Ma
in
e
DO
T,
M
at
er
ia
ls
T
es
ti
ng
&
E
xp
lo
ra
ti
on
,
21
9
Ho
ga
n
Ro
ad
,
Ba
ng
or
,
Ma
in
e
04
40
1
FW
D D
EF
LE
CT
ION
DA
TA
Rep
ort
ed B
y:C
OL
SO
N,
ST
EP
HE
N W
Teste
d:
7/9
/2012
Com
me
nts
:
PM
S R
ou
te C
ode
Rep
ort
ed:
2/2
6/2
01
3
75+00
77+50
80+01
82+62
85+00
88+38
90+00
92+50
95+04
97+50
100+00
102+50
105+00
107+50
110+00
112+50
115+01
117+50
120+01
122+54
125+04
127+51
130+01
132+50
135+00
Sta
tio
n
0
10
20
30
40
Deflections, 0.001 in
Se
ns
or #
1 (
0")
Se
ns
or #
2 (
12
")
Se
ns
or #
3 (
18
")
Se
ns
or #
4 (
24
")
Se
ns
or #
5 (
36
")
Se
ns
or #
6 (
48
")
Se
ns
or #
7 (
60
")
010
20
30
40

WIN
/To
wn
:01
82
89.0
0 -
Seb
ec
,Mil
o
Rou
te:
6/1
6
Ma
in
e
DO
T,
M
at
er
ia
ls
T
es
ti
ng
&
E
xp
lo
ra
ti
on
,
21
9
Ho
ga
n
Ro
ad
,
Ba
ng
or
,
Ma
in
e
04
40
1
FW
D D
EF
LE
CT
ION
DA
TA
Rep
ort
ed B
y:C
OL
SO
N,
ST
EP
HE
N W
Teste
d:
7/9
/2012
Com
me
nts
:
PM
S R
ou
te C
ode
Rep
ort
ed:
2/2
6/2
01
3
137+60
140+00
142+50
145+01
147+50
150+01
152+51
155+09
157+51
160+00
162+55
165+01
167+50
170+00
172+52
175+00
177+51
180+00
182+50
185+00
187+53
190+01
192+51
195+00
197+50
Sta
tio
n
0
10
20
30
40
Deflections, 0.001 in
Se
ns
or #
1 (
0")
Se
ns
or #
2 (
12
")
Se
ns
or #
3 (
18
")
Se
ns
or #
4 (
24
")
Se
ns
or #
5 (
36
")
Se
ns
or #
6 (
48
")
Se
ns
or #
7 (
60
")
010
20
30
40

WIN
/To
wn
:01
82
89.0
0 -
Seb
ec
,Mil
o
Rou
te:
6/1
6
Ma
in
e
DO
T,
M
at
er
ia
ls
T
es
ti
ng
&
E
xp
lo
ra
ti
on
,
21
9
Ho
ga
n
Ro
ad
,
Ba
ng
or
,
Ma
in
e
04
40
1
FW
D D
EF
LE
CT
ION
DA
TA
Rep
ort
ed B
y:C
OL
SO
N,
ST
EP
HE
N W
Teste
d:
7/9
/2012
Com
me
nts
:
PM
S R
ou
te C
ode
Rep
ort
ed:
2/2
6/2
01
3
200+02
202+51
205+04
207+51
210+00
212+52
215+01
217+55
220+01
222+50
225+00
227+52
230+01
232+50
235+04
237+51
240+01
242+50
245+01
247+51
250+00
Sta
tio
n
0
10
20
30
40
Deflections, 0.001 in
Se
ns
or #
1 (
0")
Se
ns
or #
2 (
12
")
Se
ns
or #
3 (
18
")
Se
ns
or #
4 (
24
")
Se
ns
or #
5 (
36
")
Se
ns
or #
6 (
48
")
Se
ns
or #
7 (
60
")
010
20
30
40
18289.00 Sebec-MiloRoute #6/16
CombinedExisting Future Traffic Overlay Recommended Subgrade Pavement/Gravel
Station Structural Structural Structural Number Pavement Pavement Resilient Pavement Depth Used(Feet) Number (in.) Number (in.) (Existing - Future) Thickness (in.) Modulus (psi) Modulus (psi) Depth (in) for Calculation (in)
12+50 6.90 4.08 2.82 - 133,342 7,389 9.1 30.016+00 6.47 4.24 2.23 - 110,258 6,597 8.8 30.017+79 6.91 4.08 2.83 - 134,326 7,364 8.9 30.020+00 6.33 4.39 1.94 - 103,231 5,932 8.9 30.022+50 6.92 4.46 2.46 - 134,419 5,660 10.0 30.025+00 6.85 4.09 2.76 - 130,895 7,323 9.4 30.027+65 7.18 3.96 3.22 - 150,645 8,065 9.4 30.030+01 7.34 4.05 3.29 - 160,454 7,509 9.5 30.032+50 7.20 3.94 3.26 - 151,662 8,170 9.5 30.035+01 6.96 4.02 2.94 - 137,325 7,713 8.8 30.037+51 7.38 4.33 3.05 - 163,646 6,193 9.6 30.040+00 7.29 4.20 3.09 - 157,409 6,756 9.4 30.042+50 6.85 4.53 2.32 - 130,725 5,377 9.5 30.045+01 6.17 4.44 1.73 - 95,659 5,735 9.3 30.047+50 6.82 4.23 2.59 - 128,840 6,617 9.8 30.050+00 6.02 4.66 1.36 - 88,652 4,954 10.5 30.052+51 5.77 4.59 1.18 - 78,228 5,179 10.5 30.055+00 6.33 4.23 2.10 - 103,094 6,605 10.3 30.057+51 5.98 4.60 1.38 - 86,886 5,143 10.5 30.060+00 6.71 4.62 2.09 - 122,843 5,077 11.5 30.0
Possible Weak Soils (<3000)Possible Shallow Bedrock (>8000)Pavement depths were taken from Ground Penetrating Radar Summary Sheet.
0
5,000
10,000
15,000
12+5
0
16+0
0
17+7
9
20+0
0
22+5
0
25+0
0
27+6
5
30+0
1
32+5
0
35+0
1
37+5
1
40+0
0
42+5
0
45+0
1
47+5
0
50+0
0
52+5
1
55+0
0
57+5
1
60+0
0
Subg
rade
Res
ilien
t Mod
ulus
(psi
)
Station
18289.00 Sebec-MiloRoute #6/16
Subgrade Resilient Modulus (psi)
-5.00-4.00-3.00-2.00-1.000.001.002.003.004.005.00
12+5
0
16+0
0
17+7
9
20+0
0
22+5
0
25+0
0
27+6
5
30+0
1
32+5
0
35+0
1
37+5
1
40+0
0
42+5
0
45+0
1
47+5
0
50+0
0
52+5
1
55+0
0
57+5
1
60+0
0
Ove
rlay
SN (E
xist
ing-
Futu
re) (
in.)
Station
18289.00 Sebec-MiloRoute #6/16Overlay SN

18289.00 Sebec-MiloRoute #6/16
CombinedExisting Future Traffic Overlay Recommended Subgrade Pavement/Gravel
Station Structural Structural Structural Number Pavement Pavement Resilient Pavement Depth Used(Feet) Number (in.) Number (in.) (Existing - Future) Thickness (in.) Modulus (psi) Modulus (psi) Depth (in) for Calculation (in)
62+50 6.27 4.87 1.40 - 100,283 4,323 11.7 30.065+00 6.77 4.63 2.14 - 126,248 5,050 10.3 30.067+50 6.18 4.88 1.30 - 95,822 4,302 10.3 30.070+00 6.53 4.51 2.02 - 113,380 5,480 10.4 30.072+52 7.01 4.34 2.67 - 140,292 6,149 10.8 30.075+00 6.93 3.85 3.08 - 135,252 8,703 10.7 30.077+50 6.68 3.86 2.82 - 138,094 8,637 11.7 28.780+01 6.00 4.29 1.71 - 121,513 6,361 9.9 26.982+62 4.92 4.75 0.17 - 67,327 4,667 10.2 27.285+00 5.68 4.76 0.92 - 88,678 4,636 11.3 28.388+38 5.64 4.34 1.30 - 84,291 6,137 11.6 28.690+00 5.23 4.67 0.56 - 71,384 4,917 11.0 28.092+50 6.59 4.29 2.30 - 136,838 6,346 11.4 28.495+04 6.06 4.49 1.57 - 118,554 5,542 10.4 27.497+50 6.43 4.50 1.93 - 144,848 5,496 10.2 27.2
100+00 7.46 4.28 3.18 - 194,624 6,411 11.6 28.6102+50 6.57 4.30 2.27 - 158,076 6,297 10.0 27.0105+00 5.90 4.59 1.31 - 203,311 5,172 10.3 22.3107+50 5.68 4.50 1.18 - 191,688 5,520 9.9 21.9
Possible Weak Soils (<3000)Possible Shallow Bedrock (>8000)Pavement depths were taken from Ground Penetrating Radar Summary Sheet.
0
5,000
10,000
15,000
62+5
0
65+0
0
67+5
0
70+0
0
72+5
2
75+0
0
77+5
0
80+0
1
82+6
2
85+0
0
88+3
8
90+0
0
92+5
0
95+0
4
97+5
0
100+
00
102+
50
105+
00
107+
50
Subg
rade
Res
ilien
t Mod
ulus
(psi
)
Station
18289.00 Sebec-MiloRoute #6/16
Subgrade Resilient Modulus (psi)
-5.00-4.00-3.00-2.00-1.000.001.002.003.004.005.00
62+5
0
65+0
0
67+5
0
70+0
0
72+5
2
75+0
0
77+5
0
80+0
1
82+6
2
85+0
0
88+3
8
90+0
0
92+5
0
95+0
4
97+5
0
100+
00
102+
50
105+
00
107+
50
Ove
rlay
SN (E
xist
ing-
Futu
re) (
in.)
Station
18289.00 Sebec-MiloRoute #6/16Overlay SN

18289.00 Sebec-MiloRoute #6/16
CombinedExisting Future Traffic Overlay Recommended Subgrade Pavement/Gravel
Station Structural Structural Structural Number Pavement Pavement Resilient Pavement Depth Used(Feet) Number (in.) Number (in.) (Existing - Future) Thickness (in.) Modulus (psi) Modulus (psi) Depth (in) for Calculation (in)
110+00 5.84 4.32 1.52 - 202,676 6,211 10.1 22.1112+50 5.33 4.91 0.42 - 160,485 4,225 9.8 21.8115+01 5.02 4.59 0.43 - 132,301 5,171 9.9 21.9117+50 5.46 4.68 0.78 - 152,397 4,894 10.7 22.7120+01 5.98 4.47 1.51 - 203,630 5,621 10.6 22.6122+54 5.75 3.75 2.00 - 175,751 9,381 10.8 22.8125+04 5.41 4.39 1.02 - 137,426 5,945 11.3 23.3127+51 5.78 4.45 1.33 - 153,667 5,694 12.0* 24.0130+01 5.09 4.78 0.31 - 112,704 4,584 11.4 23.4132+50 5.84 4.55 1.29 - 170,334 5,325 11.4 23.4135+00 5.95 4.50 1.45 - 171,272 5,517 11.8 23.8137+60 6.30 4.17 2.13 - 198,415 6,886 12.0* 24.0140+00 6.37 4.32 2.05 - 205,050 6,216 12.0* 24.0142+50 5.14 4.62 0.52 - 156,202 5,080 9.2 21.2145+01 5.48 4.54 0.94 - 178,744 5,366 9.6 21.6147+50 5.00 4.33 0.67 - 123,456 6,166 10.3 22.3150+01 5.01 4.62 0.39 - 117,699 5,079 10.7 22.7152+51 4.52 4.84 -0.32 0.73 85,276 4,400 10.8 22.8155+09 6.70 4.56 2.14 - 122,033 5,285 9.6 30.0
Possible Weak Soils (<3000)Possible Shallow Bedrock (>8000)Pavement depths were taken from Ground Penetrating Radar Summary Sheet. * Maximum Pavement Depth allowed by DARWin Software is 12 inches
0
5,000
10,000
15,000
110+
00
112+
50
115+
01
117+
50
120+
01
122+
54
125+
04
127+
51
130+
01
132+
50
135+
00
137+
60
140+
00
142+
50
145+
01
147+
50
150+
01
152+
51
155+
09
Subg
rade
Res
ilien
t Mod
ulus
(psi
)
Station
18289.00 Sebec-MiloRoute #6/16
Subgrade Resilient Modulus (psi)
-5.00-4.00-3.00-2.00-1.000.001.002.003.004.005.00
110+
00
112+
50
115+
01
117+
50
120+
01
122+
54
125+
04
127+
51
130+
01
132+
50
135+
00
137+
60
140+
00
142+
50
145+
01
147+
50
150+
01
152+
51
155+
09
Ove
rlay
SN (E
xist
ing-
Futu
re) (
in.)
Station
18289.00 Sebec-MiloRoute #6/16Overlay SN

18289.00 Sebec-MiloRoute #6/16
CombinedExisting Future Traffic Overlay Recommended Subgrade Pavement/Gravel
Station Structural Structural Structural Number Pavement Pavement Resilient Pavement Depth Used(Feet) Number (in.) Number (in.) (Existing - Future) Thickness (in.) Modulus (psi) Modulus (psi) Depth (in) for Calculation (in)
157+51 5.55 4.59 0.96 - 69,425 5,171 10.3 30.0160+00 7.36 3.84 3.52 - 162,262 8,790 9.4 30.0162+55 7.36 4.46 2.90 - 162,260 5,656 11.7 30.0165+01 6.18 4.46 1.72 - 96,046 5,646 9.5 30.0167+50 6.56 4.36 2.20 - 114,869 6,068 8.7 30.0170+00 6.84 3.78 3.06 - 129,966 9,163 8.8 30.0172+52 7.06 4.16 2.90 - 142,960 6,958 8.9 30.0175+00 6.65 4.55 2.10 - 119,525 5,308 9.6 30.0177+51 8.04 4.03 4.01 - 211,264 7,658 10.6 30.0180+00 6.32 4.67 1.65 - 102,536 4,912 10.7 30.0182+50 6.64 4.46 2.18 - 118,892 5,674 9.8 30.0185+00 6.59 4.39 2.20 - 116,565 5,913 9.5 30.0187+53 6.71 4.47 2.24 - 122,766 5,604 10.3 30.0190+01 6.65 4.13 2.52 - 119,326 7,106 10.5 30.0192+51 6.40 4.37 2.03 - 106,573 5,994 11.1 30.0195+00 6.46 4.52 1.94 - 109,640 5,421 11.3 30.0197+50 6.92 4.12 2.80 - 134,517 7,158 11.1 30.0200+02 7.33 4.17 3.16 - 159,845 6,912 9.6 30.0202+51 7.33 3.32 4.01 - 159,970 13,205 9.0 30.0
Possible Weak Soils (<3000)Possible Shallow Bedrock (>8000)Pavement depths were taken from Ground Penetrating Radar Summary Sheet.
0
5,000
10,000
15,000
157+
51
160+
00
162+
55
165+
01
167+
50
170+
00
172+
52
175+
00
177+
51
180+
00
182+
50
185+
00
187+
53
190+
01
192+
51
195+
00
197+
50
200+
02
202+
51
Subg
rade
Res
ilien
t Mod
ulus
(psi
)
Station
18289.00 Sebec-MiloRoute #6/16
Subgrade Resilient Modulus (psi)
-5.00-4.00-3.00-2.00-1.000.001.002.003.004.005.00
157+
51
160+
00
162+
55
165+
01
167+
50
170+
00
172+
52
175+
00
177+
51
180+
00
182+
50
185+
00
187+
53
190+
01
192+
51
195+
00
197+
50
200+
02
202+
51
Ove
rlay
SN (E
xist
ing-
Futu
re) (
in.)
Station
18289.00 Sebec-MiloRoute #6/16Overlay SN

18289.00 Sebec-MiloRoute #6/16
CombinedExisting Future Traffic Overlay Recommended Subgrade Pavement/Gravel
Station Structural Structural Structural Number Pavement Pavement Resilient Pavement Depth Used(Feet) Number (in.) Number (in.) (Existing - Future) Thickness (in.) Modulus (psi) Modulus (psi) Depth (in) for Calculation (in)
205+04 5.82 4.40 1.42 - 80,132 5,903 10.5 30.0207+51 7.68 3.84 3.84 - 184,336 8,764 10.2 30.0210+00 7.47 4.22 3.25 - 169,604 6,659 9.9 30.0212+52 7.09 4.38 2.71 - 144,614 5,991 10.4 30.0215+01 7.32 4.35 2.97 - 159,158 6,078 10.4 30.0217+55 6.75 3.49 3.26 - 124,960 11,553 10.1 30.0220+01 7.48 3.08 4.40 - 169,868 16,241 9.7 30.0222+50 7.08 4.17 2.91 - 144,469 6,906 10.6 30.0225+00 6.78 4.22 2.56 - 126,797 6,686 9.0 30.0227+52 7.04 4.34 2.70 - 142,109 6,142 9.3 30.0230+01 6.83 4.93 1.90 - 129,292 4,166 8.6 30.0232+50 6.69 4.48 2.21 - 121,955 5,581 10.3 30.0235+04 5.98 4.35 1.63 - 87,068 6,094 8.9 30.0237+51 6.51 4.11 2.40 - 112,288 7,210 9.9 30.0240+01 6.05 4.31 1.74 - 90,183 6,247 8.8 30.0242+50 6.41 3.97 2.44 - 107,207 7,993 8.8 30.0245+01 6.53 4.14 2.39 - 113,326 7,068 8.8 30.0247+51 6.58 3.97 2.61 - 115,689 7,957 8.7 30.0250+00 5.99 4.28 1.71 - 87,244 6,419 7.6 30.0
Possible Weak Soils (<3000)Possible Shallow Bedrock (>8000)Pavement depths were taken from Ground Penetrating Radar Summary Sheet.
0
5,000
10,000
15,000
205+
04
207+
51
210+
00
212+
52
215+
01
217+
55
220+
01
222+
50
225+
00
227+
52
230+
01
232+
50
235+
04
237+
51
240+
01
242+
50
245+
01
247+
51
250+
00
Subg
rade
Res
ilien
t Mod
ulus
(psi
)
Station
18289.00 Sebec-MiloRoute #6/16
Subgrade Resilient Modulus (psi)
-5.00-4.00-3.00-2.00-1.000.001.002.003.004.005.00
205+
04
207+
51
210+
00
212+
52
215+
01
217+
55
220+
01
222+
50
225+
00
227+
52
230+
01
232+
50
235+
04
237+
51
240+
01
242+
50
245+
01
247+
51
250+
00
Ove
rlay
SN (E
xist
ing-
Futu
re) (
in.)
Station
18289.00 Sebec-MiloRoute #6/16Overlay SN

STATE OF MAINE FILE: RTE 6INTERDEPARTMENTAL MEMORANDUM CC: RTE 16
Date of Request: 3/21/2012 Return: 3/23/2012Latest Date Needed By 8/1/2012
To: Ed Hanscom Dept.: MDOT, Bureau of Planning
From: Dept.:
Subject: Request for Traffic Information Project Manager:
TOWN(S): W.I.N. 18289.00 Consultant Proj
COUNTY: ROUTE: 6
N/A N/A N/A N/A N/A
Prep By: MAM Sec. 1 Sec. 2 Sec. 3 Sec. 4 Sec. 5
Description of SectionsSebec - SR 6/16
(Milo) E/O IR 381 (Sebec
Village)
1 3530 (2009)
2 Current 2012 AADT 3530
3 Future 2024 AADT 3950
4 Future AADT
5 DHV - % of AADT 10% % % % %
6 Design Hourly Volume 395
7 % Heavy Trucks (AADT) 16% % % % %
8 % Heavy Trucks (DHV) 13% % % % %
9 Direct.Dist. (DHV) 60% % % % %
10 18-KIP Equivalent P 2.0 807
11 18-KIP Equivalent P 2.5 769
Notes or Remarks: 18-Kip ESALS is based on 12 year life
PLEASE PROVIDE: (1) PIN NUMBER, (2) THE CURRENT & FUTURE YEARS FOR WHICH YOU WANTAADT CALCULATED, AND SEND TO MIKE MORGAN. ( A LOCATION MAP IS NO LONGER NEEDED.)
Need Only Data Items Numbered
Turning Movement needed (Provide Locations under Comments)
Mark A. Austin Highway Program
Shawn Davis
Milo/Sebec
Piscataquis
LOCATION/ DESCRIPTION:
Highway Reconstruction: Beginning at Sebec Village Road and extending easterly 4.53 miles to the Billington Road. RLM 105.55 to 110.08
Comments:
Latest AADT (Year)
Roadway Changes or Relocation (Attach Sketch) Other Please Describe Under Comments
TRAFFIC REQUESTS WILL BE FILLED ON A FIRST COME / SERVE BASIS. PLEASE SEND WHEN PROJECT KICKS OFF!!
Please Check Box if Applicable:

Station Offset Depth Reference G.S.D.C. W.C.
(Feet) (Feet) (Feet) Number Sheet Unified AASHTO Frost
16+00 9.0 Rt. 0.5-3.2 267097 1 2.8 SM A-1-b II
16+00 9.0 Rt. 3.2-5.0 267098 1 13.7 ML A-4 IV
20+00 9.0 Rt. 3.5-5.0 267099 1 6.2 SW-SM A-1-b 0
30+00 9.0 Rt. 0.63-5.0 267100 1 4.8 SM A-1-b II
50+15 9.0 Rt. 3.8-5.0 266676 1 11.9 SM A-4 III
76+00 9.0 Rt. 1.0-3.0 266677 2 4.6 SM A-1-b II
76+00 9.0 Rt. 3.0-5.0 266678 2 15.1 SM A-4 III
105+00 9.0 Rt. 0.75-5.0 266679 2 7.1 SM A-4 III
130+00 9.0 Rt. 4.0-5.0 266680 2 19.8 SM A-4 III
210+00 9.0 Rt. 3.0-5.0 266681 2 9.5 SM A-1-b II
130+00 9.0 Lt. 1.0-4.0 266682 2 5.4 SM A-1-b II
Classification of these soil samples is in accordance with AASHTO Classification System M-145-40. This classification
is followed by the "Frost Susceptibility Rating" from zero (non-frost susceptible) to Class IV (highly frost susceptible).
The "Frost Susceptibility Rating" is based upon the MDOT and Corps of Engineers Classification Systems.
GSDC = Grain Size Distribution Curve as determined by AASHTO T 88-93 (1996) and/or ASTM D 422-63 (Reapproved 1998)
WC = water content as determined by AASHTO T 265-93 and/or ASTM D 2216-98
LL = Liquid limit as determined by AASHTO T 89-96 and/or ASTM D 4318-98
PI = Plasticity Index as determined by AASHTO 90-96 and/or ASTM D4318-98
38.9
44.6
18.3
22.8
23.3
48.3
22.2
46.4
HB-SEMI-108, S8
HB-SEMI-109, S9
HB-SEMI-111, S10
HB-SEMI-113, S11
HB-SEMI-106, S6
Identification Number
HB-SEMI-101, S1
HB-SEMI-104, S5
Work Number: 18289.00
HB-SEMI-101, S2
% Passing
200 Sieve
18.8
54.8
8.9
HB-SEMI-106, S7
Classification
State of Maine - Department of Transportation
Laboratory Testing Summary Sheet
Town(s): Sebec-MiloBoring & Sample
HB-SEMI-102, S3
HB-SEMI-103, S4

3"
2"1-1/2"
1"
3/4"
1/2"
3/8"
1/4"
#4
#8
#10
#16
#20
#40
#60
#100
#200
0.05
0.03
0.010
0.005
0.001
76.2
50.8
38.1
25.4
19.05
12.7
9.53
6.35
4.75
2.36
2.00
1.18
0.85
0.426
0.25
0.15
0.075
0.05
0.03
0.005
GRAVEL
SAND
SILT
SIEVE ANALYSIS
US Standard Sieve Numbers
HYDROMETER ANALYSIS
Grain Diameter, mm
State of Maine Department of Transportation
GRAIN SIZE DISTRIBUTIO
N CURVE
100
10
10.1
0.01
0.001
Grain Diameter, mm
0
10
20
30
40
50
60
70
80
90
100
Percent Finer by Weight
100
90
80
70
60
50
40
30
20
10
0
Percent Retained by Weight
CLAY
SHEET NO.
UNIFIED CLASSIFICATION
SAND, some gravel, little silt.
SAND, some gravel, some silt.
SAND, little gravel, trace silt.
Sandy SILT, trace gravel.
2.8
11.9
Sandy SILT, trace gravel.
13.7
6.2
4.8
HB-SEMI-101/S1
HB-SEMI-104/S5
HB-SEMI-101/S2
HB-SEMI-102/S3
HB-SEMI-103/S4
0.5-3.2
3.8-5.0
3.2-5.0
3.5-5.0
0.63-5.0
Depth, ft
Boring/Sample No.
Description
W, %
LL
PL
PI
� ��� � ��� � ��� � ��� � ��� � ���
SHEET 1
Sebec,M
ilo
018289.00
WHITE, TERRY A 11/26/2012
WIN
Town
Reported by/Date
9.0 RT
9.0 RT
9.0 RT
9.0 RT
9.0 RT
Offset, ft
16+00
50+15
16+00
20+00
30+00
Station

3"
2"1-1/2"
1"
3/4"
1/2"
3/8"
1/4"
#4
#8
#10
#16
#20
#40
#60
#100
#200
0.05
0.03
0.010
0.005
0.001
76.2
50.8
38.1
25.4
19.05
12.7
9.53
6.35
4.75
2.36
2.00
1.18
0.85
0.426
0.25
0.15
0.075
0.05
0.03
0.005
GRAVEL
SAND
SILT
SIEVE ANALYSIS
US Standard Sieve Numbers
HYDROMETER ANALYSIS
Grain Diameter, mm
State of Maine Department of Transportation
GRAIN SIZE DISTRIBUTIO
N CURVE
100
10
10.1
0.01
0.001
Grain Diameter, mm
0
10
20
30
40
50
60
70
80
90
100
Percent Finer by Weight
100
90
80
70
60
50
40
30
20
10
0
Percent Retained by Weight
CLAY
SHEET NO.
UNIFIED CLASSIFICATION
SAND, some silt, little gravel.
Sandy SILT, little gravel.
Sandy SILT, some gravel.
Sandy SILT, little gravel.
4.6
9.5
SAND, some gravel, little silt.
15.1
7.1
19.8
HB-SEMI-106/S6
HB-SEMI-111/S10
HB-SEMI-106/S7
HB-SEMI-108/S8
HB-SEMI-109/S9
5.4
SAND, some gravel, some silt.
HB-SEMI-113/S11
1.0-3.0
3.0-5.0
3.0-5.0
0.75-5.0
4.0-5.0
1.0-4.0
Depth, ft
Boring/Sample No.
Description
W, %
LL
PL
PI
� ��� � ��� � ��� � ��� � ��� � ���
SHEET 2
Sebec,M
ilo
018289.00
WHITE, TERRY A 11/26/2012
WIN
Town
Reported by/Date
9.0 RT
9.0 RT
9.0 RT
9.
9.0 RT
9.0 LT
Offset, ft
76+00
210+00
76+00
105+00
130+00
130+00
Station

Offset Pavement Depth Unbound PC- Saved Comments / Date
(Feet) (Inches) Pavement Number Core 8/22/2012
15.0 Rt. 2.5 1
9.0 Rt. 11.0 2
1.0 Rt. 9.5 3
15.0 Rt. 2.0 4
9.0 Rt. 8.0 5
1.0 Rt. 12.0 6
15.0 Rt. 2.5 7
9.0 Rt. 7.5 8
1.0 Rt. 7.5 9
9.0 Lt. 7.5 10
18.0 Lt. 9.0 11
1.0 Lt. 7.0 12
9.0 Lt. 7.0 13
15.0 Lt. 2.0 14
15.0 Rt. 11.5 15
9.0 Rt. 8.0 16
1.0 Rt. 7.5 17
170+00
210+00
210+00
210+00
130+00
130+00
130+00
130+00
170+00
170+00
Town(s):Station
50+00
90+00
(Feet)
50+00
50+00
State of Maine - Department of Transportation
Pavement Core Summary Sheet
Sebec Work Number: 18289.00
130+00
90+00
90+00
Logged By: C. Giles 1 of 1 2" Thinwall CoreLogged By: C. Giles 1 of 1 2" Thinwall Core

Ma
in
e
DO
T,
M
at
er
ia
ls
T
es
ti
ng
&
E
xp
lo
ra
ti
on
,
21
9
Ho
ga
n
Ro
ad
,
Ba
ng
or
,
Ma
in
e
04
40
1
Gro
un
d P
en
etr
ati
ng
Ra
dar
(GP
R)
Add
itio
na
l C
om
me
nts
Esti
mate
d P
avem
en
t T
hic
kn
ess
Ana
lysis
Dis
tan
ce
, ft
.
10
0
Ove
rall
Ave
rage T
hic
kne
ss,
in.
10
.2
Ove
rall
Min
imum
Thic
kn
ess, in
.
7.6
Ove
rall
Maxim
um
Th
ickne
ss,
in.
13
La
ne
Teste
d
MA
INL
INE
01
82
89
.00
- S
eb
ec
,Mil
o
Exp
lan
ati
on
of
Gro
un
d P
en
etr
ati
ng
(G
PR
) D
ata
Co
llecti
on
an
d A
na
lysis
:
GP
R d
ata
wa
s c
olle
cte
d in t
he
left
and
rig
ht w
he
el path
of
both
la
nes.
Data
was c
olle
cte
d a
t 1 f
oo
t in
terv
als
alo
ng t
he
en
tire
sectio
n. P
ave
me
nt th
ickn
ess e
stim
ate
s
were
de
velo
pe
d u
sin
g G
eo
physic
al S
urv
ey S
yste
ms In
c. (G
SS
I) R
AD
AN
GP
R D
ata
Pro
cessin
g S
oft
ware
. W
here
availa
ble
, pavem
ent
thic
kness f
rom
Geo
tech
nic
al
bo
rings a
nd/o
r p
ave
me
nt co
res c
olle
cte
d b
y M
ain
eD
OT
pers
onne
l w
ere
use
d in
de
ve
lop
ing
the
estim
ate
d G
PR
pa
vem
en
t th
ickne
sse
s.
GP
R p
av
em
en
t th
ick
nes
s a
vera
ges a
re t
o b
e c
on
sid
ere
d f
or
esti
mati
ng
pu
rpo
ses o
nly
. A
ctu
al
pa
ve
me
nt
thic
kn
ess
may v
ary
.
Test D
ate
6/7
/2012
Rep
ort
ed D
ate
2/2
6/2
01
3
Pro
ject
Ma
na
ger
DA
VIS
, S
HA
WN
R
Rep
ort
ed B
y
VO
SE
, R
YA
N K
Sta
tio
n L
imits,
fee
tA
ve
rag
eD
ep
th,
in.
Sta
tio
n L
imits,
fee
tA
ve
rag
eD
ep
th,
in.
Sta
tio
n L
imits,
fee
tA
ve
rag
eD
ep
th,
in.
Sta
tio
n L
imits,
fee
tA
ve
rag
eD
ep
th,
in.
Hig
hli
gh
ted
in
ch
es
in
dic
ate
eit
her
the O
ve
rall M
inim
um
or
Ov
era
ll M
axim
um
th
ick
nes
s.
*Dep
th a
t th
is l
oc
ati
on
may b
e i
mp
ac
ted
by a
bri
dg
e d
eck o
r o
ther
pav
em
en
t a
no
ma
ly.
7.6
10
01
31
0+
00
8.4
11
+0
07.6
100
13
11
+0
09
.11
2+
00
7.6
10
01
31
2+
00
9.1
13
+0
07.6
100
13
13
+0
09
.11
4+
00
7.6
10
01
31
4+
00
8.8
15
+0
07.6
100
13
15
+0
08
.81
6+
00
7.6
10
01
31
6+
00
9.1
17
+0
07.6
100
13
17
+0
08
.91
8+
00
7.6
10
01
31
8+
00
8.9
19
+0
07.6
100
13
19
+0
08
.92
0+
00
7.6
10
01
32
0+
00
9.0
21
+0
07.6
100
13
21
+0
09
.72
2+
00
7.6
10
01
32
2+
00
10
.02
3+
00
7.6
10
01
32
3+
00
10
.12
4+
00
7.6
10
01
32
4+
00
9.4
25
+0
07
.61
00
13
25
+0
09
.52
6+
00
7.6
10
01
32
6+
00
9.3
27
+0
07
.61
00
13
27
+0
09
.42
8+
00
7.6
10
01
32
8+
00
9.2
29
+0
07
.61
00
13
29
+0
09
.53
0+
00
7.6
10
01
33
0+
00
9.8
31
+0
07.6
100
13
31
+0
09
.83
2+
00
7.6
10
01
33
2+
00
9.5
33
+0
07.6
100
13
33
+0
08
.93
4+
00
7.6
10
01
33
4+
00
8.8
35
+0
07.6
100
13
35
+0
08
.83
6+
00
7.6
10
01
33
6+
00
9.4
37
+0
07.6
100
13
37
+0
09
.63
8+
00
7.6
10
01
33
8+
00
9.3
39
+0
07.6
100
13
39
+0
09
.44
0+
00
7.6
10
01
34
0+
00
10
.14
1+
00
7.6
100
13
41
+0
09
.84
2+
00
7.6
10
01
34
2+
00
9.5
43
+0
07.6
100
13
43
+0
09
.14
4+
00
7.6
10
01
34
4+
00
9.3
45
+0
07.6
100
13
45
+0
09
.54
6+
00
7.6
10
01
34
6+
00
9.5
47
+0
07.6
100
13
47
+0
09
.84
8+
00
7.6
10
01
34
8+
00
10
.74
9+
00
7.6
100
13
49
+0
01
0.5
50
+0
07
.61
00
13
50
+0
01
1.3
51
+0
07
.61
00
13
51
+0
01
0.9
52
+0
07
.61
00
13
52
+0
01
0.5
53
+0
07
.61
00
13
53
+0
01
0.7
54
+0
07
.61
00
13
54
+0
01
0.3
55
+0
07
.61
00
13
55
+0
01
0.4
56
+0
07
.61
00
13
56
+0
01
0.4
57
+0
07
.61
00
13
57
+0
01
0.5
58
+0
07.6
10
01
35
8+
00
10
.85
9+
00
7.6
100
13
59
+0
01
1.5
60
+0
07.6
10
01
36
0+
00
12
.16
1+
00
7.6
100
13
61
+0
01
2.3
62
+0
0

Sta
tio
n L
imits,
fee
tA
ve
rag
eD
ep
th,
in.
Sta
tio
n L
imits,
fee
tA
ve
rag
eD
ep
th,
in.
Sta
tio
n L
imits,
fee
tA
ve
rag
eD
ep
th,
in.
Sta
tio
n L
imits,
fee
tA
ve
rag
eD
ep
th,
in.
Hig
hli
gh
ted
in
ch
es
in
dic
ate
eit
her
the O
ve
rall M
inim
um
or
Ov
era
ll M
axim
um
th
ick
nes
s.
*Dep
th a
t th
is l
oc
ati
on
may b
e i
mp
ac
ted
by a
bri
dg
e d
eck o
r o
ther
pav
em
en
t a
no
ma
ly.
7.6
10
01
36
2+
00
11
.76
3+
00
7.6
100
13
63
+0
01
1.2
64
+0
07.6
10
01
36
4+
00
10
.66
5+
00
7.6
100
13
65
+0
01
0.3
66
+0
07.6
10
01
36
6+
00
10
.36
7+
00
7.6
100
13
67
+0
01
0.3
68
+0
07.6
10
01
36
8+
00
10
.46
9+
00
7.6
100
13
69
+0
01
0.4
70
+0
07.6
10
01
37
0+
00
12
.07
1+
00
7.6
100
13
71
+0
01
2.0
72
+0
07.6
10
01
37
2+
00
10
.87
3+
00
7.6
100
13
73
+0
01
1.1
74
+0
07.6
10
01
37
4+
00
10
.77
5+
00
7.6
100
13
75
+0
01
1.2
76
+0
07.6
10
01
37
6+
00
11
.27
7+
00
7.6
100
13
77
+0
01
1.7
78
+0
07
.61
00
13
78
+0
01
1.4
79
+0
07
.61
00
13
79
+0
09
.98
0+
00
7.6
10
01
38
0+
00
10
.08
1+
00
7.6
10
01
38
1+
00
10
.38
2+
00
7.6
10
01
38
2+
00
10
.28
3+
00
7.6
10
01
38
3+
00
10
.18
4+
00
7.6
10
01
38
4+
00
11
.38
5+
00
7.6
10
01
38
5+
00
12
.58
6+
00
7.6
10
01
38
6+
00
12
.68
7+
00
7.6
10
01
38
7+
00
12
.28
8+
00
7.6
10
01
38
8+
00
11
.68
9+
00
7.6
10
01
38
9+
00
11
.09
0+
00
7.6
10
01
39
0+
00
12
.29
1+
00
7.6
100
13
91
+0
01
1.9
92
+0
07.6
10
01
39
2+
00
11
.49
3+
00
7.6
100
13
93
+0
01
0.7
94
+0
07.6
10
01
39
4+
00
10
.79
5+
00
7.6
100
13
95
+0
01
0.4
96
+0
07.6
10
01
39
6+
00
10
.39
7+
00
7.6
100
13
97
+0
01
0.2
98
+0
07.6
10
01
39
8+
00
10
.79
9+
00
7.6
100
13
99
+0
01
1.6
10
0+
00
7.6
10
01
31
00
+0
01
1.7
10
1+
00
7.6
100
13
10
1+
00
10
.41
02
+0
07.6
10
01
31
02
+0
01
0.0
10
3+
00
7.6
100
13
10
3+
00
9.6
10
4+
00
7.6
10
01
31
04
+0
01
0.3
10
5+
00
7.6
100
13
10
5+
00
10
.51
06
+0
07
.61
00
13
10
6+
00
10
.01
07+
00
7.6
10
01
31
07+
00
9.9
10
8+
00
7.6
10
01
31
08+
00
10
.21
09+
00
7.6
10
01
31
09+
00
10
.41
10+
00
7.6
10
01
31
10+
00
10
.11
11+
00
7.6
10
01
31
11+
00
10
.31
12+
00
7.6
10
01
31
12+
00
9.8
11
3+
00
7.6
10
01
31
13+
00
10
.01
14+
00
7.6
10
01
31
14+
00
10
.01
15+
00
7.6
10
01
31
15+
00
9.9
11
6+
00
7.6
10
01
31
16+
00
10
.21
17+
00
7.6
10
01
31
17+
00
10
.71
18+
00
7.6
10
01
31
18+
00
10
.21
19+
00
7.6
100
13
11
9+
00
10
.61
20+
00
7.6
10
01
31
20+
00
11
.11
21+
00
7.6
100
13
12
1+
00
11
.11
22+
00
7.6
10
01
31
22+
00
10
.81
23+
00
7.6
100
13
12
3+
00
10
.01
24+
00
7.6
10
01
31
24+
00
10
.61
25+
00
7.6
100
13
12
5+
00
11
.31
26+
00
7.6
10
01
31
26
+0
01
2.4
12
7+
00
7.6
100
13
12
7+
00
12
.41
28
+0
07.6
10
01
31
28
+0
01
2.3
12
9+
00
7.6
100
13
12
9+
00
11
.41
30
+0
07.6
10
01
31
30
+0
01
1.8
13
1+
00
7.6
100
13
13
1+
00
11
.81
32
+0
07.6
10
01
31
32
+0
01
1.4
13
3+
00
7.6
100
13
13
3+
00
11
.41
34
+0
07.6
10
01
31
34
+0
01
1.8
13
5+
00
7.6
100
13
13
5+
00
11
.91
36
+0
07.6
10
01
31
36
+0
01
1.9
13
7+
00
7.6
100
13
13
7+
00
12
.31
38
+0
07
.61
00
13
13
8+
00
12
.61
39+
00
7.6
10
01
31
39+
00
13
.01
40+
00
7.6
10
01
31
40+
00
12
.41
41+
00
7.6
10
01
31
41+
00
10
.41
42+
00
7.6
10
01
31
42+
00
9.2
14
3+
00
7.6
10
01
31
43+
00
9.1
14
4+
00
7.6
10
01
31
44+
00
9.6
14
5+
00
7.6
10
01
31
45+
00
9.6
14
6+
00
7.6
10
01
31
46+
00
9.6
14
7+
00
7.6
100
13
14
7+
00
10
.31
48+
00
7.6
10
01
31
48+
00
10
.61
49+
00
7.6
100
13
14
9+
00
11
.01
50+
00
7.6
10
01
31
50+
00
10
.71
51+
00
7.6
100
13
15
1+
00
10
.71
52+
00
7.6
10
01
31
52+
00
10
.81
53+
00
7.6
100
13
15
3+
00
11
.21
54+
00
7.6
10
01
31
54
+0
01
0.3
15
5+
00
7.6
100
13
15
5+
00
9.6
15
6+
00
7.6
10
01
31
56
+0
01
0.3
15
7+
00
7.6
100
13
15
7+
00
10
.31
58
+0
07.6
10
01
31
58
+0
09
.51
59
+0
07.6
100
13
15
9+
00
9.4
16
0+
00
7.6
10
01
31
60
+0
01
0.5
16
1+
00
7.6
100
13
16
1+
00
11
.41
62
+0
07.6
10
01
31
62
+0
01
1.7
16
3+
00
7.6
100
13
16
3+
00
10
.91
64
+0
07.6
10
01
31
64
+0
01
0.3
16
5+
00
7.6
100
13
16
5+
00
9.5
16
6+
00
7.6
10
01
31
66+
00
8.8
16
7+
00
7.6
10
01
31
67+
00
8.7
16
8+
00
7.6
10
01
31
68+
00
8.8
16
9+
00
7.6
10
01
31
69+
00
9.2
17
0+
00
7.6
10
01
31
70+
00
8.8
17
1+
00
7.6
10
01
31
71+
00
8.9
17
2+
00
7.6
10
01
31
72+
00
8.9
17
3+
00
7.6
10
01
31
73+
00
9.0
17
4+
00
7.6
10
01
31
74+
00
9.6
17
5+
00
7.6
100
13
17
5+
00
9.9
17
6+
00
7.6
10
01
31
76+
00
10
.41
77+
00
7.6
100
13
17
7+
00
10
.61
78+
00
7.6
10
01
31
78+
00
10
.31
79+
00
7.6
100
13
17
9+
00
10
.71
80+
00
7.6
10
01
31
80+
00
11
.01
81+
00
7.6
100
13
18
1+
00
11
.01
82+
00
7.6
10
01
31
82
+0
09
.81
83
+0
07.6
100
13
18
3+
00
9.7
18
4+
00
7.6
10
01
31
84
+0
09
.51
85
+0
07.6
100
13
18
5+
00
9.5
18
6+
00
7.6
10
01
31
86
+0
09
.81
87
+0
07.6
100
13
18
7+
00
10
.31
88
+0
07.6
10
01
31
88
+0
01
0.8
18
9+
00
7.6
100
13
18
9+
00
10
.51
90
+0
07.6
10
01
31
90
+0
01
0.5
19
1+
00
7.6
100
13
19
1+
00
10
.91
92
+0
07.6
10
01
31
92
+0
01
1.1
19
3+
00
7.6
100
13
19
3+
00
11
.71
94
+0
07
.61
00
13
19
4+
00
11
.61
95+
00
7.6
10
01
31
95+
00
11
.31
96+
00
7.6
10
01
31
96+
00
11
.21
97+
00
7.6
10
01
31
97+
00
11
.11
98+
00
7.6
10
01
31
98+
00
10
.51
99+
00
7.6
10
01
31
99+
00
10
.32
00+
00
7.6
10
01
32
00+
00
9.6
20
1+
00
7.6
10
01
32
01+
00
9.1
20
2+
00
7.6
10
01
32
02+
00
9.0
20
3+
00
7.6
100
13
20
3+
00
9.5
20
4+
00
7.6
10
01
32
04+
00
10
.52
05+
00
7.6
100
13
20
5+
00
10
.62
06+
00
7.6
10
01
32
06+
00
10
.52
07+
00
7.6
100
13
20
7+
00
10
.22
08+
00
7.6
10
01
32
08+
00
10
.12
09+
00
7.6
100
13
20
9+
00
10
.02
10+
00
7.6
10
01
32
10
+0
09
.92
11
+0
07.6
100
13
21
1+
00
10
.12
12
+0
07.6
10
01
32
12
+0
01
0.4
21
3+
00
7.6
100
13
21
3+
00
10
.32
14
+0
07.6
10
01
32
14
+0
01
0.5
21
5+
00
7.6
100
13
21
5+
00
10
.42
16
+0
07.6
10
01
32
16
+0
09
.92
17
+0
07.6
100
13
21
7+
00
10
.12
18
+0
07.6
10
01
32
18
+0
01
0.5
21
9+
00
7.6
100
13
21
9+
00
9.7
22
0+
00
7.6
10
01
32
20
+0
09
.82
21
+0
07.6
100
13
22
1+
00
10
.22
22
+0
07
.61
00
13
22
2+
00
10
.62
23+
00
7.6
10
01
32
23+
00
10
.12
24+
00
7.6
10
01
32
24+
00
9.3
22
5+
00
7.6
10
01
32
25+
00
9.0
22
6+
00
7.6
10
01
32
26+
00
8.9
22
7+
00
7.6
10
01
32
27+
00
9.3
22
8+
00
7.6
10
01
32
28+
00
9.2
22
9+
00
7.6
10
01
32
29+
00
8.6
23
0+
00
7.6
10
01
32
30+
00
8.9
23
1+
00
7.6
100
13
23
1+
00
10
.32
32+
00
7.6
10
01
32
32+
00
10
.32
33+
00
7.6
100
13
23
3+
00
9.5
23
4+
00
7.6
10
01
32
34+
00
9.4
23
5+
00
7.6
100
13
23
5+
00
8.9
23
6+
00
7.6
10
01
32
36+
00
9.8
23
7+
00
7.6
100
13
23
7+
00
9.9
23
8+
00

Sta
tio
n L
imits,
fee
tA
ve
rag
eD
ep
th,
in.
Sta
tio
n L
imits,
fee
tA
ve
rag
eD
ep
th,
in.
Sta
tio
n L
imits,
fee
tA
ve
rag
eD
ep
th,
in.
Sta
tio
n L
imits,
fee
tA
ve
rag
eD
ep
th,
in.
Hig
hli
gh
ted
in
ch
es
in
dic
ate
eit
her
the O
ve
rall M
inim
um
or
Ov
era
ll M
axim
um
th
ick
nes
s.
*Dep
th a
t th
is l
oc
ati
on
may b
e i
mp
ac
ted
by a
bri
dg
e d
eck o
r o
ther
pav
em
en
t a
no
ma
ly.
7.6
10
01
32
38+
00
9.8
23
9+
00
7.6
100
13
23
9+
00
8.8
24
0+
00
7.6
10
01
32
40+
00
9.0
24
1+
00
7.6
100
13
24
1+
00
8.5
24
2+
00
7.6
10
01
32
42+
00
8.8
24
3+
00
7.6
100
13
24
3+
00
9.1
24
4+
00
7.6
10
01
32
44+
00
8.8
24
5+
00
7.6
100
13
24
5+
00
8.9
24
6+
00
7.6
10
01
32
46
+0
08
.82
47
+0
07.6
100
13
24
7+
00
8.7
24
8+
00
7.6
10
01
32
48
+0
07
.92
49
+0
07.6
100
13
24
9+
00
7.6
25
0+
00
7.6
10
01
32
50
+0
07
.92
51
+0
9

Ma
in
e
DO
T,
M
at
er
ia
ls
T
es
ti
ng
&
E
xp
lo
ra
ti
on
,
21
9
Ho
ga
n
Ro
ad
,
Ba
ng
or
,
Ma
in
e
04
40
1
Pa
ve
me
nt
Co
res
01
82
89
.00
- S
eb
ec
,Mil
o

Ma
in
e
DO
T,
M
at
er
ia
ls
T
es
ti
ng
&
E
xp
lo
ra
ti
on
,
21
9
Ho
ga
n
Ro
ad
,
Ba
ng
or
,
Ma
in
e
04
40
1
Pavem
en
t C
ore
s
01
82
89
.00
- S
eb
ec
,Mil
o
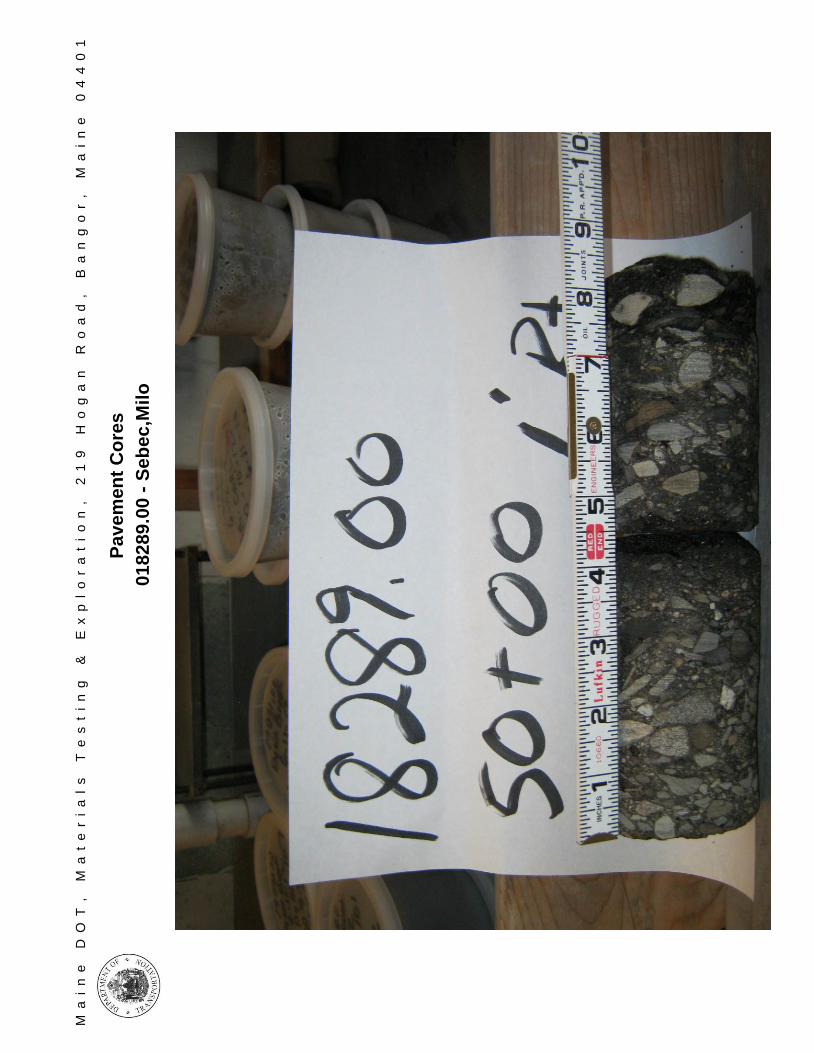
Ma
in
e
DO
T,
M
at
er
ia
ls
T
es
ti
ng
&
E
xp
lo
ra
ti
on
,
21
9
Ho
ga
n
Ro
ad
,
Ba
ng
or
,
Ma
in
e
04
40
1
Pavem
en
t C
ore
s
01
82
89
.00
- S
eb
ec
,Mil
o

Ma
in
e
DO
T,
M
at
er
ia
ls
T
es
ti
ng
&
E
xp
lo
ra
ti
on
,
21
9
Ho
ga
n
Ro
ad
,
Ba
ng
or
,
Ma
in
e
04
40
1
Pavem
en
t C
ore
s
01
82
89
.00
- S
eb
ec
,Mil
o

Ma
in
e
DO
T,
M
at
er
ia
ls
T
es
ti
ng
&
E
xp
lo
ra
ti
on
,
21
9
Ho
ga
n
Ro
ad
,
Ba
ng
or
,
Ma
in
e
04
40
1
Pavem
en
t C
ore
s
01
82
89
.00
- S
eb
ec
,Mil
o

Ma
in
e
DO
T,
M
at
er
ia
ls
T
es
ti
ng
&
E
xp
lo
ra
ti
on
,
21
9
Ho
ga
n
Ro
ad
,
Ba
ng
or
,
Ma
in
e
04
40
1
Pavem
en
t C
ore
s
01
82
89
.00
- S
eb
ec
,Mil
o

Ma
in
e
DO
T,
M
at
er
ia
ls
T
es
ti
ng
&
E
xp
lo
ra
ti
on
,
21
9
Ho
ga
n
Ro
ad
,
Ba
ng
or
,
Ma
in
e
04
40
1
Pavem
en
t C
ore
s
01
82
89
.00
- S
eb
ec
,Mil
o

Ma
in
e
DO
T,
M
at
er
ia
ls
T
es
ti
ng
&
E
xp
lo
ra
ti
on
,
21
9
Ho
ga
n
Ro
ad
,
Ba
ng
or
,
Ma
in
e
04
40
1
Pavem
en
t C
ore
s
01
82
89
.00
- S
eb
ec
,Mil
o

Ma
in
e
DO
T,
M
at
er
ia
ls
T
es
ti
ng
&
E
xp
lo
ra
ti
on
,
21
9
Ho
ga
n
Ro
ad
,
Ba
ng
or
,
Ma
in
e
04
40
1
Pavem
en
t C
ore
s
01
82
89
.00
- S
eb
ec
,Mil
o

Ma
in
e
DO
T,
M
at
er
ia
ls
T
es
ti
ng
&
E
xp
lo
ra
ti
on
,
21
9
Ho
ga
n
Ro
ad
,
Ba
ng
or
,
Ma
in
e
04
40
1
Pavem
en
t C
ore
s
01
82
89
.00
- S
eb
ec
,Mil
o

Ma
in
e
DO
T,
M
at
er
ia
ls
T
es
ti
ng
&
E
xp
lo
ra
ti
on
,
21
9
Ho
ga
n
Ro
ad
,
Ba
ng
or
,
Ma
in
e
04
40
1
Pavem
en
t C
ore
s
01
82
89
.00
- S
eb
ec
,Mil
o
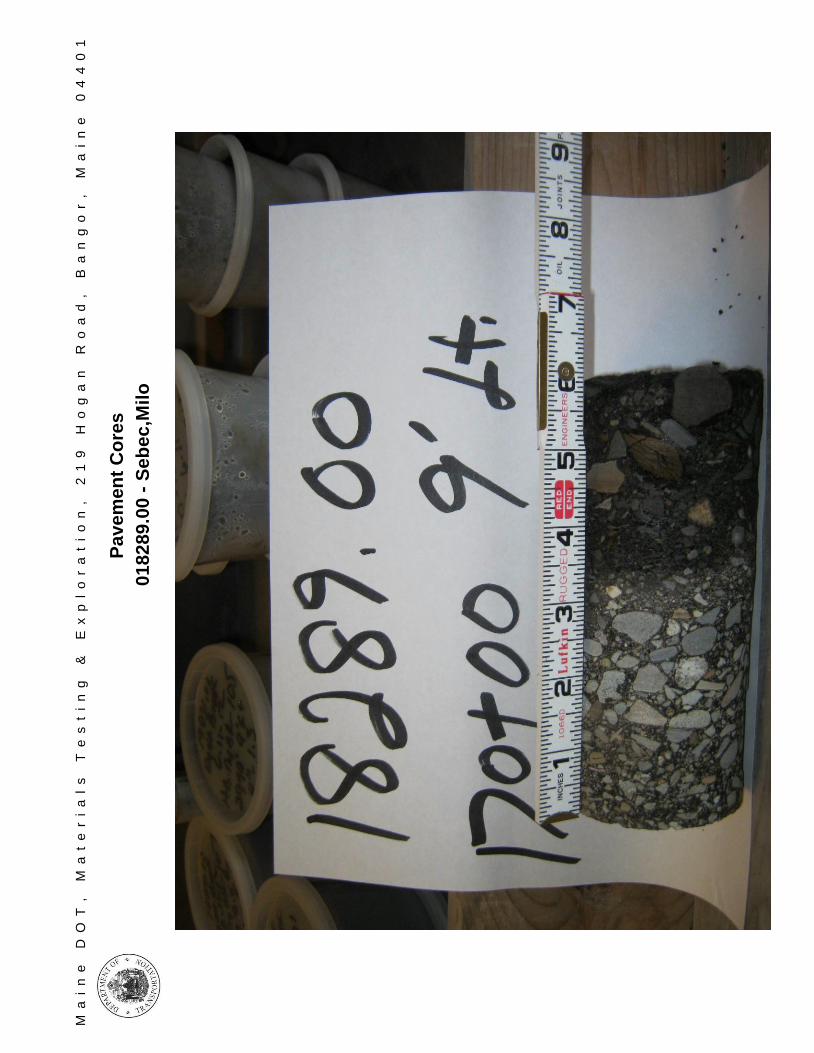
Ma
in
e
DO
T,
M
at
er
ia
ls
T
es
ti
ng
&
E
xp
lo
ra
ti
on
,
21
9
Ho
ga
n
Ro
ad
,
Ba
ng
or
,
Ma
in
e
04
40
1
Pavem
en
t C
ore
s
01
82
89
.00
- S
eb
ec
,Mil
o
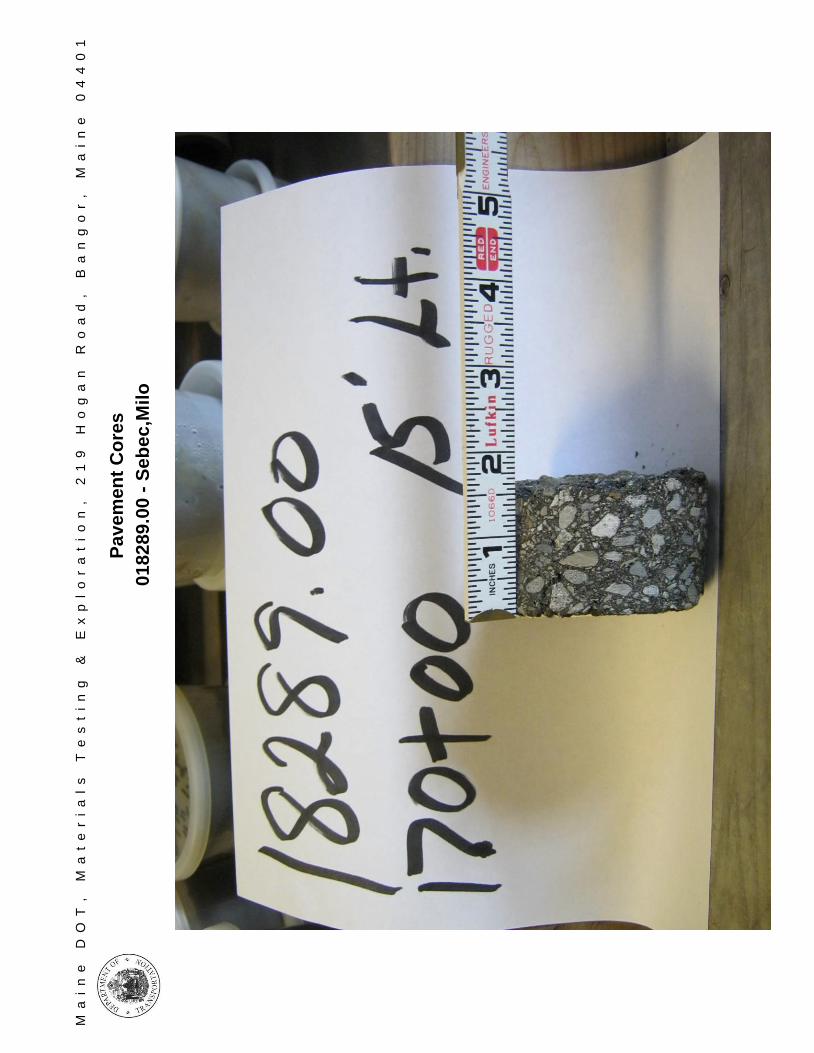
Ma
in
e
DO
T,
M
at
er
ia
ls
T
es
ti
ng
&
E
xp
lo
ra
ti
on
,
21
9
Ho
ga
n
Ro
ad
,
Ba
ng
or
,
Ma
in
e
04
40
1
Pavem
en
t C
ore
s
01
82
89
.00
- S
eb
ec
,Mil
o

Ma
in
e
DO
T,
M
at
er
ia
ls
T
es
ti
ng
&
E
xp
lo
ra
ti
on
,
21
9
Ho
ga
n
Ro
ad
,
Ba
ng
or
,
Ma
in
e
04
40
1
Pavem
en
t C
ore
s
01
82
89
.00
- S
eb
ec
,Mil
o

Ma
in
e
DO
T,
M
at
er
ia
ls
T
es
ti
ng
&
E
xp
lo
ra
ti
on
,
21
9
Ho
ga
n
Ro
ad
,
Ba
ng
or
,
Ma
in
e
04
40
1
Pavem
en
t C
ore
s
01
82
89
.00
- S
eb
ec
,Mil
o

Ma
in
e
DO
T,
M
at
er
ia
ls
T
es
ti
ng
&
E
xp
lo
ra
ti
on
,
21
9
Ho
ga
n
Ro
ad
,
Ba
ng
or
,
Ma
in
e
04
40
1
Pavem
en
t C
ore
s
01
82
89
.00
- S
eb
ec
,Mil
o

Ma
in
e
DO
T,
M
at
er
ia
ls
T
es
ti
ng
&
E
xp
lo
ra
ti
on
,
21
9
Ho
ga
n
Ro
ad
,
Ba
ng
or
,
Ma
in
e
04
40
1
Gro
un
d P
en
etr
ati
ng
Ra
dar
(GP
R)
Add
itio
na
l C
om
me
nts
Esti
mate
d P
avem
en
t T
hic
kn
ess
Ana
lysis
Dis
tan
ce
, ft
.
10
0
Ove
rall
Ave
rage T
hic
kne
ss,
in.
9.1
Ove
rall
Min
imum
Thic
kn
ess, in
.
7.5
Ove
rall
Maxim
um
Th
ickne
ss,
in.
11
.3
La
ne
Teste
d
TR
UC
K L
AN
E
01
82
89
.00
- S
eb
ec
,Mil
o
Exp
lan
ati
on
of
Gro
un
d P
en
etr
ati
ng
(G
PR
) D
ata
Co
llecti
on
an
d A
na
lysis
:
GP
R d
ata
wa
s c
olle
cte
d in t
he
left
and
rig
ht w
he
el path
of
the lan
e. D
ata
wa
s c
olle
cte
d a
t 1 f
oo
t in
terv
als
alo
ng t
he e
ntire
se
ction
. P
ave
men
t th
ickne
ss e
stim
ate
s
were
de
velo
pe
d u
sin
g G
eo
physic
al S
urv
ey S
yste
ms In
c. (G
SS
I) R
AD
AN
GP
R D
ata
Pro
cessin
g S
oft
ware
. W
here
availa
ble
, pavem
ent
thic
kness f
rom
Geo
tech
nic
al
bo
rings a
nd/o
r p
ave
me
nt co
res c
olle
cte
d b
y M
ain
eD
OT
pers
onne
l w
ere
use
d in
de
ve
lop
ing
the
estim
ate
d G
PR
pa
vem
en
t th
ickne
sse
s.
GP
R p
av
em
en
t th
ick
nes
s a
vera
ges a
re t
o b
e c
on
sid
ere
d f
or
esti
mati
ng
pu
rpo
ses o
nly
. A
ctu
al
pa
ve
me
nt
thic
kn
ess
may v
ary
.
Test D
ate
6/7
/2012
Rep
ort
ed D
ate
Pro
ject
Ma
na
ger
DA
VIS
, S
HA
WN
R
Rep
ort
ed B
y
VO
SE
, R
YA
N K
Sta
tio
n L
imits,
fee
tA
ve
rag
eD
ep
th,
in.
Sta
tio
n L
imits,
fee
tA
ve
rag
eD
ep
th,
in.
Sta
tio
n L
imits,
fee
tA
ve
rag
eD
ep
th,
in.
Sta
tio
n L
imits,
fee
tA
ve
rag
eD
ep
th,
in.
Hig
hli
gh
ted
in
ch
es
in
dic
ate
eit
her
the O
ve
rall M
inim
um
or
Ov
era
ll M
axim
um
th
ick
nes
s.
*Dep
th a
t th
is l
oc
ati
on
may b
e i
mp
ac
ted
by a
bri
dg
e d
eck o
r o
ther
pav
em
en
t a
no
ma
ly.
7.5
10
011
.31
28+
00
7.8
12
9+
00
7.5
100
11.3
12
9+
00
8.9
13
0+
00
7.5
10
011
.31
30+
00
7.5
13
1+
00
7.5
100
11.3
13
1+
00
9.1
13
2+
00
7.5
10
011
.31
32
+0
08
.61
33
+0
07.5
100
11.3
13
3+
00
8.0
13
4+
00
7.5
10
011
.31
34
+0
08
.81
35
+0
07.5
100
11.3
13
5+
00
9.3
13
6+
00
7.5
10
011
.31
36
+0
01
1.3
13
7+
00
7.5
100
11.3
13
7+
00
9.4
13
8+
00
7.5
10
011
.31
38
+0
09
.81
39
+0
07.5
100
11.3
13
9+
00
9.5
14
0+
00
7.5
10
01
1.3
14
0+
00
9.4
14
1+
00
7.5
10
01
1.3
14
1+
00
11
.01
42+
00
7.5
10
01
1.3
14
2+
00
9.7
14
3+
00
7.5
10
01
1.3
14
3+
00
7.9
14
3+
75

Ma
in
e
DO
T,
M
at
er
ia
ls
T
es
ti
ng
&
E
xp
lo
ra
ti
on
,
21
9
Ho
ga
n
Ro
ad
,
Ba
ng
or
,
Ma
in
e
04
40
1
Pa
ve
me
nt
Co
res
01
82
89
.00
- S
eb
ec
,Mil
o

0
5
10
15
20
25
S1
S2
0.50 - 3.20
3.20 - 5.00
SSA -0.50
-3.20
-5.00
6" PAVEMENT.0.50
Brown, dry, fine to medium SAND, some gravel, little silt.
3.20Grey-brown, fine to medium SAND, little gravel, little silt.
5.00Bottom of Exploration at 5.00 feet below ground surface.
NO REFUSAL
G#267097
A-1-b, SM
WC=2.8%
G#267098
A-4, ML
WC=13.7%
Maine Department of Transportation Project: A 4.53 mile portion of Route 6/16 Boring No.: HB-SEMI-101
Soil/Rock Exploration LogLocation: Sebec-Milo, Maine
US CUSTOMARY UNITS WIN: 18289.00
Driller: MaineDOT Elevation (ft.) Auger ID/OD: 5" Dia.
Operator: Giles/Daggett Datum: NAVD88 Sampler: Off Flights
Logged By: B. Enos Rig Type: CME 45C Hammer Wt./Fall: N/A
Date Start/Finish: 10/22/12-10/22/12 Drilling Method: Solid Stem Auger Core Barrel: N/A
Boring Location: 16+00, 9.0 ft Rt. Casing ID/OD: N/A Water Level*: None Observed
Definitions: Definitions: Definitions:
D = Split Spoon Sample Su = Insitu Field Vane Shear Strength (psf) WC = water content, percent
MD = Unsuccessful Split Spoon Sample attempt Tv = Pocket Torvane Shear Strength (psf) LL = Liquid Limit
U = Thin Wall Tube Sample qp = Unconfined Compressive Strength (ksf) PL = Plastic Limit
R = Rock Core Sample Su(lab) = Lab Vane Shear Strength (psf) PI = Plasticity Index
V = Insitu Vane Shear Test WOH = weight of 140lb. hammer G = Grain Size AnalysisSSA = Solid Stem Auger WOR = weight of rods WOC = weight of casing C = Consolidation Test
Remarks:
Offsets are from the Existing Roadway CL.
Stratification lines represent approximate boundaries between soil types; transitions may be gradual.
* Water level readings have been made at times and under conditions stated. Groundwater fluctuations may occur due to conditions otherthan those present at the time measurements were made. Boring No.: HB-SEMI-101
Depth
(ft
.)
Sam
ple
No.
Sample Information
Pen./
Rec.
(in.)
Sam
ple
Depth
(ft.
)
Blo
ws (
/6 in.)
Shear
Str
ength
(psf)
or
RQ
D (
%)
N-v
alu
e
Casin
g
Blo
ws
Ele
vation
(ft.
)
Gra
phic
Log
Visual Description and Remarks
LaboratoryTesting Results/
AASHTO and
Unified Class.
Page 1 of 1

0
5
10
15
20
25
S3 3.50 - 5.00
SSA -0.54
-3.50
-5.00
6½" PAVEMENT.0.54
Brown, dry, fine to medium SAND, some gravel, little silt. ≅S1
3.50Black, fine to medium SAND, little gravel, little silt. (Petroleum Odor)
5.00Bottom of Exploration at 5.00 feet below ground surface.
NO REFUSAL
G#267099
A-1-b, SW-SM
WC=6.2%
Maine Department of Transportation Project: A 4.53 mile portion of Route 6/16 Boring No.: HB-SEMI-102
Soil/Rock Exploration LogLocation: Sebec-Milo, Maine
US CUSTOMARY UNITS WIN: 18289.00
Driller: MaineDOT Elevation (ft.) Auger ID/OD: 5" Dia.
Operator: Giles/Daggett Datum: NAVD88 Sampler: Off Flights
Logged By: B. Enos Rig Type: CME 45C Hammer Wt./Fall: N/A
Date Start/Finish: 10/22/12-10/22/12 Drilling Method: Solid Stem Auger Core Barrel: N/A
Boring Location: 20+00, 9.0 ft Rt. Casing ID/OD: N/A Water Level*: None Observed
Definitions: Definitions: Definitions:
D = Split Spoon Sample Su = Insitu Field Vane Shear Strength (psf) WC = water content, percent
MD = Unsuccessful Split Spoon Sample attempt Tv = Pocket Torvane Shear Strength (psf) LL = Liquid Limit
U = Thin Wall Tube Sample qp = Unconfined Compressive Strength (ksf) PL = Plastic Limit
R = Rock Core Sample Su(lab) = Lab Vane Shear Strength (psf) PI = Plasticity Index
V = Insitu Vane Shear Test WOH = weight of 140lb. hammer G = Grain Size AnalysisSSA = Solid Stem Auger WOR = weight of rods WOC = weight of casing C = Consolidation Test
Remarks:
Offsets are from the Existing Roadway CL.
Stratification lines represent approximate boundaries between soil types; transitions may be gradual.
* Water level readings have been made at times and under conditions stated. Groundwater fluctuations may occur due to conditions otherthan those present at the time measurements were made. Boring No.: HB-SEMI-102
Depth
(ft
.)
Sam
ple
No.
Sample Information
Pen./
Rec.
(in.)
Sam
ple
Depth
(ft.
)
Blo
ws (
/6 in.)
Shear
Str
ength
(psf)
or
RQ
D (
%)
N-v
alu
e
Casin
g
Blo
ws
Ele
vation
(ft.
)
Gra
phic
Log
Visual Description and Remarks
LaboratoryTesting Results/
AASHTO and
Unified Class.
Page 1 of 1

0
5
10
15
20
25
S4 0.63 - 5.00 SSA -0.63
-5.00
7½" PAVEMENT.0.63
Brown-grey, damp, fine to medium SAND, some gravel, little silt.
5.00Bottom of Exploration at 5.00 feet below ground surface.
NO REFUSAL
G#267100
A-1-b, SM
WC=4.8%
Maine Department of Transportation Project: A 4.53 mile portion of Route 6/16 Boring No.: HB-SEMI-103
Soil/Rock Exploration LogLocation: Sebec-Milo, Maine
US CUSTOMARY UNITS WIN: 18289.00
Driller: MaineDOT Elevation (ft.) Auger ID/OD: 5" Dia.
Operator: Giles/Daggett Datum: NAVD88 Sampler: Off Flights
Logged By: B. Enos Rig Type: CME 45C Hammer Wt./Fall: N/A
Date Start/Finish: 10/22/12-10/22/12 Drilling Method: Solid Stem Auger Core Barrel: N/A
Boring Location: 30+00, 9.0 ft Rt. Casing ID/OD: N/A Water Level*: None Observed
Definitions: Definitions: Definitions:
D = Split Spoon Sample Su = Insitu Field Vane Shear Strength (psf) WC = water content, percent
MD = Unsuccessful Split Spoon Sample attempt Tv = Pocket Torvane Shear Strength (psf) LL = Liquid Limit
U = Thin Wall Tube Sample qp = Unconfined Compressive Strength (ksf) PL = Plastic Limit
R = Rock Core Sample Su(lab) = Lab Vane Shear Strength (psf) PI = Plasticity Index
V = Insitu Vane Shear Test WOH = weight of 140lb. hammer G = Grain Size AnalysisSSA = Solid Stem Auger WOR = weight of rods WOC = weight of casing C = Consolidation Test
Remarks:
Offsets are from the Existing Roadway CL.
Stratification lines represent approximate boundaries between soil types; transitions may be gradual.
* Water level readings have been made at times and under conditions stated. Groundwater fluctuations may occur due to conditions otherthan those present at the time measurements were made. Boring No.: HB-SEMI-103
Depth
(ft
.)
Sam
ple
No.
Sample Information
Pen./
Rec.
(in.)
Sam
ple
Depth
(ft.
)
Blo
ws (
/6 in.)
Shear
Str
ength
(psf)
or
RQ
D (
%)
N-v
alu
e
Casin
g
Blo
ws
Ele
vation
(ft.
)
Gra
phic
Log
Visual Description and Remarks
LaboratoryTesting Results/
AASHTO and
Unified Class.
Page 1 of 1

0
5
10
15
20
25
S5 3.80 - 5.00
SSA-0.92
-3.80
-5.00
11" PAVEMENT.
0.92Brown, dry, fine to medium SAND, some gravel, little silt. ≅S1
3.80Grey, damp, fine to medium SAND, some silt, some gravel, cobbles.
5.00Bottom of Exploration at 5.00 feet below ground surface.
NO REFUSAL
G#266676
A-4, SM
WC=11.9%
Maine Department of Transportation Project: A 4.53 mile portion of Route 6/16 Boring No.: HB-SEMI-104
Soil/Rock Exploration LogLocation: Sebec-Milo, Maine
US CUSTOMARY UNITS WIN: 18289.00
Driller: MaineDOT Elevation (ft.) Auger ID/OD: 5" Dia.
Operator: Giles/Daggett Datum: NAVD88 Sampler: Off Flights
Logged By: B. Enos Rig Type: CME 45C Hammer Wt./Fall: N/A
Date Start/Finish: 10/22/12-10/22/12 Drilling Method: Solid Stem Auger Core Barrel: N/A
Boring Location: 50+15, 9.0 ft Rt. Casing ID/OD: N/A Water Level*: None Observed
Definitions: Definitions: Definitions:
D = Split Spoon Sample Su = Insitu Field Vane Shear Strength (psf) WC = water content, percent
MD = Unsuccessful Split Spoon Sample attempt Tv = Pocket Torvane Shear Strength (psf) LL = Liquid Limit
U = Thin Wall Tube Sample qp = Unconfined Compressive Strength (ksf) PL = Plastic Limit
R = Rock Core Sample Su(lab) = Lab Vane Shear Strength (psf) PI = Plasticity Index
V = Insitu Vane Shear Test WOH = weight of 140lb. hammer G = Grain Size AnalysisSSA = Solid Stem Auger WOR = weight of rods WOC = weight of casing C = Consolidation Test
Remarks:
Offsets are from the Existing Roadway CL.
Stratification lines represent approximate boundaries between soil types; transitions may be gradual.
* Water level readings have been made at times and under conditions stated. Groundwater fluctuations may occur due to conditions otherthan those present at the time measurements were made. Boring No.: HB-SEMI-104
Depth
(ft
.)
Sam
ple
No.
Sample Information
Pen./
Rec.
(in.)
Sam
ple
Depth
(ft.
)
Blo
ws (
/6 in.)
Shear
Str
ength
(psf)
or
RQ
D (
%)
N-v
alu
e
Casin
g
Blo
ws
Ele
vation
(ft.
)
Gra
phic
Log
Visual Description and Remarks
LaboratoryTesting Results/
AASHTO and
Unified Class.
Page 1 of 1

0
5
10
15
20
25
SSA-0.92
-3.40
-5.00
11" PAVEMENT.
0.92Brown, dry, fine to medium SAND, some gravel, little silt. ≅S1
3.40Grey, damp, fine to medium SAND, some silt, some gravel, cobbles. ≅S5
5.00Bottom of Exploration at 5.00 feet below ground surface.
NO REFUSAL
Maine Department of Transportation Project: A 4.53 mile portion of Route 6/16 Boring No.: HB-SEMI-105
Soil/Rock Exploration LogLocation: Sebec-Milo, Maine
US CUSTOMARY UNITS WIN: 18289.00
Driller: MaineDOT Elevation (ft.) Auger ID/OD: 5" Dia.
Operator: Giles/Daggett Datum: NAVD88 Sampler: Off Flights
Logged By: B. Enos Rig Type: CME 45C Hammer Wt./Fall: N/A
Date Start/Finish: 10/22/12-10/22/12 Drilling Method: Solid Stem Auger Core Barrel: N/A
Boring Location: 67+50, 9.0 ft Rt. Casing ID/OD: N/A Water Level*: None Observed
Definitions: Definitions: Definitions:
D = Split Spoon Sample Su = Insitu Field Vane Shear Strength (psf) WC = water content, percent
MD = Unsuccessful Split Spoon Sample attempt Tv = Pocket Torvane Shear Strength (psf) LL = Liquid Limit
U = Thin Wall Tube Sample qp = Unconfined Compressive Strength (ksf) PL = Plastic Limit
R = Rock Core Sample Su(lab) = Lab Vane Shear Strength (psf) PI = Plasticity Index
V = Insitu Vane Shear Test WOH = weight of 140lb. hammer G = Grain Size AnalysisSSA = Solid Stem Auger WOR = weight of rods WOC = weight of casing C = Consolidation Test
Remarks:
Offsets are from the Existing Roadway CL.
Stratification lines represent approximate boundaries between soil types; transitions may be gradual.
* Water level readings have been made at times and under conditions stated. Groundwater fluctuations may occur due to conditions otherthan those present at the time measurements were made. Boring No.: HB-SEMI-105
Depth
(ft
.)
Sam
ple
No.
Sample Information
Pen./
Rec.
(in.)
Sam
ple
Depth
(ft.
)
Blo
ws (
/6 in.)
Shear
Str
ength
(psf)
or
RQ
D (
%)
N-v
alu
e
Casin
g
Blo
ws
Ele
vation
(ft.
)
Gra
phic
Log
Visual Description and Remarks
LaboratoryTesting Results/
AASHTO and
Unified Class.
Page 1 of 1

0
5
10
15
20
25
S6
S7
1.00 - 3.00
3.00 - 5.00
SSA
-1.00
-3.00
-5.00
12" PAVEMENT.
1.00Brown, damp, fine to medium SAND, some gravel, little silt.
3.00Brown, moist, fine to medium SAND, some silt, some gravel.
5.00Bottom of Exploration at 5.00 feet below ground surface.
NO REFUSAL
G#266677
A-1-b, SM
WC=4.6%
G#266678
A-4, SM
WC=15.1%
Maine Department of Transportation Project: A 4.53 mile portion of Route 6/16 Boring No.: HB-SEMI-106
Soil/Rock Exploration LogLocation: Sebec-Milo, Maine
US CUSTOMARY UNITS WIN: 18289.00
Driller: MaineDOT Elevation (ft.) Auger ID/OD: 5" Dia.
Operator: Giles/Daggett Datum: NAVD88 Sampler: Off Flights
Logged By: B. Enos Rig Type: CME 45C Hammer Wt./Fall: N/A
Date Start/Finish: 10/22/12-10/22/12 Drilling Method: Solid Stem Auger Core Barrel: N/A
Boring Location: 76+00, 9.0 ft Rt. Casing ID/OD: N/A Water Level*: None Observed
Definitions: Definitions: Definitions:
D = Split Spoon Sample Su = Insitu Field Vane Shear Strength (psf) WC = water content, percent
MD = Unsuccessful Split Spoon Sample attempt Tv = Pocket Torvane Shear Strength (psf) LL = Liquid Limit
U = Thin Wall Tube Sample qp = Unconfined Compressive Strength (ksf) PL = Plastic Limit
R = Rock Core Sample Su(lab) = Lab Vane Shear Strength (psf) PI = Plasticity Index
V = Insitu Vane Shear Test WOH = weight of 140lb. hammer G = Grain Size AnalysisSSA = Solid Stem Auger WOR = weight of rods WOC = weight of casing C = Consolidation Test
Remarks:
Offsets are from the Existing Roadway CL.
Stratification lines represent approximate boundaries between soil types; transitions may be gradual.
* Water level readings have been made at times and under conditions stated. Groundwater fluctuations may occur due to conditions otherthan those present at the time measurements were made. Boring No.: HB-SEMI-106
Depth
(ft
.)
Sam
ple
No.
Sample Information
Pen./
Rec.
(in.)
Sam
ple
Depth
(ft.
)
Blo
ws (
/6 in.)
Shear
Str
ength
(psf)
or
RQ
D (
%)
N-v
alu
e
Casin
g
Blo
ws
Ele
vation
(ft.
)
Gra
phic
Log
Visual Description and Remarks
LaboratoryTesting Results/
AASHTO and
Unified Class.
Page 1 of 1

0
5
10
15
20
25
SSA -0.67-1.08
-2.50
-5.00
8" PAVEMENT.0.67
5" Unbound Pavement.1.08
Brown, damp, fine to medium SAND, some gravel, little silt. ≅S6
2.50Brown, moist, fine to medium SAND, some silt, some gravel. ≅S7
5.00Bottom of Exploration at 5.00 feet below ground surface.
NO REFUSAL
Maine Department of Transportation Project: A 4.53 mile portion of Route 6/16 Boring No.: HB-SEMI-107
Soil/Rock Exploration LogLocation: Sebec-Milo, Maine
US CUSTOMARY UNITS WIN: 18289.00
Driller: MaineDOT Elevation (ft.) Auger ID/OD: 5" Dia.
Operator: Giles/Daggett Datum: NAVD88 Sampler: Off Flights
Logged By: B. Enos Rig Type: CME 45C Hammer Wt./Fall: N/A
Date Start/Finish: 10/22/12-10/22/12 Drilling Method: Solid Stem Auger Core Barrel: N/A
Boring Location: 90+00, 9.0 ft Rt. Casing ID/OD: N/A Water Level*: None Observed
Definitions: Definitions: Definitions:
D = Split Spoon Sample Su = Insitu Field Vane Shear Strength (psf) WC = water content, percent
MD = Unsuccessful Split Spoon Sample attempt Tv = Pocket Torvane Shear Strength (psf) LL = Liquid Limit
U = Thin Wall Tube Sample qp = Unconfined Compressive Strength (ksf) PL = Plastic Limit
R = Rock Core Sample Su(lab) = Lab Vane Shear Strength (psf) PI = Plasticity Index
V = Insitu Vane Shear Test WOH = weight of 140lb. hammer G = Grain Size AnalysisSSA = Solid Stem Auger WOR = weight of rods WOC = weight of casing C = Consolidation Test
Remarks:
Offsets are from the Existing Roadway CL.
Stratification lines represent approximate boundaries between soil types; transitions may be gradual.
* Water level readings have been made at times and under conditions stated. Groundwater fluctuations may occur due to conditions otherthan those present at the time measurements were made. Boring No.: HB-SEMI-107
Depth
(ft
.)
Sam
ple
No.
Sample Information
Pen./
Rec.
(in.)
Sam
ple
Depth
(ft.
)
Blo
ws (
/6 in.)
Shear
Str
ength
(psf)
or
RQ
D (
%)
N-v
alu
e
Casin
g
Blo
ws
Ele
vation
(ft.
)
Gra
phic
Log
Visual Description and Remarks
LaboratoryTesting Results/
AASHTO and
Unified Class.
Page 1 of 1

0
5
10
15
20
25
S8 0.75 - 5.00 SSA-0.75
-5.00
9" PAVEMENT.
0.75Brown, damp, fine to coarse SAND, some gravel, little silt, cobbles.
5.00Bottom of Exploration at 5.00 feet below ground surface.
NO REFUSAL
G#266679
A-4, SM
WC=7.1%
Maine Department of Transportation Project: A 4.53 mile portion of Route 6/16 Boring No.: HB-SEMI-108
Soil/Rock Exploration LogLocation: Sebec-Milo, Maine
US CUSTOMARY UNITS WIN: 18289.00
Driller: MaineDOT Elevation (ft.) Auger ID/OD: 5" Dia.
Operator: Giles/Daggett Datum: NAVD88 Sampler: Off Flights
Logged By: B. Enos Rig Type: CME 45C Hammer Wt./Fall: N/A
Date Start/Finish: 10/22/12-10/22/12 Drilling Method: Solid Stem Auger Core Barrel: N/A
Boring Location: 105+00, 9.0 ft Rt. Casing ID/OD: N/A Water Level*: None Observed
Definitions: Definitions: Definitions:
D = Split Spoon Sample Su = Insitu Field Vane Shear Strength (psf) WC = water content, percent
MD = Unsuccessful Split Spoon Sample attempt Tv = Pocket Torvane Shear Strength (psf) LL = Liquid Limit
U = Thin Wall Tube Sample qp = Unconfined Compressive Strength (ksf) PL = Plastic Limit
R = Rock Core Sample Su(lab) = Lab Vane Shear Strength (psf) PI = Plasticity Index
V = Insitu Vane Shear Test WOH = weight of 140lb. hammer G = Grain Size AnalysisSSA = Solid Stem Auger WOR = weight of rods WOC = weight of casing C = Consolidation Test
Remarks:
Offsets are from the Existing Roadway CL.
Stratification lines represent approximate boundaries between soil types; transitions may be gradual.
* Water level readings have been made at times and under conditions stated. Groundwater fluctuations may occur due to conditions otherthan those present at the time measurements were made. Boring No.: HB-SEMI-108
Depth
(ft
.)
Sam
ple
No.
Sample Information
Pen./
Rec.
(in.)
Sam
ple
Depth
(ft.
)
Blo
ws (
/6 in.)
Shear
Str
ength
(psf)
or
RQ
D (
%)
N-v
alu
e
Casin
g
Blo
ws
Ele
vation
(ft.
)
Gra
phic
Log
Visual Description and Remarks
LaboratoryTesting Results/
AASHTO and
Unified Class.
Page 1 of 1

0
5
10
15
20
25
S9 4.00 - 5.00
SSA -0.58
-1.17
-4.00
-5.00
7" PAVEMENT.0.58
7" Unbound Pavement.1.17
Brown, moist, fine to medium SAND, some silt, some gravel. ≅S7
4.00Brown, moist, fine to coarse SAND, some silt, little gravel.
5.00Bottom of Exploration at 5.00 feet below ground surface.
NO REFUSAL
G#266680
A-4, SM
WC=19.8%
Maine Department of Transportation Project: A 4.53 mile portion of Route 6/16 Boring No.: HB-SEMI-109
Soil/Rock Exploration LogLocation: Sebec-Milo, Maine
US CUSTOMARY UNITS WIN: 18289.00
Driller: MaineDOT Elevation (ft.) Auger ID/OD: 5" Dia.
Operator: Giles/Daggett Datum: NAVD88 Sampler: Off Flights
Logged By: B. Enos Rig Type: CME 45C Hammer Wt./Fall: N/A
Date Start/Finish: 10/22/12-10/22/12 Drilling Method: Solid Stem Auger Core Barrel: N/A
Boring Location: 130+00, 9.0 ft Rt. Casing ID/OD: N/A Water Level*: None Observed
Definitions: Definitions: Definitions:
D = Split Spoon Sample Su = Insitu Field Vane Shear Strength (psf) WC = water content, percent
MD = Unsuccessful Split Spoon Sample attempt Tv = Pocket Torvane Shear Strength (psf) LL = Liquid Limit
U = Thin Wall Tube Sample qp = Unconfined Compressive Strength (ksf) PL = Plastic Limit
R = Rock Core Sample Su(lab) = Lab Vane Shear Strength (psf) PI = Plasticity Index
V = Insitu Vane Shear Test WOH = weight of 140lb. hammer G = Grain Size AnalysisSSA = Solid Stem Auger WOR = weight of rods WOC = weight of casing C = Consolidation Test
Remarks:
Offsets are from the Existing Roadway CL.
Stratification lines represent approximate boundaries between soil types; transitions may be gradual.
* Water level readings have been made at times and under conditions stated. Groundwater fluctuations may occur due to conditions otherthan those present at the time measurements were made. Boring No.: HB-SEMI-109
Depth
(ft
.)
Sam
ple
No.
Sample Information
Pen./
Rec.
(in.)
Sam
ple
Depth
(ft.
)
Blo
ws (
/6 in.)
Shear
Str
ength
(psf)
or
RQ
D (
%)
N-v
alu
e
Casin
g
Blo
ws
Ele
vation
(ft.
)
Gra
phic
Log
Visual Description and Remarks
LaboratoryTesting Results/
AASHTO and
Unified Class.
Page 1 of 1

0
5
10
15
20
25
SSA -0.42
-0.92
-2.70
-5.00
5" PAVEMENT.0.42
6" Unbound Pavement.0.92
Brown, dry, fine to medium SAND, some gravel, little silt. ≅S1
2.70Brown, moist, fine to medium SAND, some silt, some gravel. ≅S7
5.00Bottom of Exploration at 5.00 feet below ground surface.
NO REFUSAL
Maine Department of Transportation Project: A 4.53 mile portion of Route 6/16 Boring No.: HB-SEMI-110
Soil/Rock Exploration LogLocation: Sebec-Milo, Maine
US CUSTOMARY UNITS WIN: 18289.00
Driller: MaineDOT Elevation (ft.) Auger ID/OD: 5" Dia.
Operator: Giles/Daggett Datum: NAVD88 Sampler: Off Flights
Logged By: B. Enos Rig Type: CME 45C Hammer Wt./Fall: N/A
Date Start/Finish: 10/22/12-10/22/12 Drilling Method: Solid Stem Auger Core Barrel: N/A
Boring Location: 182+50, 9.0 ft Rt. Casing ID/OD: N/A Water Level*: None Observed
Definitions: Definitions: Definitions:
D = Split Spoon Sample Su = Insitu Field Vane Shear Strength (psf) WC = water content, percent
MD = Unsuccessful Split Spoon Sample attempt Tv = Pocket Torvane Shear Strength (psf) LL = Liquid Limit
U = Thin Wall Tube Sample qp = Unconfined Compressive Strength (ksf) PL = Plastic Limit
R = Rock Core Sample Su(lab) = Lab Vane Shear Strength (psf) PI = Plasticity Index
V = Insitu Vane Shear Test WOH = weight of 140lb. hammer G = Grain Size AnalysisSSA = Solid Stem Auger WOR = weight of rods WOC = weight of casing C = Consolidation Test
Remarks:
Offsets are from the Existing Roadway CL.
Stratification lines represent approximate boundaries between soil types; transitions may be gradual.
* Water level readings have been made at times and under conditions stated. Groundwater fluctuations may occur due to conditions otherthan those present at the time measurements were made. Boring No.: HB-SEMI-110
Depth
(ft
.)
Sam
ple
No.
Sample Information
Pen./
Rec.
(in.)
Sam
ple
Depth
(ft.
)
Blo
ws (
/6 in.)
Shear
Str
ength
(psf)
or
RQ
D (
%)
N-v
alu
e
Casin
g
Blo
ws
Ele
vation
(ft.
)
Gra
phic
Log
Visual Description and Remarks
LaboratoryTesting Results/
AASHTO and
Unified Class.
Page 1 of 1

0
5
10
15
20
25
S10 3.00 - 5.00
SSA -0.67
-3.00
-5.00
8" PAVEMENT.0.67
Brown, damp, fine to medium SAND, some gravel, little silt. ≅S6
3.00Brown, wet, fine to coarse SAND, some gravel, little silt.
5.00Bottom of Exploration at 5.00 feet below ground surface.
NO REFUSAL
G#266681
A-1-b, SM
WC=9.5%
Maine Department of Transportation Project: A 4.53 mile portion of Route 6/16 Boring No.: HB-SEMI-111
Soil/Rock Exploration LogLocation: Sebec-Milo, Maine
US CUSTOMARY UNITS WIN: 18289.00
Driller: MaineDOT Elevation (ft.) Auger ID/OD: 5" Dia.
Operator: Giles/Daggett Datum: NAVD88 Sampler: Off Flights
Logged By: B. Enos Rig Type: CME 45C Hammer Wt./Fall: N/A
Date Start/Finish: 10/22/12-10/22/12 Drilling Method: Solid Stem Auger Core Barrel: N/A
Boring Location: 210+00, 9.0 ft Rt. Casing ID/OD: N/A Water Level*: None Observed
Definitions: Definitions: Definitions:
D = Split Spoon Sample Su = Insitu Field Vane Shear Strength (psf) WC = water content, percent
MD = Unsuccessful Split Spoon Sample attempt Tv = Pocket Torvane Shear Strength (psf) LL = Liquid Limit
U = Thin Wall Tube Sample qp = Unconfined Compressive Strength (ksf) PL = Plastic Limit
R = Rock Core Sample Su(lab) = Lab Vane Shear Strength (psf) PI = Plasticity Index
V = Insitu Vane Shear Test WOH = weight of 140lb. hammer G = Grain Size AnalysisSSA = Solid Stem Auger WOR = weight of rods WOC = weight of casing C = Consolidation Test
Remarks:
Offsets are from the Existing Roadway CL.
Stratification lines represent approximate boundaries between soil types; transitions may be gradual.
* Water level readings have been made at times and under conditions stated. Groundwater fluctuations may occur due to conditions otherthan those present at the time measurements were made. Boring No.: HB-SEMI-111
Depth
(ft
.)
Sam
ple
No.
Sample Information
Pen./
Rec.
(in.)
Sam
ple
Depth
(ft.
)
Blo
ws (
/6 in.)
Shear
Str
ength
(psf)
or
RQ
D (
%)
N-v
alu
e
Casin
g
Blo
ws
Ele
vation
(ft.
)
Gra
phic
Log
Visual Description and Remarks
LaboratoryTesting Results/
AASHTO and
Unified Class.
Page 1 of 1

0
5
10
15
20
25
SSA-0.83-1.25
-2.80
-5.00
10" PAVEMENT.
0.835" Unbound Pavement.
1.25Brown, damp, fine to coarse SAND, some gravel, little silt, cobbles. ≅S8
2.80Brown, moist, fine to coarse SAND, some silt, little gravel. ≅S9
5.00Bottom of Exploration at 5.00 feet below ground surface.
NO REFUSAL
Maine Department of Transportation Project: A 4.53 mile portion of Route 6/16 Boring No.: HB-SEMI-112
Soil/Rock Exploration LogLocation: Sebec-Milo, Maine
US CUSTOMARY UNITS WIN: 18289.00
Driller: MaineDOT Elevation (ft.) Auger ID/OD: 5" Dia.
Operator: Giles/Daggett Datum: NAVD88 Sampler: Off Flights
Logged By: B. Enos Rig Type: CME 45C Hammer Wt./Fall: N/A
Date Start/Finish: 10/22/12-10/22/12 Drilling Method: Solid Stem Auger Core Barrel: N/A
Boring Location: 130+00, 18.0 ft Lt. Casing ID/OD: N/A Water Level*: None Observed
Definitions: Definitions: Definitions:
D = Split Spoon Sample Su = Insitu Field Vane Shear Strength (psf) WC = water content, percent
MD = Unsuccessful Split Spoon Sample attempt Tv = Pocket Torvane Shear Strength (psf) LL = Liquid Limit
U = Thin Wall Tube Sample qp = Unconfined Compressive Strength (ksf) PL = Plastic Limit
R = Rock Core Sample Su(lab) = Lab Vane Shear Strength (psf) PI = Plasticity Index
V = Insitu Vane Shear Test WOH = weight of 140lb. hammer G = Grain Size AnalysisSSA = Solid Stem Auger WOR = weight of rods WOC = weight of casing C = Consolidation Test
Remarks:
Offsets are from the Existing Roadway CL.
Stratification lines represent approximate boundaries between soil types; transitions may be gradual.
* Water level readings have been made at times and under conditions stated. Groundwater fluctuations may occur due to conditions otherthan those present at the time measurements were made. Boring No.: HB-SEMI-112
Depth
(ft
.)
Sam
ple
No.
Sample Information
Pen./
Rec.
(in.)
Sam
ple
Depth
(ft.
)
Blo
ws (
/6 in.)
Shear
Str
ength
(psf)
or
RQ
D (
%)
N-v
alu
e
Casin
g
Blo
ws
Ele
vation
(ft.
)
Gra
phic
Log
Visual Description and Remarks
LaboratoryTesting Results/
AASHTO and
Unified Class.
Page 1 of 1

0
5
10
15
20
25
S11 1.00 - 4.00
SSA
-1.00
-4.00
-5.00
12" PAVEMENT.
1.00Brown, dry to damp, fine to medium SAND, some gravel, little silt.
4.00Brown, moist, fine to coarse SAND, some silt, little gravel. ≅S9
5.00Bottom of Exploration at 5.00 feet below ground surface.
NO REFUSAL
G#266682
A-1-b, SM
WC=5.4%
Maine Department of Transportation Project: A 4.53 mile portion of Route 6/16 Boring No.: HB-SEMI-113
Soil/Rock Exploration LogLocation: Sebec-Milo, Maine
US CUSTOMARY UNITS WIN: 18289.00
Driller: MaineDOT Elevation (ft.) Auger ID/OD: 5" Dia.
Operator: Giles/Daggett Datum: NAVD88 Sampler: Off Flights
Logged By: B. Enos Rig Type: CME 45C Hammer Wt./Fall: N/A
Date Start/Finish: 10/22/12-10/22/12 Drilling Method: Solid Stem Auger Core Barrel: N/A
Boring Location: 130+00, 9.0 ft Lt. Casing ID/OD: N/A Water Level*: None Observed
Definitions: Definitions: Definitions:
D = Split Spoon Sample Su = Insitu Field Vane Shear Strength (psf) WC = water content, percent
MD = Unsuccessful Split Spoon Sample attempt Tv = Pocket Torvane Shear Strength (psf) LL = Liquid Limit
U = Thin Wall Tube Sample qp = Unconfined Compressive Strength (ksf) PL = Plastic Limit
R = Rock Core Sample Su(lab) = Lab Vane Shear Strength (psf) PI = Plasticity Index
V = Insitu Vane Shear Test WOH = weight of 140lb. hammer G = Grain Size AnalysisSSA = Solid Stem Auger WOR = weight of rods WOC = weight of casing C = Consolidation Test
Remarks:
Offsets are from the Existing Roadway CL.
Stratification lines represent approximate boundaries between soil types; transitions may be gradual.
* Water level readings have been made at times and under conditions stated. Groundwater fluctuations may occur due to conditions otherthan those present at the time measurements were made. Boring No.: HB-SEMI-113
Depth
(ft
.)
Sam
ple
No.
Sample Information
Pen./
Rec.
(in.)
Sam
ple
Depth
(ft.
)
Blo
ws (
/6 in.)
Shear
Str
ength
(psf)
or
RQ
D (
%)
N-v
alu
e
Casin
g
Blo
ws
Ele
vation
(ft.
)
Gra
phic
Log
Visual Description and Remarks
LaboratoryTesting Results/
AASHTO and
Unified Class.
Page 1 of 1

Morris
on B
rook
Gul
f Stre
am
Mea
dow
Bro
ok
Mea
dow
Bro
ok
Austin Rd
PhB
PhB
TSC
THC
PhB
MW
PWC
PhB
MW
MXB
PtB
MXB
HoB
HRB
MXB
TRC
PtB
PhB
CeB
PWC
PhB
HoB
MX
BPtC
PtC
PhB
MW
MW
HR
B
PWC
HoB
MW
PtB
PtB
PtB
TSC
TRC
TRC
PWC
THC
HoB
TeB
THC
HoB
TMB
PWC
TMB
TMB
MX
B
TeB
4917
00
4917
00
4926
00
4926
00
4935
00
4935
00
4944
00
4944
00
4953
00
4953
00
4962
00
4962
00
4971
00
4971
00
4980
00
4980
00
4989
00
4989
00
4998
00
4998
00
5007300
5007300
5008200
5008200
5009100
5009100
5010000
5010000
5010900
5010900
5011800
5011800
04,
000
8,00
012
,000
2,00
0Fe
et0
1,00
02,
000
3,00
050
0M
eter
s
45° 1
5' 4
4''
69° 0' 1''
45° 1
2' 4
2''
69° 0' 1''
45° 1
2' 4
2''
45° 1
5' 4
4''69° 6' 27''69° 6' 27''
Map
Sca
le: 1
:40,
100
if pr
inte
d on
A s
ize
(8.5
" x 1
1") s
heet
.
Par
ent M
ater
ial N
ame—
Pis
cata
quis
Cou
nty,
Mai
ne, S
outh
ern
Par
t(1
8289
.00
Seb
ec-M
ilo R
oute
6)
Nat
ural
Res
ourc
esN
atur
al R
esou
rces
Nat
ural
Res
ourc
esN
atur
al R
esou
rces
Con
serv
atio
n S
ervi
ceC
onse
rvat
ion
Ser
vice
Con
serv
atio
n S
ervi
ceC
onse
rvat
ion
Ser
vice
Web
Soi
l Sur
vey
Nat
iona
l Coo
pera
tive
Soi
l Sur
vey
3/12
/201
3P
age
1 of
4

MA
P LE
GEN
DM
AP
INFO
RM
ATI
ON
Are
a of
Inte
rest
(AO
I)A
rea
of In
tere
st (A
OI)
Soils
Soi
l Map
Uni
ts
Soil
Rat
ings co
arse
-loam
y lo
dgm
ent t
ill
coar
se-lo
amy
lodg
men
t till
deriv
ed fr
om q
uartz
iteco
arse
-loam
y lo
dgm
ent t
illde
rived
from
sla
teco
arse
-loam
y su
prag
laci
alm
elto
ut ti
ll de
rived
from
slat
elo
amy
mel
t-out
till
deriv
edfro
m p
hylli
te a
nd/o
r loa
my
mel
t-out
till
deriv
ed fr
omsl
ate
Not
rate
d or
not
ava
ilabl
e
Polit
ical
Fea
ture
sC
ities
Wat
er F
eatu
res
Stre
ams
and
Can
als
Tran
spor
tatio
nR
ails
Inte
rsta
te H
ighw
ays
US
Rou
tes
Maj
or R
oads
Map
Sca
le: 1
:40,
100
if pr
inte
d on
A s
ize
(8.5
" × 1
1") s
heet
.
The
soil
surv
eys
that
com
pris
e yo
ur A
OI w
ere
map
ped
at 1
:24,
000.
Ple
ase
rely
on
the
bar s
cale
on
each
map
she
et fo
r acc
urat
e m
apm
easu
rem
ents
.
Sou
rce
of M
ap:
Nat
ural
Res
ourc
es C
onse
rvat
ion
Ser
vice
Web
Soi
l Sur
vey
UR
L:
http
://w
ebso
ilsur
vey.
nrcs
.usd
a.go
vC
oord
inat
e S
yste
m:
UTM
Zon
e 19
N N
AD
83
This
pro
duct
is g
ener
ated
from
the
US
DA
-NR
CS
cer
tifie
d da
ta a
s of
the
vers
ion
date
(s) l
iste
d be
low
.
Soi
l Sur
vey
Are
a:
Pis
cata
quis
Cou
nty,
Mai
ne, S
outh
ern
Par
tS
urve
y A
rea
Dat
a:
Ver
sion
13,
Feb
15,
201
2
Dat
e(s)
aer
ial i
mag
es w
ere
phot
ogra
phed
: D
ata
not a
vaila
ble.
The
orth
opho
to o
r oth
er b
ase
map
on
whi
ch th
e so
il lin
es w
ere
com
pile
d an
d di
gitiz
ed p
roba
bly
diffe
rs fr
om th
e ba
ckgr
ound
imag
ery
disp
laye
d on
thes
e m
aps.
As
a re
sult,
som
e m
inor
shi
fting
of m
ap u
nit b
ound
arie
s m
ay b
e ev
iden
t.
Par
ent M
ater
ial N
ame–
Pis
cata
quis
Cou
nty,
Mai
ne, S
outh
ern
Par
t(1
8289
.00
Seb
ec-M
ilo R
oute
6)
Nat
ural
Res
ourc
esC
onse
rvat
ion
Serv
ice
Web
Soi
l Sur
vey
Nat
iona
l Coo
pera
tive
Soi
l Sur
vey
3/12
/201
3P
age
2 of
4

Parent Material Name
Parent Material Name— Summary by Map Unit — Piscataquis County, Maine, Southern Part (ME615)
Map unit symbol Map unit name Rating Acres in AOI Percent of AOI
CeB Chesuncook silt loam, 3 to 8 percentslopes
coarse-loamy lodgment till derivedfrom slate
15.1 2.1%
HoB Howland silt loam, 3 to 8 percentslopes
coarse-loamy lodgment till 41.3 5.8%
HRB Howland-Monarda association,gently sloping, very stony
coarse-loamy lodgment till 29.5 4.2%
MW Monarda-Burnham association, verystony
coarse-loamy lodgment till derivedfrom quartzite
77.6 10.9%
MXB Monarda-Howland-Thorndikecomplex, undulating, very stony
coarse-loamy lodgment till derivedfrom quartzite
91.3 12.9%
PhB Penquis-Thorndike complex, 3 to 8percent slopes
coarse-loamy supraglacial meltouttill derived from slate
178.8 25.2%
PtB Plaisted silt loam, 3 to 8 percentslopes
coarse-loamy lodgment till derivedfrom quartzite
52.5 7.4%
PtC Plaisted silt loam, 8 to 15 percentslopes
coarse-loamy lodgment till derivedfrom quartzite
27.4 3.9%
PWC Plaisted-Howland-Penquisassociation, strongly sloping, verystony
coarse-loamy lodgment till 68.5 9.6%
TeB Telos silt loam, 3 to 8 percent slopes coarse-loamy lodgment till derivedfrom slate
3.8 0.5%
THC Telos-Chesuncook association,strongly sloping, very stony
coarse-loamy lodgment till derivedfrom slate
43.9 6.2%
TMB Telos-Monarda association, gentlysloping, very stony
coarse-loamy lodgment till derivedfrom slate
2.8 0.4%
TRC Thorndike-Abram complex, rolling,very stony
loamy melt-out till derived fromphyllite and/or loamy melt-out tillderived from slate
32.0 4.5%
TSC Thorndike-Penquis complex, rolling,very stony
loamy melt-out till derived fromphyllite and/or loamy melt-out tillderived from slate
45.5 6.4%
Totals for Area of Interest 710.0 100.0%
Parent Material Name–Piscataquis County, Maine, Southern Part 18289.00 Sebec-Milo Route 6
Natural ResourcesConservation Service
Web Soil SurveyNational Cooperative Soil Survey
3/12/2013Page 3 of 4
Description
Parent material name is a term for the general physical, chemical, and mineralogicalcomposition of the unconsolidated material, mineral or organic, in which the soilforms. Mode of deposition and/or weathering may be implied by the name.
The soil surveyor uses parent material to develop a model used for soil mapping.Soil scientists and specialists in other disciplines use parent material to helpinterpret soil boundaries and project performance of the material below the soil.Many soil properties relate to parent material. Among these properties areproportions of sand, silt, and clay; chemical content; bulk density; structure; andthe kinds and amounts of rock fragments. These properties affect interpretationsand may be criteria used to separate soil series. Soil properties and landscapeinformation may imply the kind of parent material.
For each soil in the database, one or more parent materials may be identified. Oneis marked as the representative or most commonly occurring. The representativeparent material name is presented here.
Rating Options
Aggregation Method: Dominant Condition
Component Percent Cutoff: None Specified
Tie-break Rule: Lower
Parent Material Name–Piscataquis County, Maine, Southern Part 18289.00 Sebec-Milo Route 6
Natural ResourcesConservation Service
Web Soil SurveyNational Cooperative Soil Survey
3/12/2013Page 4 of 4

Morris
on B
rook
Gul
f Stre
am
Mea
dow
Bro
ok
Mea
dow
Bro
ok
Austin Rd
PhB
PhB
TSC
THC
PhB
MW
PWC
PhB
MW
MXB
PtB
MXB
HoB
HRB
MXB
TRC
PtB
PhB
CeB
PWC
PhB
HoB
MX
BPtC
PtC
PhB
MW
MW
HR
B
PWC
HoB
MW
PtB
PtB
PtB
TSC
TRC
TRC
PWC
THC
HoB
TeB
THC
HoB
TMB
PWC
TMB
TMB
MX
B
TeB
4917
00
4917
00
4926
00
4926
00
4935
00
4935
00
4944
00
4944
00
4953
00
4953
00
4962
00
4962
00
4971
00
4971
00
4980
00
4980
00
4989
00
4989
00
4998
00
4998
00
5007300
5007300
5008200
5008200
5009100
5009100
5010000
5010000
5010900
5010900
5011800
5011800
04,
000
8,00
012
,000
2,00
0Fe
et0
1,00
02,
000
3,00
050
0M
eter
s
45° 1
5' 4
4''
69° 0' 1''
45° 1
2' 4
2''
69° 0' 1''
45° 1
2' 4
2''
45° 1
5' 4
4''69° 6' 27''69° 6' 27''
Map
Sca
le: 1
:40,
100
if pr
inte
d on
A s
ize
(8.5
" x 1
1") s
heet
.
Dep
th to
Wat
er T
able
—P
isca
taqu
is C
ount
y, M
aine
, Sou
ther
n P
art
(182
89.0
0 S
ebec
-Milo
Rou
te 6
)
Nat
ural
Res
ourc
esN
atur
al R
esou
rces
Nat
ural
Res
ourc
esN
atur
al R
esou
rces
Con
serv
atio
n S
ervi
ceC
onse
rvat
ion
Ser
vice
Con
serv
atio
n S
ervi
ceC
onse
rvat
ion
Ser
vice
Web
Soi
l Sur
vey
Nat
iona
l Coo
pera
tive
Soi
l Sur
vey
3/12
/201
3P
age
1 of
4

MA
P LE
GEN
DM
AP
INFO
RM
ATI
ON
Are
a of
Inte
rest
(AO
I)A
rea
of In
tere
st (A
OI)
Soils
Soi
l Map
Uni
ts
Soil
Rat
ings 0
- 25
25 -
50
50 -
100
100
- 150
150
- 200
> 20
0
Polit
ical
Fea
ture
sC
ities
Wat
er F
eatu
res
Stre
ams
and
Can
als
Tran
spor
tatio
nR
ails
Inte
rsta
te H
ighw
ays
US
Rou
tes
Maj
or R
oads
Map
Sca
le: 1
:40,
100
if pr
inte
d on
A s
ize
(8.5
" × 1
1") s
heet
.
The
soil
surv
eys
that
com
pris
e yo
ur A
OI w
ere
map
ped
at 1
:24,
000.
Ple
ase
rely
on
the
bar s
cale
on
each
map
she
et fo
r acc
urat
e m
apm
easu
rem
ents
.
Sou
rce
of M
ap:
Nat
ural
Res
ourc
es C
onse
rvat
ion
Ser
vice
Web
Soi
l Sur
vey
UR
L:
http
://w
ebso
ilsur
vey.
nrcs
.usd
a.go
vC
oord
inat
e S
yste
m:
UTM
Zon
e 19
N N
AD
83
This
pro
duct
is g
ener
ated
from
the
US
DA
-NR
CS
cer
tifie
d da
ta a
s of
the
vers
ion
date
(s) l
iste
d be
low
.
Soi
l Sur
vey
Are
a:
Pis
cata
quis
Cou
nty,
Mai
ne, S
outh
ern
Par
tS
urve
y A
rea
Dat
a:
Ver
sion
13,
Feb
15,
201
2
Dat
e(s)
aer
ial i
mag
es w
ere
phot
ogra
phed
: D
ata
not a
vaila
ble.
The
orth
opho
to o
r oth
er b
ase
map
on
whi
ch th
e so
il lin
es w
ere
com
pile
d an
d di
gitiz
ed p
roba
bly
diffe
rs fr
om th
e ba
ckgr
ound
imag
ery
disp
laye
d on
thes
e m
aps.
As
a re
sult,
som
e m
inor
shi
fting
of m
ap u
nit b
ound
arie
s m
ay b
e ev
iden
t.
Dep
th to
Wat
er T
able
–Pis
cata
quis
Cou
nty,
Mai
ne, S
outh
ern
Par
t(1
8289
.00
Seb
ec-M
ilo R
oute
6)
Nat
ural
Res
ourc
esC
onse
rvat
ion
Serv
ice
Web
Soi
l Sur
vey
Nat
iona
l Coo
pera
tive
Soi
l Sur
vey
3/12
/201
3P
age
2 of
4

Depth to Water Table
Depth to Water Table— Summary by Map Unit — Piscataquis County, Maine, Southern Part (ME615)
Map unitsymbol
Map unit name Rating (centimeters) Acres in AOI Percent of AOI
CeB Chesuncook silt loam, 3 to 8 percentslopes
46 15.1 2.1%
HoB Howland silt loam, 3 to 8 percentslopes
61 41.3 5.8%
HRB Howland-Monarda association,gently sloping, very stony
61 29.5 4.2%
MW Monarda-Burnham association,very stony
15 77.6 10.9%
MXB Monarda-Howland-Thorndikecomplex, undulating, very stony
15 91.3 12.9%
PhB Penquis-Thorndike complex, 3 to 8percent slopes
>200 178.8 25.2%
PtB Plaisted silt loam, 3 to 8 percentslopes
84 52.5 7.4%
PtC Plaisted silt loam, 8 to 15 percentslopes
84 27.4 3.9%
PWC Plaisted-Howland-Penquisassociation, strongly sloping,very stony
61 68.5 9.6%
TeB Telos silt loam, 3 to 8 percent slopes 27 3.8 0.5%
THC Telos-Chesuncook association,strongly sloping, very stony
27 43.9 6.2%
TMB Telos-Monarda association, gentlysloping, very stony
27 2.8 0.4%
TRC Thorndike-Abram complex, rolling,very stony
>200 32.0 4.5%
TSC Thorndike-Penquis complex,rolling, very stony
>200 45.5 6.4%
Totals for Area of Interest 710.0 100.0%
Description
"Water table" refers to a saturated zone in the soil. It occurs during specifiedmonths. Estimates of the upper limit are based mainly on observations of the watertable at selected sites and on evidence of a saturated zone, namely grayish colors(redoximorphic features) in the soil. A saturated zone that lasts for less than a monthis not considered a water table.
This attribute is actually recorded as three separate values in the database. A lowvalue and a high value indicate the range of this attribute for the soil component. A"representative" value indicates the expected value of this attribute for thecomponent. For this soil property, only the representative value is used.
Depth to Water Table–Piscataquis County, Maine, Southern Part 18289.00 Sebec-Milo Route 6
Natural ResourcesConservation Service
Web Soil SurveyNational Cooperative Soil Survey
3/12/2013Page 3 of 4