Embed Size (px)
Citation preview

950 Pacific Avenue, Suite 515 Tacoma, WA 98402
(253) 926-2493
March 19, 2009
Prepared for
City of Olympia
Geotechnical ReportHands on Children’s Museum
Olympia, Washington

3/19/09 Y:\258\017.010\R\HOCM_Rpt.doc ii LANDAU ASSOCIATES
TABLE OF CONTENTS
Page
1.0 INTRODUCTION 1-1 1.1 PROJECT UNDERSTANDING 1-1 1.2 SCOPE OF SERVICES 1-2
2.0 EXISTING CONDITIONS 2-1 2.1 SURFACE CONDITIONS 2-1 2.2 GEOLOGIC SETTING 2-1 2.3 FIELD EXPLORATION PROGRAM 2-1 2.4 SUBSURFACE SOIL CONDITIONS 2-2
2.4.1 Fill 2-2 2.4.2 Upper Recessional Deposits 2-2 2.4.3 Intermediate Recessional Deposits 2-3 2.4.4 Lower Recessional Deposits 2-3
2.5 GROUNDWATER 2-3
3.0 GEOTECHNICAL CONCLUSIONS AND RECOMMENDATIONS 3-1 3.1 ENVIRONMENTAL CONSIDERATIONS 3-1 3.2 EARTHWORK 3-2
3.2.1 Wet Weather Construction Considerations 3-2 3.2.2 Site Preparation Activities 3-2 3.2.3 Subgrade Preparation 3-3 3.2.4 Structural Fill 3-4 3.2.5 Backfill and Compaction Requirements 3-4 3.2.6 Settlement 3-5
3.3 SEISMIC DESIGN CONSIDERATIONS 3-5 3.3.1 Code Based Seismic Design 3-6 3.3.2 Liquefaction and Lateral Spreading Analysis and Results 3-6
3.3.2.1 Peak Ground Acceleration and Magnitude for Analysis 3-7 3.3.2.2 Liquefaction Analysis Results 3-7 3.3.2.3 Liquefaction Induced Settlement 3-8 3.3.2.4 Lateral Spreading 3-8 3.3.2.5 Interpretation of Results and Mitigation 3-9
3.4 MAT FOUNDATION ALTERNATIVE 3-9 3.4.1 Ground Improvement 3-10 3.4.2 Mat Foundation Bearing Pressure and Subgrade Preparation 3-11 3.4.3 Capillary Break 3-11 3.4.4 Mat Foundation Deflections 3-12 3.4.5 Resistance to Lateral Loads 3-12 3.4.6 Foundation Drainage Considerations 3-13
3.5 DEEP FOUNDATION ALTERNATIVE 3-13

3/19/09 Y:\258\017.010\R\HOCM_Rpt.doc iii LANDAU ASSOCIATES
3.5.1 Driven Piles 3-14 3.5.1.1 Vertical Axial Capacity 3-14 3.5.1.2 Downdrag Loads 3-15 3.5.1.3 Deep Foundation Settlement 3-16 3.5.1.4 Uplift Capacity 3-16 3.5.1.5 Lateral Capacity 3-17 3.5.1.6 Impact of Lateral Spreading on Pile Capacity 3-19 3.5.1.7 Pile Construction Considerations 3-20
3.5.2 DeWitt Driven Grout Piles 3-22 3.6 SLAB-ON-GRADE FLOOR 3-22 3.7 MINOR STRUCTURE FOUNDATION SUPPORT 3-23
3.7.1 Helical Anchors 3-23 3.7.2 Shallow Foundations 3-24
3.8 BELOW-GRADE RETAINING WALLS 3-25
4.0 USE OF THIS REPORT 4-1
5.0 REFERENCES 5-1
LIST OF FIGURES
Figure Title
1 Vicinity Map 2 Site and Exploration Plan 3 Lateral Pressure Exerted on Pile During Lateral Spreading
LIST OF APPENDICES
Appendix Title
A Field Explorations B Laboratory Testing C Logs by Others

3/19/09 Y:\258\017.010\R\HOCM_Rpt.doc 1-1 LANDAU ASSOCIATES
1.0 INTRODUCTION
This report summarizes the results of our geotechnical engineering services conducted to support
preliminary design of the City of Olympia’s (City) proposed Hands On Children’s Museum (HOCM)
project located in Olympia, Washington. The purpose of our services was to complete investigations to
characterize subsurface soil and groundwater conditions at the site and to develop geotechnical
conclusions and recommendations suitable for use by the design-build team to complete design of the
proposed improvements. Additional subsurface explorations will likely be required in order to complete
final design. The scope of the additional subsurface explorations will depend on the foundation
alternative selected by the design-build team,
The general project area is shown on the Vicinity Map (Figure 1). The general configuration of
the project area, the proposed improvements, some of the existing site features, and the location of the
geotechnical explorations completed for this study and by others in the project vicinity are shown on the
Site and Exploration Plan (Figure 2). Appendix A presents a description of the field explorations and
summary logs of conditions observed in the explorations. Appendix B presents a description and results
of the laboratory testing program. Logs of previous explorations are included in Appendix C.
This report has been prepared based on our discussions with representatives of the City, Miller
Hull Partnership, LLC (project architect), and AHBL (project engineer); our review of readily available
subsurface information in the project area; a base map of the site provided by the City; data collected
during our field exploration program; our familiarity with geologic conditions within the vicinity of the
project; and our experience on similar projects.
1.1 PROJECT UNDERSTANDING
Based on information provided to us, we understand the project consists of constructing the
HOCM on Lot 5 on the Port of Olympia’s East Bay property. As currently envisioned, the HOCM is
anticipated to be approximately 175 ft long by 75 ft wide. Foundation alternatives being considered
include pile foundations, mat foundations, and stone columns.
At-grade parking is planned in the portion of the property north of the proposed HOCM structure.
In the area to the south and east of the HOCM structure, the improvements are anticipated to consist of
several minor structures (Lookout Structure, Garden Shed, Tensile Shade Structures, and Suspension
Bridge) amidst several architectural/educational features. These minor structures are expected to be
supported by shallow-foundations.
We understand that the improvements will be designed and constructed by a design-build team.
As the project evolves, the design-build team may need to complete additional subsurface explorations

3/19/09 Y:\258\017.010\R\HOCM_Rpt.doc 1-2 LANDAU ASSOCIATES
and complete additional geotechnical engineering analysis. We further understand that there is
soil/groundwater contamination at the site which is being addressed by others.
1.2 SCOPE OF SERVICES
Landau Associates was contracted by the City of Olympia to provide geotechnical services to
support the project. Our services were provided in accordance with the terms and conditions of our 2007
– 2008 On-Call General Services Agreement between the City and Landau Associates and our Revised
Proposal for Geotechnical Services dated December 3, 2008. A task order signed by Mr. Rick Dougherty
was received on January 21, 2009. Verbal authorization to proceed was provided earlier.
To support the proposed project, we provided the following specific services:
Reviewed readily available geologic and geotechnical information in the project vicinity.
Advanced three (3) geotechnical borings (B-1 through B-3) to depths of between 19 and 81½ ft below the existing ground surface (BGS), and three (3) cone penetrometer (CPT) soundings (CPT-1 through CPT-3) to depths of between 22.5 and 120 ft BGS to characterize subsurface soil and groundwater conditions at the site.
Completed geotechnical laboratory testing consisting of natural moisture content determinations, fines content determinations, grain size analyses, and Atterberg limit determinations on selected soil samples recovered from our borings.
Completed geotechnical engineering analyses and developed geotechnical engineering conclusions and recommendations to support preliminary design.
Prepared and submitted this geotechnical report summarizing our field investigations and preliminary geotechnical engineering conclusions and recommendations for the project. The report includes:
- a site plan showing the locations of the explorations completed for this investigation
- descriptive summary logs of the conditions encountered in the explorations completed for this study
- a summary of surface and subsurface conditions observed in the project area
- a summary of the environmental issues at the site
- recommendations for site earthwork including: wet weather construction considerations, site preparation activities, fill placement and compaction criteria, and subgrade preparation for slab-on-grade floors and pavement areas
- seismic design criteria including an evaluation of the liquefaction and lateral spreading potential at the site and seismic design parameters per the 2006 IBC
- an evaluation of the feasibility of supporting the HOCM building on a mat foundation with ground improvement. Recommendations are provided for the anticipated ground
3/19/09 Y:\258\017.010\R\HOCM_Rpt.doc 1-3 LANDAU ASSOCIATES
improvement, mat foundation subgrade preparation, capillary break, mat foundation deflections, resistance to lateral loads, and foundation drainage considerations
- recommendations for deep foundations of the HOCM building including: pile type(s), recommended tip elevations, allowable axial capacity, downdrag loads, settlement, uplift, lateral pile capacity, impact of lateral spreading on the piles, and pile design construction considerations
- evaluation of slab-on-grade floors versus a structural slab including a recommended value for subgrade modulus for preliminary deflection analysis of slab-on-grade floors
- recommendations for helical anchor foundation to support minor structures
- recommendations for below-grade retaining walls

3/19/09 Y:\258\017.010\R\HOCM_Rpt.doc 2-1 LANDAU ASSOCIATES
2.0 EXISTING CONDITIONS
This section provides a discussion of the general surface conditions, geologic setting, and
subsurface conditions observed at the proposed Hands On Children’s Museum site at the time of our
investigation. Interpretations of the site conditions are based on the results of our review of available
information, site reconnaissance, subsurface explorations, and laboratory testing.
2.1 SURFACE CONDITIONS
The proposed Hands On Children’s Museum property (subject property) will be situated on Lot 5
of the Port of Olympia’s East Bay property. Lot 5 is approximately 1.86 acres in size. The former East
Bay Warehouse, which was pile supported, is partially located on Lot 5. A concrete slab-on-grade from
the former warehouse covers much of the site. The floor slab has a significant amount of cracking and is
uneven. Lot 5 is bounded by undeveloped port property to the north, west, and south and by Marine
View Drive and East Bay to the east. Land use in the project area is primarily commercial/industrial.
The property is fairly level, with elevations ranging from 8 to 11 ft (Thurston County 2009).
2.2 GEOLOGIC SETTING
Geologic information for the project area was obtained from the Geologic Map of the Tumwater
7.5-Minute Quadrangle, Thurston County, Washington (Walsh 2003) published by the Washington State
Department of Natural Resources. According to the above-referenced geologic map, near-surface
deposits in the project area are mapped as glacial recessional outwash. Soil defined as recessional
outwash typically consists of stratified deposits of sand and gravel. Silt and fine-grained sand are
common in portions of the unit, as are lacustrine deposits. Sorting, cross and horizontal stratification, and
cut and fill structures are distinctive features of recessional outwash. Recessional outwash is transported
by meltwater streams emanating from the face of the ablating glacier. At the project site, the recessional
deposits are primarily composed of silt (i.e. lacustrine deposits) and fine-grained sand.
2.3 FIELD EXPLORATION PROGRAM
Soil and groundwater conditions at the proposed Hands On Children’s Museum site were
explored on January 8 and 9, 2009 by advancing three borings (B-1 through B-3) and three CPT
soundings (CPT-1 through CPT-3). The borings were advanced with a truck-mounted drill rig. Borings
B-1 and B-2 were advanced to a depth of approximately 19 ft BGS using hollow-stem auger drilling
techniques. Boring B-3 was advanced to a depth of about 81½ ft BGS utilizing mud rotary drilling

3/19/09 Y:\258\017.010\R\HOCM_Rpt.doc 2-2 LANDAU ASSOCIATES
techniques. The CPT soundings were advanced utilizing truck-mounted CPT equipment. CPT-1, CPT-2,
and CPT-3 soundings were advanced to depths of 22¾ ft, 120 ft, and 109 ft BGS, respectively. The
approximate locations of the explorations completed by Landau Associates for this study are shown on
the Site and Exploration Plan, Figure 2. A detailed discussion of the field exploration program, together
with edited logs of the exploratory borings, is presented in Appendix A. A discussion of the geotechnical
laboratory testing, together with the lab results, is presented in Appendix B.
2.4 SUBSURFACE SOIL CONDITIONS
Subsurface conditions across the site generally consist of fill overlying recessional deposits. For
the purpose of this report, the recessional deposits were divided into three subunits (upper, intermediate,
and lower) based on gradation characteristics, density, and other physical characteristics.
AMEC Earth and Environmental, Inc. (2007) advanced a series of borings for the proposed
expansion of the LOTT treatment plant. Borings AB-8 and AB-9 were advanced immediately to the west
of the proposed HOCM. GeoEngineers (2007) completed a series of monitoring wells on the HOCM
property (MW01 through MW04) for the remedial investigation of the Port of Olympia’s East Bay
property. The conditions observed in the explorations completed by AMEC and GeoEngineers are
similar to the conditions observed in our explorations. The location of the explorations advanced by
others is presented on the Site and Exploration Plan, Figure 2. Summary logs of these explorations are
included in Appendix C.
2.4.1 FILL
Fill was observed in all of the explorations completed for this study. The fill is estimated to be
between 15½ and 18 ft thick. The upper 2 to 10 ft of fill observed in all of the explorations advanced for
this study consists of loose to dense sand or gravel with variable silt content. Fill interpreted to consist of
medium dense, silty sand and stiff to very stiff, sandy silt is present between 2 and 5 ft BGS in sounding
CPT-1 and between 3 and 5½ ft BGS in sounding CPT-2. The lower portion of the fill consists of wood
debris. The wood debris consists of relatively fine wood fragments and ranges in thickness from 8 to 10½
ft.
2.4.2 UPPER RECESSIONAL DEPOSITS
Soil classified as upper recessional deposits were encountered below the fill in all of the
explorations completed for this project. In borings B-1 and B-2 and sounding CPT-1, the upper
recessional deposits were encountered throughout the depths explored (19 to 22½ ft BGS). In the

3/19/09 Y:\258\017.010\R\HOCM_Rpt.doc 2-3 LANDAU ASSOCIATES
remaining explorations completed at the site (B-3, CPT-2, and CPT-3), the recessional deposits were
encountered to depths of between 32½ and 33 ft BGS. The upper recessional deposits observed in the
borings consist of loose to medium dense, sand or gravel with variable silt content. In the soundings, the
upper recessional deposits were interpreted to consist of medium dense to dense sand to silty sand with
scattered interbeds of stiff silt.
2.4.3 INTERMEDIATE RECESSIONAL DEPOSITS
Soil interpreted to be intermediate recessional deposits were encountered in boring B-3 from 32½
to 73½ ft BGS, in sounding CPT-2 from 33 to 66 ft BGS, and in sounding CPT-3 from 33 to 61 ft BGS.
The intermediate recessional deposits encountered in boring B-3 were observed to consist of medium stiff
to stiff, sandy to very sandy silt; silt with sand to trace sand; and silty clay. In the CPT soundings, the
intermediate recessional deposits were interpreted to consist of medium stiff to stiff silt with interbeds of
sandy silt.
2.4.4 LOWER RECESSIONAL DEPOSITS
The lower recessional deposits were encountered below the intermediate recessional deposits
throughout the maximum depths explored in boring B-3 (81½ ft BGS) and in soundings CPT-2 (120 ft
BGS) and CPT-3 (109 ft BGS). In boring B-3, the lower recessional deposits were observed to consist of
medium dense to dense, sand with silt. In the soundings, the lower recessional deposits are interpreted to
consist of medium dense to very dense sand with variable silt content. Interbeds of very stiff to hard, silt
are interpreted to be present in sounding CPT-3.
2.5 GROUNDWATER
At the time of our field investigations in early-January 2009, groundwater was measured or
interpreted to be between 4 and 6 ft BGS in the explorations completed for this study. As part of the
remedial investigation completed on the East Bay Property for the Port of Olympia, GeoEngineers (2007)
installed a series of monitoring wells. The monitoring wells were measured on August 28, 2007. In the
wells installed near Lot 5, groundwater was reportedly encountered between elevation 5.3 and 6.6 ft
NGVD29. The location of the monitoring wells installed by GeoEngineers is included on Figure 2.
It should be noted that the groundwater conditions reported above are for the specific locations
and dates indicated, and therefore may not necessarily be indicative of other locations and/or times.
Furthermore, it is anticipated that groundwater conditions will vary depending on local subsurface
conditions, the weather, the tide, and other factors. Groundwater levels in the project area are expected to

3/19/09 Y:\258\017.010\R\HOCM_Rpt.doc 2-4 LANDAU ASSOCIATES
fluctuate seasonally, with maximum groundwater levels generally occurring during the winter and early
spring months.

3/19/09 Y:\258\017.010\R\HOCM_Rpt.doc 3-1 LANDAU ASSOCIATES
3.0 GEOTECHNICAL CONCLUSIONS AND RECOMMENDATIONS
Based on the conditions observed in the explorations completed for this study, construction of the
proposed Hands On Children’s Museum (HOCM) is feasible using conventional construction techniques.
A discussion of the environmental issues at the site, earthwork, and seismic design considerations are
provided in Section 3.1 through Section 3.3 of this report.
In our opinion, there are two feasible methods to support the HOCM. The first alternative
includes implementing ground improvement techniques and supporting the structure on a mat foundation.
This alternative is discussed in Section 3.4 of this report. The second alternative is to support the HOCM
on pile foundations with a pile-supported floor slab. With the pile foundation alternative, the first floor of
the HOCM could be constructed as slab-on-grade, though there is a potential of differential settlement
between the slab-on-grade floor and the pile-supported structure. Recommendations for pile foundations
are provided in Section 3.5 of this report. A discussion of slab-on-grade floors is provided in Section 3.6.
Recommendations for foundation support of minor structures are provided in Section 3.7.
As described in this report, once the final design alternative is selected, additional explorations
and engineering analysis will be necessary.
3.1 ENVIRONMENTAL CONSIDERATIONS
Gasoline-range petroleum hydrocarbons, diesel- and motor oil-range petroleum hydrocarbons,
cPAHs, SVOCs, Metals, and Dioxins/Furans were reportedly encountered within the site soil at
concentrations above the MTCA Method A or B clean-up levels. Petroleum hydrocarbons and arsenic
contamination were also reportedly encountered in the groundwater at the site (GeoEngineers 2007).
Depending on the clean-up action taken by the Port of Olympia, soil and groundwater removed
during site construction may be contaminated. The Contractor should be prepared to monitor excavated
soil and groundwater removed from the site during construction. If the contaminant levels are determined
to be above the site cleanup action level, the soil and groundwater will need to be managed in accordance
with the provisions of the site clean up action plan.
The method of clean up activities selected by the Port of Olympia for the site may change the
ground conditions at the site. Landau Associates should review documentation related to the clean-up
action selected by the Port of Olympia to determine if the proposed actions effect the geotechnical
recommendations of this report and, if necessary, modify the recommendations contained in this report to
account for changes in site conditions.
3/19/09 Y:\258\017.010\R\HOCM_Rpt.doc 3-2 LANDAU ASSOCIATES
3.2 EARTHWORK
Earthwork to accommodate the proposed improvements is expected to consist of the removal of
existing improvements, subgrade preparation for floor slabs and pavement, installation of onsite utilities,
and the placement and compaction of structural fill.
3.2.1 WET WEATHER CONSTRUCTION CONSIDERATIONS
Earthwork-related construction will be influenced by weather conditions. Much of the existing
soil at the site contains a significant amount of fine sand and silt and will be sensitive to moisture. Site
grading activities using moisture-sensitive soil should normally occur during the relatively warmer and
drier period between about mid-summer to early fall (typically about July through mid-October).
Completing these activities outside of this normal construction window could lead to a significant
increase in construction costs due to weather-related delays, repair of disturbed areas, and the increased
use of “all-weather” import fill materials.
Because of the moisture sensitivity, unprotected site soil, in either a compacted or uncompacted
state, can degrade quickly to a slurry-like consistency in the presence of water and construction traffic. If
the subgrade or fill soil becomes loosened or disturbed, additional excavation to expose undisturbed soil
and replacement with properly compacted structural fill will be required. For wet weather construction,
the contractor may reduce the potential for disturbance of subgrades by the following:
Protecting exposed subgrades from disturbance by construction activities by constructing gravel working mats
Using a trackhoe with a smooth-bladed bucket to limit disturbance of the subgrade during excavation
Suspending earthwork and other construction activities that may damage subgrades during rainy days
Limiting and/or prohibiting construction traffic over unprotected soil
Sloping excavated surfaces to promote runoff
Sealing the exposed surface by rolling with a smooth drum compactor or rubber-tire roller at the end of each working day and removing wet surface soil prior to commencing filling each day.
3.2.2 SITE PREPARATION ACTIVITIES
Site preparation activities are expected to consist mainly of the removal of the slab-on-grade floor
and piles associated with the former East Bay Warehouse. The existing slab-on-grade floor may be
pulverized, stockpiled, and recycled for use as structural fill. If this alternate is chosen, the Portland

3/19/09 Y:\258\017.010\R\HOCM_Rpt.doc 3-3 LANDAU ASSOCIATES
cement concrete should be processed to meet the requirements for structural fill described in Section 3.2.4
of this report. If rebar or reinforcing mesh is present in the slab, the rebar or reinforcing mesh should be
removed if the Portland cement concrete will be utilized as structural fill. Disposal of the Portland
concrete rubble at an approved offsite location is also a viable alternative.
The former East Bay Warehouse piles should either be extracted or cut off at least 3 ft below the
lowest proposed foundations level. If the piles are left in place, the location of the existing pile
foundations should be surveyed and recorded. If the piles are extracted, we recommend that the hole
from the extracted pile be filled with Controlled Density Fill (CDF). CDF should be placed using a
tremie pipe. The pipe should be forced as deep as possible (minimum 10 ft below the surface). A
sufficient head of CDF should be maintained in the hole as the tremie pipe is extracted. CDF should have
an unconfined compressive strength of 50 to 300 psi.
We have not been informed of any utilities that are present across the site. If they exist, water
supply lines, storm lines, and other buried lines should be abandoned or relocated prior to construction.
Utilities that will be abandoned that are less than 3 ft below the lowest foundations level should be
removed and disposed of at an approved off-site location. Deeper pipelines left in place should be
grouted full with controlled density fill (CDF) to reduce the potential for differential settlement resulting
from collapsed pipes or erosion. It should be noted that large-diameter utility lines that are abandoned in
place could create obstructions during pile installation.
All incidental excavations associated with the removal of the existing improvements should be
backfilled in accordance with the recommendations in Section 3.2.5 of this report.
3.2.3 SUBGRADE PREPARATION
Following site preparation activities and before placement of any structural fill, the upper 12
inches of exposed soil should be scarified, moisture-conditioned, and compacted as described in Section
3.2.5 of this report. The prepared subgrade should be proof-rolled with a loaded dump truck, large self-
propelled vibrating roller, or equivalent piece of equipment in the presence of a qualified geotechnical or
civil engineer to check for the presence of soft, loose, and/or disturbed areas. If any soft, loose, and/or
disturbed areas are revealed during proof-rolling, these areas should either be moisture-conditioned and
recompacted to the required density, or removed and replaced with import structural fill as described in
Section 3.2.4 and compacted as described in Section 3.2.5 of this report.

3/19/09 Y:\258\017.010\R\HOCM_Rpt.doc 3-4 LANDAU ASSOCIATES
3.2.4 STRUCTURAL FILL
Structural fill is defined as fill placed to support foundations, floors slabs, and pavement areas
and used for utility trench backfill. The suitability of excavated soil or imported soil for use as structural
fill will depend on the gradation and moisture content of the soil when it is placed. As the amount of
fines increases, the soil becomes increasingly sensitive to small changes in moisture content and adequate
compaction becomes more difficult to achieve. Soil containing more than about 5 percent fines cannot
consistently be compacted to a dense, non-yielding condition when the water content is greater than about
2 to 3 percent above optimum moisture content. Optimum moisture content is the moisture content at
which the greatest compacted dry density can be achieved.
Based on the results of our explorations, most of the near-surface soil across the site (encountered
between 2 and 10 ft BGS) consists of granular fill composed of sand with silt and variable gravel or sandy
gravel. The granular fill has a moderate amount of fines (between 5 and 15 percent) which indicates that
the granular fill is moderately moisture sensitive. The near-surface granular fill located above the
groundwater table is near its optimum moisture, however some limited moisture conditioning (i.e. drying
or wetting) may be required to use this material for structural fill. If the near-surface soil is used, we
recommend that its use be limited to extended periods of dry weather in the summer and early fall months
(about July through mid-October) where the moisture can be more easily controlled. Fine-grained fill
(interpreted to be present between 2 and 5 ft BGS in sounding CPT-1 and between 3 and 5½ ft BGS in
sounding CPT-2) and wood debris are not suitable for use as structural fill and should be wasted at an
approved off site location.
If the onsite soil cannot be properly moisture conditioned or the quantity of onsite soil is
insufficient, import structural fill will be required. For warm, dry weather conditions (generally July
through late September), import structural fill could consist of a well-graded, granular material with less
than 15 percent fines (material passing a U.S. No. 200 sieve) and a maximum particle size of 4 inches.
The moisture content should be within minus 2 percent to plus 1 percent of the optimum moisture
content. If wet weather construction is anticipated, the amount of fines should not exceed 5 percent based
on the minus ¾-inch fraction.
3.2.5 BACKFILL AND COMPACTION REQUIREMENTS
Prior to placing structural fill, the exposed subgrade should be prepared in accordance with the
recommendations contained in Section 3.2.3 of this report. The initial lifts of fill over the prepared
subgrade should be placed in relatively uniform horizontal lifts, not exceeding 6 inches thick, loose
measure. The initial lifts of fill should be compacted with multiple passes of a large, steel drum roller
3/19/09 Y:\258\017.010\R\HOCM_Rpt.doc 3-5 LANDAU ASSOCIATES
without the use of vibration. Fill placed at least 2 ft above the prepared subgrade elevation should be
placed in a maximum 10-inch thick, loose measure, lift. Each lift should be compacted to at least 95
percent of the maximum dry density as determined by the ASTM D1557 test procedure.
3.2.6 SETTLEMENT
The site is currently situated between elevation 8 and 11 ft (Thurston County 2009). According
to drawings provided by Miller-Hull, the finished grade of the proposed HOCM is planned at elevation 13
ft. Moderately compressible soil and significant deposits of wood debris are present below the site. The
placement of fill to raise site grades will lead to settlement of these soil layers.
We estimate that between 1 and 2 inches of primary consolidation and immediate settlement may
occur if the site is raised by 2 ft. It is anticipated that 25 percent of the settlement described above will
occur as the fill is placed. The remaining 75 percent of settlement described above will occur within 2 to
4 months after completion of fill placement.
In addition to the settlement described above, secondary consolidation of the wood chips due to
decomposition and reorientation will occur during the design life of the improvements. Based on the
conditions observed in the explorations, we estimate that between 8 and 10½ ft wood debris underlies all
or portions of the site. The amount of secondary settlement is expected to vary according to the thickness
of the wood debris, and the effects of any preloading due either to past site activities or as part of initial
site construction activities. Given the uncertainty involved in the assessment of secondary consolidation
settlement, we estimate that between 3 and 12 inches or more of post-construction secondary settlement
of the wood debris could occur during the design life of the improvements.
The placement of permanent fill to raise site grades or temporary preloading by stockpiles of fill
would reduce the amount of post-construction secondary consolidation, however, it would not completely
eliminate the potential settlement of the ground surface due to secondary consolidation.
Our scope of services did not include consolidation testing of the wood debris. If the first-floor is
supported by a slab-on-grade floor and no ground improvement is implemented, we recommend that the
design build team consider completing consolidation testing to further characterize the compressibility
characteristics of the wood waste.
3.3 SEISMIC DESIGN CONSIDERATIONS
The Pacific Northwest is seismically active and the site could be subject to ground shaking from a
moderate to major earthquake. Consequently, earthquake shaking should be anticipated during the design

3/19/09 Y:\258\017.010\R\HOCM_Rpt.doc 3-6 LANDAU ASSOCIATES
life of the proposed HOCM and the HOCM should be designed to resist earthquake loading using
appropriate design methodology.
According to Palmer et al. (1999), the proposed HOCM site is considered to have a high
susceptibility for liquefaction during a major seismic event. During the 1949 Olympia Earthquake
(measured peak ground acceleration of 0.30g in downtown Olympia), up to 5 inches of liquefaction
induced settlement occurred in the Port of Olympia area (Palmer et al. 1999).
3.3.1 CODE BASED SEISMIC DESIGN
Seismic design of the proposed HOCM will be in accordance with the 2006 IBC (ICC 2006).
The near-surface soil at the site is liquefiable. According to the 2006 IBC, the liquefiable soil profile that
underlies the site classifies as Site Class F, per Table 1613.5.2. For Site Class F soil profiles, the 2006
IBC requires that the Site Coefficients, Fa and Fv, be determined in accordance with the Minimum Design
Loads of Buildings and Other Structures (ASCE 7-05) published by the American Society of Civil
Engineers (ASCE 2005).
According to Section 11.4.7 of ASCE 7-05, a dynamic site response analysis is required to
determine the site coefficients, Fa and Fv, for Site Class F and for structures with periods of vibration
greater than 0.5 seconds. At the time this report was prepared, the period of vibration for the HOCM
building had not been determined. If the HOCM building has a period of vibration less than or equal to
0.5 seconds, Section 20.3.1 of ASCE 7-05 allows for the site coefficients to be equal to the site
coefficients if the project site were not susceptible to liquefaction. In the absence of liquefaction, the site
would classify as Site Class E (Soft Soil Profile).
Assuming a period of vibration of the structures of less than or equal to 0.5 second, the following
spectral accelerations for a 2 percent probability of exceedance in 50 years should be used to determine
the maximum considered earthquake spectral acceleration (USGS 2008):
Spectral Acceleration for short periods (SS): 116.0% of gravity (1.16g) Spectral Acceleration for a 1-second period (S1): 43.5% of gravity (0.44g)
For a Site Class E, a value of 0.90 should be used for site coefficient Fa, and 2.4 for site coefficient Fv.
The design spectral response accelerations can be taken as 2/3 of the values determined above.
3.3.2 LIQUEFACTION AND LATERAL SPREADING ANALYSIS AND RESULTS
Liquefaction is defined as a significant rise in pore water pressure within a soil mass caused by
earthquake-induced cyclic shaking. The shear strength of liquefiable soil is reduced during large and/or

3/19/09 Y:\258\017.010\R\HOCM_Rpt.doc 3-7 LANDAU ASSOCIATES
long-duration earthquakes as the soil consistency approaches that of a semi-solid slurry, which can result
in significant and widespread structural damage if not properly mitigated. Deposits of loose, granular soil
below the water table are most susceptible to liquefaction, although non-plastic and low-plasticity silts
and clays are also considered to be susceptible to liquefaction.
Geotechnical data from the deep explorations (B-2, CPT-1, and CPT-3) was analyzed to estimate
the factor of safety against liquefaction occurring at the site. The potential for liquefaction was assessed
using the “modified simplified procedure” presented by Youd et al. (2001). Where appropriate,
recommendations for liquefaction susceptibility evaluations proposed by Idriss and Boulanger (2008)
were incorporated into our analysis.
The liquefaction susceptibility of the cohesive soils was assessed using the method proposed by
Bray and Sancio (2006). According to the criteria described by Bray and Sancio, any fine-grained deposit
with a plasticity index less than 12 and a water content greater than 85 percent of the liquid limit is
potentially susceptible to liquefaction. In the CPT soundings, fine-grained soil with an interpreted “Soil
Behavior Type Index,” Ic, of 2.6 or less is assumed to be susceptible to liquefaction. The depths where
the interpreted “Soil Behavior Type Index” is greater than 2.6 generally coincide with the depths in the
borings where the soil has a plasticity index greater than 12.
For this study, the maximum depth of liquefaction was assumed to be 70 ft. This depth is slightly
less than the depth established by the WSDOT Geotechnical Design Manual (WSDOT 2008a).
The potential for, and magnitude of, lateral spreading was assessed using an empirical approach
developed by Youd et al. (2002).
3.3.2.1 Peak Ground Acceleration and Magnitude for Analysis
According to the 2006 IBC, neglecting liquefaction, the soil that underlies the HOCM site
classified as Site Class E (Soft Soil Profile) per Table 1613.5.2 (assuming a structure period of vibration
equal to or less than 0.5 seconds). For Type E soils, the maximum considered peak horizontal ground
acceleration for liquefaction and lateral spread analysis is equal to 0.40SDS, or 0.28g. An approximate
magnitude 7.0 earthquake producing a peak horizontal ground acceleration of 0.28g was used in the
liquefaction and lateral spread analyses at the HOCM site.
3.3.2.2 Liquefaction Analysis Results
The computed factor of safety against liquefaction at the proposed HOCM site indicated that
much of the coarse-grained soil fill and upper recessional outwash below the groundwater table is less

3/19/09 Y:\258\017.010\R\HOCM_Rpt.doc 3-8 LANDAU ASSOCIATES
than 1.0. Therefore, it is anticipated that much of the coarse-grained fill and upper recessional outwash
deposits are susceptible to liquefaction during the design event.
Based on the results of the laboratory testing of the samples obtained from the borings, most of
the fine-grained soil encountered within the intermediate recessional deposits meet the criteria defined by
Bray and Sancio and are potentially susceptible to liquefaction. Most of the soil located within the
intermediate recessional outwash has a factor of safety of less than 1.0, and may liquefy during the design
seismic event. The lower recessional outwash unit is located below the maximum considered depth of
liquefaction.
3.3.2.3 Liquefaction Induced Settlement
The amount of post-liquefaction ground subsidence during the design seismic event was
estimated using an empirical method developed by Zhang et al. (2002) which is based on areas that had
undergone liquefaction. The magnitude of post-liquefaction ground subsidence may be about 7 to 8
inches. The actual magnitude and extent of liquefaction-induced settlement will depend on many factors,
including the duration and intensity of the ground shaking during the seismic event, and local soil and
groundwater conditions. Therefore, the magnitude of liquefaction-induced settlement may vary from that
estimated above.
3.3.2.4 Lateral Spreading
Lateral spreading is a phenomenon where lateral ground displacements occur as a result of soil
liquefaction. Lateral spreading is typically observed on very gently sloping ground or on virtually level
ground adjacent to slopes or shorelines. Lateral spreading tends to break the upper soil layers into blocks
that progressively move downslope during an earthquake. Large fissures at the head of the lateral spread
are common, as are compressed or buckled soil at the toe of the soil mass. Lateral spreading has been
shown to occur if there are liquefiable soil layers located within a depth equal to twice the depth of the
adjacent channel, which for this project is East Bay (Idriss and Boulanger 2008).
The potential for lateral spreading of the banks along the East Bay was analyzed using an
empirical procedure presented by Youd et al. (2002), which is based on case histories of observed lateral
spreading at sites with liquefiable soil. Studies at sites where lateral spreading has occurred have shown
that the magnitude of lateral spreading is typically within a range of one-half to twice the predicted
movement.
According to Finlayson (2005), East Bay is less than 6 ft deep (i.e. elevation -6 ft) immediately to
the northeast of the project site. For the purpose of this analysis, the slope leading into East Bay was

3/19/09 Y:\258\017.010\R\HOCM_Rpt.doc 3-9 LANDAU ASSOCIATES
assumed to be inclined at 1¾H:1V (horizontal to vertical). At the east boundary of the proposed HOCM
building, the empirical method predicts horizontal movements during the design earthquake of about 1½
ft. At the west edge of the proposed building, the empirical method predicts lateral movement of about 1
ft during the design earthquake. The actual magnitude and extent of lateral spreading will depend on
many factors, including the duration and intensity of the ground shaking, and local soil and groundwater
conditions. Therefore, actual ground movements may vary from those estimated above.
The empirical approach can be conservative, depending on soil properties and site conditions.
Other advanced methods can be used to better estimate lateral spreading, but require significant effort that
is not in our scope.
3.3.2.5 Interpretation of Results and Mitigation
At the proposed HOCM, there is a high potential for widespread liquefaction during the design
earthquake which will lead to ground subsidence and lateral spreading. Based on the explorations and
engineering analysis completed for this project, liquefiable soil could extend to depths of about 70 ft
below the existing ground surface (i.e. about elevation -60 ft).
If deep foundations are utilized to support the HOCM building, the deep foundations would need
to extend below the liquefiable soil. The liquefaction of soil above the pile tip elevation will lead to the
creation of downdrag loads on the building foundation elements. Downdrag loads could lead to pile
damage (due to possibly exceeding the structural capacity of the pile) and increased foundation
settlement. Ground subsidence also had the potential of damaging slab-on-grade foundations and
damaging connections between the pile-supported building and utilities extending outside of the building.
Potential methods to mitigate against liquefaction at the site include: improving the soils such that
liquefaction does not occur or allowing liquefaction to occur and designing the improvements to tolerate
the consequences of liquefaction and, if necessary, repairing areas of damage caused by liquefaction
induced settlement.
Given the anticipated depth of piles needed to support the proposed HOCM, improving the soils
such that liquefaction does not occur is a feasible alternative for this project. Recommendations for
ground improvement are provided in the following section of this report.
3.4 MAT FOUNDATION ALTERNATIVE
As previously described in this report, the near-surface soil at the site is liquefiable and there is a
significant amount of wood debris which could lead to intolerable settlement over the design life of the

3/19/09 Y:\258\017.010\R\HOCM_Rpt.doc 3-10 LANDAU ASSOCIATES
proposed HOCM. These factors effectively eliminate the alternative of constructing the proposed HOCM
on shallow or mat foundations without ground improvement.
3.4.1 GROUND IMPROVEMENT
Ground improvement is typically designed by the contractor. Based on our conversations with
Hayward Baker (Koelling 2009), a local ground improvement contractor, ground improvement at the site
would likely consist of vibro-replacement stone columns.1 In order to reduce the amount of spoils
brought to the surface, it is anticipated that the vibro-replacement stone columns utilized at the project site
would be installed using the dry, bottom feed method. In order to bridge over the wood debris, the upper
portion of the stone columns (i.e. the portion of the stone column passing through the wood debris) would
be amended with Portland cement to create a vibro concrete columns (VCC).2 The placement of several
feet of import structural fill over the top of the VCC would allow for the HOCM to be supported by a mat
foundation.
Installation of stone columns through the entire liquefiable zone (70 ft depth) is likely not cost
effective. We recommend that, at a minimum, stone columns be installed through the sandy to very sandy
silt layer which is present between 37½ to 45½ ft BGS. If stone columns are installed to 45 ft BGS,
approximately 25 ft of liquefiable soil zone would be present below the improved zone. According to
data collected by Ishihara (1985), ground surface manifestation of a 25-ft liquefied zone is not evident if
the thickness of non-liquefiable near-surface soil (i.e. improved ground) is greater than about 45 ft.
In order to mitigate against the liquefaction risk, the replacement ratio (percentage of total area
composed of stone columns) of the stone columns should increase the density/consistency of the
improved soil such that the soil has a minimum factor of safety of at least 1.2 for a magnitude 7.0
earthquake generating a 0.28g peak ground acceleration.
At the time this report was prepared, the proposed clean-up methodology of the contaminated soil
was unknown to use. If the contaminated soil is capped and left in place, the construction of vibro-
replacement stone columns installed utilizing the dry, bottom-feed method will bring a limited amount of
contaminated soil/groundwater to the surface. Spoils with contaminant concentrations above the MTCA
site clean-up standards will need to be removed and disposed of at an approved location.
1 Detailed information regarding vibro-replacement stone columns, including diagrams describing the installation techniques, are provided on Hayward Baker’s webpage. http://www.haywardbaker.com/
2 The cement content of the VCC is dependent on the thickness and composition of the wood debris. The ground improvement contractor would need to complete additional explorations at the site to further characterize the wood waste and to collect samples for laboratory testing to determine the optimum cement content.

3/19/09 Y:\258\017.010\R\HOCM_Rpt.doc 3-11 LANDAU ASSOCIATES
3.4.2 MAT FOUNDATION BEARING PRESSURE AND SUBGRADE PREPARATION
At the time this report was prepared, the load of the proposed HOCM was not available to us (the
loads are anticipated to be low). The ground improvement subcontractor should be notified of the
anticipated loads and settlement criteria, and the ground improvement should be designed to meet the
criteria established by the structural engineer. For frost protection purposes, the exterior edge of the mat
foundation should be situated at least 1½ ft below the lowest adjacent grade.
After completion of the ground improvement, we recommend that a minimum of 12 inches of
import structural fill be placed over the improved subgrade to provide a working surface. The ground
improvement contractor may specify a larger thickness of fill over the improved ground in order to bridge
the load between the VCC. The import structural fill should consist of a well-graded, granular material
with less than 10 percent fines (material passing a U.S. No. 200 sieve) with a maximum particle size of 3
inches. The moisture content should be within minus 2 percent to plus 1 percent of the optimum moisture
content. If wet weather construction is anticipated, the amount of fines should not exceed 5 percent based
on the minus ¾-inch fraction.
Prior to placing the working surface/bridging layer, the exposed subgrade should be prepared in
accordance with the recommendations contained in Section 3.2.3 of this report. The initial lifts of fill
over the prepared subgrade should be placed in relatively uniform horizontal lifts, not exceeding 6 inches
thick, loose measure. The initial lifts of fill should be compacted with multiple passes of a large, steel
drum roller without the use of vibration. Fill placed at least 2 ft above the prepared subgrade elevation
should be placed in maximum 10-inch thick, loose measure, lifts. Each lift should be compacted to at
least 95 percent of the maximum dry density as determined by the ASTM D1557 test procedure. Trench
backfill should be placed in relatively uniform horizontal lifts, not exceeding 10 inches thick, loose
measure. Each lift should be compacted to at least 95 percent of the maximum dry density as determined
by the ASTM D1557 test procedure.
3.4.3 CAPILLARY BREAK
A minimum of 4 inches of clean, free-draining material, such as washed gravel, should be placed
beneath the mat foundation to act as a capillary break. Washed gravel should consist of clean, durable
rock that is fairly well-graded between coarse and fine, has a maximum particle size of ¾ inches, and has
less than 5 percent sand (material passing a U.S. No. 4 sieve). A condensation barrier should be placed
beneath interior slab-on-grade floors to prevent condensation of water vapor on the bottom of the floor
slab from wicking up through the floor slab. The condensation barrier should consist of reinforced,

3/19/09 Y:\258\017.010\R\HOCM_Rpt.doc 3-12 LANDAU ASSOCIATES
minimum 10-mil membrane with tape sealed joints. We recommend an inspection of the condensation
barrier to verify that all openings have been properly sealed.
If the structural engineer determines that a layer of granular material to facilitate concrete curing
is necessary, the layer of granular material should consist of a compacted, 4-inch-thick layer of clean,
crushed rock material, such as ¾-inch minus crushed rock. Care should be taken during construction to
prevent water penetration into this layer that could become trapped between the slab and vapor retarder.
Trapped water beneath the slab may lead to problems with interior flooring materials.
3.4.4 MAT FOUNDATION DEFLECTIONS
For deflection analysis of the mat foundation, we recommend using a vertical coefficient of
subgrade reaction, K01 of 150 pounds per cubic inch (pci) for a one-foot square plate. This value assumes
that at least 2 ft of compacted structural fill underlies the slab-on-grade. The coefficient of vertical
subgrade reaction can be proportioned for the diameter slab’s reaction area by the expression:
K0 = [(B+1)/(2B)]2 K01
where B is the effective diameter of the slab’s reaction area, in feet, which is a function of both the
thickness and flexural strength of the slab, and K0 itself. Calculation of the value of B is an iterative
process. We suggest using an initial value of 15 times the slab thickness.
3.4.5 RESISTANCE TO LATERAL LOADS
Resistance to lateral loads may be assumed to be provided by friction acting on the base of mat
foundation and by passive lateral earth pressures acting against the sides of mat foundation. An ultimate
coefficient of sliding resistance of 0.50, applied to the vertical dead loads only, may be used to compute
frictional resistance. For design purposes, the passive resistance of undisturbed, medium dense to very
dense recessional outwash or properly compacted structural fill placed against the sides of foundations
may be considered equivalent to a fluid with a density of 250 pounds per cubic foot. The upper 1 ft of
passive resistance should be neglected in design if not covered by pavement or floor slabs. The value for
coefficient of sliding resistance does not include a factor of safety, and the value for the foundation
passive earth pressure has been reduced by a factor of 2.0 to limit deflections to less than 1 percent of the
embedded depth.

3/19/09 Y:\258\017.010\R\HOCM_Rpt.doc 3-13 LANDAU ASSOCIATES
3.4.6 FOUNDATION DRAINAGE CONSIDERATIONS
Drainage should be provided for all foundations and floor slabs lower than the adjacent exterior
grade. The drainage system should consist of a minimum 4-inch-diameter, smooth-walled, heavy-duty,
minimum Schedule 40 PVC perforated pipe (with the perforations placed downward) in a minimum 12-
inch diameter envelope of 1-inch minus drain gravel. The drain gravel should completely surround the
perforated drain pipe and be completely surrounded by a non-woven geotextile such as Mirafi 140N, or
equivalent. The top of the perforated pipe should be no higher than the top of the adjacent footing.
Foundation drains should discharge into the storm system or an approved location. Roof downspouts
should not be introduced into the footing drain, but discharged directly into the site stormwater system or
other appropriate outlet by means of a tightline-type system. To reduce the possibility of water ponding
and infiltrating into the subsurface near foundations, exterior grades should slope to promote runoff away
from the structures.
3.5 DEEP FOUNDATION ALTERNATIVE
The site is underlain by compressible and liquefiable fill and recessional deposits. Unless ground
improvement is utilized to reduce the liquefaction potential and to reduce undesirable foundation
settlement, the HOCM building will need to be supported on deep foundations bearing below the lowest
liquefiable layer. To provide proper support of the building, we recommend that the deep foundations be
installed into the medium dense to very dense, recessional outwash deposits (i.e. lower recessional
deposits) encountered about 73 ft BGS (i.e. at about elevation -62 ft).
Augercast and driven piles are pile types typically used to support buildings in geologic
conditions similar to what is observed at the site. At the HOCM site, augercast piles have the following
limitations:
Augercast piles are typically not feasible if the length to diameter ratio of the pile is greater than 30. Augercast piles have a typical maximum diameter of about 2 ft, consequently, the maximum length of augercast piles is 60 ft (less than the minimum length of piles needed at the site. Longer augercast piles can be constructed, however, an experienced augercast pile contractor and extensive continuity testing will be required.
At the time this report was prepared, the proposed clean-up methodology of the contaminated soil was unknown to use. If the contaminated soil is capped and left in place, the construction of augercast piles will likely bring contaminated soil/groundwater to the surface. Spoils with contaminant concentrations above the MTCA site clean-up standards will need to be removed and disposed of at an approved location.
The wood debris encountered in our soil borings is loose, fibrous, and has an open structure. The open structure of the fibrous material could lead to the interconnectivity of the augercast piles and the exposure of the steel reinforcing cage as the grout seeps away from the pile. If this were to occur, the augercast pile capacity could be severely compromised. To mitigate

3/19/09 Y:\258\017.010\R\HOCM_Rpt.doc 3-14 LANDAU ASSOCIATES
against this, it is anticipated that the upper 10 to 15 ft of the augercast pile would need to be cased.
3.5.1 DRIVEN PILES
Because of the limitations described above, it is our opinion that driven pipe or driven,
prestressed concrete piles may be more feasible pile types for this project. Axial and uplift capacities for
18- and 24-inch diameter piles installed to elevation -70 ft are provided in the following section of this
report.
3.5.1.1 Vertical Axial Capacity
Piles to support the proposed HOCM building should be designed for both service and seismic
loading conditions. Applied loads for the service loading condition include dead and live loads. During
service loading, the axial capacity of a single pile is equal to the tip capacity and the skin capacity
developed along the entire length of the pile. Applied loads for the seismic loading case typically include
dead loads and inertial loading caused by the earthquake shaking. The axial capacity of a single pile is
assumed to be equal to the tip capacity and the portion of the skin capacity developed below the lowest
liquefiable layer. For both the service and seismic loading condition, downdrag loads (see Section
3.5.1.2) should also be included if the structure is not able to settle after the application of liquefaction-
induced downdrag loads.
The allowable axial capacities for 18- and 24-inch diameter, driven pipe piles installed to
elevation -70 ft are presented in the following table. The allowable pile capacities assume that the steel
pipe piles are driven closed-ended. For the service loading condition, the allowable pile capacity
presented in the table below include a factor of safety of at least 2.5 on the calculated ultimate capacities.
For seismic loading conditions, the allowable pile capacities include a factor of safety of at least 1.5 on
the calculated ultimate capacity. Interbeds of very stiff to hard, silt or clay are present within the lower
recessional deposits. Piles bearing in the interbeds will have a reduced pile capacity. The allowable pile
capacities presented in the table below account for the presence of these interbeds.
ALLOWABLE AXIAL PILE CAPACITY (TONS)
Loading Condition Pile Type
Pile Diameter (inches) Service Seismic
18 97 60 Steel Pipe Pile 24 140 100
18 120 66 Prestressed Concrete
24 170 106

3/19/09 Y:\258\017.010\R\HOCM_Rpt.doc 3-15 LANDAU ASSOCIATES
Provided the piles have a center-to-center pile spacing of at least 3D, where D is the diameter of
the piles, the pile group capacity can be taken as the sum of the individual pile capacities. If the center-to-
center pile spacing is less than 3D, the individual pile capacities should be reduced accordingly.
If a WEAP™ analysis is used to calculate the ultimate pile capacity during pile driving, the
ultimate pile capacity should be at least two times the allowable pile capacity during service loading
summarized in the table above. Regardless of the results of the WEAP™ analysis, the piles should be
driven to at least elevation -70 ft.
3.5.1.2 Downdrag Loads
After a significant earthquake event where liquefaction has occurred, post-liquefaction ground
subsidence accumulates as downdrag along the length of the pile. Downdrag will lead to either increased
foundation settlement or additional axial loads (i.e. downdrag loads) applied to the pile and the bearing
soil. If the foundation is allowed to settle as the downdrag loads are applied (i.e., if the HOCM can
tolerate additional total and differential settlement), the pile will shed the downdrag load. If the structure
is unable to tolerate the additional total or differential settlement, the piles will need to be installed deeper
than elevation -70 ft and the allowable pile capacity may need to be reduced. The piles should be
structurally designed to accommodate the downdrag loads developed along the length of the pile if
additional total or differential settlement is unacceptable. The table below summarizes the upper bound
estimate of downdrag loads of piles driven to elevation -70 ft.
ALLOWABLE AXIAL PILE CAPACITY (TONS)
Downdrag Load Pile Type
Pile Diameter (inches) (tons)
18 120 Steel Pipe Pile 24 160
18 140 Prestressed Concrete
24 185
Downdrag can also occur if structural fill is utilized to raise site grades after pile installation.
Consequently, pile foundations should not be installed until most of the settlement created by raising site
grades has occurred.

3/19/09 Y:\258\017.010\R\HOCM_Rpt.doc 3-16 LANDAU ASSOCIATES
3.5.1.3 Deep Foundation Settlement
Based on the subsurface conditions encountered at the site, settlement of the piles would typically
be due to a combination of elastic compression of the pile and elastic settlement of granular soils and very
stiff to hard low plasticity silts encountered below a depth of two-thirds the pile length.
Pile settlement is dependent on a number of factors including: the size of the piles, the number of
piles in the pile group, the pile spacing, the pile tip elevation, the axial load per pile, and other factors.
For the purpose of developing an estimate of pile group settlement, the following assumptions were
made:
24-inch diameter steel pipe piles
Pile tip located at approximately elevation -70 ft
2 by 2 pile group
Pile spacing of 3 times the pile diameter (pile group width of 5.3 ft)
Axial load per pile of 140 tons (pile group load of 560 tons).
We estimate that ½ to 1 inch of settlement will occur during service loading conditions. After a
seismic event which leads to downdrag loading, an additional 1 to 1½ inches of settlement may occur.
Differential settlement between adjacent pile caps may be as high as 50 percent of the total settlement as
described above. It is anticipated that a majority of the settlement described above will occur as the
building and downdrag loads are applied to the pile. Pile group settlement should be reevaluated by the
design build team once the pile size, pile layout, pile tip elevation, and pile load have been determined.
3.5.1.4 Uplift Capacity
The uplift capacity of a pile group should be taken as the minimum of the uplift resistance of the
pile group considered as a block or the sum of the individual pile uplift capacities. The uplift capacity of
a pile group can be taken as the weight of the soil located within the pile group and the weight of the
piles. We recommend assuming that the effective unit weight of the soil is 53 pcf.
For service loading conditions, the uplift capacity of a single pile can be taken as the skin friction
capacity taken along the entire length of the pile and the weight of the piles. For seismic loading
conditions, the uplift capacity of a single pile can be taken as the skin friction capacity developed below
the lowest liquefiable layer and the weight of the pile. The table below summarizes the allowable uplift
capacities for piles driven to elevation -70 ft.

3/19/09 Y:\258\017.010\R\HOCM_Rpt.doc 3-17 LANDAU ASSOCIATES
ALLOWABLE UPLIFT CAPACITY OF A SINGLE PILE (TONS)
Loading Condition Pile Type
Pile Diameter (inches) Service Seismic
18 60 15 Steel Pipe Pile 24 80 20
18 83 18 Prestressed Concrete
24 110 20
For the service loading condition, the allowable uplift capacity includes a factor of safety of 3.0.
For the seismic loading condition, the allowable uplift capacity presented above includes a factor of safety
of at least 2. The weight of the pile is not included in the uplift capacities presented in the table above.
3.5.1.5 Lateral Capacity
The lateral capacity of piles is predominately governed by soil located within 10 Dp, where Dp is
the pile diameter in ft, of the ground surface. The following table provides preliminary input soil
parameters for an LPILE, or other similar computer program, analysis of lateral load behavior during
static loading conditions.
RECOMMENDED INPUT SOIL PARAMETERS FOR LATERAL LOAD ANALYSIS DURING STATIC LOADING
Depth (ft BGS)(a
Depth (in BGS)(a)
Soil
Type/(Soil Profile
Number)
Soil Unit
Weight (pci)
Soil Internal Angle of Friction
(degrees)
Soil Cohesion
(psi)
k-value (pci)
E50 0 to 4 0 to 48 Sand/(4) 0.069 34 0 90 ---
4 to 7½ 48 to 90 Sand/(4) 0.031(b) 31 --- 20 ---
7½ to 16(c) 90 to 192(c) ---(c) 0.011(b)(c) ---(c) ---(c) ---(c) ---(c)
16 to 33 216 to 396 Sand/(4) 0.034(b) 34 --- 60 ---
33 to 70 396 to 840 Clay/(1) 0.031(b) --- 6.94 --- 0.010
70 to 100 840 to 1,200 Sand/(4) 0.036(b) 35 --- 125 ---
Notes: (a) Depth of soil layers should be taken from the top of the former East Bay Warehouse slab-on-grade floor. (b) Bouyant Unit Weight (c) Wood Waste from 7½ to 16 ft BGS. No contribution to lateral capacity from wood waste should be accounted for in design.
As discussed in Section 3.3.2.2 of this report, portions of the near-surface soil may liquefy during
the design earthquake. To model this behavior, a second set of input soil parameters should be assigned
to the liquefiable soil layers. The input soil parameters for LPILE™ analysis of lateral load behavior
during seismic loading is provided in the following table. The seismic loading soil parameters were

3/19/09 Y:\258\017.010\R\HOCM_Rpt.doc 3-18 LANDAU ASSOCIATES
developed using estimated residual soil strength parameters for the liquefied layers and the saturated soft
clay soil model used by LPILE™. This approach is considered an approximation of actual conditions.
The validity of this technical approach was confirmed by one of the developers of the LPILE™ computer
program (Wang and Reese 1998). The residual soil strength parameters were determined using an
approach developed by Idriss and Boulanger (2007).
RECOMMENDED INPUT SOIL PARAMETERS FOR LATERAL LOAD ANALYSIS DURING SEISMIC LOADING
Depth (ft BGS)(a
Depth (in BGS)(a)
Soil
Type/(Soil Profile
Number)
Soil Unit
Weight (pci)
Soil Internal Angle of Friction
(degrees)
Soil Cohesion
(psi)
k-value (pci)
E50 0 to 4 0 to 48 Sand/(4) 0.069 34 --- 90 ---
4 to 7½ 48 to 90 Clay/(1) 0.031(b) --- 0.5 --- 0.020
7½ to 16(c) 90 to 192(c) ---(c) 0.011(b)(c) ---(c) ---(c) ---(c) ---(c)
16 to 27 192 to 324 Sand/(4) 0.034(b) 34 --- 60 ---
27 to 33 324 to 396 Clay/(1) 0.034(b) --- 8.33 --- 0.005
33 to 37 396 to 444 Clay/(1) 0.031(b) --- 6.94 --- 0.010
37 to 56 444 to 672 Clay/(1) 0.031(b) --- 3.13 --- 0.020
56 to 60 672 to 720 Clay/(1) 0.031(b) --- 6.94 --- 0.010
60 to 70 720 to 840 Clay/(1) 0.031(b) --- 2.5 --- 0.020
70 to 100 840 to 1,200 Sand/(4) 0.036(b) 35 --- 125 ---
Notes: (a) Depth of soil layers should be taken from the top of the former East Bay Warehouse slab-on-grade floor. (b) Bouyant Unit Weight (c) Wood Waste from 7½ to 16 ft BGS. No contribution to lateral capacity from wood waste should be accounted for in design.
To account for group effects, the soil resistance, p, shall be reduced as specified in the following
table (WSDOT 2008a). The multipliers (Pm) are a function of the center-to-center spacing of the piles
(expressed in multiples of pile diameter, D) in the group in the direction of the loading. Values for
intermediate pile spacing values may be interpolated from the values provided in the table below.
PILE LOAD MODIFIERS, Pm
Pile Center to Pile Load Modifiers, Pm
Center Spacing Row 1 Row 2 Row 3
2D 0.45 0.33 0.25
3D 0.70 0.50 0.35
5D 1.00 0.85 0.70

3/19/09 Y:\258\017.010\R\HOCM_Rpt.doc 3-19 LANDAU ASSOCIATES
It should be noted that the input soil parameters for lateral load analysis during seismic loading
are based on the conditions observed in boring B-3 and sounding CPT-2, which were completed in the
footprint of the proposed HOCM. The conditions observed in the explorations completed outside of the
HOCM building indicated the potential for more extensive liquefaction and a different set of input soil
parameters for lateral load analysis during seismic loading may be appropriate. We recommend that the
design-build team consider completing another deep exploration in the eastern third of the proposed
HOCM to evaluate the liquefaction potential at this location.
3.5.1.6 Impact of Lateral Spreading on Pile Capacity
Lateral spreading will impose lateral pressures on the piles. We recommend that a force based
approach be utilized to evaluate the lateral pressures on the piles due to lateral spreading. In the force
based approach, the lateral pressures exerted on the piles are as follows (WSDOT 2008a):
Non-liquefied crustal layers (i.e. layers located above the lowest liquefiable layer with the potential to lead to lateral spreading) exert full passive pressure on each pile.
Liquefied soil exerts a pressure equal to 30 percent of the total overburden pressure.
Based on the conditions observed in boring B-3 and sounding CPT-2, the only liquefiable soil
with the potential to lead to lateral spreading is between about 4 and 7½ ft BGS. Figure 3 presents the
lateral pressure imposed on a deep foundation due to lateral spreading. The lateral pressures described
above should be assumed to act over one pile diameter.
The conditions observed in the explorations completed outside of the HOCM building footprint
(B-1, B-2, and CPT-3) indicated the potential for more extensive liquefaction and lateral spreading.
Sounding CPT-1 was advanced in the eastern third of the proposed HOCM structure. This exploration
was terminated at a shallow depth due to hitting an obstruction and deep subsurface information was not
obtained. If the conditions observed in the eastern third of the HOCM are similar to the conditions
observed outside of the footprint of the HOCM structure, additional liquefaction and lateral spreading
could occur in this portion of the building. This could lead to increased lateral pressures on the piles
located in this area. We recommend that the design-build team consider advancing another deep (i.e. 40
to 50 ft) exploration in this portion of the structure to further evaluate the liquefaction and lateral spread
potential and its impact on deep foundations.

3/19/09 Y:\258\017.010\R\HOCM_Rpt.doc 3-20 LANDAU ASSOCIATES
3.5.1.7 Pile Construction Considerations
Driven piles to support the HOCM are expected to consist of closed-ended, steel pipe or
prestressed concrete piles. The piles will be predominately driven through loose to dense sand with
variable silt content and medium stiff to very stiff silt.
Pile driving is a dynamic process and it is not uncommon for pile tip depths, as determined by
driving resistance, to differ from the pile tip depths estimated from static methods of analysis. We
recommend driving several test piles, evenly spaced throughout the footprint of the HOCM, to evaluate
the driving criteria and required pile length prior to installation of production piles. The test piles should
be driven utilizing the same methods and equipment as the production piles. Test piles should be sized at
least 20 ft longer than the pile length recommended in the preceding sections. Test piles may be
incorporated in the final structure if they meet the required driving resistance. Once the driving criteria
and tip elevation is established, production piles may be driven to the minimum tip elevation established
by the test pile program.
Between about 5 and 15 ft BGS, wood debris was encountered in our explorations. The wood
debris encountered in our explorations was observed to consist of relatively fine wood fragments
(sawdust); however, larger pieces of wood or logs may be present in the debris. If encountered, logs
could obstruct pile driving and possibly result in damage to the piles. In a boring advanced by AMEC
Earth and Environmental (2007) immediately to the west of the HOCM site, refusal of continued drilling
was encountered within the wood debris. If an obstruction is encountered and the pile cannot be
advanced, or the pile becomes damaged, the pile may need to be abandoned and relocated. Abandoned
piles should either be extracted or cut off at least 3 ft below the bottom of the pile cap. The use of a
conical driving pile tip may be considered to aid in penetrating through obstructions, if encountered.
Pile driving should be accomplished in accordance with Section 6-05 of the 2008 Standard
Specifications for Roadway, Bridge, and Municipal Construction (WSDOT Standard Specifications;
WSDOT 2008b). The hammer chosen to drive the pile should have a rated energy meeting the
requirements in Section 6-05.3(9)B of the 2008 WSDOT Standard Specifications. Because of the
expected small number of piles, the required driving criteria may be determined in accordance with
Section 6-05.3(12) of the 2008 WSDOT Standard Specifications. Alternatively, a WEAP™ analysis
could be completed to evaluate pile driving criteria.
A WEAP™ analysis could also be utilized to evaluate the pile driving equipment required to
drive the pile to the selected depth. The ultimate pile capacity calculated using static pile capacity
estimation techniques is an input in WEAP™ analysis. It should be noted that the ultimate axial pile
capacity presented in Section 3.5.1.1 of this report have been reduced to account for weaker soils present
below the estimated pile tip elevation. Additionally, dense to very dense sand and gravel layers are

3/19/09 Y:\258\017.010\R\HOCM_Rpt.doc 3-21 LANDAU ASSOCIATES
present above the anticipated pile tip elevation, including immediately below the wood debris. The
WEAP™ analysis should account for these factors.
After pile driving has begun, the pile should be driven continuously until the required ultimate
bearing capacity is achieved. The only allowed pauses during pile driving are for splicing, mechanical
problems, or other unforeseen events. It has been our experience that when driving in saturated, granular
deposits, which are present at the proposed pile tip elevation, piles often do not achieve the required
ultimate capacity as calculated from dynamic pile driving equations because of reduced side friction due
to “liquefaction” of the soil around the pile during driving. This situation is usually evident when the
driving resistance (blows per foot) remains fairly constant with depth. If this is observed to occur during
driving of piles, the pile could be redriven after a waiting period of at least 24 hours to evaluate the effect
of soil setup. The purpose of the waiting period is to allow dissipation of excess pore water pressure in
the soil around the pile. After the waiting period, the pile should be redriven no more than 3 inches. If
the pile fails to achieve the required capacity after the redrive, then the pile would need to be lengthened
and the driving resumed. Alternatively, a dynamic analysis, such as CAPWAP™, could be performed to
evaluate the pile capacity.
Given the expected range of pile capacities, a hammer with a relatively high-rated energy will be
necessary to drive the piles to the required depth. Significant levels of vibration and soil densification can
occur within about 50 to 100 ft of pile driving. Nearby utilities and structures could be negatively
impacted as a result of pile driving. The contractor should evaluate the impact of pile driving on nearby
settlement sensitive structures.
Since the effect of pile driving can be felt several hundred feet away from the pile, we
recommend that the City complete a preconstruction survey of all non-port owned structures within a
distance of at least 250 ft of pile driving operations. The purpose of the preconstruction survey is to
document existing conditions, such as significant cracks and indications of pre-existing settlement. The
preconstruction survey should be completed in the presence of the effected parties and consist of
photographs and/or video tape, notes, and sketches of preexisting conditions. In addition, the City should
consider vibration monitoring during pile driving to document vibration levels at nearby structures.
We recommend that the installation of driven piles be observed by a geotechnical or civil
engineer with pile driving experience to evaluate the contractor's construction procedure, collect and
interpret the installation data, monitor variations in subsurface conditions, and confirm the required
penetration depths.

3/19/09 Y:\258\017.010\R\HOCM_Rpt.doc 3-22 LANDAU ASSOCIATES
3.5.2 DEWITT DRIVEN GROUT PILES
DeWitt Driven Grout piles are a proprietary pile type developed by DeWitt Construction, Inc.
The DeWitt Driven Grout piles are cast-in-place concrete piles that bear on a steel boot that is driven to
the desired tip elevation. The steel boot is driven into the ground with a mandrel. The mandrel maintains
the shaft diameter during pile driving. Once the tip elevation is reached, cement grout is placed under
pressure from the tip as the mandrel is removed. The mandrel reportedly maintains the diameter of the
pile and keeps soil from entering the grout column. Once the mandrel is completely removed, pile
installation is completed by installing a rebar cage. DeWitt Driven Grout piles generally can achieve very
similar axial capacities as compared to other driven pile types. For the HOCM project, DeWitt Driven
Grout Piles have the advantage of generating minimal soil spoils. Like augercast piles, steel casing may
be required to prevent the loss of grout into the fibrous wood waste that is present at the site.
According to representatives of DeWitt Construction, Inc. (Ullakko 2009), DeWitt Driven Grout
Piles have been installed in the vicinity of the HOCM site. For the Columbia Place project, 18-inch
diameter, DeWitt Driven Grout piles were installed to a depth of 95 ft BGS. These piles reportedly
achieved an ultimate axial capacity of about 300 tons. DeWitt Driven Grout piles may also be utilized for
the LOTT expansion immediately to the west of the HOCM property. Assuming similar soil conditions,
DeWitt Construction, Inc. estimates that 16-inch diameter DeWitt Driven Grout Piles driven to about 90
ft BGS would have an allowable axial capacity (service loading) of about 100 tons. The allowable axial
capacity includes a factor of safety of at least 2 on the ultimate pile capacity. The allowable axial
capacity during seismic loading would be less. The allowable axial capacity of DeWitt Driven Grout
Piles is confirmed with pile load tests.
3.6 SLAB-ON-GRADE FLOOR
As described in Section 3.2.6 of this report, if no ground improvement is implemented, between 3
and 12 inches of post-construction secondary settlement could occur during the design life of the
structure. This would be gradual and manifest itself through shallow surface depressions, the loss of
support and the potential cracking of slab-on-grade floors. In addition, up to 6 to 7 inches of liquefaction-
induced settlement may occur across the site after the design earthquake. This could lead to an increased
loss of support and further cracking/faulting of the slab-on-grade floor. Due to the variability of the near-
surface site soils, differential settlement between two points over a horizontal distance of 50 ft could be as
high as the total settlement. For these reasons, it may be desirable to utilize a pile supported grade-beam
to support the structures’ first floor.

3/19/09 Y:\258\017.010\R\HOCM_Rpt.doc 3-23 LANDAU ASSOCIATES
Assuming that the building pad was constructed in accordance with the recommendations
provided in Section 3.2 of this report and the owner is willing to accept the risks (as described in the
preceding paragraph of this report) associated with slab-on-grade construction at the site, the floors for the
proposed structure could be constructed as slab-on-grade. Prior to placing the drainage material, the slab
subgrade should be scarified as necessary, moisture-conditioned to near optimum moisture content, and
compacted to at least 95 percent of the maximum dry density as determined by the ASTM D1557 test
procedure. The resulting slab subgrade should be firm and unyielding. The prepared surface should be
checked by a qualified geotechnical engineer for any loose and/or disturbed areas. If detected, these areas
should be further compacted as recommended above, or overexcavated and replaced with structural fill in
accordance with Sections 3.2.4 and 3.2.5 of this report. Recommendations for underslab drainage and for
deflection analysis of the slab-on-grade floor are provided in Section 3.4.3 of this report.
3.7 MINOR STRUCTURE FOUNDATION SUPPORT
Based on the conditions observed in the borings completed for the project, between 8 and 10½ ft
of wood debris is present at the site. The wood debris could lead to undesirable long-term settlement
during the design life of the proposed improvements. We recommend that the design-build team consider
utilizing helical anchors, such as those manufactured by AB Chance©, to transmit the loads through the
wood debris into the underlying medium dense to dense recessional outwash deposits anticipated to be
located between 15 to 18 ft BGS. Alternatively, minor structures could be supported on shallow
foundations, provided the owner is willing to accept the risk of long-term total and differential settlement.
Liquefiable soil will be present below the base of the helical anchors or shallow foundation. It is
anticipated that after the design earthquake, minor structures may settle and may need to be
leveled/rebuilt.
3.7.1 HELICAL ANCHORS
Helical anchors are typically contractor designed using established installation torque to pile
capacity relationships. For this project, the soil profile in the following table may be assumed for the
purpose of designing helical anchors. For design, the groundwater level should be assumed to be about 4
ft below the existing ground surface. When considering the size of helical anchor for the project, the
contractor should evaluate the ability of the anchor to penetrate through medium dense to dense sandy
gravel deposits encountered in the upper recessional deposits. Downward axial design of helical piles
should include a factor of safety of at least 2.0 on the calculated ultimate capacity. The top-most helical
pile should extend at least three times the helix diameter upper recessional deposits. If helical anchors are

3/19/09 Y:\258\017.010\R\HOCM_Rpt.doc 3-24 LANDAU ASSOCIATES
installed to 12 ft BGS, wood debris is not encountered, and the required loads are achieved the helical
anchors need not be installed any deeper.
Soil Type
Depth Range
(ft BGS`)
Soil Unit Weight
(pcf)
Friction Angle
(degrees)
Cohesion
(psf)
Medium Dense to Dense Sand
0 to 4 120 34 0
Loose Sand 4 to 7½ 53(a) 31 0
Wood Debris 7½ to 18 18(a) 0 0 Upper Recessional Deposits
18 to 33 58(a) 34 0
Note: (a) Buoyant unit weight
It should be recognized that the actual subsurface conditions at a specific location may be
different from those described above (i.e. wood debris may not be present at all locations). As a result,
the actual lengths of the helical piles may vary depending on the actual subsurface conditions encountered
during construction. We, therefore, recommend structuring the contract documents to allow for pile
length adjustments.
Liquefiable soil will be present below the base of the helical anchors. It is anticipated that after
the design earthquake, minor structures supported by helical anchors may settle and the minor structures
may need to be leveled/rebuilt.
It is anticipated that helical anchors will not be able to penetrate through large pieces of wood or
other debris which may be present in the fill layer. If an obstruction is encountered, the helical anchor
will likely need to be abandoned and relocated.
3.7.2 SHALLOW FOUNDATIONS
Shallow foundations could also be utilized to support minor structures. The allowable bearing
pressure of shallow foundations is dependent on the specific location of the structure, the size of the
foundation, the thickness of the wood waste, the distance from the base of the foundation to the top of the
wood waste, and other factors. If shallow foundations will be utilized to support minor structures, we
recommend that the design-build team complete site specific geotechnical investigations and additional
engineering analysis.

3/19/09 Y:\258\017.010\R\HOCM_Rpt.doc 3-25 LANDAU ASSOCIATES
3.8 BELOW-GRADE RETAINING WALLS
The magnitude of lateral earth pressures that develops against subsurface building and retaining
walls will depend on the inclination of adjacent slopes, type of backfill, method of backfill placement,
degree of backfill compaction, magnitude and location of adjacent surcharge loads, and the degree to
which the wall can yield laterally during or after placement of backfill. When a subsurface wall is
restrained against lateral movement or tilting, the soil pressure exerted is the at-rest soil pressure. Such
wall restraint may develop if a rigid structural network is constructed prior to backfilling or if the wall is
inherently stiff or otherwise restrained from rotation. In contrast, active soil pressure will be exerted on a
subsurface wall if its top is allowed to rotate or yield a distance of at least 0.002 times its height during
placement of backfill.
We recommend that yielding walls with level backfill under drained conditions be designed for
an equivalent fluid density of 35 pcf for active soil conditions. If the wall is restrained from rotation
during backfilling, an equivalent fluid density of 55 pcf should be used for design assuming level backfill
and drained conditions. Design of any subsurface walls should include appropriate lateral earth pressures
caused by any adjacent surcharge loads. For uniform surcharge pressures, uniformly distributed loads of
0.26 and 0.41 times the surcharge pressure should be added for yielding and non-yielding walls,
respectively.
Dynamic lateral earth pressures due to a 1-in-2,475-year seismic event (2 percent probability of
exceedance in a 50-year period) should be included in design of all retaining walls. A peak horizontal
ground acceleration of 28 percent of gravity (SDS/2.5) was assumed in computing dynamic lateral earth
pressures. For retaining walls with level backfill able to translate laterally at least 2 inches during a
seismic event should be designed to withstand a dynamic uniform lateral earth pressure of 6H psf (H is
the vertical height of the wall). Walls unable to translate laterally (level backfill) should be designed to
withstand a dynamic uniform lateral pressure of 22H psf. The resultant can be assumed to act at a point
of 0.6H above the base of the wall. The dynamic lateral pressure should be added to the static lateral
earth pressures.
To provide drainage behind the wall, backfill within 3 ft from the face of the wall should consist
of free-draining, well-graded sand and gravel material with less than 5 percent fines and a maximum
particle size of 2 inches. Because of its potential to run, we do not recommend the use of pea gravel as
wall backfill. To avoid overstressing of the wall during placement and compaction, backfill placed within
3 ft of the wall should be compacted to between 90 and 92 percent of the maximum dry density
determined by the ASTM D1557 test procedure. Additional recommendations for wall drainage are
provided in Section 3.4.6 of this report.

3/19/09 Y:\258\017.010\R\HOCM_Rpt.doc 3-26 LANDAU ASSOCIATES
Recommendations for foundation support of below-grade retaining walls are provided in Section
3.7 of this report. Recommendations for resistance to lateral loads are provided in Section 3.4.5 of this
report.


3/19/09 Y:\258\017.010\R\HOCM_Rpt.doc 5-1 LANDAU ASSOCIATES
5.0 REFERENCES
AMEC Earth and Environmental, Inc. 2007. Supplement No. 2: LOTT Administration Building, Thurston Avenue and Adams Street, Olympia, Washington. Report prepared for the LOTT Alliance. April 5. ASCE. 2005. Minimum Design Loads for Buildings and Other Structures. Publication 7-05. American Society of Civil Engineers. Bray, J. D., and R.B. Sancio. 2006. Assessment of the Liquefaction Susceptibility of Fine Grained Soils. ASCE Journal of Geotechnical and Geoenvironmental Engineering. Vol. 132. No. 9. Pp. 1165-1177. Finlayson, D. 2005. Combined Bathymetry and Topography of the Puget Lowlands, Washington State URL: http://www.ocean.washington.edu/data/pugetsound/. GeoEngineers. 2007. Draft Remedial Investigation/Feasibility Study and Conceptual Cleanup Action Plan, East Bay Redevelopment, Port of Olympia, Olympia, Washington, Ecology Facility/Site No. 5785176, VCP No. SW0827. Report prepared for the Port of Olympia. December 20. Idriss, I.M. and R.W. Boulanger. 2007. SPT- and CPT-Based Relationships for the Residual Strength of Liquefied Soils. Earthquake Geotechnical Engineering, 4th International Conference on Earthquake Engineering – Invited Lectures. K.D. Pitilakis, ed., Springer, Netherlands. Pp. 1 – 22. Idriss, I.M., and R.W. Boulanger. 2008. Soil Liquefaction During Earthquakes. Earthquake Engineering Research Institute (EERI), MNO-12, 226 pp. Ishihara, K. 1985. Stability of Natural Deposits During Earthquakes. Proceedings, 11th International Conference on Soil Mechanics and Foundation Engineering. Vol. 1. pp. 321-376. International Code Council (ICC). 2006. 2006 International Building Code. Koelling, M. 2009 Personal Communication between Mark Koelling (Hayward Baker Geotechnical Construction) and Edward Heavey and Brian Bennetts (Landau Associates) regarding Ground Improvement Techniques for HOCM Building. January 22. Palmer, S.P., T.J. Walsh, and W.J. Gerstel. 1999. Geologic Folio of the Olympia-Lacy-Tumwater Urban Area, Washington: Liquefaction Susceptibility Map. Washington State Department of Natural Resources. Geologic Map GM-47. Thurston County. 2009. Thurston Geodata Center. URL: http://www.geodata.org/. Accessed January 12. Ullakko, G. 2009. Personal Communication between Garth Ullakko (DeWitt Construction, Inc.) and Brian Bennetts (Landau Associates) regarding DeWitt Driven Grout Piles. March 11. USGS. 2008. Earthquake Ground Motion Parameters Software Program. Version 5.0.9. U.S. Geological Survey.

3/19/09 Y:\258\017.010\R\HOCM_Rpt.doc 5-2 LANDAU ASSOCIATES
Youd, T.L., I.M. Idriss, R.D. Andrus, I. Arango, G. Castro, J.T. Christian, R. Dobry, W.D.L. Finn, L.F. Harder, M.E. Hynes, K. Ishihara, J.P. Koester, S.S.C. Liao, W.F. Marcuson, G.R. Martin, J.K Mitchell, Y. Moriwaki, M.S. Power, P.K. Robertson, R.B. Seed, and K.H. Stockoe. 2001. Liquefaction Resistance of Soils: Summary Report from the 1996 NCEER and 1998 NCEER/NSF Workshops on Evaluation of Liquefaction Resistance of Soils. Journal of Geotechnical and Geoenvironmental Engineering. 127(10): 817-833. Youd, T.L., Hansen, C.M. and Bartlett, S.F. 2002. Revised Multilinear Regression Equations for Prediction of Lateral Spread Displacement. ASCE Journal of Geotechnical and Geoenvironmental Engineering. Vol. 128. No. 12. pp. 1007-1017. Walsh, T.J., R. L. Logan, H. W. Schasse, and M. Polenz. 2003. Geologic Map of the Tumwater 7.5-minute Quadrangle, Thurston County, Washington. Washington Division of Geology and Earth Resources. Open File Report 2003-25. Wang, S. and Reese, LC. 1998. Design of Pile Foundation in Liquefied Soils. Geotechnical Earthquake Engineering and Soil Dynamics III. Vol. 1. Proceedings sponsored by Geo-Institute of the American Society of Civil Engineers. Geotechnical Special Publication No. 75. August 3-6. WSDOT. 2008a. Geotechnical Design Manual. Washington State Department of Transportation. Publication M46-03. November. WSDOT. 2008b. Standard Specifications for Road, Bridge, and Municipal Construction. Washington State Department of Transportation. Zhang, G., Robertson, P.K. and R.W.I. Brachman. 2002. Estimating Liquefaction-Induced Ground Settlements from CPT for Level Ground. Canadian Geotechnical Journal. 1169-1180.

Olympia
Tumwater
§̈¦5
§̈¦5tu101
tu101
4th
Ba
y
StateC
ap
ito
l
Div
i sio
n
22nd
Bo
ule
va
rd
Legion
Ca
in
Desch
utes
5th
He
n
derson
Harrison
Eas
tsid
e
Plu
m
Union
Fir
Irving
Pacific
18th
6th
Bigelow
Black
Lak
e
14th
Madison
Martin
Qu
inc
e
Cooper Point
Custer
Pe
rciv
al
2n
d
Cro
sb
y
Olym
pic
Plu
m
Ba
y
Bay
Priest Point ParkPriest Point Park
Watershed Trail ParkWatershed Trail Park
Capitol Lake ParkCapitol Lake Park
Tumwater Hill ParkTumwater Hill Park
Tumwater Historical ParkTumwater Historical Park
Lions ParkLions Park
Stevens FieldStevens Field
Sunrise ParkSunrise Park
Governor Stevens Gully ParkGovernor Stevens Gully Park
Marathon ParkMarathon Park
Harry Fains Legion ParkHarry Fains Legion Park
Wood Ruff ParkWood Ruff Park
Bigelow ParkBigelow Park
Madison Scenic ParkMadison Scenic Park
Budd InletBudd Inlet
Capitol LakeCapitol Lake
Ellis CoveEllis Cove
Bigelow LakeBigelow Lake
Setchfield LakeSetchfield Lake
D Miller LakeD Miller Lake
Hazard LakeHazard Lake
Data Source: ESRI 2006
Hands On Children's MuseumOlympia, Washington Vicinity Map
Figure
1
!!
!
!!
Tacoma
Spokane
Everett
Seattle
ProjectLocation
ProjectLocation
0 0.5 1
Miles


425 psf
140 psf
265 psf
4' BGS
7.5' BGS
0 psf
Existing GroundSurface
Non-Liquefied Crustal Layer
Liquefied Soil
Non-Liquefied Soil
Pile Foundation
Notes:
1. Lateral pressure exerted on pile during lateral spreading is based on soilconditions observed in boring B-3 and sounding CPT-2. If more liquefiablesoil is present in eastern portion of building, lateral pressure due to lateralspreading could be greater than what is shown above.
2. The lateral pressure is assumed to act over one pile diameter.
Not to Scale
Hands On Children's MuseumOlympia, Washington
Lateral Pressure Exerted OnPile During Lateral Spreading
Figure
Report | V:\258\017\010\D\Fig3.dwg (A) "Figure 3" 3/19/2009

APPENDIX A
Field Explorations

3/19/09 Y:\258\017.010\R\HOCM_Rpt.doc A-1 LANDAU ASSOCIATES
APPENDIX A FIELD EXPLORATIONS
Subsurface conditions at the Hands On Children’s Museum Site were explored on January 8
and 9, 2009. The exploration program consisted of advancing three (3) exploratory borings (B-1 through
B-3) and three (3) cone penetrometer test (CPT) soundings (CPT-1 through CPT-3) at the approximate
locations illustrated on the Site and Exploration Plan (Figure 2). The explorations were located in the
field with a hand-held GPS unit.
EXPLORATORY BORINGS
Borings B-1 and B-2 were completed to a depth of 19 ft BGS using truck-mounted drill rig and
the hollow stem auger method. Boring B-3 was completed to a depth of 81½ ft BGS using truck-mounted
drill rig and the mud-rotary drilling method. Holocene Drilling, Inc., of Edgewood, Washington
advanced the borings under subcontract to Landau Associates.
The geotechnical exploratory program was coordinated and monitored by a Landau Associates
geologist who also obtained representative soil samples, maintained a detailed record of the observed
subsurface soil and groundwater conditions, and described the soil encountered by visual and textural
examination. Each representative soil type observed in our exploratory borings was described using the
soil classification system shown on Figure A-1, in general accordance with ASTM D2488, Standard
Recommended Practice for Description of Soils (Visual-Manual Procedure). Logs of the exploratory
borings are presented on Figures A-2 through A-4. These logs represent our interpretation of subsurface
conditions identified during the field exploration program. The stratigraphic contacts shown on the
individual logs represent the approximate boundaries between soil types; actual transitions may be more
gradual. The soil and groundwater conditions depicted are only for the specific date and locations
reported, and therefore, are not necessarily representative of other locations and times.
Disturbed samples of the soil encountered from the borings were obtained at frequent intervals
using either a 1.5-inch inside-diameter (ID) Standard Penetration Test split-spoon sampler or a 2.43-inch
ID Dames & Moore sampler. The sampler was driven up to 18 inches (or a portion thereof) into the
undisturbed soil ahead of the auger bit with a 140-lb automatic hammer falling a distance of
approximately 30 inches. The number of blows required to drive the sampler for the final 12 inches (or
portion thereof) of soil penetration, is noted on the boring logs adjacent to the appropriate sample
notation.
Upon completion of drilling and sampling, the boreholes were abandoned in general accordance
with the requirements of Washington Administrative Code (WAC) 173-160.

3/19/09 Y:\258\017.010\R\HOCM_Rpt.doc A-2 LANDAU ASSOCIATES
CONE PENETROMETER TEST PROGRAM
The field exploration program included a CPT program to provide an overview of the subsurface
soil conditions at the project site. The CPT program was completed on January 8, 2009. The CPT
soundings were advanced to depths ranging from between 22½ to 120 ft BGS using truck-mounted CPT
equipment. In Situ Engineering, Inc. of Snohomish, Washington completed the CPT soundings under
subcontract to Landau Associates.
At each CPT sound location, a four-channel electronic cone was pushed at a rate of about 1 to 2
cm/sec. The cone was used to simultaneously record tip resistance, sleeve friction, pore pressure, and
inclination every 5 cm. Data was transmitted electronically from the cone to a receiver located at the
ground surface. Upon completion of testing, the CPT soundings were abandoned in general accordance
with the requirements of WAC 173-160.
In Situ Engineering, Inc. reduced the collected CPT data and plotted tip resistance and friction
ration (sleeve friction divided by tip resistance) as a function of sounding depth. They then used
published correlations (Robertson and Campanella 1983) to estimate soil behavior types and equivalent
Standard Penetration Test (SPT) values at each interval where data was recorded (i.e., every 5 cm). In
Situ Engineering’s detailed interpretation of soil behavior types and equivalent SPT values are presented
on Figures A-5 through A-7.
It should be noted that the published correlations used by In Situ Engineering, Inc. to develop
their detailed logs are generally regarded as predictions of soil behavior rather than actual soil type.
Factors such as changes in stress history, sensitivity, stiffness, and void ratio will influence the soil
classifications when using the published correlations. Accordingly, actual soil types at some or all of the
CPT locations may vary from the soil types shown on In Situ Engineering’s interpreted logs.
Furthermore, the soil and groundwater conditions depicted are only for the specific dates and locations
reported and, therefore, are not necessarily representative of other locations and times.
During the advancement of CPT sounding CPT-3, In Situ Engineering performed seismic testing.
The shear wave velocity tests were performed at 1 meter intervals [(3.28 feet (ft)] along the entire length
of the CPT soundings. The data from the shear wave velocity tests are presented on Figure A-8.
REFERENCE
Robertson, P.K. and R. G. Campanella. 1983. Interpretation of Cone Penetration Tests, Part I: Sand. Canadian Geotechnical Journal. Volume 20. pp. 718-733.

A-1
GRAVEL WITH FINES
(Little or no fines)
(Liquid limit greater than 50)
MH
SP(Little or no fines)CLEAN SAND
Hands On Children's MuseumOlympia, Washington
(1 of 2)
GRAVEL ANDGRAVELLY SOIL
50% - "GRAVEL," "SAND," "SILT," "CLAY," etc.50% - "very gravelly," "very sandy," "very silty," etc.30% - "gravelly," "sandy," "silty," etc.15% - "with gravel," "with sand," "with silt," etc.5% - "trace gravel," "trace sand," "trace silt," etc., or not noted.
(Appreciable amount offines)
> _ _ _ _
> 30% and <> 15% and <> 5% and <
<
NOTES:
1. USCS letter symbols correspond to symbols used by the Unified Soil Classification System and ASTM classification methods. Dual letter symbols (e.g.,SP-SM for sand or gravel) indicate soil with an estimated 5-15% fines. Multiple letter symbols (e.g., ML/CL) indicate borderline or multiple soilclassifications.
2. Soil descriptions are based on the general approach presented in the Standard Practice for Description and Identification of Soils (Visual-ManualProcedure), outlined in ASTM D 2488. Where laboratory index testing has been conducted, soil classifications are based on the Standard TestMethod for Classification of Soils for Engineering Purposes, as outlined in ASTM D 2487.
3. Soil description terminology is based on visual estimates (in the absence of laboratory test data) of the percentages of each soil type and is defined asfollows:
SCSM
(Appreciable amount offines)
SAND WITH FINES
Primary Constituent:Secondary Constituents:
Additional Constituents:
OH
Inorganic silt; micaceous or diatomaceous fine sand
Wood, lumber, wood chips
Rock (See Rock Classification)
USCSLETTER
SYMBOL(1)TYPICAL
DESCRIPTIONS (2)(3)
Organic clay of medium to high plasticity; organic silt
PAVEMENT
SAND ANDSANDY SOIL
WD
PT
Inorganic silt and very fine sand; rock flour; silty or clayey finesand or clayey silt with slight plasticity
FIN
E-G
RA
INE
D S
OIL
(Mor
e th
an 5
0% o
f mat
eria
lis
sm
alle
r tha
n N
o. 2
00si
eve
size
)
Well-graded gravel; gravel/sand mixture(s); little or no fines
(Liquid limit less than 50)
GM
RK
2/3/
09 Y
:\258
\017
.010
\T\2
5801
7.G
PJ
SC
S W
SD
OT
1OF2
Figure
Construction debris, garbage
LETTERSYMBOL
Poorly graded gravel; gravel/sand mixture(s); little or no fines
AC or PC
DB
Asphalt concrete pavement or Portland cement pavement
GRAPHICSYMBOL
ROCK
TYPICAL DESCRIPTIONSOTHER MATERIALS
Soil Classification System and Key
SILT AND CLAY
Well-graded sand; gravelly sand; little or no fines
Poorly graded sand; gravelly sand; little or no fines
SILT AND CLAY
Soil Classification System
GP
GRAPHICSYMBOL
Clayey sand; sand/clay mixture(s)
(More than 50% ofcoarse fraction
retained on No. 4sieve)
MAJORDIVISIONS
CH
GW
CL
(More than 50% ofcoarse fraction passed
through No. 4 sieve)
Inorganic clay of low to medium plasticity; gravelly clay; sandyclay; silty clay; lean clay
(Mor
e th
an 5
0% o
f mat
eria
l is
larg
er th
an N
o. 2
00 s
ieve
siz
e)
CO
AR
SE
-GR
AIN
ED
SO
IL
OL
Peat; humus; swamp soil with high organic content
DEBRIS
WOOD
Silty sand; sand/silt mixture(s)
Organic silt; organic, silty clay of low plasticity
CLEAN GRAVEL
HIGHLY ORGANIC SOIL
ML
SWGC Clayey gravel; gravel/sand/clay mixture(s)
Silty gravel; gravel/sand/silt mixture(s)
Inorganic clay of high plasticity; fat clay

PVC Screen(0.010-inch Slot Size)
Flush-MountMonument
10-20 Sand
1
Approximate water elevation at other time(s). When multiple water levels areobtained other than ATD, only a representative range is shown. See text for additionalinformation.
Note:
Approximate water elevation at time of drilling (ATD).
Pocket Penetrometer, tsfTorvane, tsfPhotoionization Detector VOC screening, ppmMoisture Content, %Dry Density, pcfMaterial smaller than No. 200 sieve, %Grain Size - See separate figure for dataAtterberg Limits - See separate figure for dataVane Shear TestOther Geotechnical TestingChemical Analysis
A-1
Slough Backfill
Groundwater levels can fluctuate due to precipitation, seasonal conditions, and otherfactors.
PP = 1.0TV = 0.5PID = 100W = 10D = 120
-200 = 60GSAL
VSTGTCA
Code
PVC Blank Casing
Description
Bentonite Chips
Well Log Graphics
Hands On Children's MuseumOlympia, Washington
(2 of 2)
DescriptionCodeSample Identification Number
Recovery Depth Interval
Sample Depth Interval
Bentonite Grout
Above-GroundMonument
Groundwater
SAMPLE NUMBER & INTERVAL
3.25-inch O.D., 2.42-inch I.D. Split Spoon2.00-inch O.D., 1.50-inch I.D. Split SpoonShelby TubeGrab SampleSingle-Tube Core BarrelDouble-Tube Core BarrelOther - See text if applicable300-lb Hammer, 30-inch Drop140-lb Hammer, 30-inch DropPushedRotosonicAir Rotary (Rock)Wash Rotary (Rock)Other - See text if applicable
Field and Lab Test DataSAMPLER TYPE
abcdefg1234567
2/3/
09 Y
:\258
\017
.010
\T\2
5801
7.G
PJ
SC
S W
SD
OT
2OF2
Figure
VWP
Portion of Sample Retainedfor Archive or Analysis
Drilling and Sampling Key
Soil Classification System and Key
End Cap

10 20 30 40
5
3
5
13
SPT N-Value
Boring Completed 01/09/09. Total Depth of Boring = 19.0 ft.
119
6
Hands On Children's MuseumOlympia, Washington
S-3
SM/WD
SP
b2
b2
b2
b2
S-5-200=10W = 20
GS
W = 119
-200=31W = 59
GS
b2
Dark gray, gravelly, fine to coarse SANDwith silt (medium dense, wet)
(RECESSIONAL OUTWASH)
S-2
S-1
WD
SW-SM
Wood debris
Gray, very silty, fine to medium SAND withgravel and abundant wood debris (veryloose, wet)
Brown, fine to coarse SAND with graveland trace shells (loose, moist)
(FILL)
S-4
Non-Standard N-Value
Holocene Drilling Inc.
Drilling Method:
Ground Elevation (ft):
SOIL PROFILE
Drilled By:
Logged By:US
CS
Sym
bol
Test
Dat
a
Gra
phic
Sym
bol
Date:
258017.010LAI Project No:
Sam
ple
Num
ber
& In
terv
al
01/09/09
LiquidLimit
Dep
th (f
t)
Not Measured
Figure
A-2Log of Boring B-1
KMH
B-1
SAMPLE DATA
1. Stratigraphic contacts are based on field interpretations and are approximate.2. Reference to the text of this report is necessary for a proper understanding of subsurface conditions.3. Refer to "Soil Classification System and Key" figure for explanation of graphics and symbols.
PlasticLimit
Hollow-Stem Auger
Blo
ws/
Foot
2580
17.0
1 2
/3/0
9 Y
:\258
\017
.010
\T\2
5801
7.G
PJ
SO
IL B
OR
ING
LO
G W
ITH
GR
AP
H
Gro
undw
ater
20 40 60 80
Fines Content (%)
20 40 60 80
Moisture Content (%)
2580
17.0
1 2
/3/0
9 Y
:\258
\017
.010
\T\2
5801
7.G
PJ
SO
IL B
OR
ING
LO
G W
ITH
GR
AP
H
Sam
pler
Typ
e
Notes:
Ele
vatio
n (ft
)
0
5
10
15
20
25
30
35
ATD

10
6
4
19
23
S-5
S-4
S-3
Boring Completed 01/09/09. Total Depth of Boring = 19.0 ft.
Hands On Children's MuseumOlympia, Washington
S-1
-200=21W = 36
GS
S-2
b2
b2
b2
b2
b2
GP
-200=11W = 19
GS
SP-SM
-200=7W = 17
GS
Brown, very gravelly, fine to coarse SAND(medium dense, damp)
(FILL)
Dark gray, gravelly, fine to coarse SANDwith silt and wood (medium dense, wet)
(RECESSIONAL OUTWASH)
Dark gray, silty, gravelly, fine to coarseSAND with abundant wood (very loose,wet)
SP
Brown, sandy GRAVEL (medium dense,moist)
SP-SM
SM/WD
Dark gray, gravelly, fine to medium SANDwith silt (loose, wet)
Logged By: Date:
SAMPLE DATA
Holocene Drilling Inc.
Drilling Method:
Ground Elevation (ft):
Hollow-Stem Auger
Drilled By:
US
CS
Sym
bol
Dep
th (f
t)
Gra
phic
Sym
bol
Non-Standard N-Value
258017.010LAI Project No:
Sam
ple
Num
ber
& In
terv
al
SOIL PROFILE
KMH
2580
17.0
1 2
/3/0
9 Y
:\258
\017
.010
\T\2
5801
7.G
PJ
SO
IL B
OR
ING
LO
G W
ITH
GR
AP
H
FigureLog of Boring B-2
Gro
undw
ater
B-225
8017
.01
2/3
/09
Y:\2
58\0
17.0
10\T
\258
017.
GP
J S
OIL
BO
RIN
G L
OG
WIT
H G
RA
PH
1. Stratigraphic contacts are based on field interpretations and are approximate.2. Reference to the text of this report is necessary for a proper understanding of subsurface conditions.3. Refer to "Soil Classification System and Key" figure for explanation of graphics and symbols.
Not Measured
PlasticLimit
A-3
01/09/0920 40 60 80E
leva
tion
(ft)
20 40 60 80
Moisture Content (%)
10 20 30 40
Fines Content (%)
SPT N-Value
Test
Dat
a
Blo
ws/
Foot
Sam
pler
Typ
e
Notes:
0
5
10
15
20
25
30
35
LiquidLimit
ATD

S-8
S-7
S-6
3
13
6
S-4
20
32
47
Hands On Children's MuseumOlympia, Washington
14
S-3 2
-200=14W = 21
GS
S-5
SP-SM
GP
b2
a2
a2
b2
b2
b2
b2
GP-GM
-200=26W = 20
GS
SP-SM
-200=7W = 12
GS
W = 58
W = 466
-200=7W = 24
GS
b2
Brown WOOD (very soft, wet)
S-2
S-1
Gray, silty CLAY (medium stiff, wet)
Gray, silty, fine to medium SAND withtrace gravel (medium dense, wet)
WD
Gray, very sandy GRAVEL with silt(medium dense, wet)
(RECESSIONAL OUTWASH)
Gray, fine to medium SAND with silt(loose, wet)
Brown GRAVEL with sand (mediumdense, wet)
(FILL)
CL
SM
Gray, fine to medium SAND with silt andgravel (medium dense, wet)
LAI Project No:
Drilling Method:
Ground Elevation (ft):
SOIL PROFILE
Drilled By:
Logged By:US
CS
Sym
bol
Dep
th (f
t)
Gra
phic
Sym
bol
SAMPLE DATA
258017.010
Sam
ple
Num
ber
& In
terv
al
01/08/09
LiquidLimit
Gro
undw
ater
Test
Dat
a
Blo
ws/
Foot
Sam
pler
Typ
e
Notes:
Non-Standard N-Value
2580
17.0
1 2
/3/0
9 Y
:\258
\017
.010
\T\2
5801
7.G
PJ
SO
IL B
OR
ING
LO
G W
ITH
GR
AP
H25
8017
.01
2/3
/09
Y:\2
58\0
17.0
10\T
\258
017.
GP
J S
OIL
BO
RIN
G L
OG
WIT
H G
RA
PH
Figure
A-4(1 of 3)
Log of Boring B-3
Holocene Drilling Inc.
B-3
1. Stratigraphic contacts are based on field interpretations and are approximate.2. Reference to the text of this report is necessary for a proper understanding of subsurface conditions.3. Refer to "Soil Classification System and Key" figure for explanation of graphics and symbols.
Not Measured
PlasticLimit
Mud Rotary
Date:KMH
20 40 60 80
Moisture Content (%)
10 20 30 40
SPT N-Value
466
Ele
vatio
n (ft
)
0
5
10
15
20
25
30
35
20 40 60 80
Fines Content (%)
Gro
undw
ater
Not
Enc
ount
ered

5
6
16
10
8
4
6
Hands On Children's MuseumOlympia, Washington
b2
b2
b2
W = 38AL
W = 39-200 = 94
W = 42AL
W = 29-200 = 95
W = 41AL
W = 64-200 = 55
W = 6-200 = 96
W = 59AL
b2
W = 33-200 = 79
Gray SILT with sand to trace sand(medium stiff to stiff, wet)
S-15
S-14
S-13
S-12
S-11BS-11A
S-10BS-10A
S-9
b2
b2
becomes very sandy
SILT interbed
Gray, sandy SILT; non-plastic (very stiff,wet)
Gray, silty CLAY (medium stiff, wet)
ML
ML
CL
b2
Drilling Method:
Ground Elevation (ft):
SOIL PROFILE
Drilled By:
Logged By:US
CS
Sym
bol
Dep
th (f
t)
Gra
phic
Sym
bol
Non-Standard N-Value
LAI Project No:
Sam
ple
Num
ber
& In
terv
al
01/08/09
LiquidLimit
Gro
undw
ater
Test
Dat
a
Blo
ws/
Foot
Sam
pler
Typ
e
Notes:
258017.010
1. Stratigraphic contacts are based on field interpretations and are approximate.2. Reference to the text of this report is necessary for a proper understanding of subsurface conditions.3. Refer to "Soil Classification System and Key" figure for explanation of graphics and symbols.
2580
17.0
1 2
/3/0
9 Y
:\258
\017
.010
\T\2
5801
7.G
PJ
SO
IL B
OR
ING
LO
G W
ITH
GR
AP
H
Figure
A-4(2 of 3)
Log of Boring B-3
KMH
Holocene Drilling Inc.
2580
17.0
1 2
/3/0
9 Y
:\258
\017
.010
\T\2
5801
7.G
PJ
SO
IL B
OR
ING
LO
G W
ITH
GR
AP
H
SAMPLE DATA
Not Measured
PlasticLimit
Mud Rotary
Date:
B-3
20 40 60 80
Moisture Content (%)
10 20 30 40
SPT N-Value
Ele
vatio
n (ft
)
35
40
45
50
55
60
65
70
20 40 60 80
Fines Content (%)
Gro
undw
ater
Not
Enc
ount
ered

SPT N-Value
Boring Completed 01/08/09. Total Depth of Boring = 81.5 ft.
S-18
S-17
Moisture Content (%)
20 40 60 80
Hands On Children's MuseumOlympia, Washington
Fines Content (%)
20 40 60 80
10 20 30 40
21
S-16 13 W = 35-200 = 86
33
b2becomes medium dense
Blue-gray, fine to medium SAND with silt(dense, wet)
Gray SILT with sand to trace sand(medium stiff to stiff, wet)
SP-SM
b2
b2
W = 22-200 = 9
ML
Logged By: Date:
SAMPLE DATA
Holocene Drilling Inc.
Drilling Method:
Ground Elevation (ft):
Drilled By:
US
CS
Sym
bol
Dep
th (f
t)
Gra
phic
Sym
bol
Non-Standard N-Value
258017.010
SOIL PROFILE
KMH
2580
17.0
1 2
/3/0
9 Y
:\258
\017
.010
\T\2
5801
7.G
PJ
SO
IL B
OR
ING
LO
G W
ITH
GR
AP
H
Figure
Mud Rotary
Log of Boring B-3
B-325
8017
.01
2/3
/09
Y:\2
58\0
17.0
10\T
\258
017.
GP
J S
OIL
BO
RIN
G L
OG
WIT
H G
RA
PH
1. Stratigraphic contacts are based on field interpretations and are approximate.2. Reference to the text of this report is necessary for a proper understanding of subsurface conditions.3. Refer to "Soil Classification System and Key" figure for explanation of graphics and symbols.
Not Measured
PlasticLimit
Sam
ple
Num
ber
& In
terv
al
A-4(3 of 3)
LAI Project No:
Notes:
Ele
vatio
n (ft
)
70
75
80
85
90
95
100
105
Test
Dat
a
Sam
pler
Typ
e
LiquidLimit
Blo
ws/
Foot
Gro
undw
ater
01/08/09
Gro
undw
ater
Not
Enc
ount
ered


APPENDIX B
Laboratory Testing

3/19/09 Y:\258\017.010\R\HOCM_Rpt.doc B-1 LANDAU ASSOCIATES
APPENDIX B LABORATORY TESTING
Natural moisture content determinations, fines content determinations, grain size analyses, and
Atterberg limit determinations tests were performed on selected samples to aid in soil classification.
Laboratory testing was performed in general accordance with the ASTM standard test procedures, which
are described below. The samples were checked against the field log descriptions, which were updated
where appropriate in general accordance with ASTM D2487, Standard Test Method for Classification of
Soils for Engineering Purposes.
NATURAL MOISTURE CONTENT
Natural moisture content determinations were performed on selected soil samples recovered from
the borings in general accordance with ASTM D2216. The natural moisture content is shown as W=xx
(percent of dry weight) at the respective sample depth in the column labeled “Test Data” on the summary
boring logs in Appendix A.
SIEVE ANALYSIS
Sieve analyses were performed on representative soil samples obtained from the borings in
accordance with ASTM D422, to provide an indication of the grain size distribution. Samples selected
for sieve analysis are designated with a “GS” in the column labeled “Test Data” on the summary boring
logs in Appendix A. The results of the sieve analyses are presented in the form of grain size distribution
curves on Figures B-1 through B-2 in this appendix.
FINES CONTENT
The fines content (the percentage of material passing the U.S. Standard No. 200 sieve) of selected
soil samples obtained from our exploratory borings were determined in general accordance with ASTM
D1140 test procedures. The fines content is shown as -200=xx (percent of dry weight) at the respective
sample depth in the column labeled “Test Data” on the summary boring logs in Appendix A.
ATTERBERG LIMITS
Atterberg limit determinations were performed on representative soil samples obtained from the
borings in general accordance with ASTM D4318, to determine the liquid limit (LL), plastic limit (PL),
and plasticity index (PI). Samples on which Atterberg limit determinations were completed are

3/19/09 Y:\258\017.010\R\HOCM_Rpt.doc B-2 LANDAU ASSOCIATES
designated by “AL” in the column labeled “Test Data” on the summary logs. The results of the Atterberg
limit determinations are presented on Figure B-3 in this appendix.

3/4 30104
Grain Size in Millimeters
Per
cent
Fin
er b
y W
eigh
t
00.01
10
20
30
40
50
60
70
80
100
0.001100 10 1 0.1
90
Fine
6
S-5SM
SW-SMSP-SM
SMSP-SM
3
Soil DescriptionExplorationNumber
408
SampleNumber
50
Coarse
1/2
S-3
B-1B-1B-2B-2B-2
S-3
B-1
Figure
258017.01 2/3/09 Y:\258\017.010\T\258017.GPJ GRAIN SIZE FIGURE
Grain Size Distribution
17S-4S-5
Very silty, fine to medium SAND with gravelGravelly, fine to coarse SAND with siltGravelly, fine to medium SAND with siltSilty, gravelly, fine to coarse SANDVery gravelly, fine to coarse SAND with silt
20
3619
7.517.57.512.517.5
Cobbles
59
1001.5 4 163
Fine
1
Hands On Children's MuseumOlympia, Washington
Sand
Hydrometer
6026
GravelSilt or Clay
Unified SoilClassification
MediumCoarse
20143/8 140 200
Depth(ft)
U.S. Sieve Numbers
NaturalMoisture (%)Symbol
U.S. Sieve Opening in Inches

Per
cent
Fin
er b
y W
eigh
t3/4 30104
Grain Size in Millimeters0.1
30
40
50
60
70
100 10
0.01 0.001
80
90
100
10
20
10
Soil Description
50
Fine
SM
SP-SMGP-GM
3 64
ExplorationNumber
408
Coarse
1/2
S-2
SampleNumber
B-3B-3B-3B-3
Grain Size Distribution
SP-SM
Figure
258017.01 2/3/09 Y:\258\017.010\T\258017.GPJ GRAIN SIZE FIGURE
B-2
12S-6S-7S-8
Fine to medium SAND with siltVery sandy GRAVEL with siltFine to medium SAND with silt and gravel
24
2120
5.020.025.030.0
Coarse
Silty, fine to medium SAND
1001.5 163 1
Hands On Children's MuseumOlympia, Washington
Sand
Hydrometer
6026
U.S. Sieve Numbers
GravelFine
Silt or Clay
Unified SoilClassification
Medium
2014
Cobbles
3/8 140 200
Depth(ft)
NaturalMoisture (%)Symbol
U.S. Sieve Opening in Inches

CL
ASTM D 4318 Test Method
Depth(ft)
PlasticityIndex(%)
MH or OHML or OL
CH
0 706050403010 100
10
20
30
40
50
20
CL-ML
80 900
110
60
Unified SoilClassification
S-15 26
25
24
23
ML
ML
CL
S-13
S-11B
S-9
38
42
41
59
10
ML
B-3
Plasticity ChartHands On Children's MuseumOlympia, Washington
2580
17.0
1 2
/3/0
9 Y
:\258
\017
.010
\T\2
5801
7.G
PJ
ATT
ER
BE
RG
LIM
ITS
FIG
UR
E
Figure
23
B-3
B-3
B-3
SILT with sand to trace sand
SILT with sand to trace sand
SILT with sand to trace sand
Silty CLAY
Liquid Limit (LL)
ATTERBERG LIMIT TEST RESULTS
8
SampleNumber
PlasticLimit(%)
ExplorationNumber
NaturalMoisture
(%)Symbol
B-3
LiquidLimit(%)
36
33
35
46
65.0
55.0
45.5
Pla
stic
ity In
dex
(PI)
Soil Description
11
35.0

APPENDIX C
Logs By Others


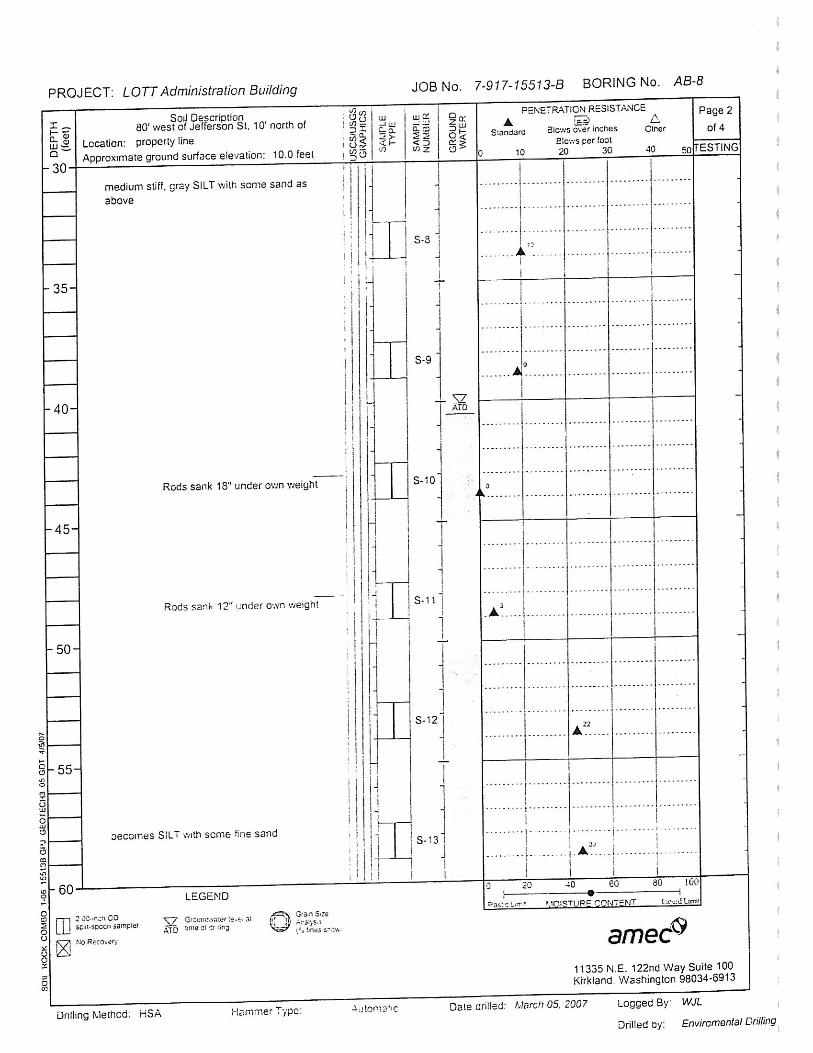


DRAFT
File No. 0615-034-02
DRAFT REMEDIAL INVESTIGATION/FEASIBILITY STUDYAND CONCEPTUAL CLEANUP ACTION PLANEAST BAY REDEVELOPMENTPORT OF OLYMPIAOLYMPIA, WASHINGTONECOLOGY FACILITY/SITE NO. 5785176VCP NO. SW0827
DECEMBER 20, 2007
FORPORT OF OLYMPIA

#
DP19
DP22
MW15
DP21
DP18
DP17
DP25
DP24
MW16
MW18
MW19
MW20
MW17
MW12
MW13
DP23
MW11
MW14
DP20
PARCEL7
PARCEL6PARCEL
5
PARCEL8
PARCEL9
PARCEL4
PARCEL3
PARCEL2
PARCEL1
TP04
TP01
TP03
TP02
4
3
2
1
5
7
8
96
10
DP06
DP10
DP07
DP12
DP11
DP15
DP13DP08
DP09
DP14
DP16
DP01
DP02
DP03
DP04
DP05
MW04
MW09
MW02
MW03
MW01
MW06
MW07
MW08
MW05
B1
B2B3 MW4
MW2
MW5
MW3
MW1(Abandoned Oct. 2003)
MW10
STATE AVE NE
MA
RIN
E DR
NE
EAST B
AY DR
NE
AD
AM
S ST NE
4TH AVE E
OLYMPIA AVE NE
JEFFERSO
N ST N
E
PLUM
ST SE
THURSTON AVE NE
CH
ERRY ST SE
CH
ESTNU
T ST SE
AD
AM
S ST SE
JEFFERSO
N ST SE
OLYMPIA AVE NE
B3
B2
B1
CPT3
CPT2
CPT1
72'' Concrete Culvert
36'' Galvanized Culvert
24'' Galvanized Culvert
Site Plan and Exploration Locations
East Bay Redevelopment ProjectOlympia, Washington
DraftFigure 3
μ150 0 150
Feet
Notes:1. The locations of all features shown are approximate.2. This drawing is for infomation purposes. It is intended to assist in showing features discussed in an attached document. GeoEngineers, Inc. can not guaranteethe accuracy and content of electronic files. The master file is stored by GeoEngineers, Inc. and will serve as the official record oth this communication.
Reference: United States Geologic Survey (obtained January 2007). Parcel boundaries, Artesian Well locations and Storm Drainage dataare based on information provided by the Port of Olympia. (Proposed Right-of-Way per Skillings Connolly Drawing).
Office:TAC Path: P:\0\0615034\02\GIS\061503402_Figure3_Site_Plan_Exploration.mxd KMB:TCK Map Revised: December 17, 2007
East Bay Redevelopment Proposed Short Plat Parcel Boundaries
East Bay Redevelopment Project Area
LOTT Parcel (Pending Sale from Port)
# Artesian Well (Maintained by Port)
Proposed Right-of-Way
Storm Drainage System
$K Outfall Locations
EAST BAY VCPLOTT VCP
ED Test Pit (GeoEngineers, Inc. - Oct. 2007)
@A Monitoring Well (GeoEngineers, Inc. - Jan. & July 2007)
! Direct-Push Boring (GeoEngineers, Inc. - Sept. 2006, Jan. & July 2007)
!P Direct-Push Boring (Brown and Caldwell - Nov. 2006, Jan. & Feb. 2007)
@? Monitoring Well (Delta Environmental - June 2003)
!
<
Direct-Push Boring (Northwest Testing Company, Oct. 2006)
!O Cone Penotrometer Test (Landau - May 2007)
!< Boring (Landau - May 2007)

12
12
36
CCSP
GP
CA
CA
020
040
080
100
Concretesurface seal
Benonite seal
1-inchSchedule 40PVC wellcasing
1-inchprepackedSchedule 40PVC screen,0.020-inchslot width
Colorado10-20 sand
NS
NS
NS
NS
NS
Concrete slabBrown fine to coarse sand with gravel (loose to
medium dense, moist)
Grades to loose, moist
Brown gravel with sand (loose, wet)
ESN-NW
TSG
NA
DrillingMethod
Pneumatic DrillingEquipment Stratoprobe
CheckedBy
Date(s)Drilled
DrillingContractor
LoggedBy
HammerData
Direct Push Grab; 5035A for VOCs
AugerData
SamplingMethods
01/02/07 KMB
Datum/System
Easting(x):Northing(y):
VerticalDatum
47.0483000631-122.896724939Assumed (100') GCS - North American - 1983
101.82Total ExplorationDepth (ft) 12 Ground Surface
Elevation (ft)GroundwaterElevation (ft) 97.68
She
en
Ele
vatio
n fe
et
Rec
over
ed (i
n)
Test
ing
Blo
ws/
foot
Gro
upS
ymbo
l
Gra
phic
Log
SAMPLESS
ampl
e N
umbe
rS
ub-S
ampl
e
Inte
rval
Dep
th fe
et
Hea
dspa
ce V
apor
TLV
(ppm
)MATERIAL DESCRIPTION
WELLCONSTRUCTION
Steel surfacemonument
0
5
10
15
20Note: See Figure B-1 for explanation of symbols.
Sheet 1 of 1
LOG OF MONITORING WELL MW01 (AKA 425)Project:Project Location:Project Number:
Olympia, WashingtonPhase II ESA/Hands on Children's Museum
0615-033-00Figure B-4
V6_
EN
VW
ELL
P:\0
\061
5033
\00\
FIN
ALS
\061
5033
00.G
PJ
GE
IV6_
1.G
DT
2/6
/07

Note: See Figure B-1 for explanation of symbols.
Sheet 1 of 1
LOG OF MONITORING WELL MW02 (AGT 115)Project:Project Location:Project Number:
Olympia, WashingtonPhase II ESA/Hands on Children's Museum
0615-033-00Figure B-5
24 SP
SMCA
CA
000
020
040
060
080
Concretesurface seal
Benonite seal
1-inchSchedule 40PVC wellcasing
1-inchprepackedSchedule 40PVC screen,0.020-inchslot width
Colorado10-20 sand
NS
NS
NS
NS
NS
No PIDBrown fine to medium sand with occasional finegravel (loose, moist)
Brown fine gravel with sand and trace silt
ESN-NW
TSG
NA
DrillingMethod
Pneumatic DrillingEquipment Stratoprobe
CheckedBy
Date(s)Drilled
DrillingContractor
LoggedBy
HammerData
Direct Push Grab; 5035A for VOCs
AugerData
SamplingMethods
01/02/07 KMB
Datum/System
Easting(x):Northing(y):
VerticalDatum
47.0481962236-122.897072584Assumed (100') GCS - North American - 1983
100.27Total ExplorationDepth (ft) 12 Ground Surface
Elevation (ft)GroundwaterElevation (ft) 96.79
She
en
Ele
vatio
n fe
et
Rec
over
ed (i
n)
Test
ing
Blo
ws/
foot
Gro
upS
ymbo
l
Gra
phic
Log
SAMPLESS
ampl
e N
umbe
rS
ub-S
ampl
e
Inte
rval
Dep
th fe
et
Hea
dspa
ce V
apor
TLV
(ppm
)MATERIAL DESCRIPTION
WELLCONSTRUCTION
Steel surfacemonument
0
5
10
15
20
V6_
EN
VW
ELL
P:\0
\061
5033
\00\
FIN
ALS
\061
5033
00.G
PJ
GE
IV6_
1.G
DT
2/6
/07

12
48
24
CCSP
GP
CA
CA
000
020
040
080
Concretesurface seal
Benonite seal
1-inchSchedule 40PVC wellcasing
1-inchprepackedSchedule 40PVC screen,0.020-inchslot width
Colorado10-20 sand
NS
NS
NS
NS
NS
0.0
0.0
0.0
0.0
0.0
Concrete slabBrown fine to coarse sand with gravel (medium
dense, moist)
Gray/brown gravel with sand (medium dense, wet)
ESN-NW
TSG
NA
DrillingMethod
Pneumatic DrillingEquipment Stratoprobe
CheckedBy
Date(s)Drilled
DrillingContractor
LoggedBy
HammerData
Direct Push Grab; 5035A for VOCs
AugerData
SamplingMethods
01/02/07 KMB
Datum/System
Easting(x):Northing(y):
VerticalDatum
47.04784838-122.896712081Assumed (100') GCS - North American - 1983
100.95Total ExplorationDepth (ft) 12 Ground Surface
Elevation (ft)GroundwaterElevation (ft) 96.67
She
en
Ele
vatio
n fe
et
Rec
over
ed (i
n)
Test
ing
Blo
ws/
foot
Gro
upS
ymbo
l
Gra
phic
Log
SAMPLESS
ampl
e N
umbe
rS
ub-S
ampl
e
Inte
rval
Dep
th fe
et
Hea
dspa
ce V
apor
TLV
(ppm
)MATERIAL DESCRIPTION
WELLCONSTRUCTION
Steel surfacemonument
0
5
10
15
20Note: See Figure B-1 for explanation of symbols.
Sheet 1 of 1
LOG OF MONITORING WELL MW03 (AKA 427)Project:Project Location:Project Number:
Olympia, WashingtonPhase II ESA/Hands on Children's Museum
0615-033-00Figure B-6
V6_
EN
VW
ELL
P:\0
\061
5033
\00\
FIN
ALS
\061
5033
00.G
PJ
GE
IV6_
1.G
DT
2/6
/07

40
24
40
48
GP
SP
OL
ML/SP
SP
CA
CA
000
020
040
080
100
120
140
Concretesurface seal
Benonite seal
1-inchSchedule 40PVC wellcasing
1-inchprepackedSchedule 40PVC screen,0.020-inchslot width
Colorado10-20 sand
NS
NS
NS
NS
NS
NS
NS
NS
0.0
0.0
0.0
0.0
0.0
0.0
0.0
0.0
Medium brown gravel with sand (medium dense,moist to dry)
Dark brown sand with gravel and brick (fill)
Brown organic silt
Gray silt with layers of fine to coarse graded sandwith shells (dense/loose, wet)
Black sand with decomposing wood material(moist)
Dark brown coarse sand with occasional gravel(loose, wet)
Preservative odor
Sewage odor
Dark brown/black coarse sand with gravel andwood debris (loose, wet)
Intense preservative odor
ESN-NW
TSG
NA
DrillingMethod
Pneumatic DrillingEquipment Stratoprobe
CheckedBy
Date(s)Drilled
DrillingContractor
LoggedBy
HammerData
Direct Push Grab; 5035A for VOCs
AugerData
SamplingMethods
01/02/07 KMB
Datum/System
Easting(x):Northing(y):
VerticalDatum
47.048155726-122.896040672Assumed (100') GCS - North American - 1983
101.85Total ExplorationDepth (ft) 16 Ground Surface
Elevation (ft)GroundwaterElevation (ft) 96.52
She
en
Ele
vatio
n fe
et
Rec
over
ed (i
n)
Test
ing
Blo
ws/
foot
Gro
upS
ymbo
l
Gra
phic
Log
SAMPLESS
ampl
e N
umbe
rS
ub-S
ampl
e
Inte
rval
Dep
th fe
et
Hea
dspa
ce V
apor
TLV
(ppm
)MATERIAL DESCRIPTION
WELLCONSTRUCTION
Steel surfacemonument
0
5
10
15
20Note: See Figure B-1 for explanation of symbols.
Sheet 1 of 1
LOG OF MONITORING WELL MW04 (AKA 424)Project:Project Location:Project Number:
Olympia, WashingtonPhase II ESA/Hands on Children's Museum
0615-033-00Figure B-7
V6_
EN
VW
ELL
P:\0
\061
5033
\00\
FIN
ALS
\061
5033
00.G
PJ
GE
IV6_
1.G
DT
2/6
/07