Embed Size (px)
Citation preview

GEOTECHNICAL INVESTIGATION
PROPOSED MULTI-FAMILY RESIDENTIAL DEVELOPMENT
SOUTH HILGARD AVENUE LOS ANGELES, CALIFORNIA
TRACT: TR 10690 LOTS: 6-8
PREPARED FOR
UCLA CAPITAL PROGRAMS LOS ANGELES, CALIFORNIA
PROJECT NO. A9060-06-18
AUGUST 15, 2019
Project No. A9060-06-18 August 15, 2019
Mark Voltz Principal Project Manager Design and Construction UCLA Capital Programs 1060 Veteran Avenue, Box 951365 Los Angeles, CA 90095-1365
Subject: GEOTECHNICAL INVESTIGATION PROPOSED MULTI-FAMILY RESIDENTIAL DEVELOPMENT SOUTH HILGARD AVENUE, LOS ANGELES, CALIFORNIA TRACT: TR 10690 LOTS: 6-8
Dear Mr. Voltz:
In accordance with your authorization of our proposal dated June 25, 2019, we have performed a geotechnical investigation for the proposed multi-family residential development located at South Hilgard Avenue (Tract: TR 10690, Lots: 6-8) in the City of Los Angeles, California. The accompanying report presents the findings of our study, and our conclusions and recommendations pertaining to the geotechnical aspects of proposed design and construction. Based on the results of our investigation, it is our opinion that the site can be developed as proposed, provided the recommendations of this report are followed and implemented during design and construction.
If you have any questions regarding this report, or if we may be of further service, please contact the undersigned.
Very truly yours,
GEOCON WEST, INC.
Harry Derkalousdian PE 79694
Neal Berliner GE 2576
Susan F. Kirkgard CEG 1754
(EMAIL) Addressee

TABLE OF CONTENTS
1. PURPOSE AND SCOPE ................................................................................................................. 1 2. SITE AND PROJECT DESCRIPTION ........................................................................................... 1 3. GEOLOGIC SETTING .................................................................................................................... 2 4. SOIL AND GEOLOGIC CONDITIONS ......................................................................................... 2
4.1 Artificial Fill .......................................................................................................................... 3 4.2 Older Alluvium ...................................................................................................................... 3
5. GROUNDWATER ........................................................................................................................... 3 6. GEOLOGIC HAZARDS .................................................................................................................. 4
6.1 Surface Fault Rupture ............................................................................................................ 4 6.2 Seismicity ............................................................................................................................... 5 6.3 Seismic Design Criteria ......................................................................................................... 5 6.4 Liquefaction Potential ............................................................................................................ 7 6.5 Slope Stability ........................................................................................................................ 8 6.6 Earthquake-Induced Flooding ................................................................................................ 8 6.7 Tsunamis, Seiches, and Flooding ........................................................................................... 8 6.8 Oil Fields & Methane Potential ............................................................................................. 8 6.9 Subsidence ............................................................................................................................. 9
7. CONCLUSIONS AND RECOMMENDATIONS ......................................................................... 10 7.1 General ................................................................................................................................. 10 7.2 Soil and Excavation Characteristics ..................................................................................... 12 7.3 Minimum Resistivity, pH and Water-Soluble Sulfate ......................................................... 12 7.4 Grading ................................................................................................................................ 13 7.5 Conventional Foundation Design ........................................................................................ 15 7.6 Foundation Settlement ......................................................................................................... 16 7.7 Lateral Design ...................................................................................................................... 17 7.8 Miscellaneous Foundations .................................................................................................. 17 7.9 Concrete Slabs-on-Grade ..................................................................................................... 18 7.10 Preliminary Pavement Recommendations ........................................................................... 20 7.11 Retaining Wall Design ......................................................................................................... 21 7.12 Dynamic (Seismic) Lateral Forces ....................................................................................... 23 7.13 Retaining Wall Drainage ...................................................................................................... 24 7.14 Elevator Pit Design .............................................................................................................. 24 7.15 Elevator Piston ..................................................................................................................... 25 7.16 Temporary Excavations ....................................................................................................... 25 7.17 Shoring – Soldier Pile Design and Installation .................................................................... 26 7.18 Temporary Tie-Back Anchors ............................................................................................. 31 7.19 Anchor Installation............................................................................................................... 32 7.20 Anchor Testing .................................................................................................................... 32 7.21 Internal Bracing ................................................................................................................... 33 7.22 Stormwater Infiltration ......................................................................................................... 33 7.23 Surface Drainage .................................................................................................................. 34 7.24 Plan Review ......................................................................................................................... 34
TABLE OF CONTENTS (Continued) LIMITATIONS AND UNIFORMITY OF CONDITIONS LIST OF REFERENCES MAPS, TABLES, AND ILLUSTRATIONS Figure 1, Vicinity Map Figure 2, Site Plan Figure 3, Regional Fault Map Figure 4, Regional Seismicity Map Figures 5 and 6, Retaining Wall Drainage Figures 7 and 8, Percolation Test Results
APPENDIX A FIELD INVESTIGATION Figures A1 through A4, Boring Logs
APPENDIX B LABORATORY TESTING Figures B1 through B10, Direct Shear Test Results Figures B11 and B20, Consolidation Test Results Figure B21 and B22, Modified Compaction Test of Soils Figure B23, Corrosivity Test Results
Geocon Project No. A9060-06-18 - 1 - August 15, 2019
GEOTECHNICAL INVESTIGATION
1. PURPOSE AND SCOPE
This report presents the results of a geotechnical investigation for the proposed multi-family residential
development located at South Hilgard Avenue (Tract: TR 10690, Lots: 6-8) in the City of Los Angeles,
California (see Vicinity Map, Figure 1). The purpose of the investigation was to evaluate subsurface
soil and geologic conditions underlying the site and, based on conditions encountered, to provide
conclusions and recommendations pertaining to the geotechnical aspects of design and construction.
The scope of this investigation included a site reconnaissance, field exploration, laboratory testing,
engineering analysis, and the preparation of this report. The site was explored on July 16, 2019, by
excavating four 8-inch diameter boring to depths of approximately 30½ to 55½ feet below the existing
ground surface utilizing a truck-mounted hollow-stem auger drilling machine. The approximate
locations of the exploratory borings are depicted on the Site Plan (see Figure 2). A detailed discussion
of the field investigation, including boring logs, is presented in Appendix A.
Laboratory tests were performed on selected soil samples obtained during the investigation to
determine pertinent physical and chemical soil properties. Appendix B presents a summary of the
laboratory test results.
The recommendations presented herein are based on analysis of the data obtained during the
investigation and our experience with similar soil and geologic conditions. References reviewed to
prepare this report are provided in the List of References section.
If project details vary significantly from those described herein, Geocon should be contacted to
determine the necessity for review and possible revision of this report.
2. SITE AND PROJECT DESCRIPTION
The subject site is located at South Hilgard Avenue (Tract: TR 10690, Lots: 6-8) in the City of Los
Angeles, California. The site is an irregularly-shaped parcel that is currently a vacant lot. The site is
bounded by Lindbrook Drive to the south, by South Hilgard Avenue to the west, by a two-story
residential structure to the east, and by a single-story university structure to the north. The site is
relatively level to gently sloping to the south with no pronounced highs or lows. Surface water drainage
at the site appears to be by sheet flow along the existing ground contours to the city streets. There is no
vegetation at the site.

Geocon Project No. A9060-06-18 - 2 - August 15, 2019
Based on the information provided by the Client, it is our understanding that the proposed development
will consist of four to eight-story multi-family residential structures to be constructed over two
subterranean parking levels. Due to the preliminary nature of the project, formal plans depicting the
proposed development are not available for inclusion in this report. The proposed structures are
depicted on the Site Plan (see Figure 2).
Based on the preliminary nature of the design at this time, wall and column loads were not available.
It is anticipated that column loads for the proposed eight-story residential structures will be up to
1,200 kips, and wall loads will be up to 12 kips per linear foot, and column loads for the proposed four-
story residential structures will be up to 800 kips, and wall loads will be up to 8 kips per linear foot.
Once the design phase and foundation loading configuration proceeds to a more finalized plan, the
recommendations within this report should be reviewed and revised, if necessary. Any changes in the
design, location or elevation of any structure, as outlined in this report, should be reviewed by this office.
Geocon should be contacted to determine the necessity for review and possible revision of this report.
3. GEOLOGIC SETTING
The site is located on an older alluvial fan surface along the southern flank of the Santa Monica
Mountains, approximately 0.9 mile south of the mouth of Stone Canyon. The Santa Monica Mountains,
formed during regional uplift, trend east-west on the north side of the Los Angeles Basin and constitute
the southern boundary of the Transvers Ranges geomorphic province. Structurally, the Santa Monica
Mountains are a broad west-plunging anticline. The south flank of the anticline is truncated by the
Hollywood-Santa Monica Fault Zone which separates the mountain range from the Los Angeles Basin
to the south. Rock types exposed in the eastern Santa Monica Mountains consist of metasedimentary
rocks associated with the Jurassic age Santa Monica Slate, Cretaceous age igneous rocks, and
Cretaceous age and Miocene age sedimentary rocks.
Regionally, the site is located within the Transverse Ranges geomorphic province, near the boundary of
the Peninsular Ranges geomorphic province. The Transverse Ranges is characterized by east-west
geologic structures in contrast to the Peninsular Ranges, characterized by northwest-trending geologic
structures. The Santa Monica Fault Zone, located approximately 0.6 mile to the south of the site, forms
the boundary between the Peninsular Ranges and the Transverse Ranges geomorphic provinces in the
immediate site vicinity.
4. SOIL AND GEOLOGIC CONDITIONS
Based on our field investigation and published geologic maps of the area, the site is underlain by
artificial fill and Pleistocene age alluvial fan deposits consisting of sand, silt and gravel derived from
the Santa Monica Mountains to the north (Dibblee, 1991; California Geological Survey [CGS], 2012).
Detailed stratigraphic profiles of the materials encountered at the site are provided on the boring logs in
Appendix A.

Geocon Project No. A9060-06-18 - 3 - August 15, 2019
4.1 Artificial Fill
Artificial fill was encountered in our field explorations to a maximum depth of 15 feet below the
existing ground surface. The artificial fill generally consists of brown to dark brown silty sand, sand
with silt, and clay with sand, with varying amounts of gravel. The artificial fill is characterized as dry
to slightly moist and very loose to loose or soft with varying amounts of gravel and concrete fragments.
The fill is likely the result of past grading or construction activities at the site. Deeper fill may exist
between excavations and in other portions of the site that were not directly explored.
4.2 Older Alluvium
Pleistocene age older alluvium was encountered beneath the fill. The alluvium generally consists of
brown to reddish brown poorly graded and well-graded sand, silty sand, sand with silt, and silt with
varying amounts of gravel. The alluvial soils are characterized as fine- to coarse-grained, slightly moist
to saturated and loose to very dense or hard.
5. GROUNDWATER
Review of the Seismic Hazard Zone Report for the Beverly Hills Quadrangle (California Division of
Mines and Geology [CDMG], 1998) indicates the historically highest groundwater level in the area is
approximately 25 feet beneath the ground surface. Groundwater information presented in this
document is generated from data collected in the early 1900’s to the late 1990s. Based on current
groundwater basin management practices, it is unlikely that groundwater levels will ever exceed the
historic high levels.
Groundwater was encountered in borings B1 and B2 at depths of 52.3 and 53.0 feet below the existing
ground surface, respectively. Considering the depth to groundwater encountered in our borings,
groundwater is not anticipated to be encountered during construction. However, it is not uncommon for
groundwater levels to vary seasonally or for groundwater seepage conditions to develop where none
previously existed, especially in impermeable fine-grained soils which are heavily irrigated or after
seasonal rainfall. In addition, recent requirements for stormwater infiltration could result in shallower
seepage conditions in the immediate site vicinity. Proper surface drainage of irrigation and
precipitation will be critical for future performance of the project. Recommendations for drainage are
provided in the Surface Drainage section of this report (see Section 7.23).

Geocon Project No. A9060-06-18 - 4 - August 15, 2019
6. GEOLOGIC HAZARDS
6.1 Surface Fault Rupture
The numerous faults in Southern California include active, potentially active, and inactive faults.
The criteria for these major groups are based on criteria developed by the California Geological Survey
(CGS, formerly known as CDMG) for the Alquist-Priolo Earthquake Fault Zone Program (CGS,
2018a). By definition, an active fault is one that has had surface displacement within Holocene time
(about the last 11,700 years). A potentially active fault has demonstrated surface displacement during
Quaternary time (approximately the last 1.6 million years), but has had no known Holocene movement.
Faults that have not moved in the last 1.6 million years are considered inactive.
The site is not within a state-designated Alquist-Priolo Earthquake Fault Zone (CGS, 2019a and 2019b;
CGS, 2018b) nor a city-designated Preliminary Fault Rupture Study Area (City of Los Angeles, 2019)
for surface fault rupture hazards. No active or potentially active faults with the potential for surface
fault rupture are known to pass directly beneath the site. Therefore, the potential for surface rupture due
to faulting occurring beneath the site during the design life of the proposed development is considered
low. However, the site is located in the seismically active Southern California region, and could be
subjected to moderate to strong ground shaking in the event of an earthquake on one of the many active
Southern California faults. The faults in the vicinity of the site are shown in Figure 3, Regional Fault
Map.
The nearest surface trace of an active fault to the site is the Santa Monica Fault Zone located
approximately 0.6 mile to the south (CGS, 2018b). Other nearby active faults are the Newport-Inglewood
Fault Zone, the Hollywood Fault, the Raymond Fault, the Malibu Coast Fault, and the Northridge Fault
located approximately 1.5 miles east, 2.3 miles northeast, 11.6 miles east-northeast, 12 miles west, and
12.3 miles north of the site, respectively (Ziony and Jones, 1989). The active San Andreas Fault Zone is
located approximately 39 miles northeast of the site (Ziony and Jones, 1989).
Several buried thrust faults, commonly referred to as blind thrusts, underlie the Los Angeles Basin at
depth. These faults are not exposed at the ground surface and are typically identified at depths greater
than 3.0 kilometers. The October 1, 1987 Mw 5.9 Whittier Narrows earthquake and the January 17,
1994 Mw 6.7 Northridge earthquake were a result of movement on the Puente Hills Blind Thrust and
the Northridge Thrust, respectively. These thrust faults and others in the Los Angeles area are not
exposed at the surface and do not present a potential surface fault rupture hazard at the site; however,
these deep thrust faults are considered active features capable of generating future earthquakes that
could result in moderate to significant ground shaking at the site.

Geocon Project No. A9060-06-18 - 5 - August 15, 2019
6.2 Seismicity
As with all of Southern California, the site has experienced historic earthquakes from various regional
faults. The seismicity of the region surrounding the site was formulated based on research of an
electronic database of earthquake data. The epicenters of recorded earthquakes with magnitudes equal
to or greater than 5.0 in the site vicinity are depicted on Figure 4, Regional Seismicity Map. A partial
list of moderate to major magnitude earthquakes that have occurred in the Southern California area
within the last 100 years is included in the following table.
LIST OF HISTORIC EARTHQUAKES
Earthquake (Oldest to Youngest)
Date of Earthquake Magnitude Distance to Epicenter
(Miles)
Direction to
Epicenter
Near Redlands July 23, 1923 6.3 68 E Long Beach March 10, 1933 6.4 41 SE Tehachapi July 21, 1952 7.5 73 NW San Fernando February 9, 1971 6.6 24 N Whittier Narrows October 1, 1987 5.9 21 E Sierra Madre June 28, 1991 5.8 29 ENE Landers June 28, 1992 7.3 115 E Big Bear June 28, 1992 6.4 93 E Northridge January 17, 1994 6.7 12 NW Hector Mine October 16, 1999 7.1 129 ENE Ridgecrest July 5, 2019 7.1 127 NNE
The site could be subjected to strong ground shaking in the event of an earthquake. However, this
hazard is common in Southern California and the effects of ground shaking can be mitigated if the
proposed structures are designed and constructed in conformance with current building codes and
engineering practices.
6.3 Seismic Design Criteria
The following table summarizes summarizes site-specific design criteria obtained from the
2016 California Building Code (CBC; Based on the 2015 International Building Code [IBC] and ASCE
7-10), Chapter 16 Structural Design, Section 1613 Earthquake Loads. The data was calculated using
the computer program U.S. Seismic Design Maps, provided by the USGS. The short spectral response
uses a period of 0.2 second. We evaluated the Site Class based on the discussion in Section 1613.3.2 of
the 2016 CBC and Table 20.3-1 of ASCE 7-10. The values presented on the following page are for the
risk-targeted maximum considered earthquake (MCER).

Geocon Project No. A9060-06-18 - 6 - August 15, 2019
2016 CBC SEISMIC DESIGN PARAMETERS
Parameter Value 2016 CBC Reference
Site Class D Section 1613.3.2
MCER Ground Motion Spectral Response Acceleration – Class B (short), SS
2.241g Figure 1613.3.1(1)
MCER Ground Motion Spectral Response Acceleration – Class B (1 sec), S1
0.824g Figure 1613.3.1(2)
Site Coefficient, FA 1.0 Table 1613.3.3(1)
Site Coefficient, FV 1.5 Table 1613.3.3(2)
Site Class Modified MCER Spectral Response Acceleration (short), SMS
2.241g Section 1613.3.3 (Eqn 16-37)
Site Class Modified MCER Spectral Response Acceleration – (1 sec), SM1
1.236g Section 1613.3.3 (Eqn 16-38)
5% Damped Design Spectral Response Acceleration (short), SDS
1.494g Section 1613.3.4 (Eqn 16-39)
5% Damped Design Spectral Response Acceleration (1 sec), SD1
0.824g Section 1613.3.4 (Eqn 16-40)
The table below presents the mapped maximum considered geometric mean (MCEG) seismic design
parameters for projects located in Seismic Design Categories of D through F in accordance with ASCE
7-10.
ASCE 7-10 PEAK GROUND ACCELERATION
Parameter Value ASCE 7-10 Reference
Mapped MCEG Peak Ground Acceleration, PGA
0.859g Figure 22-7
Site Coefficient, FPGA 1.0 Table 11.8-1
Site Class Modified MCEG Peak Ground Acceleration, PGAM
0.859g Section 11.8.3 (Eqn 11.8-1)
The Maximum Considered Earthquake Ground Motion (MCE) is the level of ground motion that has a
2 percent chance of exceedance in 50 years, with a statistical return period of 2,475 years. According to
the 2016 California Building Code and ASCE 7-10, the MCE is to be utilized for the evaluation of
liquefaction, lateral spreading, seismic settlements, and it is our understanding that the intent of the
Building code is to maintain “Life Safety” during a MCE event. The Design Earthquake Ground
Motion (DE) is the level of ground motion that has a 10 percent chance of exceedance in 50 years, with
a statistical return period of 475 years.

Geocon Project No. A9060-06-18 - 7 - August 15, 2019
Deaggregation of the MCE peak ground acceleration was performed using the USGS online Unified
Hazard Tool, 2008 Conterminous U.S. Dynamic edition. The result of the deaggregation analysis
indicates that the predominant earthquake contributing to the MCE peak ground acceleration is
characterized as a 6.81 magnitude event occurring at a hypocentral distance of 4.72 kilometers from the
site.
Deaggregation was also performed for the Design Earthquake (DE) peak ground acceleration, and
the result of the analysis indicates that the predominant earthquake contributing to the DE peak
ground acceleration is characterized as a 6.74 magnitude occurring at a hypocentral distance of
11.03 kilometers from the site.
Conformance to the criteria in the above tables for seismic design does not constitute any kind of
guarantee or assurance that significant structural damage or ground failure will not occur if a large
earthquake occurs. The primary goal of seismic design is to protect life, not to avoid all damage, since
such design may be economically prohibitive.
6.4 Liquefaction Potential
Liquefaction is a phenomenon in which loose, saturated, relatively cohesionless soil deposits lose shear
strength during strong ground motions. Primary factors controlling liquefaction include intensity and
duration of ground motion, gradation characteristics of the subsurface soils, in-situ stress conditions,
and the depth to groundwater. Liquefaction is typified by a loss of shear strength in the liquefied layers
due to rapid increases in pore water pressure generated by earthquake accelerations.
The current standard of practice, as outlined in the “Recommended Procedures for Implementation of
DMG Special Publication 117, Guidelines for Analyzing and Mitigating Liquefaction in California”
and “Special Publication 117A, Guidelines for Evaluating and Mitigating Seismic Hazards in
California” requires liquefaction analysis to a depth of 50 feet below the lowest portion of the proposed
structure. Liquefaction typically occurs in areas where the soils below the water table are composed of
poorly consolidated, fine to medium-grained, primarily sandy soil. In addition to the requisite soil
conditions, the ground acceleration and duration of the earthquake must also be of a sufficient level to
induce liquefaction.
The State of California Seismic Hazard Zone Map for the Beverly Hills Quadrangle (1999) indicates
that the site is not located in an area designated as having a potential for liquefaction. In addition, a
review of the County of Los Angeles Safety Element (Leighton, 1990) indicates that the site is not
located within an area identified as having a potential for liquefaction. As stated previously, the soils
encountered at the site are Pleistocene age older alluvial fan deposits (CGS, 2012; Dibblee, 1991)
which are typically dense and not prone to liquefaction. Based on these considerations, it is our opinion
that the potential for liquefaction and associated ground deformations at the site is considered very low.

Geocon Project No. A9060-06-18 - 8 - August 15, 2019
6.5 Slope Stability
The topography at the site is relatively level to sloping gently to the south and is not considered
susceptible to slope stability hazards. The site is located within a City of Los Angeles Hillside Grading
Area but is not located within a city-designated Hillside Ordinance Area (City of Los Angeles, 2019).
Additionally, the site is not within an area identified as having a potential for seismic slope instability
(CDMG, 1999). There are no known landslides near the site, nor is the site in the path of any known or
potential landslides. Therefore, the potential for slope stability hazards to adversely affect the proposed
development is considered low.
6.6 Earthquake-Induced Flooding
Earthquake-induced flooding is inundation caused by failure of dams or other water-retaining
structures due to earthquakes. The Los Angeles County Safety Element (Leighton, 1990) indicates that
the site is not located within a potential inundation area for upstream dams or reservoirs. Therefore, the
potential for inundation at the site as a result of an earthquake-induced dam failure is considered low.
6.7 Tsunamis, Seiches, and Flooding
The site is not located within a coastal area. Therefore, tsunamis are not considered a significant hazard
at the site.
Seiches are large waves generated in enclosed bodies of water in response to ground shaking. No major
water-retaining structures are located immediately up gradient from the project site. Therefore,
flooding resulting from a seismically-induced seiche is considered unlikely.
The site is within a Flood Zone X as defined by the Federal Emergency Management Agency (FEMA,
2019; LACDPW, 2019b). Zone X is defined as an area of minimal risk of flooding (LACDPW, 2019b).
6.8 Oil Fields & Methane Potential
Based on a review of the California Division of Oil, Gas and Geothermal Resources (DOGGR) Well
Finder Website, the site is not located within the limits of an oilfield and oil or gas wells are not located
in the immediate site vicinity (DOGGR, 2019). However, due to the voluntary nature of record
reporting by the oil well drilling companies, wells may be improperly located or not shown on the
location map and undocumented wells could be encountered during construction. Any wells
encountered during construction will need to be properly abandoned in accordance with the current
requirements of the DOGGR.
The site is not located within the boundaries of a city-designated Methane Zone or Methane Buffer
Zone (City of Los Angeles, 2019). Since the site is not located within the boundaries of a known oil
field, the potential for the presence of methane or other volatile gases at the site is considered low.

Geocon Project No. A9060-06-18 - 9 - August 15, 2019
However, should it be determined that a methane study is required for the proposed development it is
recommended that a qualified methane consultant be retained to perform the study and provide
mitigation measures as necessary.
6.9 Subsidence
Subsidence occurs when a large portion of land is displaced vertically, usually due to the withdrawal of
groundwater, oil, or natural gas. Soils that are particularly subject to subsidence include those with high
silt or clay content. The site is not located within an area of known ground subsidence. No large-scale
extraction of groundwater, gas, oil, or geothermal energy is occurring or planned at the site or in the
general site vicinity. There appears to be little or no potential for ground subsidence due to withdrawal
of fluids or gases at the site.
Geocon Project No. A9060-06-18 - 10 - August 15, 2019
7. CONCLUSIONS AND RECOMMENDATIONS
7.1 General
7.1.1 It is our opinion that neither soil nor geologic conditions were encountered during the
investigation that would preclude the construction of the proposed development provided the
recommendations presented herein are followed and implemented during design and
construction.
7.1.2 Up to 15 feet of existing artificial fill was encountered during site exploration. The existing fill
encountered is believed to be the result of past grading, construction, and demolition activities
at the site. Deeper fill may exist in other areas of the site that were not directly explored.
Excavation for the proposed subterranean parking level is anticipated to penetrate through the
existing fill and expose competent alluvium throughout the excavation bottom. If needed, the
existing artificial fill and site soils are suitable for re-use as an engineered fill provided the
procedures outlined in the Grading section of this report are followed (see Section 7.4).
7.1.2 Based on these considerations, is recommended that the proposed structure be supported on a
conventional spread foundation system deriving support in the competent older alluvium
found below a depth of 20 feet below the street level. Foundations should be deepened as
necessary to penetrate through any unsuitable or disturbed soils as necessary. It is
recommended that the subgrade exposed at the excavation bottom be proof-rolled with heavy
equipment prior to construction. All foundation excavations must be observed and approved
in writing by the Geotechnical Engineer prior to placement of steel or concrete.
Recommendations for Conventional Foundation Design are provided in Section 7.5.
7.1.3 Where a proposed foundation will be deeper than an existing adjacent offsite foundation, the
proposed foundation must be designed to resist the surcharge imposed by the existing
foundation. The surcharge area may be defined by a 1:1 projection down and away from the
bottom of the foundation.
7.1.4 Due to the presence of some granular soil layers at the proposed foundation level there is a
high potential for caving. The contractor should be prepared for caving conditions and
should be prepared to form foundation excavations as necessary should they extend into
granular soils.
7.1.5 The concrete slab-on-grade and ramp for the subterranean level may bear directly on the
undisturbed older alluvium at the excavation bottom. Any soils that are disturbed should be
properly compacted for slab and ramp support. Where necessary, the existing artificial fill
and older alluvium are suitable for re-use as an engineered fill beneath the building slab
provided the procedures outlined in the Grading section of this report are followed (see
Section 7.4).

Geocon Project No. A9060-06-18 - 11 - August 15, 2019
7.1.6 It is anticipated that excavations on the order of 24 feet in vertical height may be required for
construction of the subterranean level, including foundation depths. Due to the depth of
the excavation and the proximity to the property lines, city streets and adjacent offsite
structures, excavations will require shoring measures in order to provide a stable excavation.
Where shoring is required it is recommended that a soldier pile shoring system by utilized.
In addition, where the proposed excavation will be deeper than and adjacent to an offsite
structure, the proposed shoring should be designed to resist the surcharge imposed by
the adjacent offsite structure. Recommendations for Shoring are provided in Section 7.17 of
this report.
7.1.7 Due to the nature of the proposed design and intent for subterranean levels, waterproofing of
subterranean walls and slabs is recommended, and likely required by the building official.
Particular care should be taken in the design and installation of waterproofing to avoid
moisture problems, or actual water seepage into the structure through any normal shrinkage
cracks which may develop in the concrete walls, floor slab, foundations and/or construction
joints. The design and inspection of the waterproofing is not the responsibility of the
geotechnical engineer. A waterproofing consultant should be retained in order to recommend
a product or method, which would provide protection to subterranean walls, floor slabs and
foundations.
7.1.8 Foundations for small outlying structures, such as block walls up to 6 feet high, planter walls
or trash enclosures, which will not be tied to the proposed structure, may be supported on
conventional foundations bearing on a minimum of 12 inches of newly placed engineered fill
which extends laterally at least 12 inches beyond the foundation area. Where excavation and
proper compaction cannot be performed or is undesirable, foundations may derive support
directly in the undisturbed older alluvium at or below a depth of 24 inches, and should be
deepened as necessary to maintain a minimum 12-inch embedment into the recommended
bearing materials. If the soils exposed in the excavation bottom are soft or loose, compaction
of the soils will be required prior to placing steel or concrete. Compaction of the foundation
excavation bottom is typically accomplished with a compaction wheel or mechanical
whacker and must be observed and approved by a Geocon representative.
7.1.9 Based on the results of percolation testing performed at the site, a stormwater infiltration
system is not considered feasible for this project. The results of the percolation testing are
further discussed in the Stormwater Infiltration section of this report (see Section 7.22).
7.1.10 Once the design and foundation loading configuration proceeds to a more finalized plan, the
recommendations within this report should be reviewed and revised, if necessary. If the
proposed loads will exceed those presented herein, the potential for settlement should be
reevaluated by this office.

Geocon Project No. A9060-06-18 - 12 - August 15, 2019
7.1.11 Any changes in the design, location or elevation of improvements, as outlined in this report,
should be reviewed by this office. Geocon should be contacted to determine the necessity for
review and possible revision of this report.
7.2 Soil and Excavation Characteristics
7.2.1 The in-situ soils can be excavated with moderate effort using conventional excavation
equipment. Caving should be anticipated in unshored excavations, especially where granular
or saturated soils are encountered.
7.2.2 It is the responsibility of the contractor to ensure that all excavations and trenches are
properly sloped, shored and maintained in accordance with applicable OSHA rules and
regulations to maintain safety and maintain the stability of adjacent existing improvements.
7.2.3 All onsite excavations must be conducted in such a manner that potential surcharges from
existing structures, construction equipment, and vehicle loads are resisted. The surcharge
area may be defined by a 1:1 projection down and away from the bottom of an existing
foundation or vehicle load. Penetrations below this 1:1 projection will require special
excavation measures such as sloping and shoring. Excavation recommendations are provided
in the Temporary Excavations section of this report (see Section 7.16).
7.2.4 Due to the nature of the existing site soils encountered during the investigation at the proposed
foundation elevations, the soils are considered to have a “very low” to “low” expansive
potential and are classified as “non-expansive” and “expansive” in accordance with the 2016
California Building Code (CBC) Section 1803.5.3. The recommendations presented herein
assume that the building foundations and slabs will derive support in these materials.
7.3 Minimum Resistivity, pH and Water-Soluble Sulfate
7.3.1 Potential of Hydrogen (pH) and resistivity testing, as well as chloride content testing, were
performed on representative samples of on-site soil to generally evaluate the corrosion
potential to surface utilities. The tests were performed in accordance with California Test
Method Nos. 643 and 422 and indicate that the soils are considered “corrosive” with respect
to corrosion of buried ferrous metals on site. The results are presented in Appendix B (Figure
B23) and should be considered for design of underground structures. Due to the corrosive
potential of the soils, it is recommended that corrosion-resistant ABS pipes (or equivalent)
be utilized in lieu of cast-iron for subdrains and retaining wall drains beneath the structure.
7.3.2 Laboratory tests were performed on representative samples of the on-site soil to measure the
percentage of water-soluble sulfate content. Results from the laboratory water-soluble sulfate
tests are presented in Appendix B (Figure B23) and indicate that the on-site materials possess
a sulfate exposure class of “S0” to concrete structures as defined by 2016 CBC Section 1904
and ACI 318-14 Table 19.3.1.1.
Geocon Project No. A9060-06-18 - 13 - August 15, 2019
7.3.3 Geocon West, Inc. does not practice in the field of corrosion engineering and mitigation.
If corrosion sensitive improvements are planned, it is recommended that a corrosion engineer
be retained to evaluate corrosion test results and incorporate the necessary precautions to
prevent premature corrosion of buried metal pipes and concrete structures in direct contact
with the soils.
7.4 Grading
7.4.1 Earthwork is anticipated to include excavation of site soils for the subterranean levels,
foundations, elevator pit, and utility trenches, as well as placement of backfill for walls,
ramps, and trenches.
7.4.2 A preconstruction conference should be held at the site prior to the beginning of grading
operations with the owner, contractor, civil engineer and geotechnical engineer in
attendance. Special soil handling requirements can be discussed at that time.
7.4.3 Earthwork should be observed, and compacted fill tested by representatives of Geocon West,
Inc. The existing fill and alluvial soil encountered during exploration is suitable for re-use as
an engineered fill, provided any encountered oversize material (greater than 6 inches) and
any encountered deleterious debris is removed.
7.4.4 Grading should commence with the removal of all existing improvements from the area to be
graded. Deleterious debris such as root structures should be exported from the site and
should not be mixed with the fill soils. Asphalt and concrete should not be mixed with the fill
soils unless approved by the Geotechnical Engineer. All existing underground improvements
planned for removal should be completely excavated and the resulting depressions properly
backfilled in accordance with the procedures described herein. Once a clean excavation
bottom has been established, it must be observed and approved in writing by the
Geotechnical Engineer (a representative of Geocon West, Inc.) and the City of Los Angeles
Inspector.
7.4.5 The foundation system for the subterranean portion of the proposed structure may derive
support in the competent older alluvium found below a depth of 20 feet below the street
level. Foundations should be deepened as necessary to penetrate through any unsuitable or
disturbed soils as necessary at the direction of the Geotechnical Engineer (a representative of
Geocon West, Inc.).
7.4.6 The concrete slab-on-grade and ramp for the subterranean portion of the proposed structure
may bear directly on the competent older alluvium at the excavation bottom and or newly
placed engineered fill. It is recommended that the subgrade exposed at the excavation bottom
be proof-rolled with heavy equipment prior to construction. Depending on the season, the
soils at the excavation bottom may be moist and may require stabilization measures.

Geocon Project No. A9060-06-18 - 14 - August 15, 2019
7.4.7 If construction is performed during the rainy season and the excavation bottom becomes
saturated, stabilization measures may have to be implemented to prevent excessive
disturbance the excavation bottom. Should this condition exist, rubber tire equipment should
not be allowed in the excavation bottom until it is stabilized or extensive soil disturbance
could result. Track mounted equipment should be considered to minimize disturbance to the
soils.
7.4.8 One method of subgrade stabilization would consist of introducing a thin lift of 3- to 6-inch
diameter crushed angular rock into the soft excavation bottom. The use of crushed concrete
will also be acceptable. The crushed rock should be spread thinly across the excavation
bottom and pressed into the soils by track rolling or wheel rolling with heavy equipment. It is
very important that voids between the rock fragments are not created so the rock must be
thoroughly pressed or blended into the soils. All subgrade soils must be properly compacted
and proof-rolled in the presence of the Geotechnical Engineer (a representative of Geocon
West, Inc.).
7.4.9 All fill and backfill soils should be placed in horizontal loose layers approximately 6 to
8 inches thick, moisture conditioned to at least two percent over optimum moisture content
and properly compacted in accordance with ASTM D 1557 (latest edition). All man-made
fill shall be compacted to a minimum 90 percent of the maximum dry density per ASTM D
1557 (latest edition).
7.4.10 Where new paving is to be placed, it is recommended that all existing fill and soft alluvial
soils be excavated and properly compacted for paving support. The client should be aware
that excavation and compaction of all existing fill and soft soils in the area of new paving is
not required; however, paving constructed over existing uncertified fill or unsuitable alluvial
soil may experience increased settlement and/or cracking, and may therefore have a shorter
design life and increased maintenance costs. As a minimum, the upper 12 inches of soil
should be scarified, moisture conditioned to optimum moisture content, and compacted to at
least 95 percent relative compaction for paving support. Paving recommendations are
provided in Preliminary Pavement Recommendations section of this report (see Section
7.10).
7.4.11 Although not anticipated for this project, all imported fill shall be observed, tested, and
approved by Geocon West, Inc. prior to bringing soil to the site. Rocks larger than 6 inches
in diameter shall not be used in the fill. If necessary, import soils used as structural fill
should have an expansion index less than 20 and corrosivity properties that are equally or
less detrimental to that of the existing onsite soils (see Figure B23).

Geocon Project No. A9060-06-18 - 15 - August 15, 2019
7.4.12 Utility trenches should be properly backfilled in accordance with the requirements of the
Green Book (latest edition). The pipe should be bedded with clean sands (Sand Equivalent
greater than 30) to a depth of at least 1 foot over the pipe, and the bedding material must be
inspected and approved in writing by the Geotechnical Engineer (a representative of
Geocon). The use of gravel is not acceptable unless used in conjunction with filter fabric to
prevent the gravel from having direct contact with soil. The remainder of the trench backfill
may be derived from onsite soil or approved import soil, compacted as necessary, until the
required compaction is obtained. The use of minimum 2-sack slurry as backfill is also
acceptable. Prior to placing any bedding materials or pipes, the excavation bottom must be
observed and approved in writing by the Geotechnical Engineer (a representative of
Geocon).
7.4.13 All trench and foundation excavation bottoms must be observed and approved in writing by
the Geotechnical Engineer (a representative of Geocon), prior to placing bedding materials,
fill, steel, gravel, or concrete.
7.5 Conventional Foundation Design
7.5.1 Once the subterranean design and foundation loading configuration for the proposed
structure proceeds to a more finalized plan, the recommendations within this report should
be reviewed and revised, if necessary.
7.5.2 A conventional shallow spread foundation system may be utilized for support of the
proposed structure provided foundations derive support in the competent older alluvium
found below a depth of 20 feet below the existing street elevation. Foundations should be
deepened as necessary to penetrate through soft or disturbed soils at the direction of the
Geotechnical Engineer. All foundation excavations must be observed and approved in
writing by the Geotechnical Engineer (a representative of Geocon), prior to placing steel or
concrete.
7.5.3 The contractor should be aware that formwork will likely be required to prevent caving of
shallow spread foundation excavations in granular soils.
7.5.4 Continuous footings may be designed for an allowable bearing capacity of 3,200 pounds per
square foot (psf), and should be a minimum of 12 inches in width, 18 inches in depth below
the lowest adjacent grade, and 12 inches into the recommended bearing material.
7.5.5 Isolated spread foundations may be designed for an allowable bearing capacity of 3,500 psf,
and should be a minimum of 24 inches in width, 18 inches in depth below the lowest
adjacent grade, and 12 inches into the recommended bearing material.

Geocon Project No. A9060-06-18 - 16 - August 15, 2019
7.5.6 The allowable soil bearing pressure above may be increased by 300 psf and 600 psf for each
additional foot of foundation width and depth, respectively, up to a maximum allowable soil
bearing pressure of 5,900 psf.
7.5.7 The allowable bearing pressures may be increased by one-third for transient loads due to
wind or seismic forces.
7.5.8 If depth increases are utilized for the exterior wall footings, this office should be provided a
copy of the final construction plans so that the excavation recommendations presented herein
could be properly reviewed and revised if necessary.
7.5.9 Continuous footings should be reinforced with a minimum of four No. 4 steel reinforcing
bars, two placed near the top of the footing and two near the bottom. The reinforcement for
isolated spread footings should be designed by the project structural engineer.
7.5.10 The above foundation dimensions and minimum reinforcement recommendations are based
on soil conditions and building code requirements only and are not intended to be used in
lieu of those required for structural purposes.
7.5.11 No special subgrade pre-saturation is required prior to placement of concrete. However, the
moisture in the foundation subgrade should be sprinkled as necessary to maintain a moist
condition at the time of concrete placement.
7.5.12 Foundation excavations should be observed and approved in writing by the Geotechnical
Engineer (a representative of Geocon West, Inc.), prior to the placement of reinforcing steel
and concrete to verify that the excavations and exposed soil conditions are consistent with
those anticipated. If unanticipated soil conditions are encountered, foundation modifications
may be required.
7.5.13 This office should be provided a copy of the final construction plans so that the excavation
recommendations presented herein could be properly reviewed and revised if necessary.
7.6 Foundation Settlement
7.6.1 The maximum expected total settlement for a four-story structure supported on a
conventional foundation system designed with the maximum allowable bearing value of
5,900 psf and deriving support in the competent older alluvium at the excavation bottom is
estimated to be less than 1 inch and occur below the heaviest loaded structural element.
Settlement of the foundation system is expected to occur on initial application of loading.
Differential settlement is expected to be less than ½ inch over a distance of 20 feet.
Geocon Project No. A9060-06-18 - 17 - August 15, 2019
7.6.2 The maximum expected total settlement for an eight-story structure supported on a
conventional foundation system designed with the maximum allowable bearing value of
5,900 psf and deriving support in the competent older alluvium at the excavation bottom is
estimated to be less than 1¼ inch and occur below the heaviest loaded structural element.
Settlement of the foundation system is expected to occur on initial application of loading.
Differential settlement is expected to be less than ¾ inch over a distance of 20 feet.
7.6.3 Once the design and foundation loading configurations for the proposed structure proceeds to
a more finalized plan, the estimated settlements presented in this report should be reviewed
and revised, if necessary. If the final foundation loading configurations are greater than the
assumed loading conditions the potential for settlement should be reevaluated by this office.
7.7 Lateral Design
7.7.1 Resistance to lateral loading may be provided by friction acting at the base of foundations,
slabs and by passive earth pressure. An allowable coefficient of friction of 0.38 may be used
with the dead load forces in the newly placed engineered fill and/or in competent older
alluvium.
7.7.2 Passive earth pressure for the sides of foundations and slabs poured against engineered fill
or competent older alluvium may be computed as an equivalent fluid having a density of
240 pcf with a maximum earth pressure of 2,400 pcf. When combining passive and friction
for lateral resistance, the passive component should be reduced by one-third. A one-third
increase in the passive value may be used for wind or seismic loads.
7.8 Miscellaneous Foundations
7.8.1 Foundations for small outlying structures, such as block walls up to 6 feet in height, planter
walls or trash enclosures, which will not be structurally supported by the proposed building,
may be supported on conventional foundations deriving support on a minimum of 12 inches
of newly placed engineered fill which extends laterally at least 12 inches beyond the
foundation area. Where excavation and compaction cannot be performed, such as adjacent to
property lines, foundations may bear in the undisturbed alluvial soils at and below a depth of
24 inches, and should be deepened as necessary to maintain a 12 inch embedment in to the
recommended bearing materials.
Geocon Project No. A9060-06-18 - 18 - August 15, 2019
7.8.2 If the soils exposed in the excavation bottom are soft, compaction of the soft soils will be
required prior to placing steel or concrete. Compaction of the foundation excavation bottom
is typically accomplished with a compaction wheel or mechanical whacker and must be
observed and approved by a Geocon representative. Miscellaneous foundations may be
designed for a bearing value of 1,500 psf and should be a minimum of 12 inches in width,
18 inches in depth below the lowest adjacent grade and 12 inches into the recommended
bearing material. The allowable bearing pressure may be increased by up to one-third for
transient loads due to wind or seismic forces.
7.8.3 Foundation excavations should be observed and approved in writing by the Geotechnical
Engineer (a representative of Geocon West, Inc.), prior to the placement of reinforcing steel
and concrete to verify that the excavations and exposed soil conditions are consistent with
those anticipated.
7.9 Concrete Slabs-on-Grade
7.9.1 Unless specifically evaluated and designed by a qualified structural engineer, the
slab-on-grade for the subterranean parking level should be a minimum of 5 inches of
concrete reinforced with No. 3 steel reinforcing bars placed 18 inches on center in
both horizontal directions and positioned vertically near the slab midpoint. The concrete
slab-on-grade may bear directly on the older alluvium found at the excavation bottom.
The ramp may derive support in the undisturbed older alluvium and/or engineered fill.
Any disturbed soils should be properly compacted for slab and ramp support.
7.9.2 Due to the nature of the proposed subterranean level and presence of seepage along the
bedrock contact, waterproofing of subterranean walls and slabs is recommended for this
project. Particular care should be taken in the design and installation of waterproofing to
avoid moisture problems, or actual water seepage into the structure through any normal
shrinkage cracks which may develop in the concrete walls, floor slab, foundations and/or
construction joints. The design and inspection of the waterproofing is not the responsibility
of the geotechnical engineer. A waterproofing consultant should be retained in order to
recommend a product or method, which would provide protection to subterranean walls,
floor slabs and foundations.

Geocon Project No. A9060-06-18 - 19 - August 15, 2019
7.9.3 Slabs-on-grade at the ground surface that may receive moisture-sensitive floor coverings or
may be used to store moisture-sensitive materials should be underlain by a vapor retarder
placed directly beneath the slab. The vapor retarder and acceptable permeance should be
specified by the project architect or developer based on the type of floor covering that will be
installed. The vapor retarder design should be consistent with the guidelines presented in
Section 9.3 of the American Concrete Institute’s (ACI) Guide for Concrete Slabs that
Receive Moisture-Sensitive Flooring Materials (ACI 302.2R-06) and should be installed in
general conformance with ASTM E 1643 (latest edition) and the manufacturer’s
recommendations. A minimum thickness of 15 mils extruded polyolefin plastic is
recommended; vapor retarders which contain recycled content or woven materials are not
recommended. The vapor retarder should have a permeance of less than 0.01 perms
demonstrated by testing before and after mandatory conditioning. The vapor retarder should
be installed in direct contact with the concrete slab with proper perimeter seal. If the
California Green Building Code requirements apply to this project, the vapor retarder should
be underlain by 4 inches of clean aggregate. It is important that the vapor retarder be
puncture resistant since it will be in direct contact with angular gravel. As an alternative to
the clean aggregate suggested in the Green Building Code, it is our opinion that the concrete
slab-on-grade may be underlain by a vapor retarder over 4 inches of clean sand (sand
equivalent greater than 30), since the sand will serve a capillary break and will minimize the
potential for punctures and damage to the vapor barrier.
7.9.4 For seismic design purposes, a coefficient of friction of 0.38 may be utilized between
concrete slabs and subgrade soils without a moisture barrier, and 0.15 for slabs underlain by
a moisture barrier.
7.9.5 Exterior slabs for walkways or flatwork, not subject to traffic loads, should be at least
4 inches thick and reinforced with No. 3 steel reinforcing bars placed 18 inches on center in
both horizontal directions, positioned near the slab midpoint. Prior to construction of slabs,
the upper 12 inches of subgrade should be moistened to optimum moisture content and
properly compacted to at least 95 percent relative compaction, as determined by ASTM Test
Method D 1557 (latest edition).
7.9.6 Crack control joints should be spaced at intervals not greater than 12 feet and should be
constructed using saw-cuts or other methods as soon as practical following concrete
placement. Crack control joints should extend a minimum depth of one-fourth the slab
thickness. The project structural engineer should design construction joints as necessary.

Geocon Project No. A9060-06-18 - 20 - August 15, 2019
7.9.7 The recommendations of this report are intended to reduce the potential for cracking of slabs
due to settlement. However, even with the incorporation of the recommendations presented
herein, foundations, stucco walls, and slabs-on-grade may exhibit some cracking due to
minor soil movement and/or concrete shrinkage. The occurrence of concrete shrinkage
cracks is independent of the supporting soil characteristics. Their occurrence may be reduced
and/or controlled by limiting the slump of the concrete, proper concrete placement and
curing, and by the placement of crack control joints at periodic intervals, in particular, where
re-entrant slab corners occur.
7.10 Preliminary Pavement Recommendations
7.10.1 Where new paving is to be placed, it is recommended that all existing fill and soft alluvium
be excavated and properly compacted for paving support. The client should be aware that
excavation and compaction of all existing artificial fill and soft alluvium in the area of new
paving is not required; however, paving constructed over existing uncertified fill or
unsuitable alluvium material may experience increased settlement and/or cracking, and may
therefore have a shorter design life and increased maintenance costs. As a minimum, the
upper 12 inches of paving subgrade should be scarified, moisture conditioned to optimum
moisture content, and properly compacted to at least 95 percent relative compaction, as
determined by ASTM Test Method D 1557 (latest edition).
7.10.2 The following pavement sections are based on an assumed R-Value of 35. Once site grading
activities are complete an R-Value should be obtained by laboratory testing to confirm the
properties of the soils serving as paving subgrade, prior to placing pavement.
7.10.3 The Traffic Indices listed below are estimates. Geocon does not practice in the field of traffic
engineering. The actual Traffic Index for each area should be determined by the project civil
engineer. If pavement sections for Traffic Indices other than those listed below are required,
Geocon should be contacted to provide additional recommendations. Pavement thicknesses
were determined following procedures outlined in the California Highway Design Manual
(Caltrans). It is anticipated that the majority of traffic will consist of automobile and large
truck traffic.
PRELIMINARY PAVEMENT DESIGN SECTIONS
Location Estimated Traffic
Index (TI) Asphalt Concrete
(inches) Class 2 Aggregate
Base (inches)
Automobile Parking and Driveways 4.0 3.0 4.0
Trash Truck & Fire Lanes 7.0 4.0 8.5

Geocon Project No. A9060-06-18 - 21 - August 15, 2019
7.10.4 Asphalt concrete should conform to Section 203-6 of the “Standard Specifications for Public
Works Construction” (Green Book). Class 2 aggregate base materials should conform to
Section 26-1.02A of the “Standard Specifications of the State of California, Department of
Transportation” (Caltrans). The use of Crushed Miscellaneous Base (CMB) in lieu of Class
2 aggregate base is acceptable. Crushed Miscellaneous Base should conform to Section
200-2.4 of the “Standard Specifications for Public Works Construction” (Green Book).
7.10.5 Unless specifically designed and evaluated by the project structural engineer, where exterior
concrete paving will be utilized for support of vehicles, it is recommended that the concrete
be a minimum of 6 inches of concrete reinforced with No. 3 steel reinforcing bars placed
18 inches on center in both horizontal directions. Concrete paving supporting vehicular
traffic should be underlain by a minimum of 4 inches of aggregate base and a properly
compacted subgrade. The subgrade and base material should be compacted to 95 percent
relative compaction, as determined by ASTM Test Method D 1557 (latest edition).
7.10.6 The performance of pavements is highly dependent upon providing positive surface drainage
away from the edge of pavements. Ponding of water on or adjacent to the pavement will
likely result in saturation of the subgrade materials and subsequent cracking, subsidence and
pavement distress. If planters are planned adjacent to paving, it is recommended that the
perimeter curb be extended at least 12 inches below the bottom of the aggregate base to
minimize the introduction of water beneath the paving.
7.11 Retaining Wall Design
7.11.1 The recommendations presented below are generally applicable to the design of rigid
concrete or masonry retaining walls having a maximum height of 22 feet. In the event that
walls higher than 22 feet are planned, Geocon should be contacted for additional
recommendations.
7.11.2 Retaining wall foundations may be designed in accordance with the recommendations
provided in the Conventional Foundation Design section of this report (see Section 7.5).
7.11.3 Retaining walls with a level backfill surface that are not restrained at the top should be
designed utilizing a triangular distribution of pressure (active pressure). Restrained walls are
those that are not allowed to rotate more than 0.001H (where H equals the height of the
retaining portion of the wall in feet) at the top of the wall. Where walls are restrained from
movement at the top, walls may be designed utilizing a triangular distribution of pressure
(at-rest pressure). It is recommended that the equivalent fluid pressures provided in the
following table be utilized for design.

Geocon Project No. A9060-06-18 - 22 - August 15, 2019
HEIGHT OF RETAINING WALL (Feet)
ACTIVE PRESSURE EQUIVALENT FLUID
PRESSURE (Pounds Per Cubic Foot)
AT-REST PRESSURE EQUIVALENT FLUID
PRESSURE (Pounds Per Cubic Foot)
Up to 22 41 65
7.11.4 The wall pressures provided above assume that the retaining wall will be properly drained
preventing the buildup of hydrostatic pressure. If retaining wall drainage is not implemented,
the equivalent fluid pressure to be used in design of undrained walls is 90 pcf. The value
includes hydrostatic pressures plus buoyant lateral earth pressures.
7.11.5 The wall pressures provided above assume that the proposed retaining walls will support
relatively undisturbed older alluvium. If sloping techniques are to be utilized for construction
of proposed walls, which would result in a wedge of engineered fill behind the retaining
walls, revised earth pressures may be required to account for the expansive potential of the
soil placed as engineered fill. This should be evaluated once the use of sloping measures is
established and once the geotechnical characteristics of the engineered backfill soils can be
further evaluated.
7.11.6 Additional active pressure should be added for a surcharge condition due to sloping ground,
vehicular traffic or adjacent structures and should be designed for each condition as the
project progresses.
7.11.7 It is recommended that line-load surcharges from adjacent wall footings, use horizontal
pressures generated from NAV-FAC DM 7.2. The governing equations are: ≤ 0.4 ( ) = 0.20 ×0.16 + ×
and > 0.4
( ) = 1.28 × ×+ ×
where x is the distance from the face of the excavation to the vertical line-load, H is the
distance from the bottom of the footing to the bottom of excavation, z is the depth at which
the horizontal pressure is desired, QL is the vertical line-load and σH is the horizontal
pressure at depth z.
Geocon Project No. A9060-06-18 - 23 - August 15, 2019
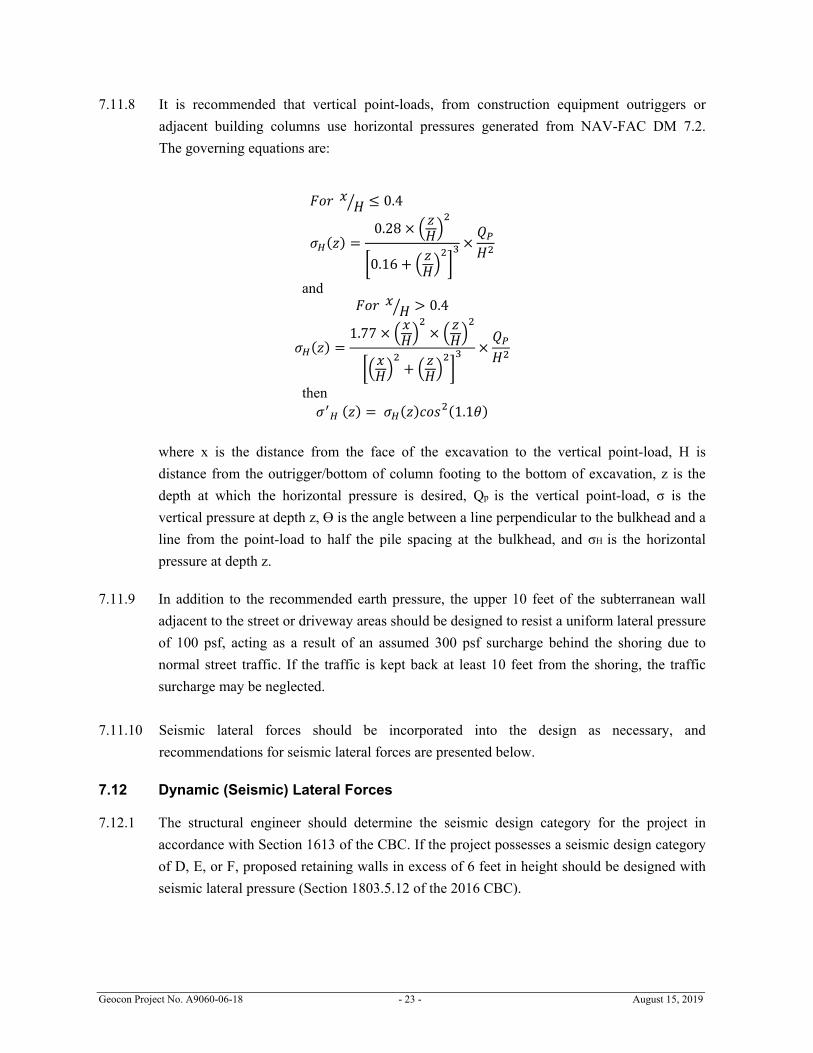
7.11.8 It is recommended that vertical point-loads, from construction equipment outriggers or
adjacent building columns use horizontal pressures generated from NAV-FAC DM 7.2.
The governing equations are: ≤ 0.4 ( ) = 0.28 ×0.16 + ×
and > 0.4
( ) = 1.77 × ×+ ×
then ( ) = ( ) (1.1 )
where x is the distance from the face of the excavation to the vertical point-load, H is
distance from the outrigger/bottom of column footing to the bottom of excavation, z is the
depth at which the horizontal pressure is desired, Qp is the vertical point-load, σ is the
vertical pressure at depth z, ϴ is the angle between a line perpendicular to the bulkhead and a
line from the point-load to half the pile spacing at the bulkhead, and σH is the horizontal
pressure at depth z.
7.11.9 In addition to the recommended earth pressure, the upper 10 feet of the subterranean wall
adjacent to the street or driveway areas should be designed to resist a uniform lateral pressure
of 100 psf, acting as a result of an assumed 300 psf surcharge behind the shoring due to
normal street traffic. If the traffic is kept back at least 10 feet from the shoring, the traffic
surcharge may be neglected.
7.11.10 Seismic lateral forces should be incorporated into the design as necessary, and
recommendations for seismic lateral forces are presented below.
7.12 Dynamic (Seismic) Lateral Forces
7.12.1 The structural engineer should determine the seismic design category for the project in
accordance with Section 1613 of the CBC. If the project possesses a seismic design category
of D, E, or F, proposed retaining walls in excess of 6 feet in height should be designed with
seismic lateral pressure (Section 1803.5.12 of the 2016 CBC).
Geocon Project No. A9060-06-18 - 24 - August 15, 2019
7.12.2 A seismic load of 10 pcf should be used for design of walls that support more than 6 feet of
backfill in accordance with Section 1803.5.12 of the 2016 CBC. The seismic load is applied
as an equivalent fluid pressure along the height of the wall and the calculated loads result in
a maximum load exerted at the base of the wall and zero at the top of the wall. This seismic
load should be applied in addition to the active earth pressure. The earth pressure is based on
half of two-thirds of PGAM calculated from ASCE 7-10 Section 11.8.3.
7.13 Retaining Wall Drainage
7.13.1 Retaining walls not designed for hydrostatic pressure should be provided with a drainage
system. At the base of the drain system, a subdrain covered with a minimum of 12 inches of
gravel should be installed, and a compacted fill blanket or other seal placed at the surface
(see Figure 5). The clean bottom and subdrain pipe, behind a retaining wall, should be
observed by the Geotechnical Engineer (a representative of Geocon), prior to placement of
gravel or compacting backfill.
7.13.2 As an alternative, a plastic drainage composite such as Miradrain or equivalent may be
installed in continuous, 4-foot-wide columns along the entire back face of the wall, at 8 feet
on center. The top of these drainage composite columns should terminate approximately
18 inches below the ground surface, where either hardscape or a minimum of 18 inches of
relatively cohesive material should be placed as a cap (see Figure 6). These vertical columns
of drainage material would then be connected at the bottom of the wall to a collection panel
or a 1-cubic-foot rock pocket drained by a 4-inch subdrain pipe.
7.13.3 Subdrainage pipes at the base of the retaining wall drainage system should outlet to an
acceptable location via controlled drainage structures.
7.13.4 Moisture affecting below grade walls is one of the most common post-construction
complaints. Poorly applied or omitted waterproofing can lead to efflorescence or standing
water. Particular care should be taken in the design and installation of waterproofing to avoid
moisture problems, or actual water seepage into the structure through any normal shrinkage
cracks which may develop in the concrete walls, floor slab, foundations and/or construction
joints. The design and inspection of the waterproofing is not the responsibility of the
geotechnical engineer. A waterproofing consultant should be retained in order to recommend
a product or method, which would provide protection to subterranean walls, floor slabs and
foundations.
7.14 Elevator Pit Design
7.14.1 The elevator pit slab and retaining wall should be designed by the project structural engineer.
Elevator pits may be designed in accordance with the recommendations in the Foundation
Design and Retaining Wall Design sections of this report (see Sections 7.5 and 7.11).

Geocon Project No. A9060-06-18 - 25 - August 15, 2019
7.14.2 Additional active pressure should be added for a surcharge condition due to sloping ground,
vehicular traffic, or adjacent foundations and should be designed for each condition as the
project progresses.
7.14.3 It is recommended that the elevator pit walls and slab be waterproofed to prevent water
inside of the elevator pit. Waterproofing design and installation is not the responsibility of
the geotechnical engineer.
7.15 Elevator Piston
7.15.1 If a plunger-type elevator piston is installed for this project, a deep drilled excavation will be
required. It is important to verify that the drilled excavation is not situated immediately
adjacent to a foundation or shoring pile, or the drilled excavation could compromise the
existing foundation or pile support, especially if the drilling is performed subsequent to the
foundation or pile construction.
7.15.2 Groundwater seepage was encountered at a depth of 52.3 feet below the ground surface, and
the contractor should be prepared for groundwater during deep excavation. Casing will be
required since caving is expected in the drilled excavation and the contractor should be
prepared to use casing and should have it readily available at the commencement of drilling
activities. Continuous observation of the drilling and installation of the elevator piston by the
Geotechnical Engineer (a representative of Geocon West, Inc.) is required.
7.15.3 The annular space between the piston casing and drilled excavation wall should be filled
with a minimum of 1½-sack slurry pumped from the bottom up. As an alternative, pea gravel
may be utilized. The use of soil to backfill the annular space is not acceptable.
7.16 Temporary Excavations
7.16.1 Excavations on the order of 24 feet in vertical height may be required for excavation of the
subterranean levels, including foundation depths. The excavations are expected to expose
artificial fill and alluvial soils, which may be subject to caving where granular soils are
exposed.
7.16.2 Temporary vertical excavations up to 5 feet in height may be attempted where not
surcharged by adjacent traffic or structures. Vertical excavations greater than 5 feet
will require sloping and/or shoring measures in order to provide a stable excavation.
Where sufficient space is available, temporary unsurcharged embankments could be sloped
back at a uniform 1:1 slope gradient or flatter, up to a maximum of 8 feet in height.
A uniform slope does not have a vertical portion. Where space is limited shoring measures
will be required. Recommendations for shoring are provided in the following section of this
report.

Geocon Project No. A9060-06-18 - 26 - August 15, 2019
7.16.3 Where sloped embankments are utilized, the top of the slope should be barricaded to prevent
vehicles and storage loads at the top of the slope within a horizontal distance equal to the
height of the slope. If the temporary construction embankments are to be maintained during
the rainy season, berms are suggested along the tops of the slopes where necessary to prevent
runoff water from entering the excavation and eroding the slope faces. Geocon personnel
should inspect the soils exposed in the cut slopes during excavation so that modifications of
the slopes can be made if variations in the soil conditions occur. All excavations should be
stabilized within 30 days of initial excavation.
7.17 Shoring – Soldier Pile Design and Installation
7.17.1 The following information on the design and installation of shoring is preliminary. Review
of the final shoring plans and specifications should be made by this office prior to bidding or
negotiating with a shoring contractor.
7.17.2 One method of shoring would consist of steel soldier piles, placed in drilled holes and
backfilled with concrete. The steel soldier piles may also be installed utilizing high
frequency vibration. Where maximum excavation heights are less than 12 feet the soldier
piles are typically designed as cantilevers. Where excavations exceed 12 feet or are
surcharged, soldier piles may require lateral bracing utilizing drilled tie-back anchors
or raker braces to maintain an economical steel beam size and prevent excessive deflection.
The size of the steel beam, the need for lateral bracing, and the acceptable shoring deflection
should be determined by the project shoring engineer.
7.17.3 The design embedment of the shoring pile toes must be maintained during excavation
activities. The toes of the perimeter shoring piles should be deepened to take into account
any required excavations necessary for grading/stabilization activities, foundations and/or
adjacent drainage systems.
7.17.4 The proposed soldier piles may also be designed as permanent piles. The required pile
depths, dimensions, and spacing should be determined and designed by the project structural
and shoring engineers. All piles utilized for shoring can also be incorporated into
a permanent retaining wall system (shotcrete wall) and should be designed in accordance
with the earth pressure provided in the Retaining Wall Design section of this report (see
Section 7.11).
Geocon Project No. A9060-06-18 - 27 - August 15, 2019
7.17.5 Drilled cast-in-place soldier piles should be placed no closer than three diameters on center.
The minimum diameter of the piles is 18 inches. Structural concrete should be used for the
soldier piles below the excavation; lean-mix concrete may be employed above that level.
As an alternative, lean-mix concrete may be used throughout the pile where the reinforcing
consists of a wideflange section. The slurry must be of sufficient strength to impart the
lateral bearing pressure developed by the wideflange section to the soil. For design purposes,
an allowable passive value for the soils below the bottom plane of excavation may be
assumed to be 240 psf per foot. The allowable passive value may be doubled for isolated
piles, spaced a minimum of three times the pile diameter. To develop the full lateral value,
provisions should be implemented to assure firm contact between the soldier piles and the
undisturbed alluvium.
7.17.6 Groundwater seepage was encountered at a depth of 52.3 feet below the ground surface, and
the contractor should be prepared for groundwater during pile installation. Piles placed
below the water level require the use of a tremie to place the concrete into the bottom of the
hole. A tremie should consist of a rigid, water-tight tube having a diameter of not less than
6 inches with a hopper at the top. The tube should be equipped with a device that will close
the discharge end and prevent water from entering the tube while it is being charged with
concrete. The tremie should be supported so as to permit free movement of the discharge end
over the entire top surface of the work and to permit rapid lowering when necessary to retard
or stop the flow of concrete. The discharge end should be closed at the start of the work to
prevent water entering the tube and should be entirely sealed at all times, except when the
concrete is being placed. The tremie tube should be kept full of concrete. The flow should be
continuous until the work is completed, and the resulting concrete seal should be monolithic
and homogeneous. The tip of the tremie tube should always be kept about 5 feet below the
surface of the concrete and definite steps and safeguards should be taken to ensure that the
tip of the tremie tube is never raised above the surface of the concrete.
7.17.7 A special concrete mix should be used for concrete to be placed below water. The design
should provide for concrete with an unconfined compressive strength psi of 1,000 psi over
the initial job specification. An admixture that reduces the problem of segregation of
paste/aggregates and dilution of paste should be included. The slump should be
commensurate to any research report for the admixture, provided that it should also be the
minimum for a reasonable consistency for placing when water is present.

Geocon Project No. A9060-06-18 - 28 - August 15, 2019
7.17.8 Casing may be required if caving is experienced, and the contractor should have casing
available prior to commencement of drilling activities. When casing is used, extreme care
should be employed so that the pile is not pulled apart as the casing is withdrawn. At no time
should the distance between the surface of the concrete and the bottom of the casing be less
than 5 feet. As an alternative, piles may be vibrated into place; however, there is always a
risk that excessive vibrations in sandy soils could induce settlements and distress to adjacent
offsite improvements. Continuous observation of the drilling and pouring of the piles by the
Geotechnical Engineer (a representative of Geocon West, Inc.), is required.
7.17.9 The frictional resistance between the soldier piles and retained soil may be used to resist the
vertical component of load. The coefficient of friction may be taken as 0.38 based
on uniform contact between the steel beam and lean-mix concrete and retained earth.
The portion of soldier piles below the plane of excavation may also be employed to resist
downward loads. The downward capacity may be determined using a frictional resistance of
700 psf per foot.
7.17.10 Due to the nature of the site soils, it is expected that continuous lagging between soldier piles
will be required. However, it is recommended that the exposed soils be observed by the
Geotechnical Engineer (a representative of Geocon West, Inc.), to verify the presence of any
cohesive soils and the areas where lagging may be omitted.
7.17.11 The time between lagging excavation and lagging placement should be as short as possible.
Soldier piles should be designed for the full-anticipated pressures. Due to arching in the
soils, the pressure on the lagging will be less. It is recommended that the lagging be designed
for the full design pressure but be limited to a maximum of 400 psf.
7.17.12 For the design of unbraced shoring, it is recommended that an equivalent fluid pressure be
utilized for design. A trapezoidal distribution of lateral earth pressure may be used where
shoring will be restrained by bracing or tie backs. The recommended active and trapezoidal
pressures are provided in the following table. A diagram depicting the trapezoidal pressure
distribution of lateral earth pressure is provided below the table.
HEIGHT OF SHORING
(FEET)
EQUIVALENT FLUID PRESSURE
(Pounds Per Cubic Foot) (ACTIVE PRESSURE)
EQUIVALENT FLUID PRESSURE Trapezoidal
(Where H is the height of the shoring in feet)
Up to 24 33 21H

Geocon Project No. A9060-06-18 - 29 - August 15, 2019
7.17.13 Where a combination of sloped embankment and shoring is utilized, the pressure will be
greater and must be determined for each combination. Additional active pressure should be
added for a surcharge condition due to sloping ground, vehicular traffic, or adjacent
structures and must be determined for each combination.
7.17.14 It is recommended that line-load surcharges from adjacent wall footings, use horizontal
pressures generated from NAV-FAC DM 7.2. The governing equations are:
≤ 0.4 ( ) = 0.20 ×0.16 + ×
and > 0.4
( ) = 1.28 × ×+ ×
where x is the distance from the face of the excavation or wall to the vertical line-load, H is
the distance from the bottom of the footing to the bottom of excavation or wall, z is the depth
at which the horizontal pressure is desired, QL is the vertical line-load and σH(z) is the
horizontal pressure at depth z.
Trapezoidal Distribution of Pressure
H
0.2H
0.2H
0.6H
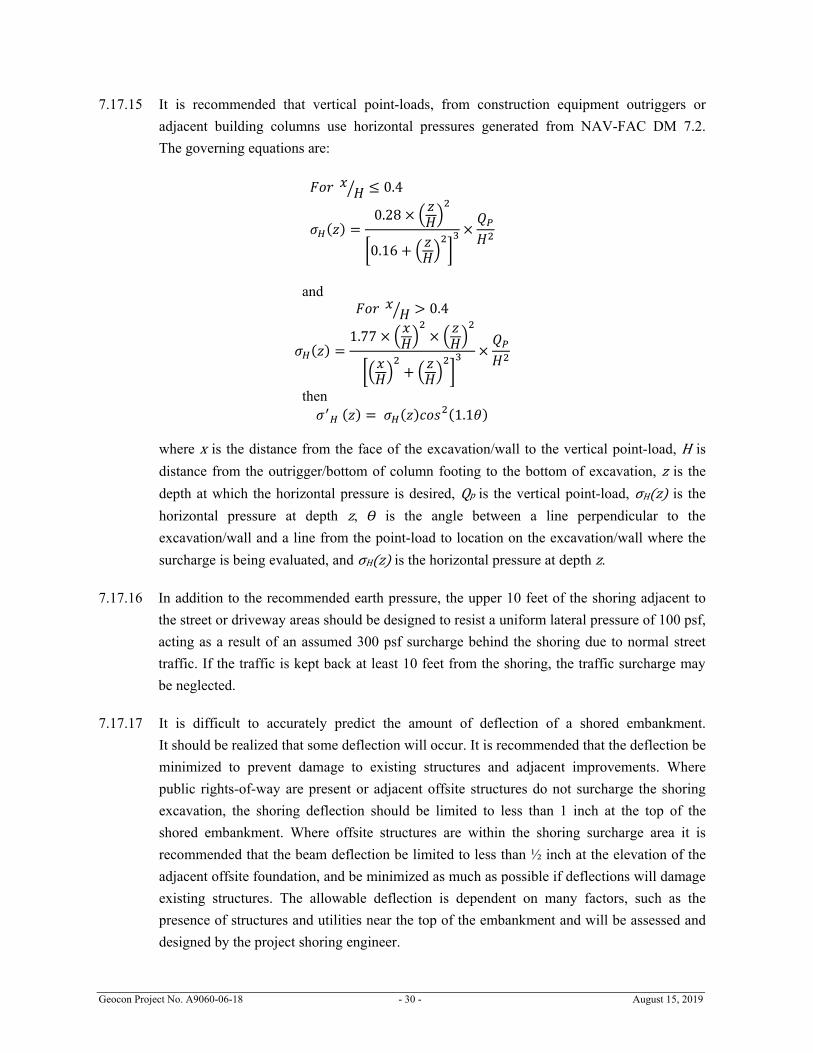
Geocon Project No. A9060-06-18 - 30 - August 15, 2019
7.17.15 It is recommended that vertical point-loads, from construction equipment outriggers or
adjacent building columns use horizontal pressures generated from NAV-FAC DM 7.2.
The governing equations are:
≤ 0.4 ( ) = 0.28 ×0.16 + ×
and > 0.4
( ) = 1.77 × ×+ ×
then ( ) = ( ) (1.1 )
where x is the distance from the face of the excavation/wall to the vertical point-load, H is
distance from the outrigger/bottom of column footing to the bottom of excavation, z is the
depth at which the horizontal pressure is desired, Qp is the vertical point-load, σH(z) is the
horizontal pressure at depth z, ϴ is the angle between a line perpendicular to the
excavation/wall and a line from the point-load to location on the excavation/wall where the
surcharge is being evaluated, and σH(z) is the horizontal pressure at depth z.
7.17.16 In addition to the recommended earth pressure, the upper 10 feet of the shoring adjacent to
the street or driveway areas should be designed to resist a uniform lateral pressure of 100 psf,
acting as a result of an assumed 300 psf surcharge behind the shoring due to normal street
traffic. If the traffic is kept back at least 10 feet from the shoring, the traffic surcharge may
be neglected.
7.17.17 It is difficult to accurately predict the amount of deflection of a shored embankment.
It should be realized that some deflection will occur. It is recommended that the deflection be
minimized to prevent damage to existing structures and adjacent improvements. Where
public rights-of-way are present or adjacent offsite structures do not surcharge the shoring
excavation, the shoring deflection should be limited to less than 1 inch at the top of the
shored embankment. Where offsite structures are within the shoring surcharge area it is
recommended that the beam deflection be limited to less than ½ inch at the elevation of the
adjacent offsite foundation, and be minimized as much as possible if deflections will damage
existing structures. The allowable deflection is dependent on many factors, such as the
presence of structures and utilities near the top of the embankment and will be assessed and
designed by the project shoring engineer.
Geocon Project No. A9060-06-18 - 31 - August 15, 2019
7.17.18 Because of the depth of the excavation, some means of monitoring the performance of the
shoring system is suggested. The monitoring should consist of periodic surveying of the
lateral and vertical locations of the tops of all soldier piles and the lateral movement along
the entire lengths of selected soldier piles.
7.17.19 Due to the depth of the depth of the excavation and proximity to adjacent structures, it is
suggested that prior to excavation the existing improvements be inspected to document
the present condition. For documentation purposes, photographs should be taken of
preconstruction distress conditions and level surveys of adjacent grade and pavement should
be considered. During excavation activities, the adjacent structures and pavement should be
periodically inspected for signs of distress. In the even that distress or settlement is noted, an
investigation should be performed and corrective measures taken so that continued or
worsened distress or settlement is mitigated. Documentation and monitoring of the offsite
structures and improvements is not the responsibility of the geotechnical engineer.
7.18 Temporary Tie-Back Anchors
7.18.1 Temporary tie-back anchors may be used with the solider pile wall system to resist lateral
loads. Post-grouted friction anchors are recommended. For design purposes, it may be
assumed that the active wedge adjacent to the shoring is defined by a plane drawn 35 degrees
with the vertical through the bottom plane of the excavation. Friction anchors should extend
a minimum of 20 feet beyond the potentially active wedge and to greater lengths if necessary
to develop the desired capacities. The locations and depths of all offsite utilities should be
thoroughly checked and incorporated into the drilling angle design for the tie-back anchors.
7.18.2 The capacities of the anchors should be determined by testing of the initial anchors as
outlined in a following section. Only the frictional resistance developed beyond the active
wedge would be effective in resisting lateral loads. Anchors should be placed at least 6 feet
on center to be considered isolated. For preliminary design purposes, it is estimated that
drilled friction anchors constructed without utilizing post-grouting techniques will develop
average skin frictions as follows (values have been reduced for buoyancy):
• 7 feet below the top of the excavation – 900 pounds per square foot
• 15 feet below the top of the excavation – 1,300 pounds per square foot
7.18.3 Depending on the techniques utilized, and the experience of the contractor performing
the installation, a maximum allowable friction capacity of 3.0 kips per linear foot for
post-grouted anchors (for a minimum 20 foot length beyond the active wedge) may be
assumed for design purposes. Only the frictional resistance developed beyond the active
wedge should be utilized in resisting lateral loads.

Geocon Project No. A9060-06-18 - 32 - August 15, 2019
7.19 Anchor Installation
7.19.1 Tied-back anchors are typically installed between 20 and 40 degrees below the horizontal;
however, occasionally alternative angles are necessary to avoid existing improvements and
utilities. The locations and depths of all offsite utilities should be thoroughly checked prior to
design and installation of the tie-back anchors. Caving of the anchor shafts, particularly
within sand and gravel deposits or seepage zones, should be anticipated during installation
and provisions should be implemented in order to minimize such caving. It is suggested that
hollow-stem auger drilling equipment be used to install the anchors. The anchor shafts
should be filled with concrete by pumping from the tip out, and the concrete should extend
from the tip of the anchor to the active wedge. In order to minimize the chances of caving, it
is recommended that the portion of the anchor shaft within the active wedge be backfilled
with sand before testing the anchor. This portion of the shaft should be filled tightly and
flush with the face of the excavation. The sand backfill should be placed by pumping; the
sand may contain a small amount of cement to facilitate pumping.
7.20 Anchor Testing
7.20.1 All of the anchors should be tested to at least 150 percent of design load. The total deflection
during this test should not exceed 12 inches. The rate of creep under the 150 percent test load
should not exceed 0.1 inch over a 15-minute period in order for the anchor to be approved
for the design loading.
7.20.2 At least 10 percent of the anchors should be selected for "quick" 200 percent tests and three
additional anchors should be selected for 24-hour 200 percent tests. The purpose of the
200 percent tests is to verify the friction value assumed in design. The anchors should be
tested to develop twice the assumed friction value. These tests should be performed prior to
installation of additional tiebacks. Where satisfactory tests are not achieved on the initial
anchors, the anchor diameter and/or length should be increased until satisfactory test results
are obtained.
7.20.3 The total deflection during the 24-hour 200 percent test should not exceed 12 inches. During
the 24-hour tests, the anchor deflection should not exceed 0.75 inches measured after the
200 percent test load is applied.
7.20.4 For the "quick" 200 percent tests, the 200 percent test load should be maintained for
30 minutes. The total deflection of the anchor during the 200 percent quick tests should not
exceed 12 inches; the deflection after the 200 percent load has been applied should not
exceed 0.25 inch during the 30-minute period.

Geocon Project No. A9060-06-18 - 33 - August 15, 2019
7.20.5 After a satisfactory test, each anchor should be locked-off at the design load. This should be
verified by rechecking the load in the anchor. The load should be within 10 percent of the
design load. A representative of this firm should observe the installation and testing of the
anchors.
7.21 Internal Bracing
7.21.1 Rakers may be utilized to brace the soldier piles in lieu of tieback anchors. The raker bracing
could be supported laterally by temporary concrete footings (deadmen) or by the permanent,
interior footings. For design of such temporary footings or deadmen, poured with the bearing
surface normal to rakers inclined at 45 degrees, a bearing value of 2,500 psf in competent
older alluvial soil may be used, provided the shallowest point of the footing is at least 1 foot
below the lowest adjacent grade. The client should be aware that the utilization of rakers
could significantly impact the construction schedule due to their intrusion into the
construction site and potential interference with equipment. The structural engineer should
review the shoring plan to determine if the raker footings conflict with the structural
foundation system.
7.22 Stormwater Infiltration
7.22.1 During the July 16, 2018, site exploration, borings B1 and B2 were utilized to perform
percolation testing. The borings were advanced to the depths listed in the table below.
Slotted casing was placed in the borings, and the annular space between the casings and
excavations were filled with gravel. The borings were then filled with water to pre-saturate
the soils. The casings were refilled with water and percolation test readings were performed
after repeated flooding of the cased excavation. Based on the test results, the measured
percolation rate and design infiltration rate, for the earth materials encountered, are provided
in the following table. These values have been calculated in accordance with the Boring
Percolation Test Procedure in the County of Los Angeles Department of Public Works
GMED Guidelines for Geotechnical Investigation and Reporting, Low Impact Development
Stormwater Infiltration (June 2017). Percolation test field data and calculation of the
measured percolation rate and design infiltration rate are provided on Figures 7 and 8.
Boring Soil Type Infiltration Depth (ft)
Measured Percolation Rate (in / hour)
Design Infiltration Rate (in / hour)
B1 SP-SM 30-42 0.03 0.02
B2 SW 30-43 0.01 0.01

Geocon Project No. A9060-06-18 - 34 - August 15, 2019
7.22.2 The results of the percolation testing indicated that the infiltration rate within the alluvial
soils is less than the generally accepted minimally required infiltration rate of 0.3 inches per
hour. Therefore, based on these considerations, a stormwater infiltration system is not
recommended for this development. It is suggested that stormwater be retained, filtered and
discharged in accordance with the requirements of the local governing agency.
7.23 Surface Drainage
7.23.1 Proper surface drainage is critical to the future performance of the project. Uncontrolled
infiltration of irrigation excess and storm runoff into the supporting soils can adversely affect
the performance of the planned improvements. Saturation of a soil can cause it to lose
internal shear strength and increase its compressibility, resulting in a change in the original
designed engineering properties. Proper drainage should be maintained at all times.
7.23.2 All site drainage should be collected and controlled in non-erosive drainage devices.
Drainage should not be allowed to pond anywhere on the site, and especially not against any
foundation or retaining wall. The site should be graded and maintained such that surface
drainage is directed away from structures in accordance with 2016 CBC 1804.4 or other
applicable standards. In addition, drainage should not be allowed to flow uncontrolled over
any descending slope. The proposed structure should be provided with roof gutters.
Discharge from downspouts, roof drains and scuppers not recommended onto unprotected
soils within 5 feet of the building perimeter. Planters which are located adjacent to
foundations should be sealed to prevent moisture intrusion into the engineered fill providing
foundation support. Landscape irrigation is not recommended within 5 feet of the building
perimeter footings except when enclosed in protected planters.
7.23.3 Positive site drainage should be provided away from structures, pavement, and the tops of
slopes to swales or other controlled drainage structures.
7.24 Plan Review
7.24.1 Grading, foundation, and, shoring plans should be reviewed by the Geotechnical Engineer
(a representative of Geocon West, Inc.), prior to finalization to verify that the plans have
been prepared in substantial conformance with the recommendations of this report and to
provide additional analyses or recommendations.

Geocon Project No. A9060-06-18 August 15, 2019
LIMITATIONS AND UNIFORMITY OF CONDITIONS
1. The recommendations of this report pertain only to the site investigated and are based upon the
assumption that the soil conditions do not deviate from those disclosed in the investigation.
If any variations or undesirable conditions are encountered during construction, or if the
proposed construction will differ from that anticipated herein, Geocon West, Inc. should be
notified so that supplemental recommendations can be given. The evaluation or identification
of the potential presence of hazardous or corrosive materials was not part of the scope of
services provided by Geocon West, Inc.
2. This report is issued with the understanding that it is the responsibility of the owner, or of his
representative, to ensure that the information and recommendations contained herein are
brought to the attention of the architect and engineer for the project and incorporated into the
plans, and the necessary steps are taken to see that the contractor and subcontractors carry out
such recommendations in the field.
3. The findings of this report are valid as of the date of this report. However, changes in the
conditions of a property can occur with the passage of time, whether they are due to natural
processes or the works of man on this or adjacent properties. In addition, changes in applicable
or appropriate standards may occur, whether they result from legislation or the broadening of
knowledge. Accordingly, the findings of this report may be invalidated wholly or partially by
changes outside our control. Therefore, this report is subject to review and should not be relied
upon after a period of three years.
4. The firm that performed the geotechnical investigation for the project should be retained to
provide testing and observation services during construction to provide continuity of
geotechnical interpretation and to check that the recommendations presented for geotechnical
aspects of site development are incorporated during site grading, construction of
improvements, and excavation of foundations. If another geotechnical firm is selected to
perform the testing and observation services during construction operations, that firm should
prepare a letter indicating their intent to assume the responsibilities of project geotechnical
engineer of record. A copy of the letter should be provided to the regulatory agency for their
records. In addition, that firm should provide revised recommendations concerning the
geotechnical aspects of the proposed development, or a written acknowledgement of their
concurrence with the recommendations presented in our report. They should also perform
additional analyses deemed necessary to assume the role of Geotechnical Engineer of Record.
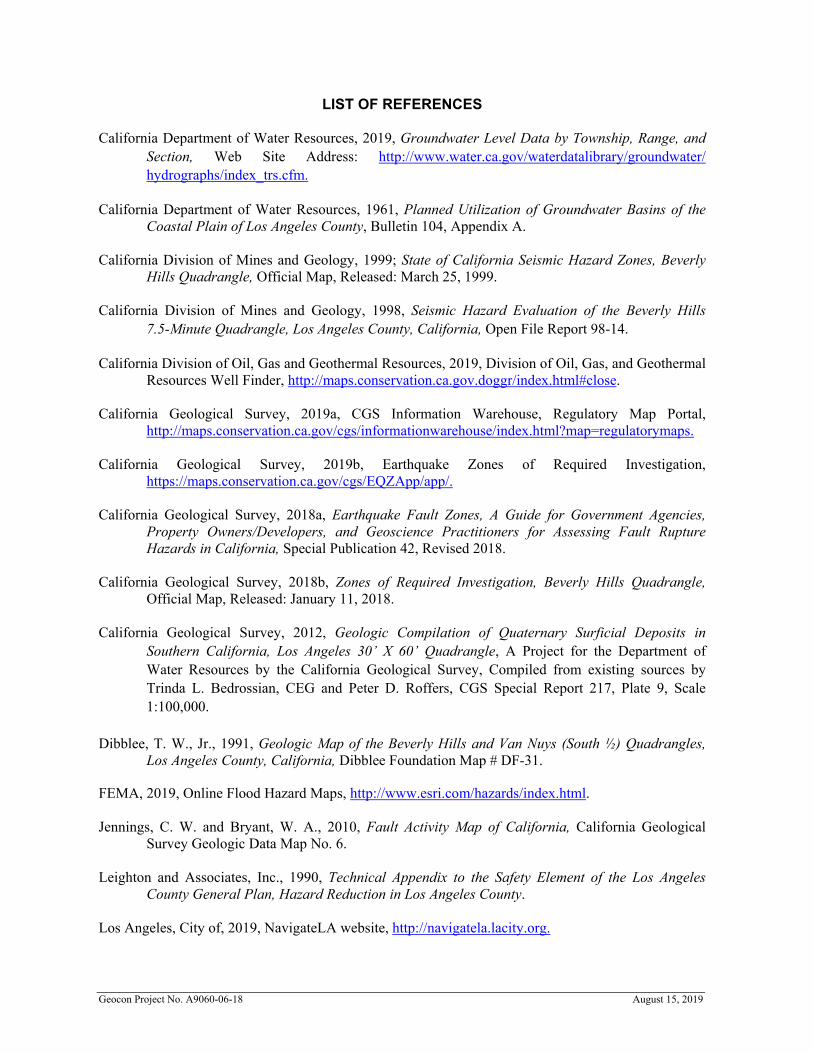
Geocon Project No. A9060-06-18 August 15, 2019
LIST OF REFERENCES California Department of Water Resources, 2019, Groundwater Level Data by Township, Range, and
Section, Web Site Address: http://www.water.ca.gov/waterdatalibrary/groundwater/ hydrographs/index_trs.cfm.
California Department of Water Resources, 1961, Planned Utilization of Groundwater Basins of the Coastal Plain of Los Angeles County, Bulletin 104, Appendix A.
California Division of Mines and Geology, 1999; State of California Seismic Hazard Zones, Beverly
Hills Quadrangle, Official Map, Released: March 25, 1999. California Division of Mines and Geology, 1998, Seismic Hazard Evaluation of the Beverly Hills
7.5-Minute Quadrangle, Los Angeles County, California, Open File Report 98-14.
California Division of Oil, Gas and Geothermal Resources, 2019, Division of Oil, Gas, and Geothermal Resources Well Finder, http://maps.conservation.ca.gov.doggr/index.html#close.
California Geological Survey, 2019a, CGS Information Warehouse, Regulatory Map Portal,
http://maps.conservation.ca.gov/cgs/informationwarehouse/index.html?map=regulatorymaps. California Geological Survey, 2019b, Earthquake Zones of Required Investigation,
https://maps.conservation.ca.gov/cgs/EQZApp/app/. California Geological Survey, 2018a, Earthquake Fault Zones, A Guide for Government Agencies,
Property Owners/Developers, and Geoscience Practitioners for Assessing Fault Rupture Hazards in California, Special Publication 42, Revised 2018.
California Geological Survey, 2018b, Zones of Required Investigation, Beverly Hills Quadrangle,
Official Map, Released: January 11, 2018. California Geological Survey, 2012, Geologic Compilation of Quaternary Surficial Deposits in
Southern California, Los Angeles 30’ X 60’ Quadrangle, A Project for the Department of Water Resources by the California Geological Survey, Compiled from existing sources by Trinda L. Bedrossian, CEG and Peter D. Roffers, CGS Special Report 217, Plate 9, Scale 1:100,000.
Dibblee, T. W., Jr., 1991, Geologic Map of the Beverly Hills and Van Nuys (South ½) Quadrangles,
Los Angeles County, California, Dibblee Foundation Map # DF-31.
FEMA, 2019, Online Flood Hazard Maps, http://www.esri.com/hazards/index.html. Jennings, C. W. and Bryant, W. A., 2010, Fault Activity Map of California, California Geological
Survey Geologic Data Map No. 6. Leighton and Associates, Inc., 1990, Technical Appendix to the Safety Element of the Los Angeles
County General Plan, Hazard Reduction in Los Angeles County. Los Angeles, City of, 2019, NavigateLA website, http://navigatela.lacity.org.

Geocon Project No. A9060-06-18 August 15, 2019
LIST OF REFERENCES (Continued) Los Angeles, City of, 1996, Safety Element of the Los Angeles City General Plan. Los Angeles County Department of Public Works, 2019a, Ground Water Wells Website,
http://dpw2.co.la.ca.us/website/wells/viewer.asp. Los Angeles County Department of Public Works, 2019b, Flood Zone Determination Website,
http://dpw.lacounty.gov/apps/wmd/floodzone/map.htm. Toppozada, T., Branum, D., Petersen, M, Hallstrom, C., and Reichle, M., 2000, Epicenters and Areas
Damaged by M> 5 California Earthquakes, 1800 – 1999, California Geological Survey, Map Sheet 49.
U.S. Geological Survey, 1972, Beverly Hills 7.5-Minute Topographic Map. Yerkes, R. F., McCulloch, T. H., Schoellhamer, J. E., and Vedder, J. G., 1965, Geology of the Los
Angeles Basin–An Introduction, U.S. Geological Survey Professional Paper 420-A. Ziony, J. I., and Jones, L. M., 1989, Map Showing Late Quaternary Faults and 1978–1984 Seismicity
of the Los Angeles Region, California, U.S. Geological Survey Miscellaneous Field Studies Map MF-1964.

REFERENCE:U.S.G.S. TOPOGRAPHIC MAPS, 7.5 MINUTE SERIES, BEVERLY HILLS, CA QUADRANGLE
PROJECT NO. A9060-06-18AUGUST 2019
SOUTH HILGARD AVENUE
LOS ANGELES, CALIFORNIA
VICINITY MAP
FIG. 1
PHONE (818) 841-8388 - FAX (818) 841-17043303 N. SAN FERNANDO BLVD. - SUITE 100 - BURBANK, CA 91504ENVIRONMENTAL GEOTECHNICAL MATERIALS
CHECKED BY: SFKDRAFTED BY: RA
SUBJECTSITE

Drafted by: RA Checked by: NDB PROJECT NO. A9060-06-18AUGUST 2019
SOUTH HILGARD AVENUELOS ANGELES, CALIFORNIA
PHONE (818) 841-8388 - FAX (818) 841-17043303 N. SAN FERNANDO BLVD. - SUITE 100 - BURBANK, CA 91504ENVIRONMENTAL GEOTECHNICAL MATERIALS
SITE PLAN
0 40' 80' FIG. 2
Location of Property Line
LEGENDLocation of Boring
B4
B1
B4
B2
B3
SOUT
H HI
LGAR
D AV
ENUE
A A'Location of Cross Section
PROPOSED FOUR TO EIGHT STORYSTRUCTURES CONSTRUCTED OVER
TWO SUBTERRANEAN PARKING LEVELS
Alluvium
PL
B3B4
??? ?? Fill
PROPOSEDSTRUCTURE
EXISTING GROUND SURFACE
20
60
-20
100
80
40
0
-40
A'
AELE
VA
TIO
N IN
FE
ET
N77°W
20
60
-20
100
80
40
0
-40
ELE
VA
TIO
N IN
FE
ET
PL
?
A'
A'

Drafted by: RA Checked by: SFK
SITE
PROJECT NO. A9060-06-18AUGUST 2019
SOUTH HILGARD AVENUE LOS ANGELES, CALIFORNIA
PHONE (818) 841-8388 - FAX (818) 841-17043303 N. SAN FERNANDO BLVD. - SUITE 100 - BURBANK, CA 91504ENVIRONMENTAL GEOTECHNICAL MATERIALS
REGIONAL FAULT MAP
FIG. 30 12 24 Miles
Reference: Jennings, C.W. and Bryant, W. A., 2010, Fault Activity Map of California, California Geological Survey Geologic Data Map No. 6.

SITE
PHONE (818) 841-8388 - FAX (818) 841-17043303 N. SAN FERNANDO BLVD. - SUITE 100 - BURBANK, CA 91504ENVIRONMENTAL GEOTECHNICAL MATERIALS
CHECKED BY: SFKDRAFTED BY: RA FIG. 4PROJECT NO. A9060-06-18AUGUST 2019
REGIONAL SEISMICITY MAP
SOUTH HILGARD AVENUE
LOS ANGELES, CALIFORNIA0 20 40 Miles
Reference: Toppozada, T., Branum, D., Petersen, M., Hallstrom, C., Cramer, C., and Reichle, M., 2000,Epicenters and Areas Damaged by M>5 California Earthquakes, 1800 - 1999, California
Geological Survey, Map Sheet 49.

RETAINING WALL DRAIN DETAIL
H
3/4" CRUSHEDROCK
MIRAFI 140N OR EQUIVALENTFILTER FABRIC ENVELOPE
4" DIA. PERFORATED ABSOR ADS PIPE - EXTEND TO
RETAININGWALL
DRAINAGE SYSTEM
WATERPROOFWALL
PROPERLYCOMPACTED
BACKFILL
GROUND SURFACE
NO SCALE
FOUNDATION
DRAFTED BY: HHD CHECKED BY: HHD FIG. 5PROJECT NO. A9060-06-18AUGUST, 2019
SOUTH HILGARD AVENUE LOS ANGELES, CALIFORNIA
PHONE (818) 841-8388 - FAX (818) 841-17043303 N. SAN FERNANDO BLVD. - SUITE 100 - BURBANK, CA 91504ENVIRONMENTAL GEOTECHNICAL MATERIALS

RETAINING WALL DRAIN DETAIL
NO SCALE
DRAFTED BY: HHD CHECKED BY: HHD FIG. 6
RETAININGWALL
FOUNDATION
PROPERLYCOMPACTED
BACKFILL
GROUND SURFACE
18"
WATER PROOFINGBY ARCHITECT
DRAINAGE PANEL (J-DRAIN 1000OR EQUIVALENT)
4" DIA. SCHEDULE 40 PERFORATEDPVC PIPE EXTENDED TO APPROVEDOUTLET
(1 CU. FT./FT.)
FILTER FABRIC ENVELOPE
3/4" CRUSHED ROCK
MIRAFI 140N OR EQUIVALENT
PROJECT NO. A9060-06-18AUGUST, 2019
SOUTH HILGARD AVENUE LOS ANGELES, CALIFORNIA
PHONE (818) 841-8388 - FAX (818) 841-17043303 N. SAN FERNANDO BLVD. - SUITE 100 - BURBANK, CA 91504ENVIRONMENTAL GEOTECHNICAL MATERIALS
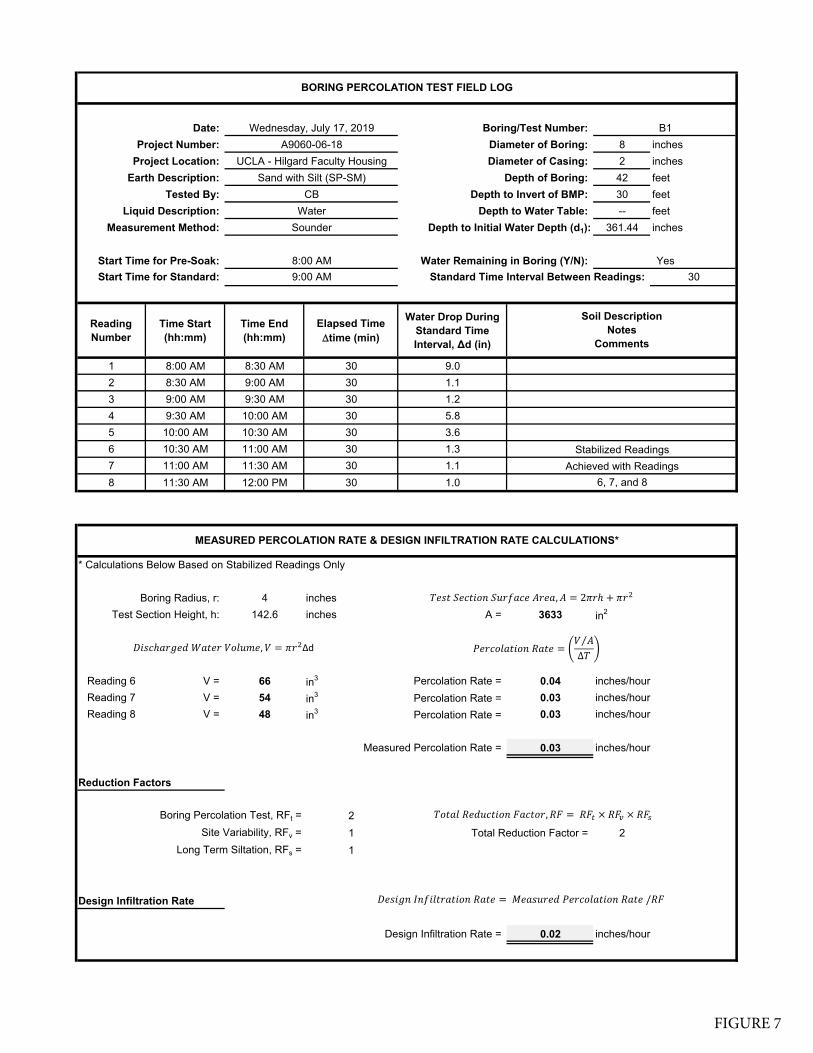
Date: Boring/Test Number:
Project Number: Diameter of Boring: 8 inches
Project Location: Diameter of Casing: 2 inches
Earth Description: Depth of Boring: 42 feet
Tested By: Depth to Invert of BMP: 30 feet
Liquid Description: Depth to Water Table: -- feet
Measurement Method: Depth to Initial Water Depth (d1): 361.44 inches
Start Time for Pre-Soak: Water Remaining in Boring (Y/N):
Start Time for Standard: Standard Time Interval Between Readings: 30
Reading Number
Time Start (hh:mm)
Time End (hh:mm)
Elapsed Time time (min)
Water Drop During Standard Time Interval, Δd (in)
1 8:00 AM 8:30 AM 30 9.0
2 8:30 AM 9:00 AM 30 1.1
3 9:00 AM 9:30 AM 30 1.2
4 9:30 AM 10:00 AM 30 5.8
5 10:00 AM 10:30 AM 30 3.6
6 10:30 AM 11:00 AM 30 1.3
7 11:00 AM 11:30 AM 30 1.1
8 11:30 AM 12:00 PM 30 1.0
* Calculations Below Based on Stabilized Readings Only
Boring Radius, r: 4 inches
Test Section Height, h: 142.6 inches A = 3633 in2
Reading 6 V = 66 in3 Percolation Rate = 0.04 inches/hour
Reading 7 V = 54 in3 Percolation Rate = 0.03 inches/hour
Reading 8 V = 48 in3 Percolation Rate = 0.03 inches/hour
Measured Percolation Rate = 0.03 inches/hour
Reduction Factors
Boring Percolation Test, RFt = 2
Site Variability, RFv = 1 Total Reduction Factor = 2
Long Term Siltation, RFs = 1
Design Infiltration Rate
Design Infiltration Rate = 0.02 inches/hour
BORING PERCOLATION TEST FIELD LOG
A9060-06-18
Sand with Silt (SP-SM)
Water
Sounder
UCLA - Hilgard Faculty Housing
MEASURED PERCOLATION RATE & DESIGN INFILTRATION RATE CALCULATIONS*
9:00 AM
B1
Yes
CB
Wednesday, July 17, 2019
8:00 AM
6, 7, and 8
Soil DescriptionNotes
Comments
Stabilized Readings
Achieved with Readings
𝑇𝑒𝑠𝑡 𝑆𝑒𝑐𝑡𝑖𝑜𝑛 𝑆𝑢𝑟𝑓𝑎𝑐𝑒 𝐴𝑟𝑒𝑎, 𝐴 2𝜋𝑟ℎ 𝜋𝑟
𝐷𝑖𝑠𝑐ℎ𝑎𝑟𝑔𝑒𝑑 𝑊𝑎𝑡𝑒𝑟 𝑉𝑜𝑙𝑢𝑚𝑒, 𝑉 𝜋𝑟 Δd 𝑃𝑒𝑟𝑐𝑜𝑙𝑎𝑡𝑖𝑜𝑛 𝑅𝑎𝑡𝑒𝑉 𝐴⁄
∆𝑇
𝐷𝑒𝑠𝑖𝑔𝑛 𝐼𝑛𝑓𝑖𝑙𝑡𝑟𝑎𝑡𝑖𝑜𝑛 𝑅𝑎𝑡𝑒 𝑀𝑒𝑎𝑠𝑢𝑟𝑒𝑑 𝑃𝑒𝑟𝑐𝑜𝑙𝑎𝑡𝑖𝑜𝑛 𝑅𝑎𝑡𝑒 /𝑅𝐹
𝑇𝑜𝑡𝑎𝑙 𝑅𝑒𝑑𝑢𝑐𝑡𝑖𝑜𝑛 𝐹𝑎𝑐𝑡𝑜𝑟, 𝑅𝐹 𝑅𝐹 𝑅𝐹 𝑅𝐹
FIGURE 7

Date: Boring/Test Number:
Project Number: Diameter of Boring: 8 inches
Project Location: Diameter of Casing: 2 inches
Earth Description: Depth of Boring: 43 feet
Tested By: Depth to Invert of BMP: 30 feet
Liquid Description: Depth to Water Table: -- feet
Measurement Method: Depth to Initial Water Depth (d1): 360.12 inches
Start Time for Pre-Soak: Water Remaining in Boring (Y/N):
Start Time for Standard: Standard Time Interval Between Readings: 30
Reading Number
Time Start (hh:mm)
Time End (hh:mm)
Elapsed Time time (min)
Water Drop During Standard Time Interval, Δd (in)
1 8:30 AM 9:00 AM 30 16.1
2 9:00 AM 9:30 AM 30 5.8
3 9:30 AM 10:00 AM 30 6.2
4 10:00 AM 10:30 AM 30 2.4
5 10:30 AM 11:00 AM 30 1.0
6 11:00 AM 11:30 AM 30 0.6
7 11:30 AM 12:00 PM 30 0.5
8 12:00 PM 12:30 PM 30 0.2
* Calculations Below Based on Stabilized Readings Only
Boring Radius, r: 4 inches
Test Section Height, h: 155.9 inches A = 3968 in2
Reading 6 V = 30 in3 Percolation Rate = 0.02 inches/hour
Reading 7 V = 24 in3 Percolation Rate = 0.01 inches/hour
Reading 8 V = 8 in3 Percolation Rate = 0.00 inches/hour
Measured Percolation Rate = 0.01 inches/hour
Reduction Factors
Boring Percolation Test, RFt = 2
Site Variability, RFv = 1 Total Reduction Factor = 2
Long Term Siltation, RFs = 1
Design Infiltration Rate
Design Infiltration Rate = 0.01 inches/hour
Soil DescriptionNotes
Comments
Stabilized Readings
Achieved with Readings
MEASURED PERCOLATION RATE & DESIGN INFILTRATION RATE CALCULATIONS*
9:30 AM
B2
Yes
CB
Wednesday, July 17, 2019
8:30 AM
6, 7, and 8
BORING PERCOLATION TEST FIELD LOG
A9060-06-18
Sand (SW)
Water
Sounder
UCLA - Hilgard Faculty Housing
𝑇𝑒𝑠𝑡 𝑆𝑒𝑐𝑡𝑖𝑜𝑛 𝑆𝑢𝑟𝑓𝑎𝑐𝑒 𝐴𝑟𝑒𝑎, 𝐴 2𝜋𝑟ℎ 𝜋𝑟
𝐷𝑖𝑠𝑐ℎ𝑎𝑟𝑔𝑒𝑑 𝑊𝑎𝑡𝑒𝑟 𝑉𝑜𝑙𝑢𝑚𝑒, 𝑉 𝜋𝑟 Δd 𝑃𝑒𝑟𝑐𝑜𝑙𝑎𝑡𝑖𝑜𝑛 𝑅𝑎𝑡𝑒𝑉 𝐴⁄
∆𝑇
𝐷𝑒𝑠𝑖𝑔𝑛 𝐼𝑛𝑓𝑖𝑙𝑡𝑟𝑎𝑡𝑖𝑜𝑛 𝑅𝑎𝑡𝑒 𝑀𝑒𝑎𝑠𝑢𝑟𝑒𝑑 𝑃𝑒𝑟𝑐𝑜𝑙𝑎𝑡𝑖𝑜𝑛 𝑅𝑎𝑡𝑒 /𝑅𝐹
𝑇𝑜𝑡𝑎𝑙 𝑅𝑒𝑑𝑢𝑐𝑡𝑖𝑜𝑛 𝐹𝑎𝑐𝑡𝑜𝑟, 𝑅𝐹 𝑅𝐹 𝑅𝐹 𝑅𝐹
FIGURE 8

APPENDIX A
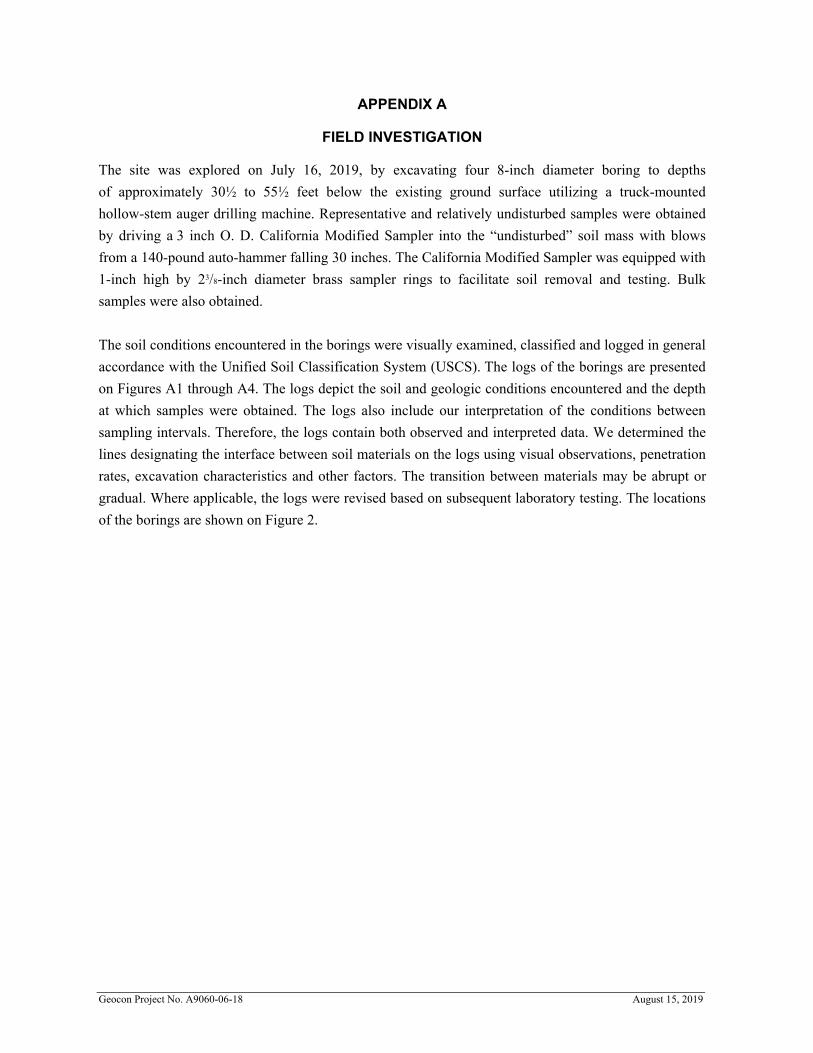
Geocon Project No. A9060-06-18 August 15, 2019
APPENDIX A
FIELD INVESTIGATION
The site was explored on July 16, 2019, by excavating four 8-inch diameter boring to depths
of approximately 30½ to 55½ feet below the existing ground surface utilizing a truck-mounted
hollow-stem auger drilling machine. Representative and relatively undisturbed samples were obtained
by driving a 3 inch O. D. California Modified Sampler into the “undisturbed” soil mass with blows
from a 140-pound auto-hammer falling 30 inches. The California Modified Sampler was equipped with
1-inch high by 23/8-inch diameter brass sampler rings to facilitate soil removal and testing. Bulk
samples were also obtained.
The soil conditions encountered in the borings were visually examined, classified and logged in general
accordance with the Unified Soil Classification System (USCS). The logs of the borings are presented
on Figures A1 through A4. The logs depict the soil and geologic conditions encountered and the depth
at which samples were obtained. The logs also include our interpretation of the conditions between
sampling intervals. Therefore, the logs contain both observed and interpreted data. We determined the
lines designating the interface between soil materials on the logs using visual observations, penetration
rates, excavation characteristics and other factors. The transition between materials may be abrupt or
gradual. Where applicable, the logs were revised based on subsequent laboratory testing. The locations
of the borings are shown on Figure 2.
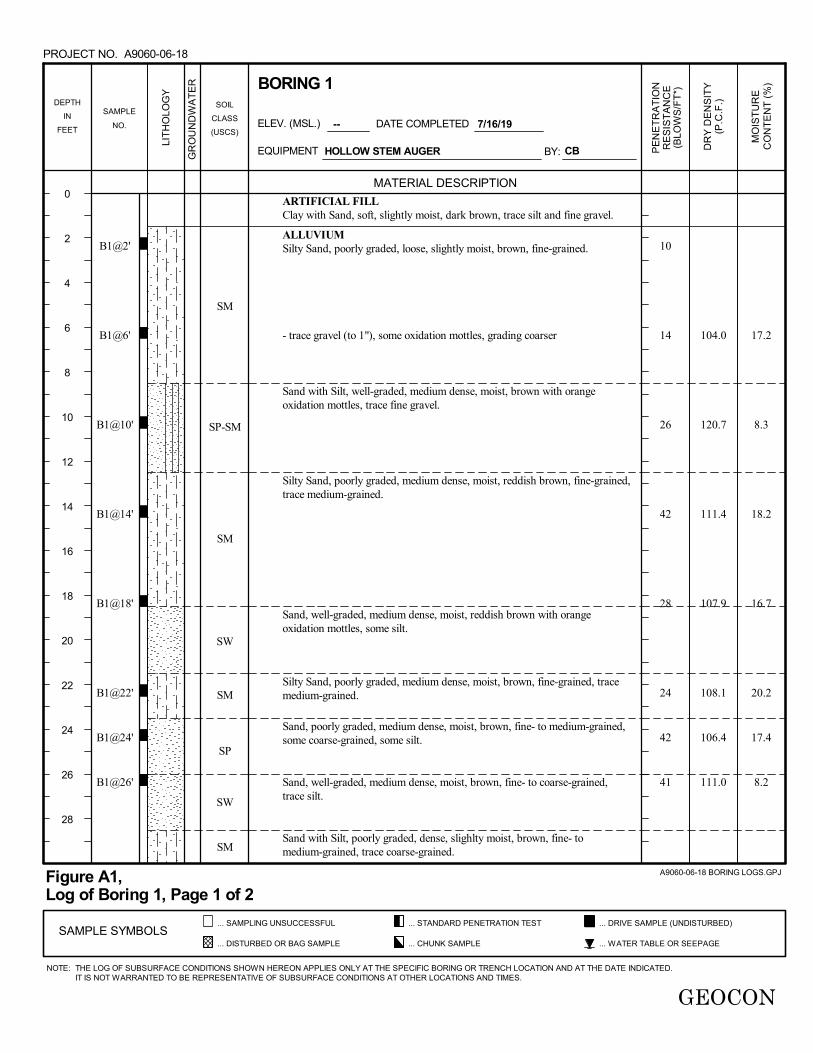
ARTIFICIAL FILLClay with Sand, soft, slightly moist, dark brown, trace silt and fine gravel.
ALLUVIUMSilty Sand, poorly graded, loose, slightly moist, brown, fine-grained.
- trace gravel (to 1"), some oxidation mottles, grading coarser
Sand with Silt, well-graded, medium dense, moist, brown with orangeoxidation mottles, trace fine gravel.
Silty Sand, poorly graded, medium dense, moist, reddish brown, fine-grained,trace medium-grained.
Sand, well-graded, medium dense, moist, reddish brown with orangeoxidation mottles, some silt.
Silty Sand, poorly graded, medium dense, moist, brown, fine-grained, tracemedium-grained.
Sand, poorly graded, medium dense, moist, brown, fine- to medium-grained,some coarse-grained, some silt.
Sand, well-graded, medium dense, moist, brown, fine- to coarse-grained,trace silt.
Sand with Silt, poorly graded, dense, slighlty moist, brown, fine- tomedium-grained, trace coarse-grained.
17.2
8.3
18.2
16.7
20.2
17.4
8.2
SM
SP-SM
SM
SW
SM
SP
SW
SM
B1@2'
B1@6'
B1@10'
B1@14'
B1@18'
B1@22'
B1@24'
B1@26'
10
14
26
42
28
24
42
41
104.0
120.7
111.4
107.9
108.1
106.4
111.0
SAMPLE
NO.
HOLLOW STEM AUGER
... WATER TABLE OR SEEPAGE
DEPTH
IN
FEET
... DRIVE SAMPLE (UNDISTURBED)
GEOCON
MO
IST
UR
E
BY:
--
0
2
4
6
8
10
12
14
16
18
20
22
24
26
28
A9060-06-18 BORING LOGS.GPJ
DR
Y D
EN
SIT
Y
EQUIPMENT
BORING 1
CB
(P.C
.F.)
DATE COMPLETED
... SAMPLING UNSUCCESSFUL
... DISTURBED OR BAG SAMPLE
SOIL
CLASS
(USCS)
GR
OU
ND
WA
TE
R
SAMPLE SYMBOLS
CO
NT
EN
T (
%)
... CHUNK SAMPLE
7/16/19ELEV. (MSL.)
PE
NE
TR
AT
ION
RE
SIS
TA
NC
E(B
LOW
S/F
T*)
Figure A1,Log of Boring 1, Page 1 of 2
MATERIAL DESCRIPTION
LIT
HO
LOG
Y
... STANDARD PENETRATION TEST
NOTE:
PROJECT NO.
THE LOG OF SUBSURFACE CONDITIONS SHOWN HEREON APPLIES ONLY AT THE SPECIFIC BORING OR TRENCH LOCATION AND AT THE DATE INDICATED.IT IS NOT WARRANTED TO BE REPRESENTATIVE OF SUBSURFACE CONDITIONS AT OTHER LOCATIONS AND TIMES.
A9060-06-18

Silty Sand, dense, slightly moist, brown, fine- to medium-grained, tracecoarse-grained.
Sand with Silt, well-graded, very dense, slightly moist, brown, trace clay.
Silty Sand, poorly graded, medium dense, slightly moist, brown, fine- tomedium-grained.
Silt with Clay, hard, slightly moist, brown.
Sand, poorly graded, dense, wet, fine- to medium-grained, brown.
- saturated
Silt, hard, wet, brown, some fine-grained sand and clay.
Total depth of boring: 55.5 feetFill to 1.5 feet.Groundwater encountered at 52.3 feet.Set perc well on 7/16/19.
*Penetration resistance for 140-pound hammer falling 30 inches byauto-hammer.
17.5
13.3
16.4
19.1
23.1
20.0
SM
SP-SM
SW-SM
SM
ML
SP
ML
B1@30'
B1@35'
B1@40'
B1@45'
B1@50'
B1@55'
54
73
50 (4")
43
51
50 (5")
116.0
116.3
114.4
110.8
105.4
108.3
SAMPLE
NO.
HOLLOW STEM AUGER
... WATER TABLE OR SEEPAGE
DEPTH
IN
FEET
... DRIVE SAMPLE (UNDISTURBED)
GEOCON
MO
IST
UR
E
BY:
--
30
32
34
36
38
40
42
44
46
48
50
52
54
A9060-06-18 BORING LOGS.GPJ
DR
Y D
EN
SIT
Y
EQUIPMENT
BORING 1
CB
(P.C
.F.)
DATE COMPLETED
... SAMPLING UNSUCCESSFUL
... DISTURBED OR BAG SAMPLE
SOIL
CLASS
(USCS)
GR
OU
ND
WA
TE
R
SAMPLE SYMBOLS
CO
NT
EN
T (
%)
... CHUNK SAMPLE
7/16/19ELEV. (MSL.)
PE
NE
TR
AT
ION
RE
SIS
TA
NC
E(B
LOW
S/F
T*)
Figure A1,Log of Boring 1, Page 2 of 2
MATERIAL DESCRIPTION
LIT
HO
LOG
Y
... STANDARD PENETRATION TEST
NOTE:
PROJECT NO.
THE LOG OF SUBSURFACE CONDITIONS SHOWN HEREON APPLIES ONLY AT THE SPECIFIC BORING OR TRENCH LOCATION AND AT THE DATE INDICATED.IT IS NOT WARRANTED TO BE REPRESENTATIVE OF SUBSURFACE CONDITIONS AT OTHER LOCATIONS AND TIMES.
A9060-06-18
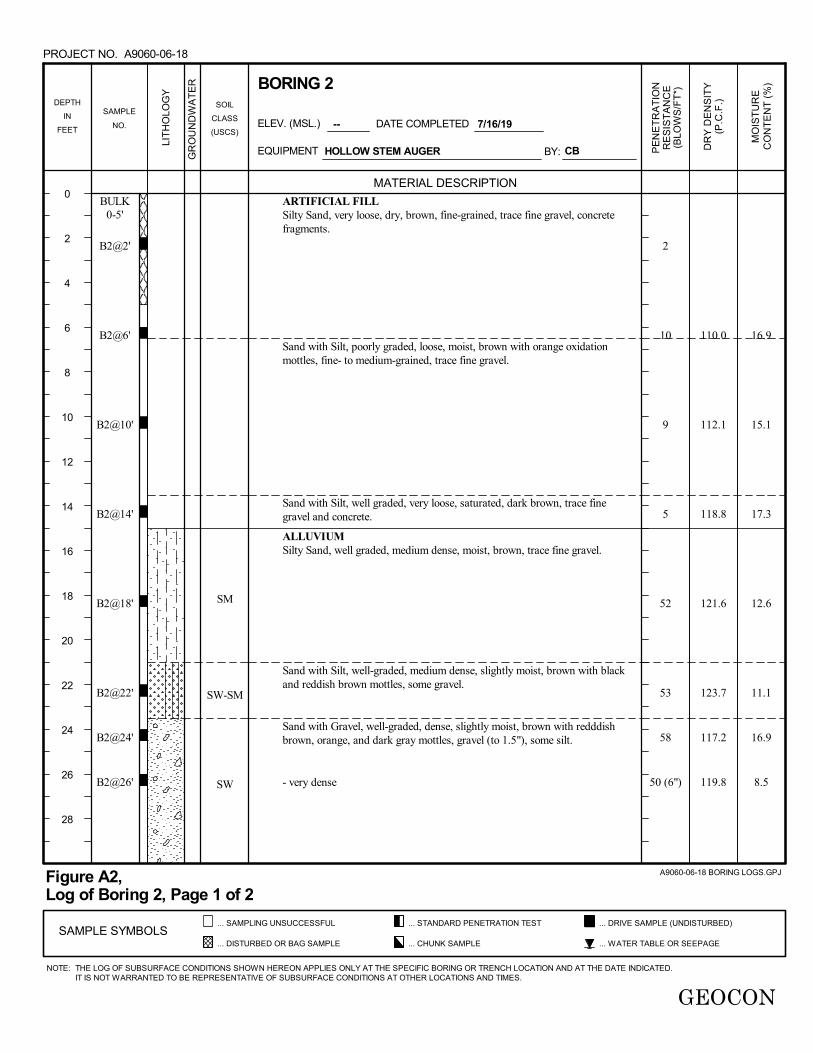
ARTIFICIAL FILLSilty Sand, very loose, dry, brown, fine-grained, trace fine gravel, concretefragments.
Sand with Silt, poorly graded, loose, moist, brown with orange oxidationmottles, fine- to medium-grained, trace fine gravel.
Sand with Silt, well graded, very loose, saturated, dark brown, trace finegravel and concrete.
ALLUVIUMSilty Sand, well graded, medium dense, moist, brown, trace fine gravel.
Sand with Silt, well-graded, medium dense, slightly moist, brown with blackand reddish brown mottles, some gravel.
Sand with Gravel, well-graded, dense, slightly moist, brown with redddishbrown, orange, and dark gray mottles, gravel (to 1.5"), some silt.
- very dense
16.9
15.1
17.3
12.6
11.1
16.9
8.5
SM
SW-SM
SW
BULK0-5'
B2@2'
B2@6'
B2@10'
B2@14'
B2@18'
B2@22'
B2@24'
B2@26'
2
10
9
5
52
53
58
50 (6")
110.0
112.1
118.8
121.6
123.7
117.2
119.8
SAMPLE
NO.
HOLLOW STEM AUGER
... WATER TABLE OR SEEPAGE
DEPTH
IN
FEET
... DRIVE SAMPLE (UNDISTURBED)
GEOCON
MO
IST
UR
E
BY:
--
0
2
4
6
8
10
12
14
16
18
20
22
24
26
28
A9060-06-18 BORING LOGS.GPJ
DR
Y D
EN
SIT
Y
EQUIPMENT
BORING 2
CB
(P.C
.F.)
DATE COMPLETED
... SAMPLING UNSUCCESSFUL
... DISTURBED OR BAG SAMPLE
SOIL
CLASS
(USCS)
GR
OU
ND
WA
TE
R
SAMPLE SYMBOLS
CO
NT
EN
T (
%)
... CHUNK SAMPLE
7/16/19ELEV. (MSL.)
PE
NE
TR
AT
ION
RE
SIS
TA
NC
E(B
LOW
S/F
T*)
Figure A2,Log of Boring 2, Page 1 of 2
MATERIAL DESCRIPTION
LIT
HO
LOG
Y
... STANDARD PENETRATION TEST
NOTE:
PROJECT NO.
THE LOG OF SUBSURFACE CONDITIONS SHOWN HEREON APPLIES ONLY AT THE SPECIFIC BORING OR TRENCH LOCATION AND AT THE DATE INDICATED.IT IS NOT WARRANTED TO BE REPRESENTATIVE OF SUBSURFACE CONDITIONS AT OTHER LOCATIONS AND TIMES.
A9060-06-18

Sand with Silt, poorly graded, medium dense, slightly moist, reddish brown,fine- to medium-grained.
- grades coarser
Sand with Gravel, well-graded, very dense, moist, brown, gravel (to 1").
Sand, well-graded, dense, moist, brown.
Silty Sand, poorly graded, dense, slightly moist, brown, fine-grained, tracemedium-grained.
- grades coarser
Sand, well-graded, dense, wet, brown, some silt.
Silty Sand, poorly graded, medium dense, slightly moist, reddish brown, fine-to medium-grained.
Sand with Silt, poorly graded, medium dense, moist, brown, fine-grained,trace medium-grained.
Total depth of boring: 55.5 feetFill to 15 feet.Groundwater encountered at 53 feet.Set perc well on 7/16/19.
*Penetration resistance for 140-pound hammer falling 30 inches byauto-hammer.
14.7
8.0
13.1
18.4
15.9
16.8
SW
SP-SM
SW
SW
SM
SW
SM
SP-SM
B2@30'
B2@35'
B2@40'
B2@45'
B2@50'
B2@55'
44
50 (6")
59
55
50
38
113.3
126.8
119.8
114.2
113.5
109.2
SAMPLE
NO.
HOLLOW STEM AUGER
... WATER TABLE OR SEEPAGE
DEPTH
IN
FEET
... DRIVE SAMPLE (UNDISTURBED)
GEOCON
MO
IST
UR
E
BY:
--
30
32
34
36
38
40
42
44
46
48
50
52
54
A9060-06-18 BORING LOGS.GPJ
DR
Y D
EN
SIT
Y
EQUIPMENT
BORING 2
CB
(P.C
.F.)
DATE COMPLETED
... SAMPLING UNSUCCESSFUL
... DISTURBED OR BAG SAMPLE
SOIL
CLASS
(USCS)
GR
OU
ND
WA
TE
R
SAMPLE SYMBOLS
CO
NT
EN
T (
%)
... CHUNK SAMPLE
7/16/19ELEV. (MSL.)
PE
NE
TR
AT
ION
RE
SIS
TA
NC
E(B
LOW
S/F
T*)
Figure A2,Log of Boring 2, Page 2 of 2
MATERIAL DESCRIPTION
LIT
HO
LOG
Y
... STANDARD PENETRATION TEST
NOTE:
PROJECT NO.
THE LOG OF SUBSURFACE CONDITIONS SHOWN HEREON APPLIES ONLY AT THE SPECIFIC BORING OR TRENCH LOCATION AND AT THE DATE INDICATED.IT IS NOT WARRANTED TO BE REPRESENTATIVE OF SUBSURFACE CONDITIONS AT OTHER LOCATIONS AND TIMES.
A9060-06-18

ARTIFICIAL FILLSilty Sand, well-graded, very loose, dry to slightly moist, brown, some gravel(to 1.5").
- loose
ALLUVIUMSilty Sand, poorly graded, slightly moist, medium dense, fine- tomedium-grained, brown.
Sand, poorly graded, medium dense, slightly moist, brown, fine- tomedium-grained, some silt.
Sand, well graded, dense, wet, brown, trace gravel (to 1").
Sand with Gravel, well-graded, very dense, moist, brown.
Silty Sand, medium dense, stiff, slightly moist, brown, fine-grained.
Sand, poorly graded, very dense, slightly moist, brown, fine- tomedium-grained, trace silt.- trace gravel (to 1.5")
7.3
14.7
11.5
13.2
9.9
6.5
24.2
10.9
SM
SP
SW
SW
SM
SP
B3@2'
B3@6'
B3@10'
B3@14'
B3@18'
B3@22'
B3@24'
B3@26'
6
9
31
30
66
50 (5")
34
50 (5")
116.3
88.2
117.2
111.5
126.1
101.3
99.1
122.3
SAMPLE
NO.
HOLLOW STEM AUGER
... WATER TABLE OR SEEPAGE
DEPTH
IN
FEET
... DRIVE SAMPLE (UNDISTURBED)
GEOCON
MO
IST
UR
E
BY:
--
0
2
4
6
8
10
12
14
16
18
20
22
24
26
28
A9060-06-18 BORING LOGS.GPJ
DR
Y D
EN
SIT
Y
EQUIPMENT
BORING 3
CB
(P.C
.F.)
DATE COMPLETED
... SAMPLING UNSUCCESSFUL
... DISTURBED OR BAG SAMPLE
SOIL
CLASS
(USCS)
GR
OU
ND
WA
TE
R
SAMPLE SYMBOLS
CO
NT
EN
T (
%)
... CHUNK SAMPLE
7/16/19ELEV. (MSL.)
PE
NE
TR
AT
ION
RE
SIS
TA
NC
E(B
LOW
S/F
T*)
Figure A3,Log of Boring 3, Page 1 of 2
MATERIAL DESCRIPTION
LIT
HO
LOG
Y
... STANDARD PENETRATION TEST
NOTE:
PROJECT NO.
THE LOG OF SUBSURFACE CONDITIONS SHOWN HEREON APPLIES ONLY AT THE SPECIFIC BORING OR TRENCH LOCATION AND AT THE DATE INDICATED.IT IS NOT WARRANTED TO BE REPRESENTATIVE OF SUBSURFACE CONDITIONS AT OTHER LOCATIONS AND TIMES.
A9060-06-18

- medium dense, some silt
Total depth of boring: 30.5 feetFill to 7.5 feet.No groundwater encountered.Backfilled with soil cuttings and tamped.
*Penetration resistance for 140-pound hammer falling 30 inches byauto-hammer.
9.4SPB3@30' 52 117.0
SAMPLE
NO.
HOLLOW STEM AUGER
... WATER TABLE OR SEEPAGE
DEPTH
IN
FEET
... DRIVE SAMPLE (UNDISTURBED)
GEOCON
MO
IST
UR
E
BY:
--
30
A9060-06-18 BORING LOGS.GPJ
DR
Y D
EN
SIT
Y
EQUIPMENT
BORING 3
CB
(P.C
.F.)
DATE COMPLETED
... SAMPLING UNSUCCESSFUL
... DISTURBED OR BAG SAMPLE
SOIL
CLASS
(USCS)
GR
OU
ND
WA
TE
R
SAMPLE SYMBOLS
CO
NT
EN
T (
%)
... CHUNK SAMPLE
7/16/19ELEV. (MSL.)
PE
NE
TR
AT
ION
RE
SIS
TA
NC
E(B
LOW
S/F
T*)
Figure A3,Log of Boring 3, Page 2 of 2
MATERIAL DESCRIPTION
LIT
HO
LOG
Y
... STANDARD PENETRATION TEST
NOTE:
PROJECT NO.
THE LOG OF SUBSURFACE CONDITIONS SHOWN HEREON APPLIES ONLY AT THE SPECIFIC BORING OR TRENCH LOCATION AND AT THE DATE INDICATED.IT IS NOT WARRANTED TO BE REPRESENTATIVE OF SUBSURFACE CONDITIONS AT OTHER LOCATIONS AND TIMES.
A9060-06-18
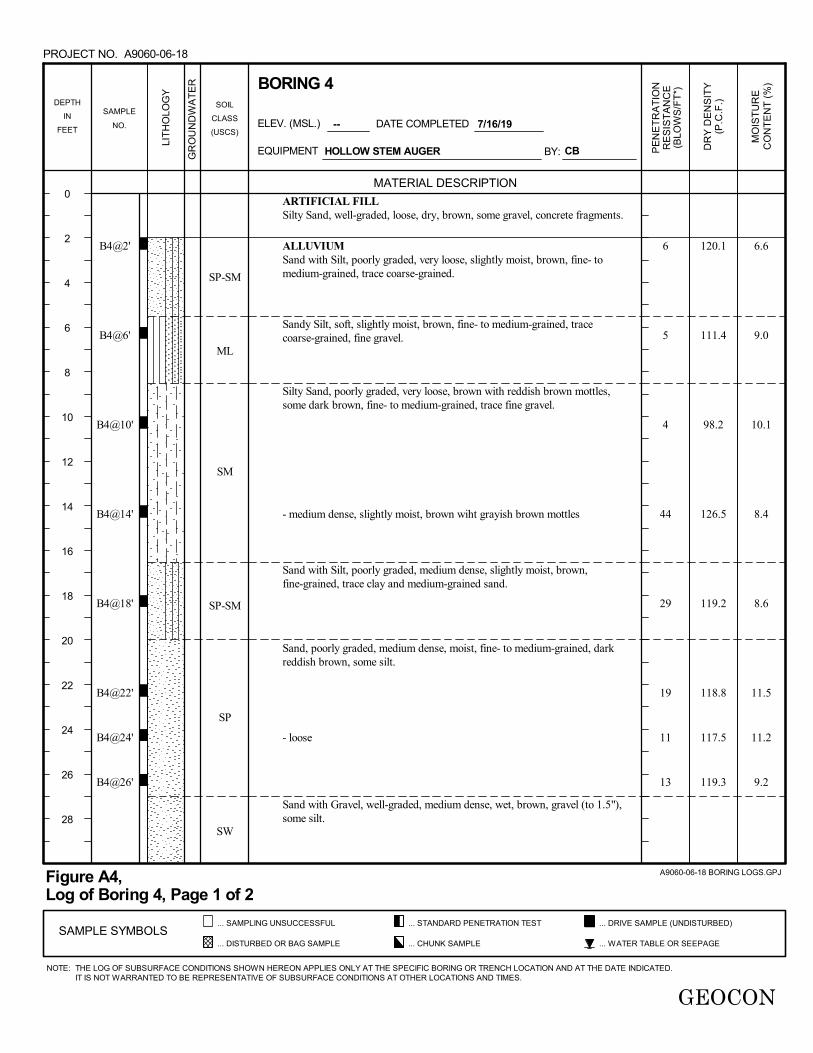
ARTIFICIAL FILLSilty Sand, well-graded, loose, dry, brown, some gravel, concrete fragments.
ALLUVIUMSand with Silt, poorly graded, very loose, slightly moist, brown, fine- tomedium-grained, trace coarse-grained.
Sandy Silt, soft, slightly moist, brown, fine- to medium-grained, tracecoarse-grained, fine gravel.
Silty Sand, poorly graded, very loose, brown with reddish brown mottles,some dark brown, fine- to medium-grained, trace fine gravel.
- medium dense, slightly moist, brown wiht grayish brown mottles
Sand with Silt, poorly graded, medium dense, slightly moist, brown,fine-grained, trace clay and medium-grained sand.
Sand, poorly graded, medium dense, moist, fine- to medium-grained, darkreddish brown, some silt.
- loose
Sand with Gravel, well-graded, medium dense, wet, brown, gravel (to 1.5"),some silt.
6.6
9.0
10.1
8.4
8.6
11.5
11.2
9.2
SP-SM
ML
SM
SP-SM
SP
SW
B4@2'
B4@6'
B4@10'
B4@14'
B4@18'
B4@22'
B4@24'
B4@26'
6
5
4
44
29
19
11
13
120.1
111.4
98.2
126.5
119.2
118.8
117.5
119.3
SAMPLE
NO.
HOLLOW STEM AUGER
... WATER TABLE OR SEEPAGE
DEPTH
IN
FEET
... DRIVE SAMPLE (UNDISTURBED)
GEOCON
MO
IST
UR
E
BY:
--
0
2
4
6
8
10
12
14
16
18
20
22
24
26
28
A9060-06-18 BORING LOGS.GPJ
DR
Y D
EN
SIT
Y
EQUIPMENT
BORING 4
CB
(P.C
.F.)
DATE COMPLETED
... SAMPLING UNSUCCESSFUL
... DISTURBED OR BAG SAMPLE
SOIL
CLASS
(USCS)
GR
OU
ND
WA
TE
R
SAMPLE SYMBOLS
CO
NT
EN
T (
%)
... CHUNK SAMPLE
7/16/19ELEV. (MSL.)
PE
NE
TR
AT
ION
RE
SIS
TA
NC
E(B
LOW
S/F
T*)
Figure A4,Log of Boring 4, Page 1 of 2
MATERIAL DESCRIPTION
LIT
HO
LOG
Y
... STANDARD PENETRATION TEST
NOTE:
PROJECT NO.
THE LOG OF SUBSURFACE CONDITIONS SHOWN HEREON APPLIES ONLY AT THE SPECIFIC BORING OR TRENCH LOCATION AND AT THE DATE INDICATED.IT IS NOT WARRANTED TO BE REPRESENTATIVE OF SUBSURFACE CONDITIONS AT OTHER LOCATIONS AND TIMES.
A9060-06-18
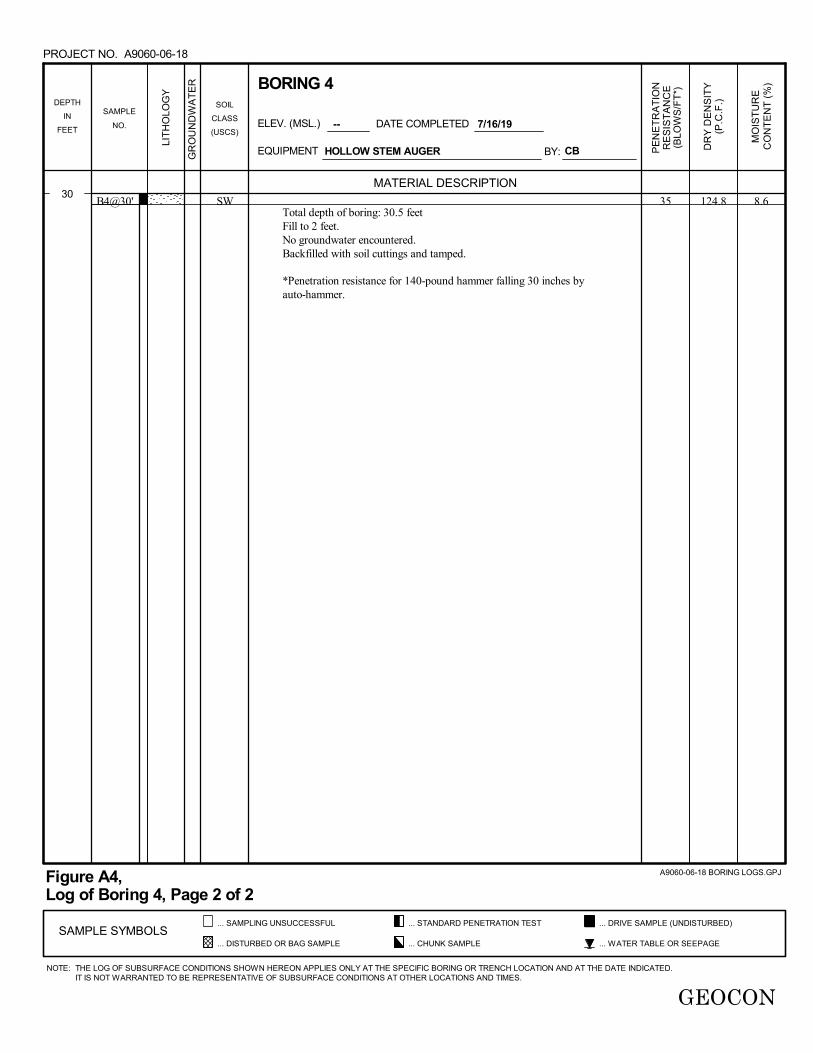
Total depth of boring: 30.5 feetFill to 2 feet.No groundwater encountered.Backfilled with soil cuttings and tamped.
*Penetration resistance for 140-pound hammer falling 30 inches byauto-hammer.
8.6SWB4@30' 35 124.8
SAMPLE
NO.
HOLLOW STEM AUGER
... WATER TABLE OR SEEPAGE
DEPTH
IN
FEET
... DRIVE SAMPLE (UNDISTURBED)
GEOCON
MO
IST
UR
E
BY:
--
30
A9060-06-18 BORING LOGS.GPJ
DR
Y D
EN
SIT
Y
EQUIPMENT
BORING 4
CB
(P.C
.F.)
DATE COMPLETED
... SAMPLING UNSUCCESSFUL
... DISTURBED OR BAG SAMPLE
SOIL
CLASS
(USCS)
GR
OU
ND
WA
TE
R
SAMPLE SYMBOLS
CO
NT
EN
T (
%)
... CHUNK SAMPLE
7/16/19ELEV. (MSL.)
PE
NE
TR
AT
ION
RE
SIS
TA
NC
E(B
LOW
S/F
T*)
Figure A4,Log of Boring 4, Page 2 of 2
MATERIAL DESCRIPTION
LIT
HO
LOG
Y
... STANDARD PENETRATION TEST
NOTE:
PROJECT NO.
THE LOG OF SUBSURFACE CONDITIONS SHOWN HEREON APPLIES ONLY AT THE SPECIFIC BORING OR TRENCH LOCATION AND AT THE DATE INDICATED.IT IS NOT WARRANTED TO BE REPRESENTATIVE OF SUBSURFACE CONDITIONS AT OTHER LOCATIONS AND TIMES.
A9060-06-18

APPENDIX B

Geocon Project No. A9060-06-18 August 15, 2019
APPENDIX B
LABORATORY TESTING
Laboratory tests were performed in accordance with generally accepted test methods of the “American
Society for Testing and Materials (ASTM)”, or other suggested procedures. Selected samples were
tested for direct shear strength, consolidation and expansion characteristics, corrosivity, corrosivity,
in-place dry density and moisture content. The results of the laboratory tests are summarized in Figures
B1 through B23. The in-place dry density and moisture content of the samples tested are presented on
the boring logs, Appendix A.

Project No.: A9060-06-18
August, 2019 Figure B1
34.3
34.9
B1
B1@6
6
Ring
1.0
2.375
13.2
107.0
62.0
5
3.73
Consolidated Drained ASTM D-3080
Soil Identification:
Brown Silty Sand (SM)
Strength Parameters
Peak
Ultimate
C (psf)
401
296
Boring No.
Sample No.
Depth (ft)
Sample Type:
3.70
0.05
1.0
2.375
110.6
83.9
3
2.63
2.57
0.05
1.0
2.375
17.2
110.5
88.1
1
0.99
0.91
0.05
DIRECT SHEAR TEST RESULTS SOUTH HILGARD AVENUE LOS ANGELES, CALIFORNIA
Checked by: JJK
Ring Inside Diameter (in.)
Initial Moisture Content (%)
Initial Dry Density (pcf)
Initial Degree of Saturation (%)
Soil Height Before Shearing (in.)
Final Moisture Content (%) 19.6
1.2
16.8
1.2
15.3
1.2
16.3
Normal Strest (kip/ft2)
Peak Shear Stress (kip/ft²)
Shear Stress @ End of Test (ksf)
Deformation Rate (in./min.)
Initial Sample Height (in.)
0.0
1.0
2.0
3.0
4.0
5.0
0.0 1.0 2.0 3.0 4.0 5.0
She
ar S
tres
s (k
sf)
Normal Stress (ksf)
0.0
0.5
1.0
1.5
2.0
2.5
3.0
3.5
4.0
0 0.1 0.2
Sh
ea
r S
tre
ss (
ksf)
Horizontal Deformation (in.)
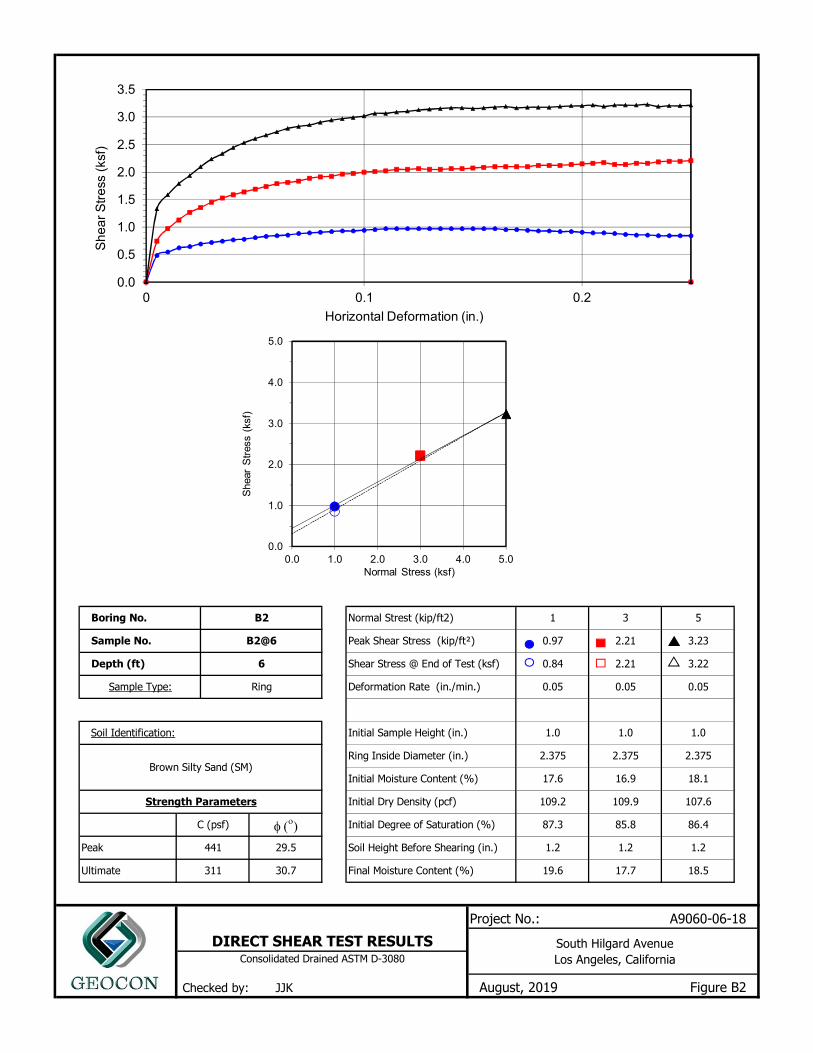
Project No.: A9060-06-18
Normal Strest (kip/ft2)
Peak Shear Stress (kip/ft²)
Shear Stress @ End of Test (ksf)
Deformation Rate (in./min.)
Initial Sample Height (in.)
DIRECT SHEAR TEST RESULTS South Hilgard Avenue Los Angeles, California
Checked by: JJK
Ring Inside Diameter (in.)
Initial Moisture Content (%)
Initial Dry Density (pcf)
Initial Degree of Saturation (%)
Soil Height Before Shearing (in.)
Final Moisture Content (%) 19.6
1.2
17.7
1.2
18.5
1.2
16.9
1
0.97
0.84
0.05
1.0
2.375
17.6
109.2
87.3
109.9
85.8
3
2.21
2.21
0.05
3.22
0.05
1.0
2.375
Consolidated Drained ASTM D-3080
Soil Identification:
Brown Silty Sand (SM)
Strength Parameters
Peak
Ultimate
C (psf)
441
311
Boring No.
Sample No.
Depth (ft)
Sample Type:
August, 2019 Figure B2
29.5
30.7
B2
B2@6
6
Ring
1.0
2.375
18.1
107.6
86.4
5
3.23
0.0
1.0
2.0
3.0
4.0
5.0
0.0 1.0 2.0 3.0 4.0 5.0
She
ar S
tres
s (k
sf)
Normal Stress (ksf)
0.0
0.5
1.0
1.5
2.0
2.5
3.0
3.5
0 0.1 0.2
Sh
ea
r S
tre
ss (
ksf)
Horizontal Deformation (in.)
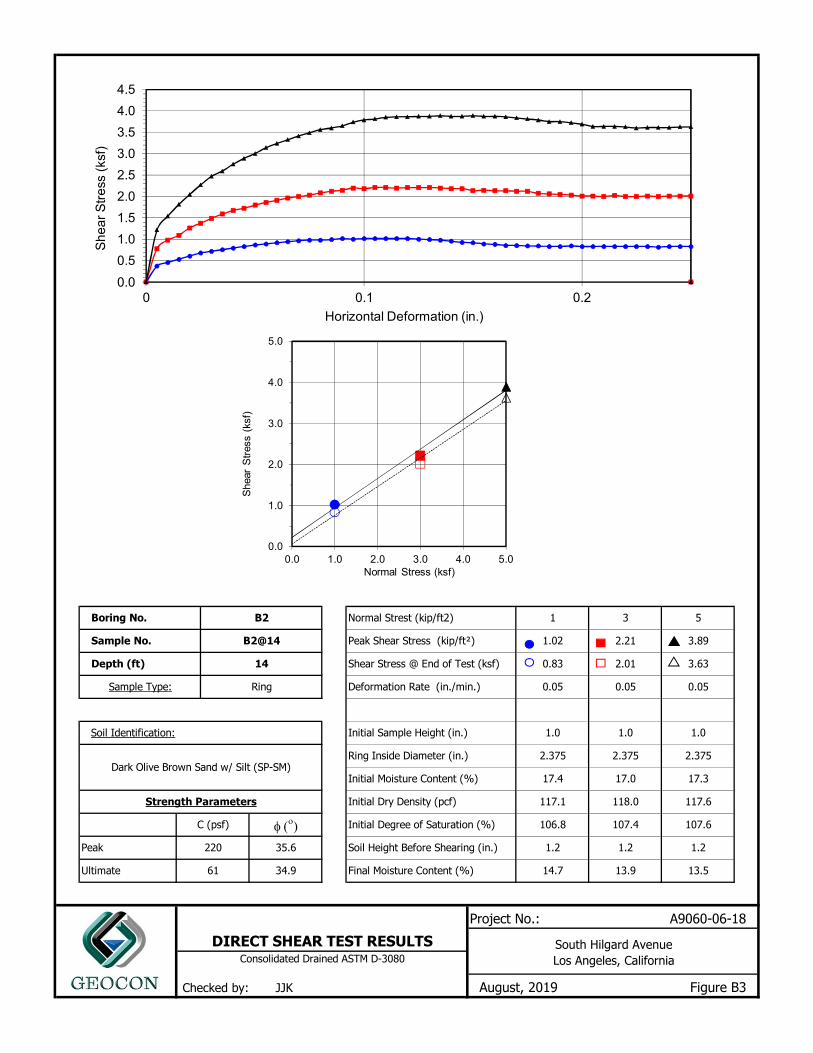
Project No.: A9060-06-18
Normal Strest (kip/ft2)
Peak Shear Stress (kip/ft²)
Shear Stress @ End of Test (ksf)
Deformation Rate (in./min.)
Initial Sample Height (in.)
DIRECT SHEAR TEST RESULTS South Hilgard Avenue Los Angeles, California
Checked by: JJK
Ring Inside Diameter (in.)
Initial Moisture Content (%)
Initial Dry Density (pcf)
Initial Degree of Saturation (%)
Soil Height Before Shearing (in.)
Final Moisture Content (%) 14.7
1.2
13.9
1.2
13.5
1.2
17.0
1
1.02
0.83
0.05
1.0
2.375
17.4
117.1
106.8
118.0
107.4
3
2.21
2.01
0.05
3.63
0.05
1.0
2.375
Consolidated Drained ASTM D-3080
Soil Identification:
Dark Olive Brown Sand w/ Silt (SP-SM)
Strength Parameters
Peak
Ultimate
C (psf)
220
61
Boring No.
Sample No.
Depth (ft)
Sample Type:
August, 2019 Figure B3
35.6
34.9
B2
B2@14
14
Ring
1.0
2.375
17.3
117.6
107.6
5
3.89
0.0
1.0
2.0
3.0
4.0
5.0
0.0 1.0 2.0 3.0 4.0 5.0
She
ar S
tres
s (k
sf)
Normal Stress (ksf)
0.0
0.5
1.0
1.5
2.0
2.5
3.0
3.5
4.0
4.5
0 0.1 0.2
Sh
ea
r S
tre
ss (
ksf)
Horizontal Deformation (in.)
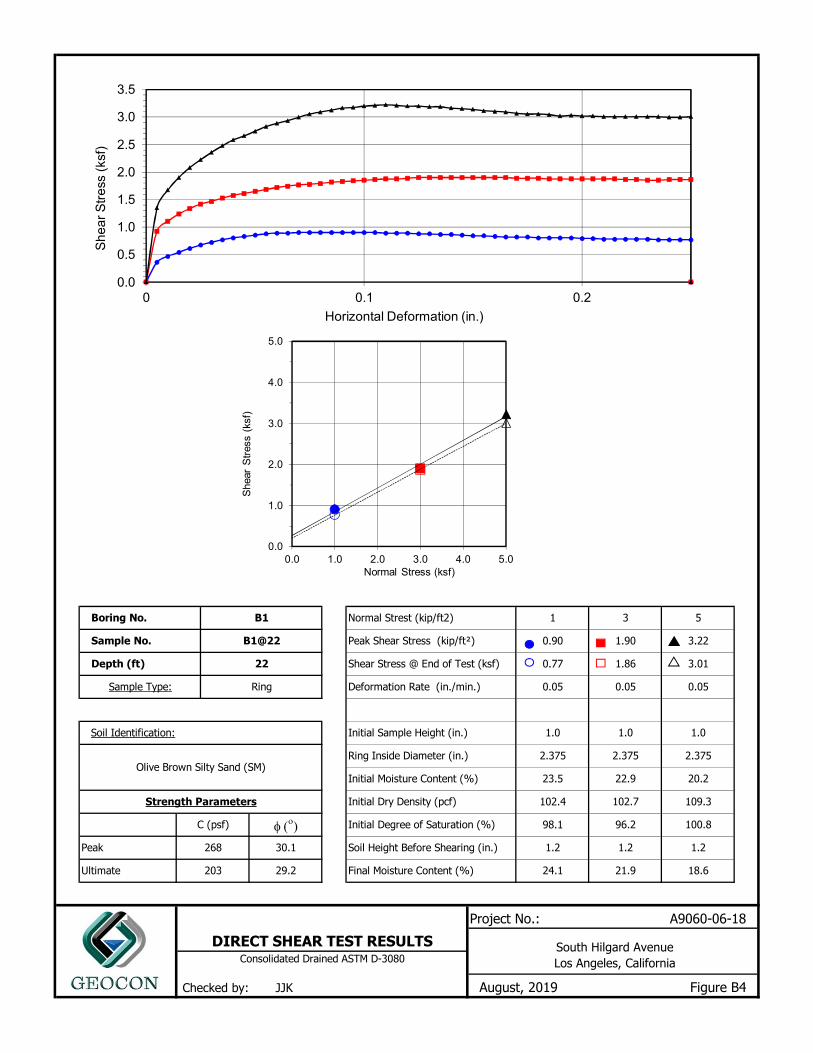
Project No.: A9060-06-18
August, 2019 Figure B4
30.1
29.2
B1
B1@22
22
Ring
1.0
2.375
20.2
109.3
100.8
5
3.22
Consolidated Drained ASTM D-3080
Soil Identification:
Olive Brown Silty Sand (SM)
Strength Parameters
Peak
Ultimate
C (psf)
268
203
Boring No.
Sample No.
Depth (ft)
Sample Type:
3.01
0.05
1.0
2.375
102.7
96.2
3
1.90
1.86
0.05
1.0
2.375
23.5
102.4
98.1
1
0.90
0.77
0.05
DIRECT SHEAR TEST RESULTS South Hilgard Avenue Los Angeles, California
Checked by: JJK
Ring Inside Diameter (in.)
Initial Moisture Content (%)
Initial Dry Density (pcf)
Initial Degree of Saturation (%)
Soil Height Before Shearing (in.)
Final Moisture Content (%) 24.1
1.2
21.9
1.2
18.6
1.2
22.9
Normal Strest (kip/ft2)
Peak Shear Stress (kip/ft²)
Shear Stress @ End of Test (ksf)
Deformation Rate (in./min.)
Initial Sample Height (in.)
0.0
1.0
2.0
3.0
4.0
5.0
0.0 1.0 2.0 3.0 4.0 5.0
She
ar S
tres
s (k
sf)
Normal Stress (ksf)
0.0
0.5
1.0
1.5
2.0
2.5
3.0
3.5
0 0.1 0.2
Sh
ea
r S
tre
ss (
ksf)
Horizontal Deformation (in.)
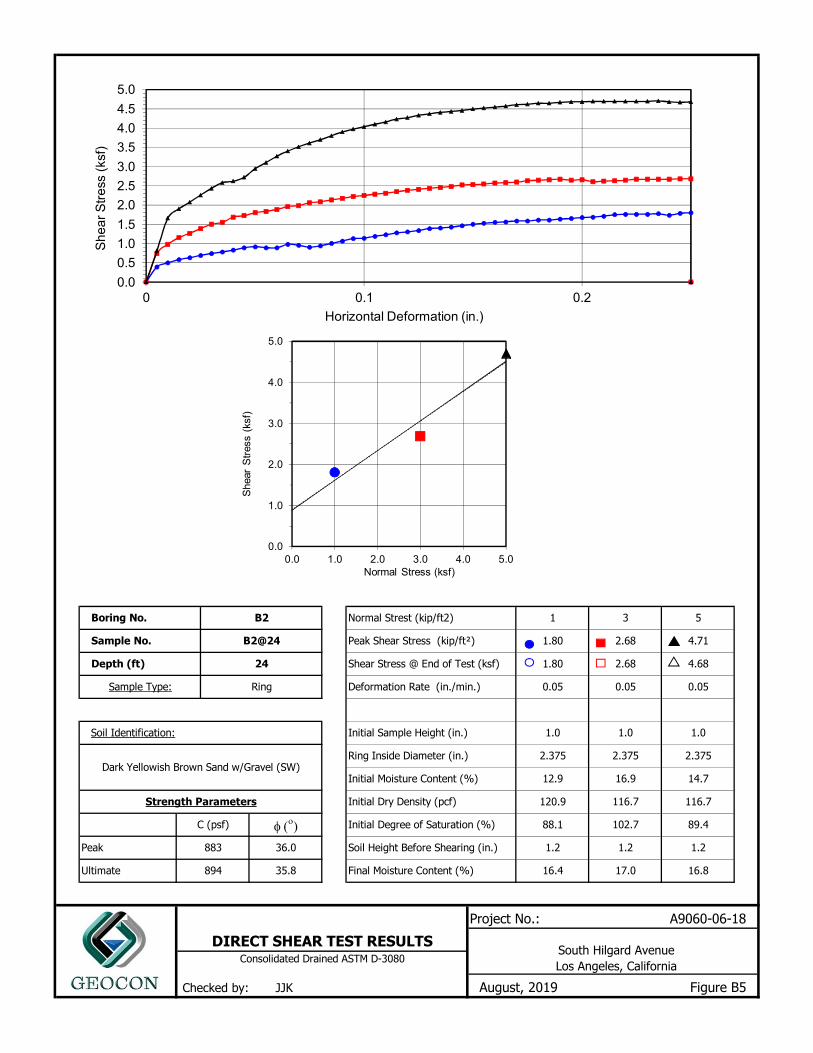
Project No.: A9060-06-18
August, 2019 Figure B5
36.0
35.8
B2
B2@24
24
Ring
1.0
2.375
14.7
116.7
89.4
5
4.71
Consolidated Drained ASTM D-3080
Soil Identification:
Dark Yellowish Brown Sand w/Gravel (SW)
Strength Parameters
Peak
Ultimate
C (psf)
883
894
Boring No.
Sample No.
Depth (ft)
Sample Type:
4.68
0.05
1.0
2.375
116.7
102.7
3
2.68
2.68
0.05
1.0
2.375
12.9
120.9
88.1
1
1.80
1.80
0.05
DIRECT SHEAR TEST RESULTS South Hilgard Avenue Los Angeles, California
Checked by: JJK
Ring Inside Diameter (in.)
Initial Moisture Content (%)
Initial Dry Density (pcf)
Initial Degree of Saturation (%)
Soil Height Before Shearing (in.)
Final Moisture Content (%) 16.4
1.2
17.0
1.2
16.8
1.2
16.9
Normal Strest (kip/ft2)
Peak Shear Stress (kip/ft²)
Shear Stress @ End of Test (ksf)
Deformation Rate (in./min.)
Initial Sample Height (in.)
0.0
1.0
2.0
3.0
4.0
5.0
0.0 1.0 2.0 3.0 4.0 5.0
She
ar S
tres
s (k
sf)
Normal Stress (ksf)
0.0
0.5
1.0
1.5
2.0
2.5
3.0
3.5
4.0
4.5
5.0
0 0.1 0.2
Sh
ea
r S
tre
ss (
ksf)
Horizontal Deformation (in.)
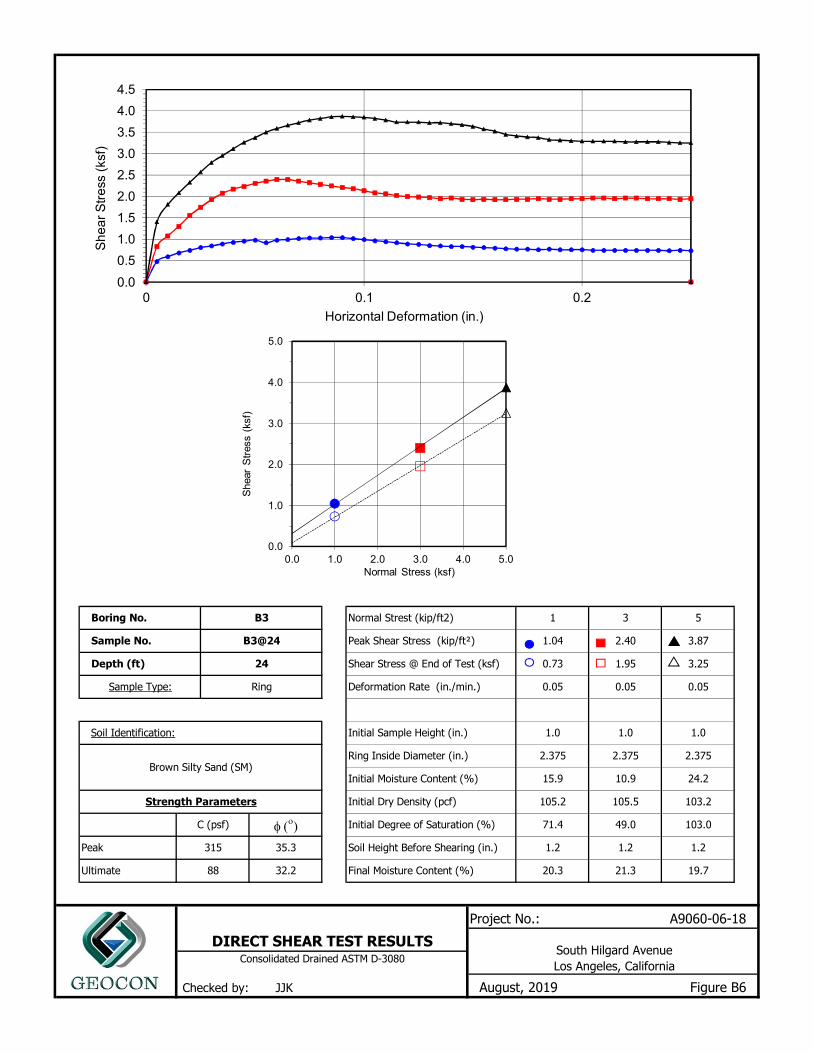
Project No.: A9060-06-18
Normal Strest (kip/ft2)
Peak Shear Stress (kip/ft²)
Shear Stress @ End of Test (ksf)
Deformation Rate (in./min.)
Initial Sample Height (in.)
DIRECT SHEAR TEST RESULTS South Hilgard Avenue Los Angeles, California
Checked by: JJK
Ring Inside Diameter (in.)
Initial Moisture Content (%)
Initial Dry Density (pcf)
Initial Degree of Saturation (%)
Soil Height Before Shearing (in.)
Final Moisture Content (%) 20.3
1.2
21.3
1.2
19.7
1.2
10.9
1
1.04
0.73
0.05
1.0
2.375
15.9
105.2
71.4
105.5
49.0
3
2.40
1.95
0.05
3.25
0.05
1.0
2.375
Consolidated Drained ASTM D-3080
Soil Identification:
Brown Silty Sand (SM)
Strength Parameters
Peak
Ultimate
C (psf)
315
88
Boring No.
Sample No.
Depth (ft)
Sample Type:
August, 2019 Figure B6
35.3
32.2
B3
B3@24
24
Ring
1.0
2.375
24.2
103.2
103.0
5
3.87
0.0
1.0
2.0
3.0
4.0
5.0
0.0 1.0 2.0 3.0 4.0 5.0
She
ar S
tres
s (k
sf)
Normal Stress (ksf)
0.0
0.5
1.0
1.5
2.0
2.5
3.0
3.5
4.0
4.5
0 0.1 0.2
Sh
ea
r S
tre
ss (
ksf)
Horizontal Deformation (in.)
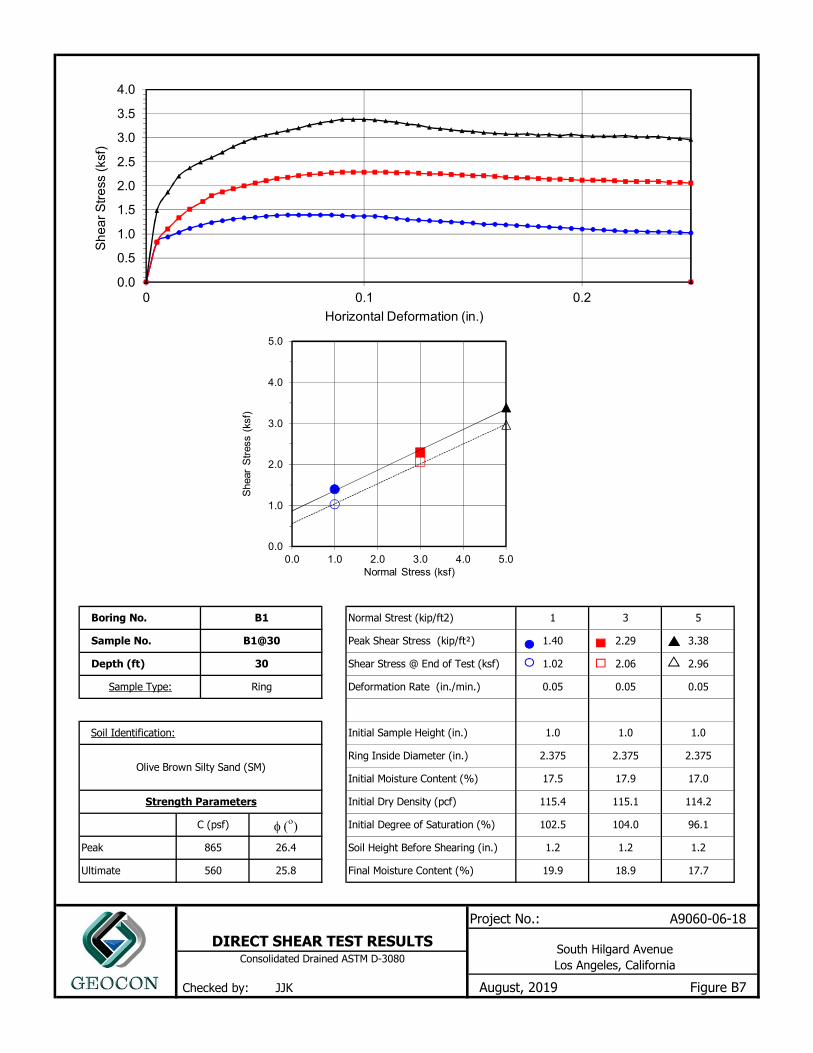
Project No.: A9060-06-18
Normal Strest (kip/ft2)
Peak Shear Stress (kip/ft²)
Shear Stress @ End of Test (ksf)
Deformation Rate (in./min.)
Initial Sample Height (in.)
DIRECT SHEAR TEST RESULTS South Hilgard Avenue Los Angeles, California
Checked by: JJK
Ring Inside Diameter (in.)
Initial Moisture Content (%)
Initial Dry Density (pcf)
Initial Degree of Saturation (%)
Soil Height Before Shearing (in.)
Final Moisture Content (%) 19.9
1.2
18.9
1.2
17.7
1.2
17.9
1
1.40
1.02
0.05
1.0
2.375
17.5
115.4
102.5
115.1
104.0
3
2.29
2.06
0.05
2.96
0.05
1.0
2.375
Consolidated Drained ASTM D-3080
Soil Identification:
Olive Brown Silty Sand (SM)
Strength Parameters
Peak
Ultimate
C (psf)
865
560
Boring No.
Sample No.
Depth (ft)
Sample Type:
August, 2019 Figure B7
26.4
25.8
B1
B1@30
30
Ring
1.0
2.375
17.0
114.2
96.1
5
3.38
0.0
1.0
2.0
3.0
4.0
5.0
0.0 1.0 2.0 3.0 4.0 5.0
She
ar S
tres
s (k
sf)
Normal Stress (ksf)
0.0
0.5
1.0
1.5
2.0
2.5
3.0
3.5
4.0
0 0.1 0.2
Sh
ea
r S
tre
ss (
ksf)
Horizontal Deformation (in.)

Project No.: A9060-06-18
August, 2019 Figure B8
26.2
28.2
B1
B1@45
45
Ring
1.0
2.375
22.1
108.1
107.0
5
3.13
Consolidated Drained ASTM D-3080
Soil Identification:
Olive Brown Silty Sand (SM)
Strength Parameters
Peak
Ultimate
C (psf)
762
323
Boring No.
Sample No.
Depth (ft)
Sample Type:
2.96
0.05
1.0
2.375
112.3
103.2
3
2.44
2.01
0.05
1.0
2.375
17.6
108.5
85.7
1
1.16
0.82
0.05
DIRECT SHEAR TEST RESULTS South Hilgard Avenue Los Angeles, California
Checked by: JJK
Ring Inside Diameter (in.)
Initial Moisture Content (%)
Initial Dry Density (pcf)
Initial Degree of Saturation (%)
Soil Height Before Shearing (in.)
Final Moisture Content (%) 21.4
1.2
19.7
1.2
20.0
1.2
19.1
Normal Strest (kip/ft2)
Peak Shear Stress (kip/ft²)
Shear Stress @ End of Test (ksf)
Deformation Rate (in./min.)
Initial Sample Height (in.)
0.0
1.0
2.0
3.0
4.0
5.0
0.0 1.0 2.0 3.0 4.0 5.0
She
ar S
tres
s (k
sf)
Normal Stress (ksf)
0.0
0.5
1.0
1.5
2.0
2.5
3.0
3.5
0 0.1 0.2
Sh
ea
r S
tre
ss (
ksf)
Horizontal Deformation (in.)

Project No.: A9060-06-18
Normal Strest (kip/ft2)
Peak Shear Stress (kip/ft²)
Shear Stress @ End of Test (ksf)
Deformation Rate (in./min.)
Initial Sample Height (in.)
DIRECT SHEAR TEST RESULTSSouth Hilgard Avenue Los Angeles, California
Checked by: JJK
Ring Inside Diameter (in.)
Initial Moisture Content (%)
Initial Dry Density (pcf)
Initial Degree of Saturation (%)
Soil Height Before Shearing (in.)
Final Moisture Content (%) 19.1
1.2
19.1
1.2
18.8
1.2
18.4
1
1.19
0.84
0.05
1.0
2.375
18.2
113.3
100.5
113.6
102.9
3
2.41
2.07
0.05
3.28
0.05
1.0
2.375
Consolidated Drained ASTM D-3080
Soil Identification:
Brown Silty Sand (SM)
Strength Parameters
Peak
Ultimate
C (psf)
521
240
Boring No.
Sample No.
Depth (ft)
Sample Type:
August, 2019 Figure B9
32.9
31.3
B2
B2@45
45
Ring
1.0
2.375
18.5
113.7
103.5
5
3.78
0.0
1.0
2.0
3.0
4.0
5.0
0.0 1.0 2.0 3.0 4.0 5.0
She
ar S
tres
s (k
sf)
Normal Stress (ksf)
0.0
0.5
1.0
1.5
2.0
2.5
3.0
3.5
4.0
0 0.1 0.2
Sh
ea
r S
tre
ss (
ksf)
Horizontal Deformation (in.)

Project No.: A9060-06-18
August, 2019 Figure B10
31.3
28.7
B1
B1@55
55
Ring
1.0
2.375
24.7
102.2
102.7
5
3.37
Consolidated Drained ASTM D-3080
Soil Identification:
Olive Brown Sandy Silt (ML)
Strength Parameters
Peak
Ultimate
C (psf)
394
259
Boring No.
Sample No.
Depth (ft)
Sample Type:
2.95
0.05
1.0
2.375
109.1
99.0
3
2.35
2.00
0.05
1.0
2.375
22.7
105.2
101.8
1
0.94
0.76
0.05
DIRECT SHEAR TEST RESULTSSouth Hilgard Avenue Los Angeles, California
Checked by: JJK
Ring Inside Diameter (in.)
Initial Moisture Content (%)
Initial Dry Density (pcf)
Initial Degree of Saturation (%)
Soil Height Before Shearing (in.)
Final Moisture Content (%) 26.6
1.2
21.9
1.2
23.9
1.2
20.0
Normal Strest (kip/ft2)
Peak Shear Stress (kip/ft²)
Shear Stress @ End of Test (ksf)
Deformation Rate (in./min.)
Initial Sample Height (in.)
0.0
1.0
2.0
3.0
4.0
5.0
0.0 1.0 2.0 3.0 4.0 5.0
She
ar S
tres
s (k
sf)
Normal Stress (ksf)
0.0
0.5
1.0
1.5
2.0
2.5
3.0
3.5
4.0
0 0.1 0.2
Sh
ea
r S
tre
ss (
ksf)
Horizontal Deformation (in.)

Project No.: A9060-06-18
WATER ADDED AT 2.0 KSF
SAMPLE ID.
B1@24
DRY DENSITY(PCF)
110.5
INITIAL MOISTURE (%)
FINAL MOISTURE (%)
16.917.4Brown Silty Sand (SM)
SOIL TYPE
CONSOLIDATION TEST RESULTS South Hilgard Avenue Los Angeles, California
Checked by: JJK
ASTM D-2435
August, 2019 Figure B11
0.0
1.0
2.0
3.0
4.0
5.0
6.0
7.0
8.0
9.0
10.00 1 10
Per
cen
t C
on
soli
dat
ion
Consolidation Pressure (ksf)
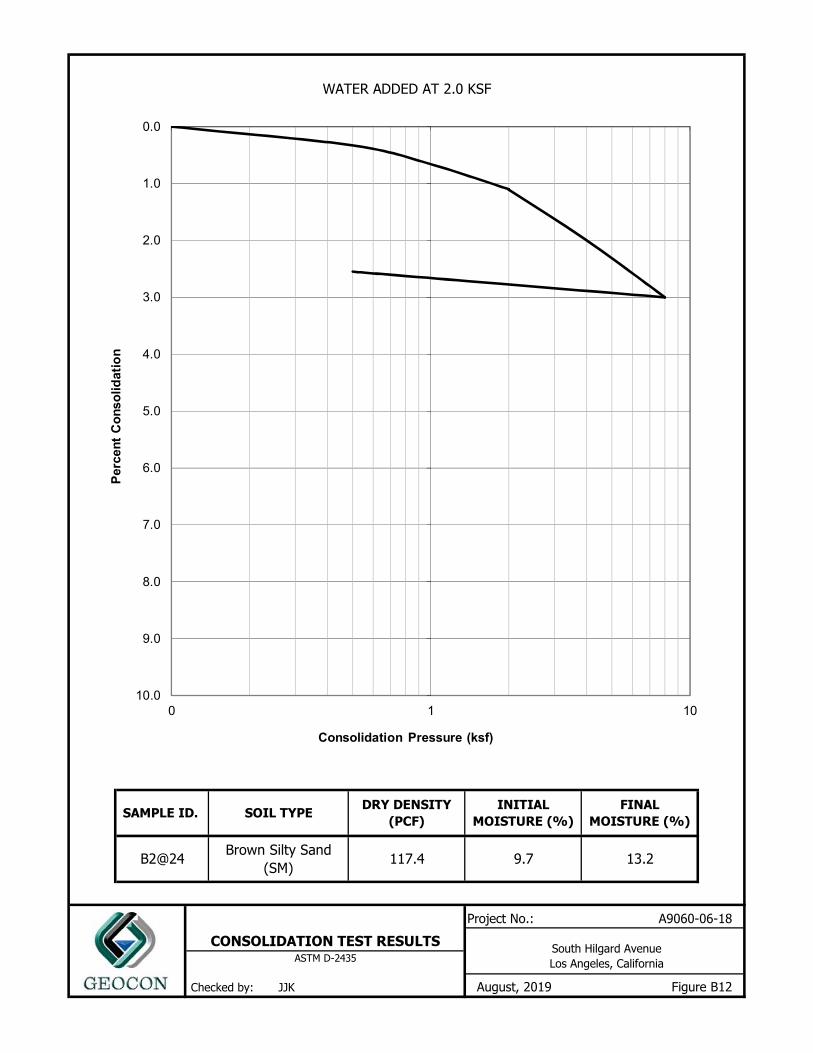
Project No.: A9060-06-18
WATER ADDED AT 2.0 KSF
SAMPLE ID.
B2@24
DRY DENSITY(PCF)
117.4
INITIAL MOISTURE (%)
FINAL MOISTURE (%)
13.29.7Brown Silty Sand (SM)
SOIL TYPE
CONSOLIDATION TEST RESULTS South Hilgard Avenue Los Angeles, California
Checked by: JJK
ASTM D-2435
August, 2019 Figure B12
0.0
1.0
2.0
3.0
4.0
5.0
6.0
7.0
8.0
9.0
10.00 1 10
Per
cen
t C
on
solid
atio
n
Consolidation Pressure (ksf)
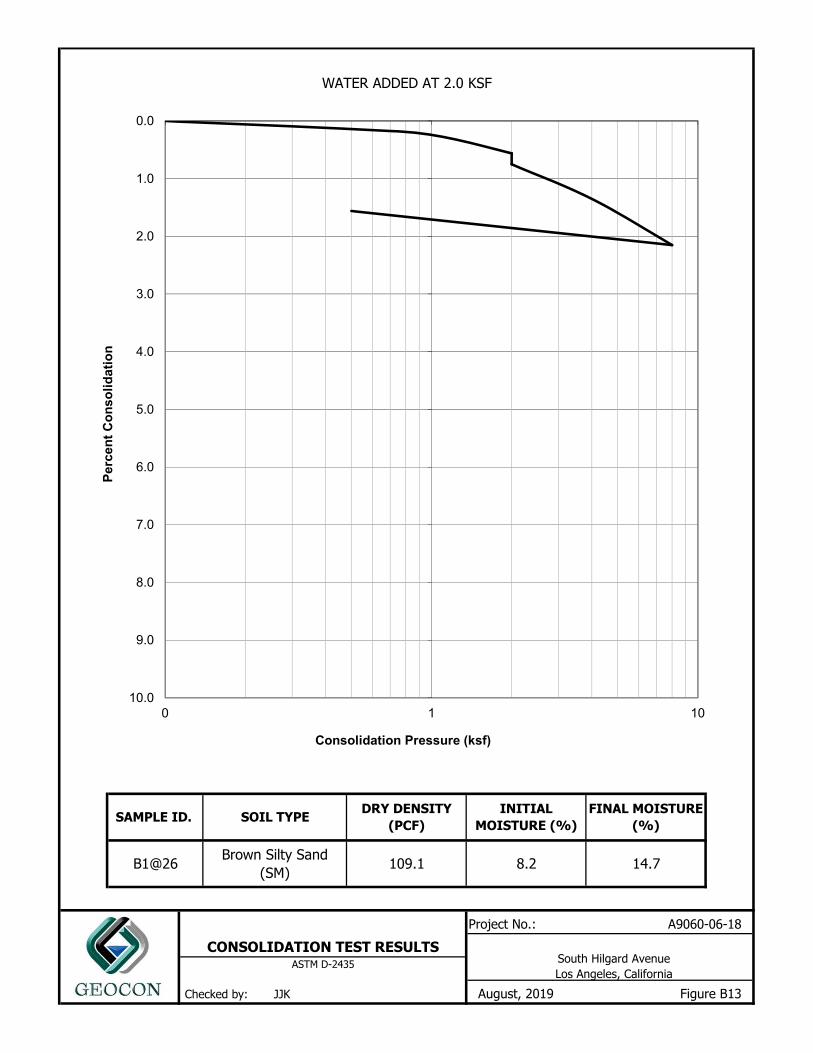
Project No.: A9060-06-18
WATER ADDED AT 2.0 KSF
SAMPLE ID.
B1@26
DRY DENSITY(PCF)
109.1
INITIAL MOISTURE (%)
FINAL MOISTURE (%)
14.78.2Brown Silty Sand (SM)
SOIL TYPE
CONSOLIDATION TEST RESULTSSouth Hilgard Avenue Los Angeles, California
Checked by: JJK
ASTM D-2435
August, 2019 Figure B13
0.0
1.0
2.0
3.0
4.0
5.0
6.0
7.0
8.0
9.0
10.00 1 10
Per
cen
t C
on
soli
dat
ion
Consolidation Pressure (ksf)
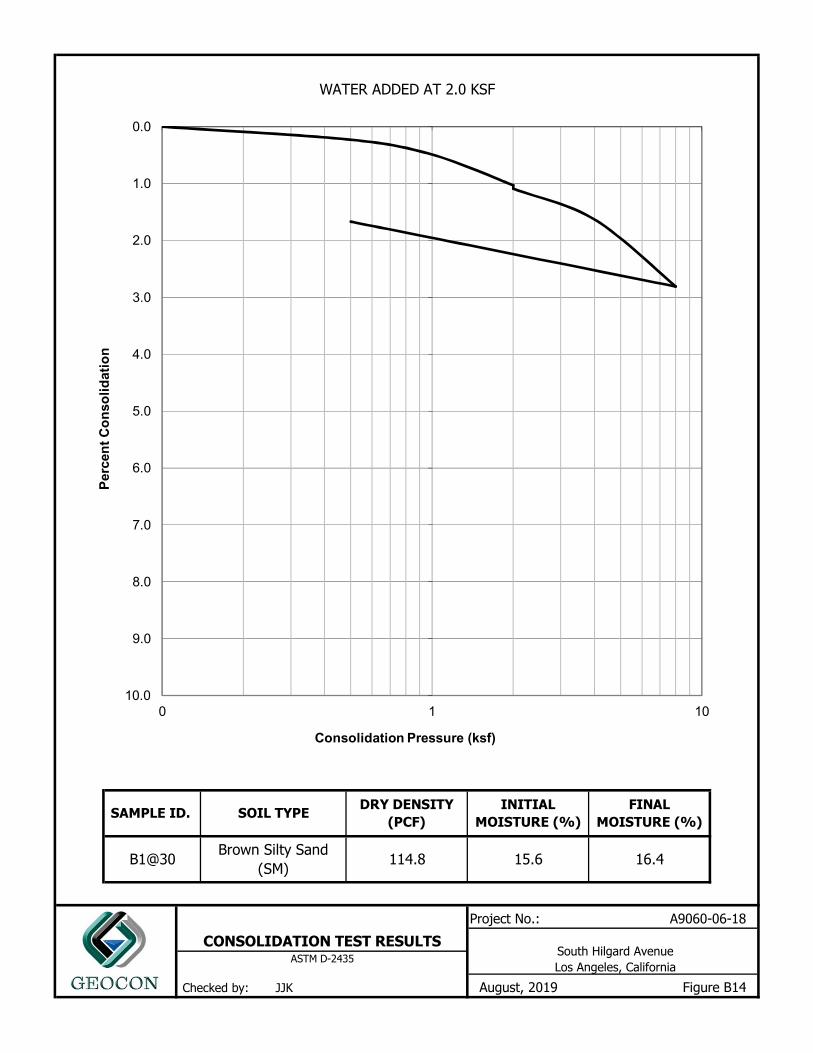
Project No.: A9060-06-18CONSOLIDATION TEST RESULTS
South Hilgard Avenue Los Angeles, California
Checked by: JJK
ASTM D-2435
August, 2019 Figure B14
WATER ADDED AT 2.0 KSF
SAMPLE ID.
B1@30
DRY DENSITY(PCF)
114.8
INITIAL MOISTURE (%)
FINAL MOISTURE (%)
16.415.6Brown Silty Sand (SM)
SOIL TYPE
0.0
1.0
2.0
3.0
4.0
5.0
6.0
7.0
8.0
9.0
10.00 1 10
Per
cen
t C
on
soli
dat
ion
Consolidation Pressure (ksf)

Project No.: A9060-06-18
WATER ADDED AT 2.0 KSF
SAMPLE ID.
B2@30
DRY DENSITY(PCF)
110.0
INITIAL MOISTURE (%)
FINAL MOISTURE (%)
17.214.7Brown Silty Sand (SM)
SOIL TYPE
CONSOLIDATION TEST RESULTS South Hilgard Avenue Los Angeles, California
Checked by: JJK
ASTM D-2435
August, 2019 Figure B15
0.0
1.0
2.0
3.0
4.0
5.0
6.0
7.0
8.0
9.0
10.00 1 10
Per
cen
t C
on
soli
dat
ion
Consolidation Pressure (ksf)
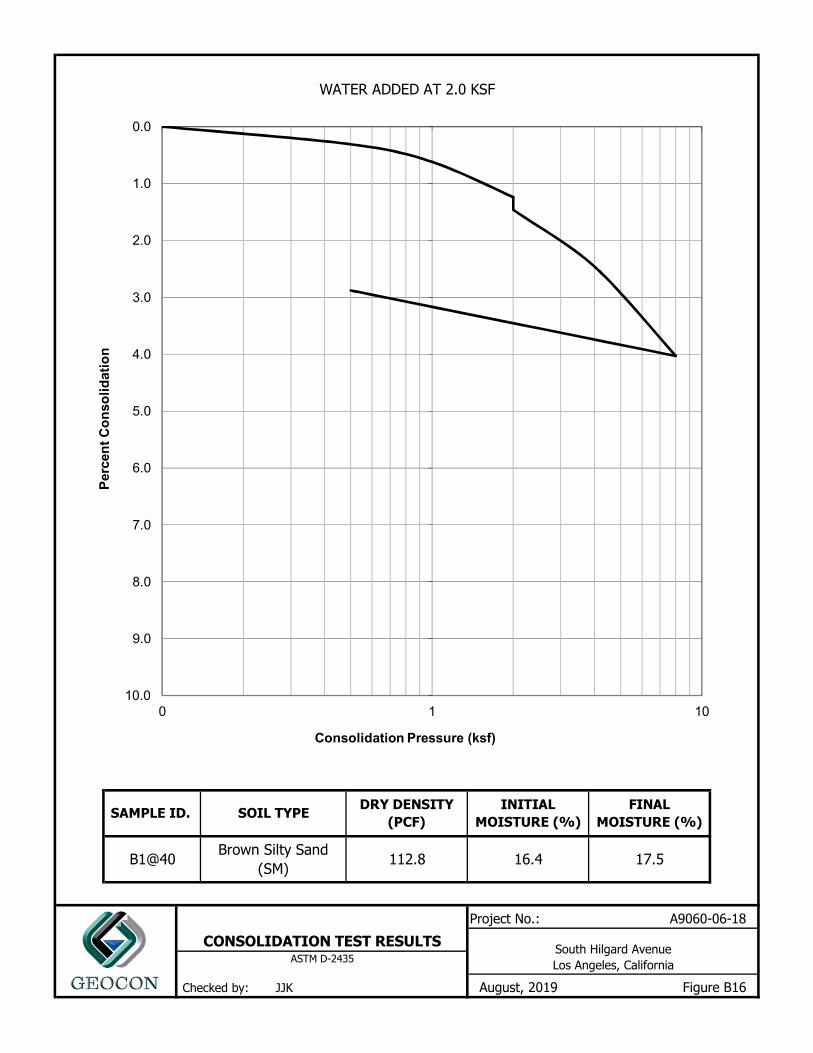
Project No.: A9060-06-18
WATER ADDED AT 2.0 KSF
SAMPLE ID.
B1@40
DRY DENSITY(PCF)
112.8
INITIAL MOISTURE (%)
FINAL MOISTURE (%)
17.516.4Brown Silty Sand (SM)
SOIL TYPE
CONSOLIDATION TEST RESULTS South Hilgard Avenue Los Angeles, California
Checked by: JJK
ASTM D-2435
August, 2019 Figure B16
0.0
1.0
2.0
3.0
4.0
5.0
6.0
7.0
8.0
9.0
10.00 1 10
Per
cen
t C
on
soli
dat
ion
Consolidation Pressure (ksf)

Project No.: A9060-06-18CONSOLIDATION TEST RESULTS South Hilgard Avenue
Los Angeles, California
Checked by: JJK
ASTM D-2435
August, 2019 Figure B17
WATER ADDED AT 2.0 KSF
SAMPLE ID.
B2@40
DRY DENSITY(PCF)
113.2
INITIAL MOISTURE (%)
FINAL MOISTURE (%)
14.413.1Dark Brown Poorly Graded Sand (SP)
SOIL TYPE
0.0
1.0
2.0
3.0
4.0
5.0
6.0
7.0
8.0
9.0
10.00 1 10
Per
cen
t C
on
soli
dat
ion
Consolidation Pressure (ksf)

Project No.: A9060-06-18CONSOLIDATION TEST RESULTS
South Hilgard Avenue Los Angeles, California
Checked by: JJK
ASTM D-2435
August, 2019 Figure B18
WATER ADDED AT 2.0 KSF
SAMPLE ID.
B1@45
DRY DENSITY(PCF)
111.2
INITIAL MOISTURE (%)
FINAL MOISTURE (%)
18.418.3Brown Silty Sand (SM)
SOIL TYPE
0.0
1.0
2.0
3.0
4.0
5.0
6.0
7.0
8.0
9.0
10.00 1 10
Per
cen
t C
on
soli
dat
ion
Consolidation Pressure (ksf)

Project No.: A9060-06-18CONSOLIDATION TEST RESULTS South Hilgard Avenue
Los Angeles, California
Checked by: JJK
ASTM D-2435
August, 2019 Figure B19
WATER ADDED AT 2.0 KSF
SAMPLE ID.
B2@50
DRY DENSITY(PCF)
113.0
INITIAL MOISTURE (%)
FINAL MOISTURE (%)
16.315.9Brown Silty Sand (SM)
SOIL TYPE
0.0
1.0
2.0
3.0
4.0
5.0
6.0
7.0
8.0
9.0
10.00 1 10
Per
cen
t C
on
soli
dat
ion
Consolidation Pressure (ksf)

Project No.: A9060-06-18CONSOLIDATION TEST RESULTS South Hilgard Avenue
Los Angeles, California
Checked by: JJK
ASTM D-2435
August, 2019 Figure B20
WATER ADDED AT 2.0 KSF
SAMPLE ID.
B1@55
DRY DENSITY(PCF)
115.7
INITIAL MOISTURE (%)
FINAL MOISTURE (%)
16.215.1Brown Silt (ML)
SOIL TYPE
0.0
1.0
2.0
3.0
4.0
5.0
6.0
7.0
8.0
9.0
10.00 1 10
Per
cen
t C
on
soli
dat
ion
Consolidation Pressure (ksf)

Sample No:
(g)(g)(g)(g)(g)(g)(%)
(pcf)(pcf)
Preparation Method:Project No.: A9060-06-18
Checked by: JJK
MODIFIED COMPACTION TEST OF SOILS
South Hilgard Avenue Los Angeles, California
ASTM D-1557
August, 2019 Figure B21
5 6Wt. Compacted Soil + Mold 6248 6263 6228 6183
TEST NO. 1 2 3 4
Net Weight of Soil 2075 2090 2055 2010Weight of Mold 4173 4173 4173 4173
Dry Weight of Soil + Cont. 659.3 714.4 623.6 763.6Wet Weight of Soil + Cont. 707.0 778.2 688.4 808.8
Moisture Content 9.3 11.2 13.2 7.1Weight of Container 145.0 145.6 133.8 125.8
Wet Density 137.4 138.4 136.0 133.1
A
Maximum Dry Density (pcf) 126.0 Optimum Moisture Content (%) 10.0
B2@0-5 Brown Silty Sand (SM)
Dry Density 125.7 124.4 120.2 124.3
110.0
115.0
120.0
125.0
130.0
135.0
140.0
0.0 5.0 10.0 15.0 20.0
Dry
Den
sity
(p
cf)
Moisture Content (%)
S.G. 2.65
S.G. 2.7
S.G. 2.75
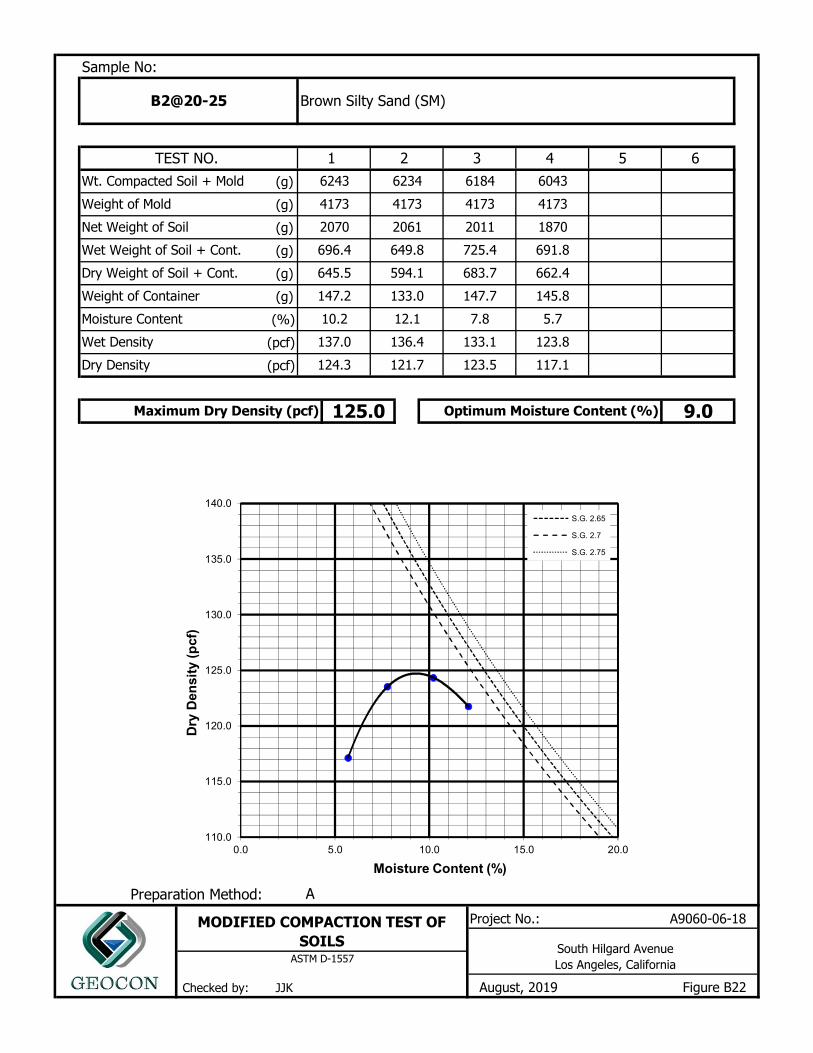
Sample No:
(g)(g)(g)(g)(g)(g)(%)
(pcf)(pcf)
Preparation Method:Project No.: A9060-06-18
B2@20-25 Brown Silty Sand (SM)
Dry Density 124.3 121.7 123.5 117.1
A
Maximum Dry Density (pcf) 125.0 Optimum Moisture Content (%) 9.0
Wet Density 137.0 136.4 133.1 123.8Moisture Content 10.2 12.1 7.8 5.7Weight of Container 147.2 133.0 147.7 145.8Dry Weight of Soil + Cont. 645.5 594.1 683.7 662.4Wet Weight of Soil + Cont. 696.4 649.8 725.4 691.8Net Weight of Soil 2070 2061 2011 1870Weight of Mold 4173 4173 4173 4173
5 6Wt. Compacted Soil + Mold 6243 6234 6184 6043
TEST NO. 1 2 3 4
Checked by: JJK
MODIFIED COMPACTION TEST OF SOILS South Hilgard Avenue
Los Angeles, CaliforniaASTM D-1557
August, 2019 Figure B22
110.0
115.0
120.0
125.0
130.0
135.0
140.0
0.0 5.0 10.0 15.0 20.0
Dry
Den
sity
(p
cf)
Moisture Content (%)
S.G. 2.65
S.G. 2.7
S.G. 2.75

Project No.: A9060-06-18
Checked by: JJK
CORROSIVITY TEST RESULTS South Hilgard Avenue Los Angeles, California
August, 2019 Figure B23
SUMMARY OF LABORATORY POTENTIAL OF HYDROGEN (pH) AND RESISTIVITY TEST RESULTS
CALIFORNIA TEST NO. 643
Sample No.
B2 @ 20-25
pH
6.5
Resistivity(ohm centimeters)
1030 (Corrosive)
SUMMARY OF LABORATORY CHLORIDE CONTENT TEST RESULTS EPA NO. 325.3
B2@20-25
B2@20-25 0.011 S0
Sample No.
SUMMARY OF LABORATORY WATER SOLUBLE SULFATE TEST RESULTSCALIFORNIA TEST NO. 417
Sample No. Water Soluble Sulfate (% SQ4)
Sulfate Exposure*
Chloride Ion Content (%)
0.012