Embed Size (px)
Citation preview

RIVISTA ITALIANA DI GEOTECNICA 3/2013
Geotechnical characterization of the Aterno valley for site response analyses
Filippo Santucci de Magistris,1 Anna d’Onofrio,2 Lorenza Evangelista,2 Sebastiano Foti,3
Margherita Maraschini,3 Paola Monaco,4 Sara Amoroso,5 Gianfranco Totani,4 Giuseppe Lanzo,6
Alessandro Pagliaroli,7 Claudia Madiai,8 Giacomo Simoni,8 Francesco Silvestri2
SummaryThe paper reports about the in-situ and laboratory tests executed in the aftermath of the April 6, 2009 L’Aquila earthquake,
aimed at contributing to the definition of geotechnical models for site response analyses in the Aterno valley. The investigation
started immediately after the earthquake and was entrusted by the Civil Protection Department to different public institutions
and private companies; the experimental activities here reported were coordinated by the Italian Geotechnical Society.
In the paper, after briefly depicting the geological setting of the L’Aquila basin and the Aterno river valley, an overview of
their subsoil conditions is given, based on the geotechnical tests executed before the 2009 earthquake. Thereafter, the specific
investigations planned for the characterization of reconstruction sites and seismic microzonation are widely described. The in
situ tests consisted of seismic dilatometer and multi-receiver surface wave tests; the resulting shear wave velocity profiles were
compared each other, and against independent Down-Hole tests and ambient noise measurements. The laboratory investiga-
tion included cyclic/dynamic simple/torsional shear tests on undisturbed samples. The results, summarized in terms of vari-
ation of stiffness and damping with shear strain, highlighted some peculiar properties of the soils in the Aterno valley, which
could be related to their index properties.
1. Geological setting of the L’Aquila basin and the Aterno river valley
The area affected by the April 6th, 2009 earthqua-ke is located within the central section of the Apen-nines, the mountain chain which traverses most of the length of the Italian peninsula. The city of L’A-quila and most of the small towns damaged by the earthquake lie in a vast intra-Apennine tectonicba-sin, elongated in NW-SE direction, parallel to many
of the active normal faults and surrounded by the high peaks of the Gran Sasso and the Velino-Sirente mountains. These chains are mostly constituted by Meso-Cenozoic carbonate rocks and occasionally by marly-arenaceous rocks.
The Aterno River is the main hydrographic ele-ment of the basin; the middle Aterno river valley is about 10 km wide and is elongated in the NW-SE di-rection for more than 15 km. The current geological setting of the L’Aquila basin results from a complex sequence of depositional events, due to erosion and tectonics.
The geological setting of the L’Aquila basin is il-lustrated in the geological map and the schematic section drawn in figure 1.
The bedrock consists of Meso-Cenozoic lime-stone formations, generally outcropping along the sides of the valley and on ridges located within the Aterno River basin.
The bottom of the valley was filled during the Quaternary with continental deposits of variable ge-nesis and deposition age, resulting from lacustrine to subsequent fluvial sedimentations. The maximum thickness of the Quaternary deposits is estimated as high as 400-500 m.
The older Pleistocene lacustrine deposits, pla-ced on the calcareous bedrock, form a complex de-positional sequence of silt, sand and conglomerate
1 Department Di.B.T., Structural and Geotechnical Dyna-mics Laboratory - StreGa, University of Molise, Termoli (CB), Italy
2 Department of Civil, Architectural and Environmental Engineering, University of Naples Federico II, Naples, Italy3 Department of Structural, Geotechnical and Building Engineering, Politecnico di Torino, Italy. 4 Department of Civil, Architectural and Environmental Engineering, University of L’Aquila, Italy5 Istituto Nazionale di Geofisica e Vulcanologia (INGV), L’Aquila, Italy6 Department of Structural and Geotechnical Engineering, University La Sapienza, Rome, Italy7 Institute for Environmental Geology and Geo-Engineering
- National Research Council (IGAG-CNR), Rome, Italy8 Department of Civil and Environmental Engineering, University of Florence, Italy

RIVISTA ITALIANA DI GEOTECNICA
24 SANTUCCI DE MAGISTRIS ET AL.
units [BOSI and BERTINI, 1970; BERTINI et al., 1989]. In detail, three different units may be distinguished within the lacustrine formation:– an older unit at the bottom (placed on the be-
drock) of highly variable composition, mostly gravels, sands and clays in variable combination;
– an intermediate unit, predominantly consisting of gravels and sands;
– a more recent unit at the top, mainly consisting of sands and clays, having a thickness of some tens of meters.
The most recent alluvial Holocene soils, placed on the top of the Meso-Cenozoic and Pleistocene deposits, consist of sands and cobbles, while sands and silts are sometimes found. The foot of the valley flanks and the ridges located within the valley are co-vered by talus debris and, locally, by large debris al-luvial fans. The relationship among the sedimentary styles is very complex, due to the interplay of tecto-nics and climate changes.
The area on the left side of the Aterno River ba-sin (drainage from NW to SE), where the old town
Fig. 1 – a) Geological map of the area of L’Aquila showing the test sites analyzed in the paper (Cese di Preturo, Sassa and
Pagliare are outside of this map); b) schematic section across the town center of L’Aquila (modified after APAT, 2006). CTP
sites are specified in Fig. 4.
Fig. 1 – a) Carta geologica dell’area dell’Aquila, con ubicazione delle prove illustrate nella nota (Cese di Preturo, Sassa e Pagliare sono
fuori dalla mappa); b) sezione geologica schematica passante per il centro storico dell’ Aquila (modificata da APAT, 2006). I siti delle
prove CPT sono riportati in Fig. 4.

25
LUGLIO - SETTEMBRE 2013
GEOTECHNICAL CHARACTERIZATION OF THE ATERNO VALLEY FOR THE SITE RESPONSE ANALYSES…
center of L’Aquila is located, is characterized by the presence of vast deposits of Pleistocene heterometric breccias (associated with Quaternary paleolandsli-des), known as “Megabreccias” or “Brecce dell’Aqui-la”, overlying the lacustrine sequence placed on the bedrock. The “Megabreccias” consist of limestone boulders and alluvial clasts with a size from few cen-timeters to few meters, embedded in sandy-silty ma-trix having a highly variable degree of cementation.
2. Geotechnical properties from routine in situ and laboratory tests
The collection and analysis of existing data from previous geotechnical investigations, typically car-ried out by routine in situ and laboratory tests, was the primary step in planning the post-earthquake site investigation programs. Particular attention was devoted to possible sites for new temporary housing and to seismic microzonation, as well as to public bu-ildings damaged by the earthquake.
Soon after the main shock of the seismic se-quence, a large amount of data from previous in-vestigations carried out in the area of L’Aquila was collected by the Civil Protection Department (DPC) and organized into an on-line database, which was made available to decision makers and investigators.
A preliminary selection of results of in situ and laboratory tests, collected throughout the past years by the geotechnical group of the University of L’Aquila [BERTINI et al., 1992], points out that the Quaternary deposits of the L’Aquila basin are cha-racterized by a significant heterogeneity.
Figure 2 shows the grain size distribution (Fig. 2a) and the plasticity properties (Fig. 2b) of nu-merous soil samples from the lacustrine formation in the upper part of the Aterno valley. The variabil-ity of the grain size distribution is confirmed by the material index, ID, evaluated by flat dilatometer tests (DMT) carried out in the same formation, at two locations close to the river (Fig. 3). The layering is characterised by a cover of silty-sandy soil overlying a finer clayey deposit. In the same figure, the me-chanical parameters usually evaluated by DMT test (the constrained modulus M, the undrained shear strength cu and the horizontal stress index KD, relat-ed to OCR) show a gradual but irregular increase with depth. The profiles of the shear wave velocity, VS, estimated from empirical correlations with DMT [MONACO et al., 2009], show that VS values seldom ex-ceed 400 m/s, even at the largest investigated depth, that is 14 m in this case.
The Holocene alluvial deposits lying in the bot-tom part of the Aterno valley are also characterised by a remarkable heterogeneity. As an example, fig-ure 4 compares the profiles of tip resistance, qc, re-sulting from 25 cone penetration tests (CPT) carried out along the banks of the Aterno River from Onna to Fossa. Below the first 4 m depth, the profiles be-come very irregular; the relatively low qc values also indicate the poor geotechnical properties of the riv-er bank deposits, which could contribute to explain the high concentration of damage caused by the earthquake in this zone, including the collapse of a R.C. bridge near Fossa [LANZO et al., 2010].
A typical stratigraphic profile in the “Megabrec-cias” formation, as retrieved from a borehole drilled in the historical centre of L’Aquila (Piazza del Tea-
Fig. 2 –Typical range of a) grain size distribution and b) plasticity properties of the lacustrine sediments in the West sector of
the L’Aquila basin (modified after BERTINI et al., 1992).
Fig. 2 – Intervalli tipici della a) distribuzione granulometrica e b) proprietà plastiche dei sedimenti lacustri presenti nel settore occidentale
del bacino de L’Aquila (modificato da BERTINI et al., 1992).

RIVISTA ITALIANA DI GEOTECNICA
26 SANTUCCI DE MAGISTRIS ET AL.
tro), is reported in figure 5, together with the VS profi-le obtained by a seismic dilatometer test (SDMT) car-ried out in the borehole after backfilling with sand.VS
measurements by SDMT in backfilled boreholes are normally taken every 0.50 m of depth. The “gaps” in the VS profile in Figure 5b, as well as in figure 6 ahead, correspond to depth intervals greater than 0.50 m in which VS measurements were missed during testing. The shear wave velocity increases with depth froma-bout 400 m/s up to 1600 m/s, evidencing the existen-ce of a weathered cover in the first 10-15 m. Some bo-reholes executed in the centre of L’Aquila retrieved layers of fill material, having thickness of few meters; most of these man-made fills are supposed to be the disposal of rubbles of masonry buildings destroyed by past earthquakes [MONACO et al., 2012].
3. Shear wave velocity from in situ tests
The emergency scenario imposed very strict ti-me constraints for decisionson reconstruction. Few
weeks after the mainshock, the Civil Protection De-partment identified about tentative 20 sites to lo-cate the first temporary houses for homeless peo-ple.
These buildings (C.A.S.E. project) were con-ceived to be seismically isolated, so that one of the requirements to be satisfied for the definitive loca-tion was that the natural frequency of the subsoil should be larger than 0.5 Hz. This was verified by ambient noise measurements and by performing 1-D linear equivalent site response analyses (e.g., EVANGELISTA et al., 2011). For an accurate yet quick dynamic subsoil characterization of such sites, sur-face wave tests were planned in all of them. Down-Hole (DH) and laboratory tests were carried out only in sites with apparently deep seismic bedrock. A task force of the Italian Geotechnical Society (AGI) was committed to investigate several of such sites by seismic dilatometer and surface wave tests (see Fig. 1a). The testing techniques and some rep-resentative results will be reported in the follow-ing.
Fig. 3 – DMT profiles at the site of a) Coppito – San Salvatore Hospital (10 tests executed in 1993) and b) L’Aquila railway
station – Nuovo Archivio di Stato, near Aterno River (6 tests executed in 1993).
Fig. 3 – Profili DMT dei siti di a) Coppito – Ospedale San Salvatore (10 prove eseguite nel 1993) e b) della stazione ferroviaria di
L’Aquila – Nuovo Archivio di Stato, vicino il fiume Aterno (6 prove eseguite nel 1993).

27
LUGLIO - SETTEMBRE 2013
GEOTECHNICAL CHARACTERIZATION OF THE ATERNO VALLEY FOR THE SITE RESPONSE ANALYSES…
3.1. Seismic dilatometer: testing and interpretation pro-cedures
Seismic dilatometer tests (SDMT) (e.g., MAR-
CHETTI et al., 2008) are executed employing, as a wave source, a pendulum hammer ( 10 kg) that hits horizontally a steel rectangular plate, pressed against the soil by the weight of a truck. Two hori-zontal receivers, assembled with a spacing of 0.50 m along the DMT blade, can record the shear wave arrival. The VS measurements are typically taken every 0.50 m of depth, while the mechanical DMT readings are taken every 0.20 m. The VS value is ob-tained as the ratio between the difference in dis-tance between the two receivers and in time be-tween the seismograms at the first and the second receiver. The latter is computed through a cross-correlation algorithm and systematically checked trough the visual inspection of the recorded tracks. The test procedure proves to be an effective, quick and cost-saving alternative to conventional DH tests in loose and soft soils; however, VS profiles can be obtained also in non-penetrable soils by inserting the SDMT blade in a preliminary drilled and back-filled borehole. In this case, the other DMT pa-rameters are not measured because they would be meaningless in the backfill soil. Details of the tech-nique can be found in TOTANI et al. [2009].
As a general rule, it is advisable to measure di-rectly VS; however, at sites where only mechanical
DMTs have been executed, the small strain shear modulus G0 (hence VS) can be estimated with em-pirical correlations based on the parameters ID, KD,MDMT [MONACO et al., 2009].
Fig. 4 – a) Location and b) profiles of the cone penetration resistance qc from 25 CPT tests carried out along the left hand
side (PS) and right hand side (PD) banks of the Aterno River from Onna to Fossa (after MONACO et al., 2012).
Fig. 4 – a) Ubicazione e b) profili della resistenza penetrometrica qc da 25 prove CPT condotte lungo le rive destra (PD) e sinistra (PS) del
fiume Aterno fra Onna e Fossa (da MONACO et al., 2012).
Fig. 5 – a) Typical stratigraphic profile of the subsoil
(“Megabreccias”) in the town center of L’Aquila; b) SDMT
measurements of VS in the backfilled borehole (after TO-
TANI et al., 2009).
Fig. 5 – a) Tipico profilo stratigrafico di sottosuolo
(“Megabreccia”) presente nel centro della città de L’Aquila. b)
Profilo di VS da prova SDMT (da TOTANI et al., 2009).

RIVISTA ITALIANA DI GEOTECNICA
28 SANTUCCI DE MAGISTRIS ET AL.
The SDMT can be also helpful to estimate the decay of the equivalent shear modulus G with shear strain , as it will be shown at the end of the paper.
3.2. SDMT results in the Aterno valley
The tests were carried out at 5 locations (Pettino, Cese di Preturo, Sant’Antonio, Roio Piano and Pia-nola, see Figure 1a) in the first months following the earthquake [UNIVERSITÀ DELL’AQUILA, 2009].
Figure 6a shows the profiles of DMT parame-ters and VS for a site (Pettino) where a silty cover about 8 m thick overlies a thick gravelly layer; most of the subsoil was therefore non-penetrable and the borehole backfilling procedure was followed. As in the case shown in figure 5, the VS measured
in the gravel is higher than 400 m/s, reaching val-ues in the order of 1000 m/s for a depth greater than 15 m.
The results in figure 6b were gathered at Pia-nola, one of the sites of the C.A.S.E. project, where a 5 m silty cover overlies a 20 m thick layer of sandy soil and deep bedrock is expected. The measured VS values increase with depth and exceed 400 m/s at the largest investigated depths. For both sites a good agreement exists between the VS profile di-rectly measured by SDMT with that estimated from mechanical DMT, using the correlation by MONACO
et al. [2009]. For the Pianola site, the comparison among the VS profiles by SDMT and by other tech-niques (surface waves and Down-Hole tests) is also satisfactory, as discussed in details by MONACO et al.
[2012].
Fig. 6 – SDMT results at a) Pettino and b) Pianola sites.
Fig. 6 – Risultati di prove SDMT condotte presso i siti di a) Pettino e b) Pianola.

29
LUGLIO - SETTEMBRE 2013
GEOTECHNICAL CHARACTERIZATION OF THE ATERNO VALLEY FOR THE SITE RESPONSE ANALYSES…
3.3. Surface waves: testing and interpretation procedures
The Surface Wave Method (SWM) is a cost- and time-effective technique for evaluating the shear wave velocity profile. It is based on the dispersion of surface waves in vertically heterogeneous media: the velocity of each harmonic component of the sur-face wave depends on the properties of the medium affected by the wave propagation and its penetra-tion depth is proportional to the wavelength. An ex-perimental ‘dispersion curve’ (velocity versus wave-length or frequency) can be extracted from field da-ta using several processing techniques (e.g., SOCCO
and STROBBIA, 2004; FOTI, 2005; EVANGELISTA, 2009). The shear wave velocity profile can be inferred by solving an inverse problem, based on the minimiza-tion of the distance between the theoretical disper-sion curve and the experimental one.
In the investigated sites, multi-receiver surface wave (MASW) tests were performed using both ac-tive and passive acquisition techniques. The multi-station active layout used harmonic (f>5Hz) or im-pulsive sources and linear receiver arrays; the pas-sive layout (f<10Hz) used two-dimensional receiver arrays, necessary to determine the direction of the dominant wave and consequently its velocity. Disper-sion curves were obtained as the amplitude peaks in the f-k (frequency-wavenumber) domain, where dif-ferent curve branches identify the multi-modal re-sponse of the layered subsoil [ZYWICKI, 1999].
The inversion procedure was based on the Ha-skell-Thomson matrix method for the solution of the forward problem [THOMSON, 1950; HASKELL, 1953]. For an elastic horizontally layered medium, the di-spersion curve corresponds to the zeros in the veloci-
ty-frequency domain of the Haskell-Thomson matrix determinant, which depends on model parameters (layer thickness, shear wave velocity, density, Pois-son’s ratio). In figure 7 the shape of the absolute va-lue of the Haskell-Thomson matrix determinant for a given profile is shown.
A Monte Carlo algorithm was used to perform the inversion of the experimental data [MARASCHINI
and FOTI, 2010]. This algorithm evaluates the misfit of a set of soil profiles randomly generated between boundaries chosen by the user from the experimen-tal dispersion curve. The misfit function is the L1 norm of the vector of the Haskell-Thomson deter-minant, evaluated in correspondence of the experi-mental dispersion curve. This misfit function allows higher modes of propagation of Rayleigh wave to be properly taken into account with low computational cost [MARASCHINI et al., 2010].
Moreover, with the adoption of a stochastic ap-proach, it is possible to appreciate the uncertainty associated to non-uniqueness of the solution, which is typical of any method based on the solution of an inverse problem. A discussion of the consequences of such uncertainty on seismic site response can be found in FOTI et al. [2009].
For the present study, the inversion procedure was carried out as a ‘quick and blind prediction’, i.e. with no knowledge of the layering from the boreho-les which, in most cases, were afterwards executed nearby.
A first validation of the MASW shear wave velo-city profiles was possible by means of the DH and SDMT tests subsequently available in some of these sites. A further validation was attempted using sin-gle station measurements of microtremors. Indeed,
Fig. 7 – Determinant of the Haskell-Thomson matrix for a given profile: the surface represents the value of the Haskell-
Thomson matrix determinant in the velocity-frequency domain; black dots represent the zeros of the surface, i.e. the disper-
sion curve.
Fig. 7 – Determinante della matrice di Haskell-Thomson per un dato profilo stratigrafico: la superficie rappresenta il valore del determinate
della matrice di Haskell-Thomson nel dominio velocità-frequenza; i punti neri rappresentano gli zeri della superficie, ovvero la curva di
dispersione.

RIVISTA ITALIANA DI GEOTECNICA
30 SANTUCCI DE MAGISTRIS ET AL.
the experimental horizontal to vertical spectral ratio (HVSR) of ambient noise provides a reasonable es-timate of the fundamental natural frequency of the site. This can be compared to the fundamental fre-quency computed for the same subsoil, modeled as a visco-elastic linear layered medium with the MASW velocity profile. To compute such transfer function, the depth (zB) and velocity (VS,B) of the stiffest and deepest layer were taken, in an approximate way, as conventional bedrock parameters.
3.4. Surface Wave Tests in the Aterno Valley
The MASW tests in the Aterno valley were carried out in the six C.A.S.E. sites shown in figure 1a; geolo-gical surveys and instrumental records of aftershocks and microtremors permitted a preliminary classifi-cation of the sites with apparently shallow and deep bedrock. Therefore, for three ‘shallow bedrock’ sites (Bazzano, San Giacomo, Sant’Antonio), only active MASW tests were carried out; for the ‘deep bedrock’ sites (Roio Piano, Pianola, Il Moro), passive measu-rements were also used to reach higher investigation depths.
A synthesis of the experimental data collected on the six C.A.S.E. sites is shown in table I. In three cases, a nearby Down-Hole test was available and reliable; at the sites of Roio Piano and Pianola, however, the DH did not detect seismic bedrock because of the limit-ed extension of the boreholes, while the MASW tests were able to investigate down to higher depths (zmax
in the table) and identified a seismic bedrock.The table shows that the experimental peak fre-
quency (fHVSR) and the fundamental frequency com-
puted analytically on the basis of the MASW velocity profiles (fMASW) are in a good agreement. In the fol-lowing, two representative examples (one with shal-low the other with deep bedrock) will be reported; further details are given in BOIERO et al. [2009] and D’ONOFRIO et al. [2010].
3.4.1. SITES WITH DEEP BEDROCK
At the ‘deep bedrock’ sites, investigated by the researchers of the Politecnico di Torino, the inte-gration of active and passive data allowed dispersion curves to be retrieved over a broad frequency range; thus, the investigated depth was extended without losing resolution in shallow layers.
Specifically, in Roio Piano the subsoil is cha-racterized by colluvial deposits and debris covers overlying sandy and silty layers; the latter lie on a stiff calcareous bedrock with variable depth [TALLINI et
al., 2009]. Figure 8 shows three branches of the ex-perimental dispersion curve: two of them result from the active-source acquisitions, using a linear receiver array, and overlap to the passive data in the common frequency region (5-10 Hz). The whole experimen-tal dispersion curve was inverted using the multi-mo-dal Monte Carlo algorithm described above. The in-version was performed using a population of 106 ran-domly generated profiles.
In figure 9a a set of twenty trial profiles is plot-ted, including the best-fitting profile (which corre-sponds to the darkest color). The Haskell-Thomson matrix determinant of the latter is compared to the experimental dispersion curves in figure 9b. The hi-gher velocity branch of the experimental dispersion curve is associated to the first higher mode.
Bedrock SitefHVSR
(Hz)
zmax
(m)
Stiff layerFMASW
(Hz)NoteszB
(m)
VS,B
(m)
Shallow
Bazzano 8.325 (MASW) 8 (MASW) 500 (MASW)
8.0no DH test
San Giacomo 7.225 (MASW)
33 (DH)
16 (MASW)
12 (DH)
550 (MASW)
-8.0
DH not reliable
Sant’Antonio 9.527 (MASW)
24 (DH)
5 (MASW)
10 (DH)
550 (MASW)
400 (DH)13.0
likely velocity inversion in
gravels
Deep
Il Moro 2.540 (MASW) 25 (MASW) 800 (MASW)
3.8no DH test
Roio Piano 2.870 (MASW)
40 (DH)
40-45
(MASW)
> 40 m (DH)
800 (MASW)
-3.1 borehole not to bedrock
Pianola 1.550 (MASW)
30 (DH)
34-35
(MASW)
> 30 m (DH)
1200
(MASW)
-
2.5 borehole not to bedrock
Tab. I – Summary of site characteristics where SWM tests were carried out by Italian Geotechnical Society AGI.
Tab. I – Riassunto dei siti investigati attraverso prove SWM condotte dall’Associazione Geotecnica Italiana AGI.

31
LUGLIO - SETTEMBRE 2013
GEOTECHNICAL CHARACTERIZATION OF THE ATERNO VALLEY FOR THE SITE RESPONSE ANALYSES…
The shear wave velocity profiles, obtained consi-dering two different source positions in the active tests (forward and reverse shots), are compared in Figure 10 with the layering and the VS profiles from the Down-Hole (DH) and the seismic dilatometer (SDMT) tests carried out nearby. It can be noted that MASW, DH and SDMT test results are in very good agreement with each other; the surface wave test allows a deeper velocity profile to be retrieved, detecting a seismic be-drock with VS= 800 m/s at depth of 40-45 m.
The 1-D amplification function computed using the average VS profile resulting from the MASW test is plotted in Figure 11; the shaded area represents the frequency range with H/V spectral ratio of mi-crotremors higher than 2, as required by the SESA-
ME [2004] guidelines to identify a clear resonance
peak [MS-AQ WORKING GROUP, 2010]. The funda-mental frequency fMASW is about 3.1 Hz, close to the peak frequency of the experimental records, fHVSR = 2.8 Hz.
3.4.2. SITES WITH SHALLOW BEDROCK
The ‘shallow bedrock’ sites were investigated by a joint research team of Universities of Molise and
Fig. 9 – Roio Piano site: a) best-fitting profiles from Monte Carlo inversion; b) comparison of the Haskell-Thomson matrix
determinant with the experimental data.
Fig. 9 – Sito di Roio Piano: a) profili di Vs selezionati dalla inversione Monte Carlo; b) confronto del determinante della matrice di
Haskell-Thomson con la curva di dispersione sperimentale.
Fig. 8 – Active and passive data for Roio Piano site.
Fig. 8 – Curva di dispersione ottenuta con una prova passive ed
attiva eseguita presso il sito di Roio Piano.
Fig. 10 – Roio Piano site: comparison of shear wave velo-
city profiles obtained by MASW tests, Down-Hole tests and
SDMT tests.
Fig. 10 – Sito di Roio Piano: confronto tra i profili di velocità
delle onde di taglio da prova prove MASW, Down-Hole e SDMT.

RIVISTA ITALIANA DI GEOTECNICA
32 SANTUCCI DE MAGISTRIS ET AL.
Naples, operating with high-frequency active MASW acquisition setup. The source of surface waves was an electro-mechanical shaker controlled by a func-tion generator, producing a harmonic force in the frequency range of 5-120 Hz. The receivers are 14 piezo-electric 1-D accelerometers with a wide dynam-ic range (0.1-300 Hz), arranged in a linear array with a total length of 29 m. EVANGELISTA [2009] reports a detailed description of the test procedures and re-sults in the three selected locations.
At the Bazzano site, the geological survey re-ports a sandstone formation locally covered by allu-vial deposits [CAVUOTO and MOSCATELLI, 2009]. The MASW test was executed at the transition between the outcropping sandstone and the alluvial cover.
The experimental shear wave velocity profile identi-fies a stiff stratum at a depth of 8 m (Fig. 12). In this case, however, no borehole was available in the vici-nity to confirm this result.
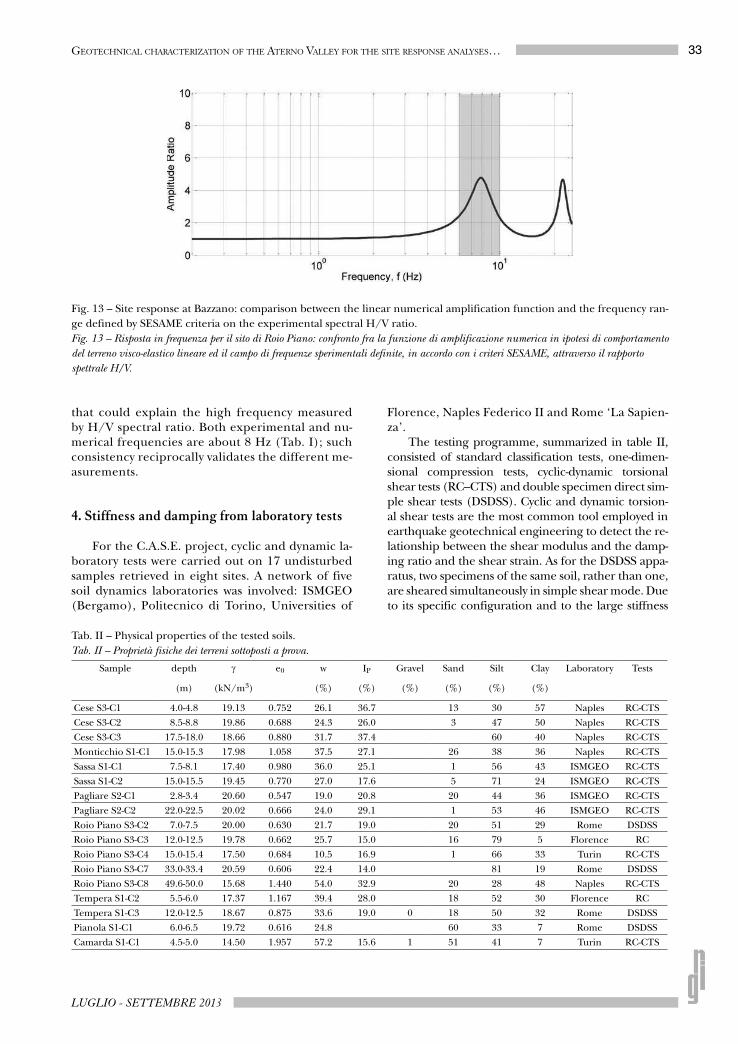
Figure 13 shows the amplification function of the subsoil model corresponding to the MASW profile. The range of frequencies with H/V spec-tral ratio higher than 2 recorded during after-shocks [MS-AQ WORKING GROUP, 2010] correspond exactly to that computed from the shear wave ve-locity profile, assuming the soil below 8 m from the ground level as a bedrock. This assumption was made considering the lack of deeper data and especially because of the large seismic impedan-ce ratio between the alluvium and the sandstone
Fig. 11 – Site Response at Roio Piano: comparison between the linear numerical amplification function and the frequency
range defined by SESAME criteria on the experimental spectral H/V ratio.
Fig. 11 – Risposta in frequenza per il sito di Roio Piano: confronto fra la funzione di amplificazione numerica in ipotesi di comportamento
del terreno visco-elastico lineare ed il campo di frequenze sperimentali definite, in accordo con i criteri SESAME, attraverso il rapporto
spettrale H/V.
Fig. 12 – Bazzano site: a) best-fitting profiles from Monte Carlo inversion, b) comparison of the Haskell-Thomson matrix de-
terminant with the experimental data.
Fig. 12 – Sito di Bazzano: a) profili di Vs selezionati dalla inversione Monte Carlo, b) confronto fra il determinante della matrice di
Haskell-Thomson e la curva di dispersione sperimentale.
33
LUGLIO - SETTEMBRE 2013
GEOTECHNICAL CHARACTERIZATION OF THE ATERNO VALLEY FOR THE SITE RESPONSE ANALYSES…
that could explain the high frequency measured by H/V spectral ratio. Both experimental and nu-merical frequencies are about 8 Hz (Tab. I); such consistency reciprocally validates the different me-asurements.
4. Stiffness and damping from laboratory tests
For the C.A.S.E. project, cyclic and dynamic la-boratory tests were carried out on 17 undisturbed samples retrieved in eight sites. A network of five soil dynamics laboratories was involved: ISMGEO (Bergamo), Politecnico di Torino, Universities of
Florence, Naples Federico II and Rome ‘La Sapien-za’.
The testing programme, summarized in table II, consisted of standard classification tests, one-dimen-sional compression tests, cyclic-dynamic torsional shear tests (RC–CTS) and double specimen direct sim-ple shear tests (DSDSS). Cyclic and dynamic torsion-al shear tests are the most common tool employed in earthquake geotechnical engineering to detect the re-lationship between the shear modulus and the damp-ing ratio and the shear strain. As for the DSDSS appa-ratus, two specimens of the same soil, rather than one, are sheared simultaneously in simple shear mode. Due to its specific configuration and to the large stiffness
Fig. 13 – Site response at Bazzano: comparison between the linear numerical amplification function and the frequency ran-
ge defined by SESAME criteria on the experimental spectral H/V ratio.
Fig. 13 – Risposta in frequenza per il sito di Roio Piano: confronto fra la funzione di amplificazione numerica in ipotesi di comportamento
del terreno visco-elastico lineare ed il campo di frequenze sperimentali definite, in accordo con i criteri SESAME, attraverso il rapporto
spettrale H/V.
Tab. II – Physical properties of the tested soils.
Tab. II – Proprietà fisiche dei terreni sottoposti a prova.
Sample depth e0 w IP Gravel Sand Silt Clay Laboratory Tests
(m) (kN/m3) (%) (%) (%) (%) (%) (%)
Cese S3-C1 4.0-4.8 19.13 0.752 26.1 36.7 13 30 57 Naples RC-CTS
Cese S3-C2 8.5-8.8 19.86 0.688 24.3 26.0 3 47 50 Naples RC-CTS
Cese S3-C3 17.5-18.0 18.66 0.880 31.7 37.4 60 40 Naples RC-CTS
Monticchio S1-C1 15.0-15.3 17.98 1.058 37.5 27.1 26 38 36 Naples RC-CTS
Sassa S1-C1 7.5-8.1 17.40 0.980 36.0 25.1 1 56 43 ISMGEO RC-CTS
Sassa S1-C2 15.0-15.5 19.45 0.770 27.0 17.6 5 71 24 ISMGEO RC-CTS
Pagliare S2-C1 2.8-3.4 20.60 0.547 19.0 20.8 20 44 36 ISMGEO RC-CTS
Pagliare S2-C2 22.0-22.5 20.02 0.666 24.0 29.1 1 53 46 ISMGEO RC-CTS
Roio Piano S3-C2 7.0-7.5 20.00 0.630 21.7 19.0 20 51 29 Rome DSDSS
Roio Piano S3-C3 12.0-12.5 19.78 0.662 25.7 15.0 16 79 5 Florence RC
Roio Piano S3-C4 15.0-15.4 17.50 0.684 10.5 16.9 1 66 33 Turin RC-CTS
Roio Piano S3-C7 33.0-33.4 20.59 0.606 22.4 14.0 81 19 Rome DSDSS
Roio Piano S3-C8 49.6-50.0 15.68 1.440 54.0 32.9 20 28 48 Naples RC-CTS
Tempera S1-C2 5.5-6.0 17.37 1.167 39.4 28.0 18 52 30 Florence RC
Tempera S1-C3 12.0-12.5 18.67 0.875 33.6 19.0 0 18 50 32 Rome DSDSS
Pianola S1-C1 6.0-6.5 19.72 0.616 24.8 60 33 7 Rome DSDSS
Camarda S1-C1 4.5-5.0 14.50 1.957 57.2 15.6 1 51 41 7 Turin RC-CTS
RIVISTA ITALIANA DI GEOTECNICA
34 SANTUCCI DE MAGISTRIS ET AL.
of the device components, all the problems associated with false deformations and system compliance were reduced to negligible levels, thus enabling the mea-surement of soil properties even at very small strains [DOROUDIAN and VUCETIC 1995; LANZO et al., 2009].
In the following, a summary of the experimental data is reported and some comparisons between the non-linear geotechnical properties evaluated with different techniques are shown.
4.1 Physical properties
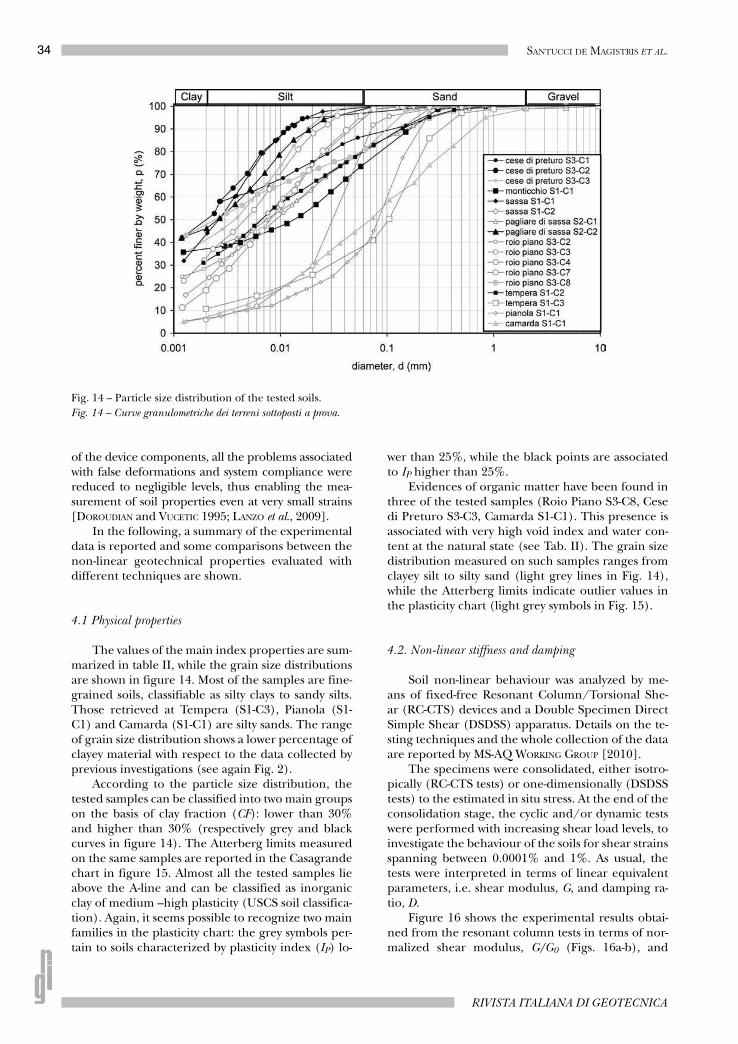
The values of the main index properties are sum-marized in table II, while the grain size distributions are shown in figure 14. Most of the samples are fine-grained soils, classifiable as silty clays to sandy silts. Those retrieved at Tempera (S1-C3), Pianola (S1-C1) and Camarda (S1-C1) are silty sands. The range of grain size distribution shows a lower percentage of clayey material with respect to the data collected by previous investigations (see again Fig. 2).
According to the particle size distribution, the tested samples can be classified into two main groups on the basis of clay fraction (CF): lower than 30% and higher than 30% (respectively grey and black curves in figure 14). The Atterberg limits measured on the same samples are reported in the Casagrande chart in figure 15. Almost all the tested samples lie above the A-line and can be classified as inorganic clay of medium –high plasticity (USCS soil classifica-tion). Again, it seems possible to recognize two main families in the plasticity chart: the grey symbols per-tain to soils characterized by plasticity index (IP) lo-
wer than 25%, while the black points are associated to IP higher than 25%.
Evidences of organic matter have been found in three of the tested samples (Roio Piano S3-C8, Cese di Preturo S3-C3, Camarda S1-C1). This presence is associated with very high void index and water con-tent at the natural state (see Tab. II). The grain size distribution measured on such samples ranges from clayey silt to silty sand (light grey lines in Fig. 14), while the Atterberg limits indicate outlier values in the plasticity chart (light grey symbols in Fig. 15).
4.2. Non-linear stiffness and damping
Soil non-linear behaviour was analyzed by me-ans of fixed-free Resonant Column/Torsional She-ar (RC-CTS) devices and a Double Specimen Direct Simple Shear (DSDSS) apparatus. Details on the te-sting techniques and the whole collection of the data are reported by MS-AQ WORKING GROUP [2010].
The specimens were consolidated, either isotro-pically (RC-CTS tests) or one-dimensionally (DSDSS tests) to the estimated in situ stress. At the end of the consolidation stage, the cyclic and/or dynamic tests were performed with increasing shear load levels, to investigate the behaviour of the soils for shear strains spanning between 0.0001% and 1%. As usual, the tests were interpreted in terms of linear equivalent parameters, i.e. shear modulus, G, and damping ra-tio, D.
Figure 16 shows the experimental results obtai-ned from the resonant column tests in terms of nor-malized shear modulus, G/G0 (Figs. 16a-b), and
Fig. 14 – Particle size distribution of the tested soils.
Fig. 14 – Curve granulometriche dei terreni sottoposti a prova.

35
LUGLIO - SETTEMBRE 2013
GEOTECHNICAL CHARACTERIZATION OF THE ATERNO VALLEY FOR THE SITE RESPONSE ANALYSES…
damping ratio, D (Figs. 16c-d), versus shear strain, .In the same figure cyclic torsional shear rather than resonant column tests are reported for Camada S1-C1 and Roio Piano S3-C4 specimens. The data are plotted with the same symbols and color code used for the grain size distribution curves and for the pla-sticity chart. In the same plots, the curves suggested by DARENDELI [2001] for soils with plasticity indexes equal to 15%, 30% and 100% are reported for com-parison. The curves proposed by Darendeli for mean effective confining pressure ’0 equal to 100 and 400 kPa were used for soils tested in the range 75-150 kPa and 200-500 kPa, respectively.
The comparison among the different groups of samples consistently reflected their differences in physical properties, confirming that clay fraction and plasticity index are key parameters to represent soil non-linearity. In fact, the grey curves, relevant to silty - low plasticity soils, define a range of line-ar behaviour not exceeding a threshold strain level of the order of 0.005%, beyond which the decay of stiffness (Figs. 16a-c) and the increase of damping (Figs. 16b-d) are quite pronounced. On the other hand, the black curves (clayey – high plasticity soils) are characterized by higher values of the linear th-reshold (of the order of 0.01%), showing a less evi-dent reduction of stiffness (Figs. 16a-c) and lower damping values (Figs. 16b-d) in the non-linear ran-ge. Note that the overall trends of the two groups of samples do not exactly overlap the average lite-rature curves pertaining to low (IP=15%) and me-dium (IP=30%) plasticity soils for ’0= 100 kPa (Figs. 16a-b). In particular the curves of the tested soils are shifted rightward with respect to literature ones, i.e. the soils show a more linear and less dissipative be-havior. On the contrary, the curves for ’0= 400 kPa (Figs. 16c-d) better approximate the experimen-
tal behavior of soils characterized by similar plasti-city characteristics. An exception is constituted by the peculiar behaviour shown by the organic sam-ples for which the influence of fabric cannot be cap-tured by the ‘standard’ literature curves [PAGLIARO-
LI et al., 2013]. For instance, the finest organic sam-ple, taken at Roio Piano site in Figs. 16c-d (S3-C8, CF=48%, wL=90%, IP=33%) shows a non-linear be-haviour comparable to that described by the stan-dard literature curves relevant to highly plastic soils (IP=100%), rather than those relevant to medium plasticity (IP=30%). Moreover, the large initial dam-ping ratio exhibited by the Pagliare di Sassa S2-C1 specimen could be due to the relatively low confi-ning stress employed in executing the test.
The non-linear behaviour of stiffness and dam-ping obtained by DSDSS tests on four silty -low pla-sticity samples is summarized in figure 17. As shown for RC tests, the cyclic behavior is not satisfactorily captured by Darendeli curves at ’0= 100 kPa being experimental data shifted toward right both in terms of normalized stiffness modulus and damping ratio (Figs. 17a-b). At ’0= 400 kPa, the results of the soil sample taken Tempera site in Figs. 17(c-d) (S1-C3, CF=32%, wL=37%, IP=19%) shows a cyclic behavior well reproduced by Darendeli curves relevant to hi-ghly plastic soils (IP=100%). This could be ascribed to the presence of relevant organic matter content.
The samples subjected to DSDSS tests show li-near threshold strains lower than 0.005% and more gradual variations of the equivalent parameters with
if compared to those measured by RC tests on soils of comparable plasticity and grain size. This eviden-ce could be attributed to the effects of loading ra-te and the number of cycles, being the DSDSS fre-quency (about 0.3 Hz) and number of cycles much lower than those relevant to RC tests.
This hypothesis is further confirmed by the plots in figure 18, which compare the stiffness and dam-ping measured on a single specimen of the clayey – high plasticity group, during the RC test and se-ries of CTS tests driven at variable frequency (0.5, 1, 2 Hz). The non-linear stiffness and damping cur-ves (Fig. 18a) approximately identify the same line-ar strain range, but the decay of the shear modulus in the RC test is sharper than that defined by all CTS tests; this could be probably due to material degra-dation associated to the higher number of cycles in the RC test.
The influence of frequency on the small-strain stiffness (G0) and damping (D0) is demonstrated in figure 18b, where the values of G0 and D0 measuredduring CTS and RC tests are plotted against the loga-rithm of the frequency. The shear modulus shows a continuous 10% increase for log cycle of frequency, while the initial damping is characterized by a low rate-dependency below 1 Hz and by a sharper incre-ment for higher frequencies. This rate-dependent
Fig. 15 – Plasticity chart of the tested soils.
Fig. 15 – Carta di plasticità dei terreni sottoposti a prova.

RIVISTA ITALIANA DI GEOTECNICA
36 SANTUCCI DE MAGISTRIS ET AL.
behaviour was frequently observed in literature on medium to high plasticity silts and clays (e.g., SHIBUYA
et al., 1995; D’ONOFRIO et al., 1999) and should be pro-perly taken into account for site response analyses. As a matter of fact, considering that the expected do-minant frequency of the reference input signals ge-nerally falls below 10 Hz, the choice of RC test results might lead to errors in computing the amplification function at a given site.
The availability of both field and laboratory tests in the C.A.S.E. sites made also possible some calibration of empirical estimates of non-linear parameters from SDMT. A ‘working strain shear modulus’, GDMT, was
derived from the constrained modulus, MDMT, obtai-ned from the usual DMT interpretation. It is assumed that MDMT is a reasonable ‘working strain’ modulus (i.e. the modulus that, introduced into the linear elastici-ty formulae, provides realistic estimates of the settle-ment of a shallow foundation under working load). This assumption is supported by the good agreement observed in a large number of well documented com-parisons between measured and DMT-predicted set-tlements or moduli [MARCHETTI et al., 2008]. As a first approximation, by referring to linear elasticity:
The ‘working strain modulus’ was evaluated with the above procedure from SDMT carried out at Ro-

37
LUGLIO - SETTEMBRE 2013
GEOTECHNICAL CHARACTERIZATION OF THE ATERNO VALLEY FOR THE SITE RESPONSE ANALYSES…
io Piano, Cese di Preturo and Pianola, and compa-red with the data obtained from laboratory tests. Table III reports the measured values of shear wa-ve velocity (hence, the field evaluation of G0) and constrained modulus at the depth of the samples te-sted in the laboratory. A Poisson’s ratio equal to 0.2 was used to calculate the working strain shear modu-lus, given by GDMT = 0.375 MDMT as resulting from Eq. (1). The values of the ‘normalized working strain
shear modulus’ GDMT /G0, also reported in table III, fall in the range ≈ 0.1 to 0.4 (0.10 to 0.23 in silt and clay, 0.37 in silty sand).
In figure 19 each GDMT /G0 data point (grey symbols) is superimposed on the corresponding sa-me-depth laboratory G/G0 curve. The range of values of the shear strain DMT inferred from the “intersec-tion” of the GDMT /G0 data points with the laboratory curves (rectangular areas in Fig. 19), also reported in
Fig. 16 – Normalised shear modulus (a-c) and damping ratio (b-d) versus shear strain from RC or CTS tests compared with
literature curves by DARENDELI [2001] for ’0 = 100 kPa (a-b) and 400 kPa (c-d).
Fig. 16 – Modulo di taglio normalizzato (a-b) e rapporto di smorzamento (c-d) in funzione della deformazione tangenziale da prove
RC o da prove CTS confrontate con le curve proposte da DARENDELI [2001] per le pressioni di confinamento di 100 kPa (a-b) e
400 kPa (c-d).

RIVISTA ITALIANA DI GEOTECNICA
38 SANTUCCI DE MAGISTRIS ET AL.
table III, range between ≈ 0.1 and 0.5 % ( DMT = 0.24 to 0.48% in silt and clay, DMT = 0.16 % in silty sand).
This result is in agreement with the indications by ISHIHARA [2001], who classified SDMT test among the medium strain measurement methods, i.e. provi-ding estimates of the soil deformation parameters at a strain level ranging between 0.01 and 1%, as well as with “typical ranges” of shear strain associated to working strain moduli GDMT in various soil types de-tected by AMOROSO et al. [2012].
In order to explore how the choice of the Pois-son’s ratio affects the result, the above procedure was repeated assuming = 0.3. In this case the 'norma-
lized working strain shear modulus' (GDMT/G0) was found in the range 0.07-0.28 and the corresponding shear strain DMT was found between ≈ 0.2 and 0.7 %. This result indicates that the range of DMT is not si-gnificantly affected by the assumed Poisson’s ratio.
5. Conclusions
An experimental geotechnical campaign was performed, by in-situ and laboratory tests, along the Aterno valley in the aftermath of the April 6th, 2009 L’Aquila earthquake.

39
LUGLIO - SETTEMBRE 2013
GEOTECHNICAL CHARACTERIZATION OF THE ATERNO VALLEY FOR THE SITE RESPONSE ANALYSES…
This investigation allowed defining subsoil mo-dels for seismic response analyses, for the location of temporary housing and for urban re-planning.
In this paper, some of the obtained data are pre-sented and scrutinized in an attempt to give a pictu-re of the main soil properties relevant for ground re-sponse analysis and seismic microzonation. Particu-lar attention was devoted to collecting and interpre-ting in-situ and laboratory tests near the epicentral area that was in the L’Aquila basin in the northern
part of the Aterno river valley. Therefore, even quite complete, the investigation campaign does not en-compass all the data that would be necessary for an advanced site response analysis of the whole Aterno valley.
In the analyzed area, the heterogeneity of the flu-vio-lacustrine soils was already well known, before the earthquake, from previous investigations data. The new results permitted to improve significantly the static and dynamic characterization of the soils in the area.
Fig. 17 – Normalised shear modulus (a-b) and damping ratio (c-d) vs. shear strain from DSDSS tests compared with literature
curves by DARENDELI [2001] for ’0 = 100 kPa (a-b) and 400 kPa (c-d).
Fig. 17 – Modulo di taglio normalizzato (a-b) e rapporto di smorzamento (c-d) in funzione della deformazione tangenziale da prove
DSDSS confrontate con le curve proposte da DARENDELI [2001] per le pressioni di confinamento di 100 kPa (a-b) e 400 kPa (c-d).

RIVISTA ITALIANA DI GEOTECNICA
40 SANTUCCI DE MAGISTRIS ET AL.
The post-earthquake investigations included measurements of the shear wave velocity VS by diffe-rent in situ testing techniques, i.e. Down-Hole tests (DH), surface wave tests (MASW) and seismic dilato-meter tests (SDMT). Comparisons at various test sites, illustrated in the paper, indicate that MASW, DH and SDMT results are in very good agreement, with surfa-ce wave tests often allowing defining a deeper shear wave velocity profile. In lack of boreholes, MASW tests proved to be effective to assess the frequency response
of the subsoil, recorded instrumentally by HVSR me-thod.
Undisturbed samples from various sites were subjected to cyclic and dynamic tests carried out by a network of research laboratories in Italy. The cyclic/dynamic shear tests – Resonant Column/Torsional Shear tests and Double Sample Direct Simple Shear tests were aimed at characterizing the non-linear and dissipative behaviour (stiffness and damping) of medium- to fine grained soils. The
Fig. 18 – RC and CTS tests on undisturbed sample retrieved at Cese di Preturo: a) normalised shear modulus and damping
ratio, b) initial shear modulus and damping versus frequency.
Fig. 18 – Prove RC e CTS su campioni indisturbati prelevati a Cese di Preturo: a) modulo di taglio normalizzato e rapporto si
smorzamento, b) modulo di taglio iniziale e smorzamento al variare della frequenza.

41
LUGLIO - SETTEMBRE 2013
GEOTECHNICAL CHARACTERIZATION OF THE ATERNO VALLEY FOR THE SITE RESPONSE ANALYSES…
curves of the normalized shear modulus G/G0 and damping ratio D versus shear strain obtained for the tested fine-grained materials, synthetically de-scribed in the paper, consistently reflect their diffe-rent grain size distribution and plasticity. Referen-ce literature curves do not overlap the non-linear overall trend of the experimental curves, in some cases highlighting the peculiar nature of the soils of the Aterno valley. The combined use of laborato-ry and SDMT tests to date appears promising to ca-librate simplified procedures to estimate soil non-linear behaviour.
Acknowledgments
The investigations were carried out on behalf of the Italian Civil Protection Department, under the supervision of Dr. Giuseppe Naso. The President of
the Italian Geotechnical Society (AGI), Prof. Stefa-no Aversa, and all the participants to the AGI wor-king group are warmly acknowledged for their con-tributions.
References
AMOROSO S., MONACO P., MARCHETTI D. (2012) – Use of
the seismic dilatometer (SDMT) to estimate in situ G- de-
cay curves in various soil types. Proc.4th Int. Conf. on Geotechnical and Geophysical Site Characteriza-tion – ISC’4, Porto de Galinhas, Pernambuco, Bra-zil, September 18-21, vol. I, pp. 489-497. R. Coutin-ho and P.W. Mayne (Eds.). Taylor & Francis Group, London.
APAT (2006) – Geological map of Italy at the scale
1:50,000. Sheet n. 359, L’Aquila. S.EL.CA. Firenze (in Italian).
Fig. 19 – Comparison between laboratory measurements and in situ estimates of non-linear stiffness.
Fig. 19 – Confronto fra le stime di rigidezza non lineare da misure di laboratorio e sito.
Test site Sample Vs G0 MDMT GDMT/G0
(m/s) (MPa) (MPa) (%)
Cese di Preturo C1 4.0-4.8 m 261 133 67 0.20 0.19 0.24
Cese di Preturo C3 17.5-18.0 m 274 149 39 0.20 0.10 0.48
Pianola C1 6.0-6.5 m 303 195 193 0.20 0.37 0.16
Roio Piano C2 7.0-7.5 m 233 105 64 0.20 0.23 0.46
Tab. III – Values of GDMT/G0 obtained from SDMT and corresponding shear strain determined from the intersection with
the laboratory curves at each test site.
Tab. III – Valori di GDMT/G0 ottenuti da prove SDMT e corrispondenti alle deformazioni a taglio determinate con l’intersezione delle
curve di laboratorio per ciascun sito investigato.

RIVISTA ITALIANA DI GEOTECNICA
42 SANTUCCI DE MAGISTRIS ET AL.
BOIERO D., FOTI S., MARASCHINI M., COMINA C.,
D’ONOFRIO A., EVANGELISTA L., LANDOLFI L., SILVESTRI
F., SANTUCCI DE MAGISTRIS F.(2009) – Valutazione del-
la risposta dinamica di alcuni siti della conca aquilana
con prove basate sulla propagazione di onde superficiali.
In: “IARG 2009”, University of Rome ‘La Sapienza’ (in Italian).
BERTINI T., BOSI C., GALADINI F. (1989) – La conca di Fos-
sa S. Demetrio dei Vestini. In: CNR, Centro di Studio per la Geologia Tecnica, ENEA, P.A.S.: “Elementi di tettonica pliocenico-quaternaria ed indizi di sismic-ità olocenica nell’Appennino laziale-abruzzese”. Società Geologica Italiana, pp. 26-58 (in Italian).
BERTINI T., TOTANI G., CUGUSI F., FARRONI A. (1992) – Caratterizzazione geologica e geotecnica dei sedimenti
quaternari del settore occidentale della conca aquilana.
University of L’Aquila, Department of Structural, Water and Soil Engineering, Publ. 92/7, 27 pp. (in Italian).
BOSI C., BERTINI T. (1970) – Geologia della Media Valle
dell’Aterno. Memorie della Società Geologica Italia-na, IX, pp. 719-777 (in Italian).
CAVUOTO G., MOSCATELLI M. (2009) – Rilevamento geo-
logico preliminare del sito Bazzano. CNR-IGAG, Roma (in Italian).
DARENDELI, M. B. (2001) – Development of a New Family
of Normalized Modulus Reduction and Material Damp-
ing Curves. Ph.D. Dissertation, The University of Texas at Austin, 362 pp.
D’ONOFRIO A., EVANGELISTA L., LANDOLFI L., SILVESTRI F.,
BOIERO D., FOTI S., MARASCHINI M., COMINA C, SANTUC-
CI DE MAGISTRIS F. (2010). – Geotechnical characteriza-
tion of the C.A.S.E. project sites. Proc. “Sustainable De-velopment Strategies for Constructions in Europe and China”, Roma, 19-20 April, 2010.
D’ONOFRIO A., SILVESTRI F., VINALE F. (1999) – Strain
rate dependent behaviour of a natural stiff clay. Soils and Foundations, 39, n. 2, pp. 69-82.
DOROUDIAN, M., VUCETIC, M. (1995) – A Direct Simple
Shear Device for Measuring Small-Strain Behavior. Geo-technical Testing Journal, 18, n. 1, pp. 69-85.
EVANGELISTA L. (2009) – A critical review of the MASW tech-
nique for site investigation in geotechnical engineering. PhD Thesis, University of Naples Federico II, Italy.
EVANGELISTA L., D’ONOFRIO A., SANTUCCI DE MAGISTRIS F.,
SILVESTRI F. (2011) – Site response analyses for emergen-
cy buildings after the 2009 L’Aquila earthquake. Proc.5th International Conference on “Earthquake Geo-technical Engineering”, January 2011, 13-13. San-tiago, Chile.
FOTI S. (2005) – Surface wave testing for geotechnical
characterization. In: “Surface Waves in Geomechan-ics: Direct and Inverse Modelling for Soils and Rocks”, CISM Series, n. 481, Lai C.G. and Wilman-ski K. (Eds.), Springer, Wien, pp. 47-71.
FOTI S., COMINA C., BOIERO D., SOCCO L.V. (2009) – Non uniqueness in surface wave inversion and conse-
quences on seismic site response analyses. Soil Dynamics
and Earthquake Engineering, 29, n. 6, pp. 982-993.HASKELL N.A. (1953) –The dispersion of surface waves on
multilayered media. Bulletin of the Seismological So-ciety of America, vol. XLIII, n. 1, pp. 17-34.
ISHIHARA K. (2001) – Estimate of relative density from in-
situ penetration tests. In: Proc. Int. Conf. on “In Si-tu Measurement of Soil Properties and Case Histo-ries”, Bali, pp. 17-26.
LANZO G., PAGLIAROLI A., TOMMASI P., CHIOCCI F. L.
(2009) – Simple shear testing of very soft offshore clay for
wide strain range. Canadian Geotechnical Journal, 46, n. 11, pp. 1277-1288.
LANZO G., DI CAPUA G., KAYEN R.E., SCOTT KIEFFER D.,
BUTTON E., BISCONTIN G., SCASSERRA G., TOMMASI P.,
PAGLIAROLI A., SILVESTRI F., D’ONOFRIO A., VIOLANTE
C., SIMONELLI A.L., PUGLIA R., MYLONAKIS G., ATHA-
NASOPOULOS G., VLAHAKIS V., STEWART J.P. (2010) –
Seismological and geotechnical aspects of the Mw=6.3
L’Aquila earthquake in central Italy on 6 April 2009.
International Journal of Geoengineering Case Histories, vol. I, n. 4, pp. 206-339. http://case-histories.geoengineer.org/volume/volume1/is-sue4/IJGCH_1_4_1.pdf Date accessed 15 Oct 2012.
MARASCHINI M., ERNST F., FOTI S., SOCCO L.V. (2010) – A new misfit function for multimodal inversion of surface
waves. Geophysics, 75, n. 4, pp. 31-43.MARASCHINI M., FOTI S. (2010) –A Monte Carlo multi-
modal inversion of surface waves. Geophysical Journal International. 182, n. 3, pp. 1557-1566.
MARCHETTI S., MONACO P., TOTANI G., MARCHETTI D.
(2008) – In Situ Tests by Seismic Dilatometer (SDMT).In: “From Research to Practice in Geotechnical En-gineering”, ASCE Geotech. Spec. Publ. n. 180 Hon-ouring John H. Schmertmann, pp. 292-311.
MONACO P., MARCHETTI S., TOTANI G., MARCHETTI D.
(2009) – Interrelationship between small strain modu-
lus G0 and operative modulus. In: Kokusho, Tsukamo-to and Yoshimine (Eds.), Proc. International Con-ference on “Performance-Based Design in Earth-quake Geotechnical Engineering” (IS-Tokyo 2009), Tsukuba, Japan, June 15-17, pp. 1315-1323. Taylor & Francis Group, London.
MONACO P., TOTANI G., BARLA G., CAVALLARO A., COSTAN-
ZO A., D’ONOFRIO A., EVANGELISTA L., FOTI S., GRAS-
SO S., LANZO G., MADIAI C., MARASCHINI M., MARCHET-
TI S., MAUGERI M., PAGLIAROLI A., PALLARA O., PENNA
A., SACCENTI A., SANTUCCI DE MAGISTRIS F., SCASSERRA
G., SILVESTRI F., SIMONELLI A.L., SIMONI G., TOMMASI P.,
VANNUCCHI G., VERRUCCI L. (2012) – Geotechnical as-
pects of the L’Aquila earthquake. In: M.A. Sakr, A. Ansal (Eds.), “Special Topics in Earthquake Geotechnical Engineering”, vol. XVI, Chp. 1, pp. 1-66, Springer.
MS-AQ WORKING GROUP (2010) – Microzonazione sis-
mica per la ricostruzione dell’area aquilana. RegioneAbruzzo – Dipartimento della Protezione Civile, L’Aquila, 3 voll. e CD-Rom (in Italian). http://www.protezionecivile.gov.it/jcms/it/microzonazi-

43
LUGLIO - SETTEMBRE 2013
GEOTECHNICAL CHARACTERIZATION OF THE ATERNO VALLEY FOR THE SITE RESPONSE ANALYSES…
one_aquilano.wp Date accessed 15 Oct 2012.PAGLIAROLI A, LANZO G, TOMMASI P, DI FIORE V (2013)
– Dynamic characterization of soils and soft rocks of the
Central Archaeological Area of Rome. Bulletin of Earth-quake Engineering, DOI: 10.1007/s10518-013-9452-5.
SESAME European research project. WP12–Deliver-able D23.12. Internet: http://sesame-fp5.obs.ujf-grenoble.fr/index.htm. Date accessed 5 Oct 2012.
SHIBUYA S., MITACHI T., FUKUDA F., DEGOSHI T. (1995)–Strain rate effects on shear modulus and damping of nor-
mally consolidated clay. ASTM Geot.Test. Journ. 18, n. 3, pp. 365-375.
SOCCO L.V., STROBBIA C. (2004) – Surface wave methods
for near-surface characterisation: a tutorial. Near Sur-face Geophysics, 2, n. 4, pp. 165-185.
TALLINI M., DE CATERINI G., DI EUSEBIO F., DI NISIO C.,
MANETTA M., MENIS M., ZAFFIRO P. (2009) – Studio
geologico finalizzato alla redazione della carta delle Mi-
crozone omogenee in prospettiva sismica di aree destinate
all’urbanizzazione – Zona Roio Piano. University of L’Aquila (in Italian).
THOMSON W.T. (1950) – Transmission of elastic waves
through a stratified solid medium. J. Applied Physics, vol. XXI, n. 1, pp. 89-93.
TOTANI G., MONACO P., MARCHETTI S., MARCHETTI D.
(2009) – Vs measurements by Seismic Dilatometer (SD-
MT) in non penetrable soils. In: Proc. XVII Interna-tional Conference on “Soil Mechanics and Geo-technical Engineering”, Alexandria, Egypt, 5-9 October 2009, vol. II, pp. 977-980.
UNIVERSITÀ DELL’AQUILA (2009)– L’Aquila Earthquake
SDMT Volume: Risultati di prove dilatometriche (DMT)
e dilatometriche sismiche (SDMT) per la caratterizzazione
geotecnica di alcuni siti dell’Aquilano. Technical Re-port, University of L’Aquila (in Italian).
ZYWICKI D.J. (1999) – Advanced Signal Processing Methods
Applied to Engineering Analysis of Seismic Surface Waves.
Ph.D. Thesis, Georgia Institute of Technology.
Caratterizzazione geotecnica della valle
dell’Aterno per analisi di risposta sismica
locale
Sommario
L’articolo riassume i risultati di alcune prove in sito e di
laboratorio, eseguite subito dopo il terremoto dell’Aquila del 6 aprile
2009, che hanno contribuito alla definizione di modelli geotecnici
per analisi di risposta sismica locale nella valle dell’Aterno. Le
attività di indagine sono state affidate dal Dipartimento della
Protezione Civile a varie istituzioni pubbliche e private; le attività
riportate in questo lavoro sono state coordinate dall’Associazione
Geotecnica Italiana.
L’articolo, dopo un breve inquadramento geologico della
conca dell’Aquila e della valle del fiume Aterno, riporta una
panoramica delle condizioni di sottosuolo nell’area, ricavate
da prove geotecniche eseguite prima del terremoto del 2009. In
seguito, si descrivono le specifiche indagini programmate per la
caratterizzazione dei siti da ricostruire e per la microzonazione
sismica. Le prove in sito hanno comportato indagini con il
dilatometro sismico e l’analisi multistazione delle onde superficiali;
i relativi profili della velocità delle onde di taglio sono stati messi a
confronto tra loro e validati attraverso risultati di prove Down-Hole
e di misure di microtremori. Le indagini di laboratorio includono
prove cicliche/dinamiche di taglio semplice/torsionale eseguite
su campioni indisturbati. I risultati, sintetizzati in termini di
variazione di rigidezza e smorzamento con la deformazione a
taglio, evidenziano alcune proprietà peculiari dei terreni della
valle dell’Aterno, che possono essere messe in relazione con le loro
proprietà indice.