Embed Size (px)
Citation preview

Geotechnical Challenges along the Test Section of the Sea-to-Sky Highway
Brian L.J. Mylleville, Ph.D., P.Eng. & Paul Schlotfeldt, Ph.D., P.Eng.

Outline
� Introduction� Site Characterization � Stability of Existing Rock Fill Slopes� Design Considerations� Reliability Analysis� Seismic Deformation Analysis� Construction of MSE Walls� Structures on Rock� Geological Models, Foundation Design, and
Anchors for Structures on Rock � Conclusions� Acknowledgements

Introduction
� Sea-to-Sky Highway follows the east side of Howe Sound linking the cities of Vancouver, Squamish, and Whistler, BC
� Formerly a two-lane undivided highway along the majority of the alignment
� Highway has undergone major upgrades in preparation for the 2010 Winter Olympics and Paralympic Games
� Structures are required to cross creeks and drainage courses, be founded on existing rock fill slopes, and span over steep – often unstable - rock outcrops, in order to support the outside edge of the southbound highway lanes.
� The focus of this presentation will be: 1) MSE walls on rock fill slopes; and, 2) structures founded on bedrock designed and constructed specifically for the “Test Section”
Howe Sound
Sea to Sky Hwy
Introduction
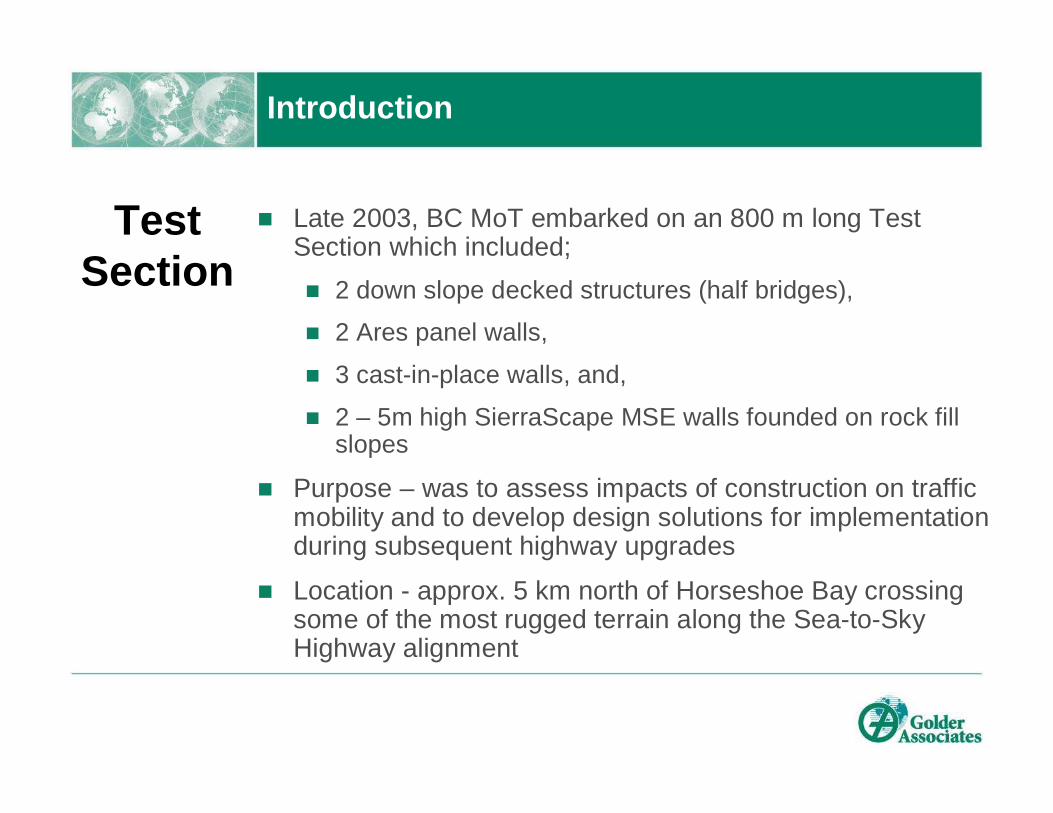
� Late 2003, BC MoT embarked on an 800 m long Test Section which included;
� 2 down slope decked structures (half bridges),
� 2 Ares panel walls,
� 3 cast-in-place walls, and,
� 2 – 5m high SierraScape MSE walls founded on rock fill slopes
� Purpose – was to assess impacts of construction on traffic mobility and to develop design solutions for implementation during subsequent highway upgrades
� Location - approx. 5 km north of Horseshoe Bay crossing some of the most rugged terrain along the Sea-to-Sky Highway alignment
Test Section

Project Location
Test Section Location
Vancouver

Site Characterization
� Very steep terrain above and below the highway
� Often limited space between highway and CN rail
� Steep to near vertical – often marginally stable – rock fill slopes below the old highway
� Rock fill slopes extend below the western edge of the existing highway down to the CN Rail tracks along extensive sections of highway
� Existing rock fill slopes were likely developed by random end-dumping techniques and hence in a loose to compact state
� Steep, often unstable, rock slopes with limited space between highway and CN Rail tracks

Stability of Existing Rock Fill Slopes
� Rock fill particle sizes - 100 mm to 1.1 m
� Rock fill - granitic or dioritic in composition
� Statistical analysis of data from clinometer measurements and review of topographic survey data indicated a mean angle of repose of about 38º (σ = 1.6º, cov = 4%)
� No significant roadway distress observed or had been reported, hence assume FS>1 (but unlikely greater than 1.1)
� From back-analysis, assume Ømean = 41º and based on engineering judgment, σ = 4.5º
� Unit Weight, γ = 17 kN/m3

Design Considerations- MSE WallsGeometry
� Existing down slope area along the southern most 200 m of the test section consisted of rock fill
� Results of site investigation indicated rock fill depth in excess of 10 m; not practical or feasible to remove
� Slope geometry of 1.2H:1V due to proximity of CN Rail
� Rock fill slope height between 10 and 12 m.
� 5 m high MSE wall constructed on rock fill slope enhanced with 4 m wide high-strength engineered rock fill buttress

Design Considerations- MSE Walls
Design Detail of MSE Wall on Improved Rock Fill Slope
CN Rail Tracks
Highway

� Rock Fill / Soil Parameters
Material TypeAngle of
Friction, Ø(degrees)
Apparent Cohesion, c
(kPa)
Unit Weight, γ(kN/m3)
Rock fill(Engineered)
46.8 (3.8) n.a. 17.8 (2.05)
Colluvium(Type 1)
36 (2) 5 (2) 16 (1.5)
Colluvium (Type 2)
25 (2) 10 (1.5) 17 (1)
Notes:1. All values are mean values2. Values in parentheses represent standard deviation values
� Groundwater – allow saturated colluvium layer� External Loading:
� MSE wall� Seismic Loading, 0.2g (from GSC analysis)� Traffic Loading, AASHTO H20
Design Considerations- MSE Walls

Reliability Analysis –MSE Walls
� Detailed stability analyses indicated that the BC MoT design criteria of FS (static) of 1.5 and FS (seismic) of 1.1 could not be achieved for the proposed design geometry (i.e. 5 m high MSE wall constructed on top of 1.2H:1V rock fill slope)
� Reliability Analyses were carried out to assess the level of risk of slope failure using the following steps:� Identify possible slope failure scenarios;� Assign material properties, groundwater conditions and
external loading; and,� Calculate probability of failure for the possible failure
scenarios.
� Probabilistic stability analyses were carried out using the computer program SLOPE/W™(v5.1)

Reliability Analysis- MSE Walls
Slope Stability Model (Site-Specific)

Reliability Analysis-MSE Walls
Event Tree for Probability of Slope Failure

Reliability Analysis –MSE WallsResults
� Static Conditions� FSmean ~ 1.3 with a probability of failure < 0.2%
(annual probability of failure of about 3.83×10⁻⁵, expected above average performance1)
� Seismic Conditions� FSmean ~ 0.93 with a probability of failure ~ 87%
(annual probability of failure of about 1.82×10⁻³, expected average performance1)
� For the site-specific analyses, carried out for a rock fill depth of at least 10 m, the calculated FS was not influenced by the underlying weaker layer.
� In areas where rock fill depths along the existing slopes are shallower, the FS is expected to be lower and the probability offailure to be higher.
Note: 1. based on US Army Corps of Engineers reliability index chart

Seismic Deformation Analysis-MSE Walls
� Results of pseudo-static analysis indicated a high probability that the proposed MSE wall founded on an engineered rock fill slope when subjected to design earthquake shaking will have a FS<1
� Detailed dynamic analysis carried out to evaluate the likely deformations using finite difference code FLAC2D
� UBCSAND stress-strain model was used to model non-linear and in-elastic behaviour of rock fill and underlying colluvium layer
� The geometric domain of the slope was discretized into 1,080 zones including bedrock, colluvium, existing rock fill, engineered rock fill, a 5 m high MSE Wall and an anchored reinforced concrete retaining wall supporting the split grade.

Seismic Deformation Analysis-MSE Walls
Flac2D Finite Difference Model
Seismic Deformation Analysis-MSE Walls
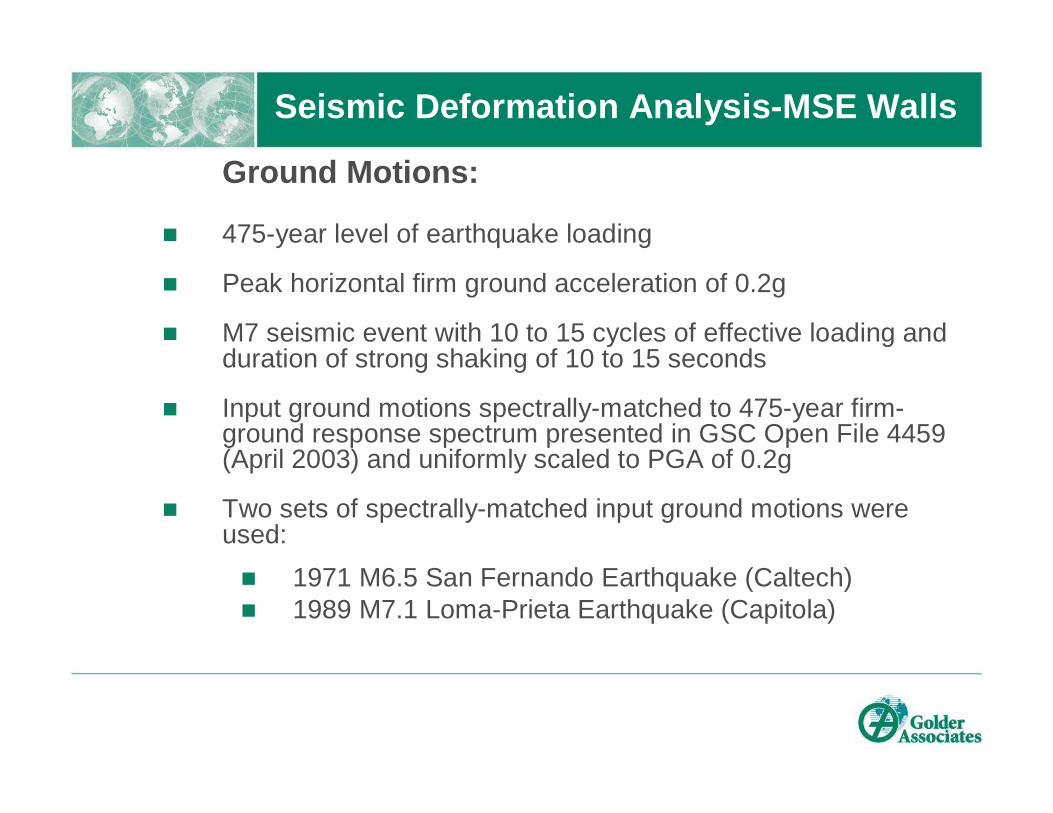
Ground Motions:
� 475-year level of earthquake loading
� Peak horizontal firm ground acceleration of 0.2g
� M7 seismic event with 10 to 15 cycles of effective loading and duration of strong shaking of 10 to 15 seconds
� Input ground motions spectrally-matched to 475-year firm-ground response spectrum presented in GSC Open File 4459 (April 2003) and uniformly scaled to PGA of 0.2g
� Two sets of spectrally-matched input ground motions were used:
� 1971 M6.5 San Fernando Earthquake (Caltech)� 1989 M7.1 Loma-Prieta Earthquake (Capitola)

Seismic Deformation Analysis-MSE Walls
Predicted Deformations:
� Peak transient lateral deformations of the southbound lanes are likely to vary from about 150 mm to 370 mm with the largest deformations predicted to occur behind the MSE wall
� Computed maximum vertical deformations range between about 60 mm and 100 mm.
� Magnitude of predicted deformations resulting from the design seismic event were acceptable to BC MoT in terms of maintaining some functionality of the highway following earthquake shaking
On-Ramp to Hwy 101, Universal City, LA (1994 Northridge Earthquake)

� Site preparation included removal of trees, vegetation, surficial organics and other deleterious materials; rock fill and other suitable granular fill was re-used
� Rock fill used to extend (buttress) the existing slope (highway embankment) was placed in carefully controlled lifts and benched into the existing rock fill slope
� Compaction was achieved by trafficking with heavy construction equipment
� Following completion of the rock fill slope buttress, the proprietary MSE wall was constructed
Construction-MSE Walls

Structures on Rock: OverviewIntroduction
� 1/3 of Test Section length had structures founded on rock that had potential foundation instability issues
� Structures on rock required geotechnical input and design work during construction – not envisaged
� Total length of steel used to stabilize foundations –1238m (excludes shear dowels)
� A factor of approx. 5.4 times the total length of major structures founded on rock
� Unforeseen conditions – conventional contract would have likely resulted in claims

�Two Down Slope Decked Structures –Half Bridges (90 m)
�Two Ares Panel Walls (133 m)
�Cast- in- Place Wall #3 (7 m)
Structures Founded on Rock
Structures founded on rock that required significant foundation treatment and anchorage included:

Design Evolution; South Section
Final Design
Prelim Design

Design Evolution; Mid-SectionFinal Design
Prelim Design

� Rock types; diorite to granodiorite – Coastal Intensives
� Extensive weathering on joints and small-scale fault zones
� Intact rock – slightly weathered with UCS range 25 MPa – 100MPa
� Joints – completely to moderately weathered with UCS range 0.25MPa – 5MPa
� Joint spacing and thickness of gouge highly variable –1m to 3m spaced with 3cm to 10 cm weathered gouge
� Faults - completely to moderately weathered gouge, 0.1MPa to 5MPa, 10 cm to 1000 cm gouge
� Major joint sets – stress relief joints and tectonic joint sets
Rock Mass Characterization

Rock Foundations; Geological Models
� Geological assessment for each pier or footing (included slope profile, joints / faults, rock mass conditions)
� Jointed Rock Mass – key blocks or wedges present below structures –controlled stability of foundations
� Geological model generated for individual piers and strip footings (interactive process to optimize design)
� Typically; Tectonic sets – back release and side release surfaces
� Typically; Stress relief set – primary sliding surfaces (50 to 62 degrees out of face)

Rock Foundations Geological Models
Geological models used to;
� Develop alternative design solutions where preliminary design did not work – unforeseen conditions
� Assess types of foundation treatments and / or support requirements
� Predict geological conditions where deep-seated anchorage and mini-piles required
� Predict side wall shear strength values
� Predict dimensions and shape of potential rock pull out cones
� Differing slope profiles and loading conditions required a range of support classes and foundation solutions

Rock Foundations; Support Classes
� Scaling and trim blast – first line of defense
� Class 4: SCP, 25 mm diam. 517/690 MPa galvanized rock bolts –used to stabilize closely jointed rock wedges on steeply inclined surfaces when access difficult
� Class 3: SCP, 36 mm diam. 835/1030 MPa galvanized threadbars – used to stabilize large block with difficult access

Rock Foundations; Support Classes
� Class 2; DCP, 36 mm diam. 835/1030 MPa galvanized threadbars –used in structures to counter uplift and / or overturning loads and seismic loads
� Class 1; DCP, 46 mm diam., 835/1030 MPa anchors – used in structures to counter uplift and / or overturning loads and seismic loads

June 1, 2004
Ares Wall #;1

� Cover material
� Sheet jointing
� Anchor design
� Class 1 for structural anchors
� Class 4 not required
Geological Model; Ares Wall #1
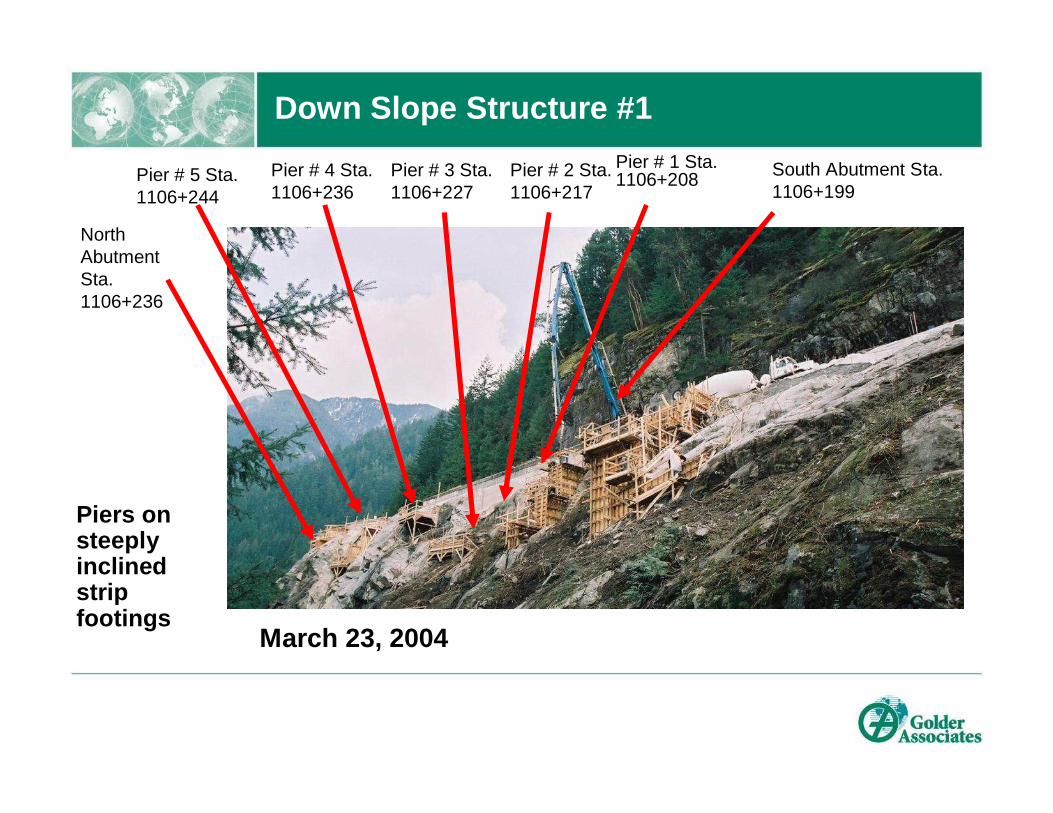
Down Slope Structure #1
South Abutment Sta. 1106+199
Pier # 1 Sta. 1106+208Pier # 2 Sta.
1106+217Pier # 3 Sta. 1106+227
Pier # 4 Sta. 1106+236
Pier # 5 Sta. 1106+244
North Abutment Sta. 1106+236
March 23, 2004
Piers on steeply inclined strip footings

Down Slope Structure #1; Geological Model
� Several joint sets – tectonic and stress relief sets
� Stress relief set – unfavorable dip and continuous – small-scale wedges (Class 4 used)
� Deep seated weathering on joint (anchor bond lengths)
� Potentially unstable rock wedges
� Anchors with high loads (Class 1 used)
Typical Geological Model

� Anchor length and free stressing lengths optimized
� Model likely rock cone required to support tensile loads applied to anchors
� Apex depth = free stress length + ½ bonded length
� Cone angle varied – 50 to 80 degrees
� Qa cone; function of Qw, Wc, and fr
Down Slope Structure #1; Geological Model
Geological Model Used For :

Design Changes:Wedge located North of Pier #5. Sta. 1106+244.650
Unconfined wedge resting on a steeply dipping clay and silt filled fault zone. The fault forms thepotential back release surfaceof the wedge
Approximate projected location of down slope retaining wall. The footing of the wall below is below the crest of the wedge on steely inclined block rock.
Approximate location of (Pier #5) - was northern abutment. The footing projects beyond the field of view down slope.
Down Slope Structure #1; Design Challenges
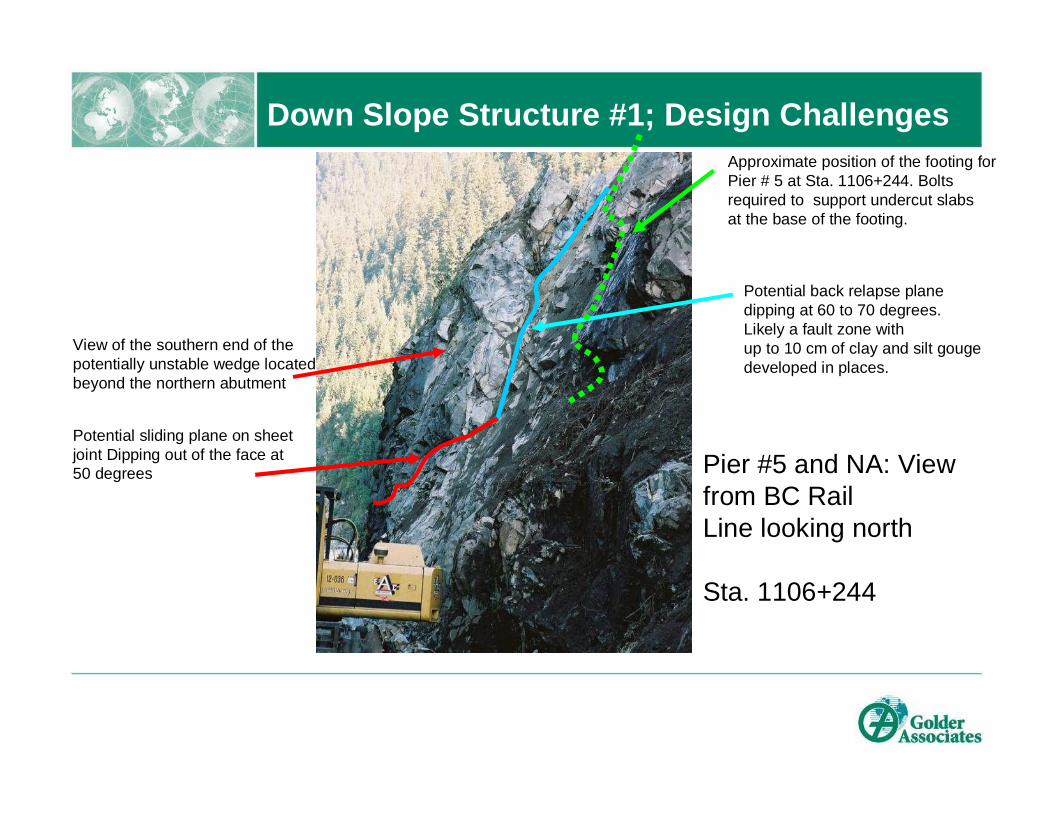
Pier #5 and NA: View from BC RailLine looking north
Sta. 1106+244
View of the southern end of thepotentially unstable wedge located beyond the northern abutment
Potential sliding plane on sheet joint Dipping out of the face at 50 degrees
Potential back relapse planedipping at 60 to 70 degrees.Likely a fault zone withup to 10 cm of clay and silt gougedeveloped in places.
Approximate position of the footing for Pier # 5 at Sta. 1106+244. Bolts required to support undercut slabs at the base of the footing.
Down Slope Structure #1; Design Challenges

July 6, 2004. View of Piers #4 and 5 looking up from the BC Rail track
Down Slope Structure #1; Design Challenges
Overhanging blocks
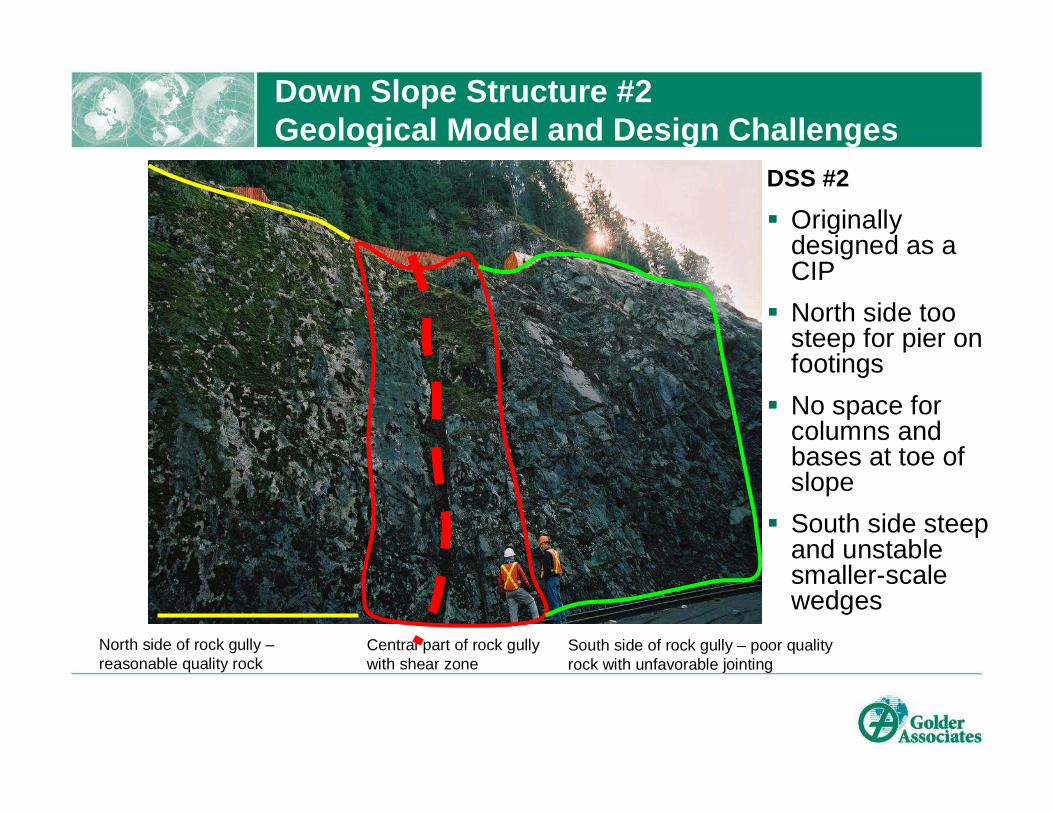
DSS #2
� Originally designed as a CIP
� North side too steep for pier on footings
� No space for columns and bases at toe of slope
� South side steep and unstable smaller-scale wedges
South side of rock gully – poor quality rock with unfavorable jointing
Central part of rock gullywith shear zone
North side of rock gully –reasonable quality rock
Down Slope Structure #2 Geological Model and Design Challenges

NA Sta. 1106+286
Pier #3 Pier #2 Pier #1 SA Sta. 1106+258CIP Wall #1
CIP Wall #3
8m long
X
X
XX
XX
DSS#2 and CIP Wall #3

-
DSS #2;� Unstable Crest � Sheet joints and faults
� Cantilevered design – loads needed to be transferred below unstable wedge
� Mini-piles and large DCP anchors for overturning forces
� 57 mm diam. 517/690 MPa threadbars. Bond breaker zone – 114 mm steel pipe coated in micro-wax
� Loads transferred to piles –16mm thick Styrofoam layer on concrete binding layer and cast into pier
Down Slope Structure #2 Geological Model and Design Challenges

Trim blasting progress on Down Slope Structure #2 as at May 27, 2004.
Pier 1 with approximate position of mini piles shown
Pier 2 with approximate position of mini piles shown
Blocks for stabilization; required before work commences on drilling and installing mini piles
Unfavourably oriented joints that daylight in the slope below Pier 1 and Pier 2
Down Slope Structure #2

� NA – piles not required, good rock mass quality and favorable jointing
� Conventional strip footing.
� Class 4 rock anchor designed to tie behind continuous sub-vertical joint.
Jv – continuous sub vertical joint
Jh – continuous near horizontal joint
Approximate location of North Abutment (NA) of Down Slope Structure #2; Sta. 1106+286
North Abutment
Down Slope Structure # 2
Fault

July 6, 2004
Down Slope Structure #2

-
June 3, 2004. View of CIP #3. Large unstable block
� Difficult access
� Large unstable block needed stabilization
� Class 3 used higher capacity, less drilling - hand drilled
CIP Wall #3 Geological Model and Design Challenges

-
CIP #3
� Fault Zone and stress relief sliding surfaces
� Anchorage: Balance between FOS and access constraints
� Class 3 installed using roped access
CIP Wall #3 Geological Model and Design Challenges

NA Sta. 1106+286
Pier #3Pier #2 Pier #1 SA Sta. 1106+258
CIP Wall #1CIP Wall #3
8m long
X
X
XX
XX
ARES Wall #2
DSS #2

-
‘The Glory Hole’Ares Panel Wall #2
�Fault zone
�Unfavorable jointing
�Weathered zones
Outside edge of Ares Wall No. 2
Fault Zone - back release plane
Stress Relief joint set
ARES Wall #2 Geological Model and Design Challenges

-
ARES Wall #2; Design Challenges
� Mass concrete sub-footing in base of Glory Hole
� Class 1 anchors in counterfort wall Class 1
� South side of wall – unstable wedges below wall – Class 3 and 1
July 6, 2004. View of Ares Wall #2

Conclusions
� The use of an engineered buttress rock fill improved the stability of the existing slopes from about FS ~ 1.1 to FS ~1.3
� The proposed 5m high MSE wall constructed on a engineered rock fill slope, developed at 1.2H:1V, could not achieve the BC MoT criteria for design FS of 1.5 under static conditions and FS of 1.1 under design seismic conditions
� Detailed reliability analysis and seismic deformation (FLAC2D) analysis were used to confirm that the proposed MSE wall constructed on an engineered rock fill would perform acceptably under both static and design seismic shaking
� The deformation based design approach allowed designers to develop more innovative solutions for the Sea-to-Sky Highway upgrades.

Conclusions
� Field mapping, observation, and the development of geological models during construction –powerful tool for designing rock foundations, particularly when base line information sparse
� Improved the stability of the existing rock slopes below structures from about FS ~ 1.1 to FS ~1.5 under static conditions and FS of 1.1 under design seismic conditions and surcharge loading.
� Scaling and trim blasting basic but NB construction method
� Performance and proof testing of anchors demonstrated that support classes worked for the design loads
� Methods developed appropriate for the rest of the highway upgrade

Test Section - Completed August 2004

Acknowledgements
� Mr. Al Brown, P.Eng.(Sea to Sky Improvement Project)
� Mr. Don Kennedy, P.Eng.Mr. Dave Harvey, P.Eng.(Associated Engineering)
� Mr. Trevor Fitzell, P.Eng.Dr. Upul Atukorala, P.Eng.Dr. Humberto Puebla, P.Eng.Mr. Shawn Lange, P.Eng.(Golder Associates Ltd.)
� BC Ministry of Transportation(Deputy Minister’s Award)
� Consulting Engineers of BC(Lieutenant Governor’s Award and Award of Excellence)
� Institute of Transportation Engineers - Vancouver Branch(W.H. Curtis Award)
� Association of Consulting Engineers of Canada(Award of Excellence)