Embed Size (px)
Citation preview
Summa Phytopathol., Botucatu, v. 44, n. 4, p. 317-325, 2018 317
Geostatistical analysis of bacterial blight in coffee tree seedlings in the nursery
Leônidas Leoni Belan1, Edson Ampélio Pozza1, Marcelo de Carvalho Alves2, Marcelo Loran de Oliveira Freitas1
1Universidade Federal de Lavras, Departamento de Fitopatologia, DFP / UFLA, Laboratório de Epidemiologia e Manejo de doenças de Plantas, Caixa Postal 3037, CEP 37200-000, Lavras, MG, Brasil. 2Universidade Federal de Lavras, Departamento de Engenharia, DEG / UFLA, Caixa Postal 3037, CEP 37200-000, Lavras, MG, Brasil.Autor para correspondência: Edson Ampélio Pozza ([email protected])Data de chegada: 05/05/2017. Aceito para publicação em: 15/02/2018. 10.1590/0100-5405/179559
ABSTRACT
In nurseries of coffee tree seedlings (Coffea arabica), there are favorable conditions for bacterial blight epidemics (Pseudomonas syringae pv. garcae). Studying the spatial distribution of diseased plants can help in the adoption of management strategies. Likewise, geostatistics has been applied to shape the spatial distribution and study epidemiological aspects of plant diseases. Thus, this study was developed to characterize the spatial distribution pattern of bacterial blight in a nursery of coffee tree seedlings. The disease progress was monitored over time in 704 seedlings organized in lines and columns in a nursery. Considering the mean diameter of the pots used for producing seedlings, georeferencing was carried out in Cartesian coordinate system for the seedlings in the nursery. The disease incidence data were subjected to non-spatial exploratory
Belan, L.L.; Pozza, E.A.; Alves, M.C.; Freitas, M.L.O. Geostatistical analysis of bacterial blight in coffee tree seedlings in the nursery. Summa Phytopathologica, v.44, n.4, p.317-325, 2018.
analysis and geostatistical analysis. The spherical isotropic semivariogram model was adjusted to the data and data interpolation was performed by ordinary kriging to visualize the spatial distribution of symptomatic seedlings. Bacterial blight epidemic was detected in the nursery during the experimental period, and there was variability and spatial dependence in relation to the distribution of diseased seedlings. As the epidemic progressed, the population of diseased plants increased, as well as the number and the size of the foci and their coalescence. Besides, there was an increase in the range value, sill and nugget effect. The kriging maps showed the disease progress and its variance. The bacterial blight epidemic of coffee tree started with a random spatial distribution pattern, progressing to an aggregate pattern.
Keywords: Pseudomonas syringae pv. garcae; Coffea arabica; spatial dependence; plant disease management; epidemiology.
Bacterial blight of coffee tree (Pseudomonas syringae pv. garcae Young, Dye & Wilkie 1978) (Psg) was first described in Brazil in the county of Garça, São Paulo State (5); it can infect from seedlings in the nursery to plants in production fields (35, 43). In the nursery, the contact between leaves from seedlings of susceptible hosts due to high plant density, associated with moisture excess in the environment provided by sprinkler irrigation, favors the spread of the pathogen and, consequently, epidemics (36, 38). Under these conditions, infected seedlings in aggregated pattern are common (36), forming a density
gradient of the disease from a central focus. However, studies about such gradient, spatial dependence in an inoculum source and progression rate have not been published so far. To study this spatial distribution of diseased plants, strategies and efficient management strategies can be chosen (11).
Spatial distribution analysis of diseased plants allows a better understanding of epidemic progress, quantitative effect of initial inoculum, dispersion mechanisms of the pathogen, influence of environmental factors in the infection and in the dispersion of the
Em viveiros de mudas de cafeeiro (Coffea arabica) ocorrem condições favoráveis para a ocorrência de epidemias da mancha aureolada (Pseudomonas syringae pv. garcae). Estudar a distribuição espacial de plantas doentes pode auxiliar na adoção de estratégias de manejo. Nesse sentido, a geoestatística tem sido aplicada para modelar a distribuição espacial e estudar aspectos epidemiológicos de doenças de plantas. Assim, este estudo foi desenvolvido para caracterizar o padrão de distribuição espacial da mancha aureolada em viveiro de mudas de cafeeiro. Para isso, o progresso da doença foi monitorido ao longo do tempo em 704 mudas organizadas em linhas e colunas em viveiro. Considerando o diâmetro médio dos recipientes utilizados para produção das mudas, foi realizado o georreferencimento das mudas no viveiro em sistema de coordenadas plano-cartesiano. Os dados de incidência
Belan, L.L.; Pozza, E.A.; Alves, M.C.; Freitas, M.L.O. Análise geoestatística da mancha aureolada em mudas de cafeeiro no viveiro. Summa Phytopathologica, v.44, n.4, p.317-325, 2018.
Palavras-chave: Pseudomonas syringae pv. garcae; Coffea arabica; dependencia espacial; manejo de doenças de plantas; epidemiologia.
RESUMO
da doença foram submetidos a uma análise exploratória não espacial e à análise geoestatística. O semivariograma isotrópico esférico foi ajustado aos dados e a interpolação dos dados foi realizada por krigagem ordinária para visualizar a distribuição espacial de mudas sintomáticas. Epidemia da doença foi detectada em viveiro durante o período experimental, havendo variabilidade e dependência espacial em relação à distribuição das mudas doentes. Com o decorrer da epidemia, houve aumento da população de plantas doença, número e tamanho dos focos e coalescência desses. Além disso, houve aumento do valor do alcance, patamar e do efeito pepita. Os mapas de krigagem mostraram o progresso da doença e sua variação. A epidemia da mancha aureolada do cafeeiro iniciou com padrão aleatório de distribuição espacial, progredindo para padrão agregado.

318 Summa Phytopathol., Botucatu, v. 44, n. 4, p. 317-325, 2018
pathogen, and effect on practices (11). Moreover, knowing the spatial distribution is essential in the development of sample protocols for certain diseases (22). Thus, Campbell & Madden (11) and Madden et al. (26) described three classifications for the spatial pattern of diseased plants: random, aggregate or grouped, and regular. According to these authors, the random spatial pattern is related to equal chances of infection; the aggregate pattern occurs when, under natural conditions, the pathogen is dispersed to short distances in the plant-to-plant interaction, such as bacterial diseases in nursery seedlings (38), due to the high density of plants in small areas. Likewise, the probability of becoming infected is greater for a plant placed next to the inoculum source than to plants distant from this source (9, 19, 20), i.e., spatial dependence can occur between individuals, varying according to the characteristics of the host, susceptibility of the pathogen and the environment, characteristics of the system and quantity of water irrigation.
This uncertain, ambiguous, non-linear, and frequently exponential progress over time in agricultural systems requires the application of tools capable of measuring these variables.
Geostatistics is a science capable of shaping the spatial progress and studying hypotheses about the epidemiological aspects of plant diseases (1, 2, 3, 21, 24, 28, 30, 33, 37, 41, 44). Alves & Pozza (1) verified, using geostatistical analysis, a disease gradient for anthracnose (Colletotrichum lindemuthianum (Sacc. & Magnus) Briosi & Cavara) in common bean plants around the primary inoculum source, with aggregate distribution pattern and spatial dependence to the inoculum source. For the culture of coffee tree (Coffea arabica L.), Alves et al. (2) also verified aggregate pattern for rust distribution (Hemileia vastatrix Berkeley & Broome) and cercosporiosis (Cercospora coffeicola Berk. & Cooke), showing foci occurrence. Thus, the current disease control strategy of application in a total area can be substituted for the use of
specific fungicides in places showing higher disease intensity. Similarly, Mouen Bedimo et al. (28) used semivariograms and dispersion maps obtained by kriging for assessing outbreaks of primary coffee berry disease (Colletotrichum kahawae Waller & Bridge) in Camaroon. The authors analyzed the spatial distribution over time and verified a gradient of diseased plants from the first infected coffee tree.
As regards bacterial blight in coffee trees, there is the need to determine the structure and the magnitude of the progress and the spatial dependence of the disease in the nursery in order to characterize its epidemiology and propose specific management strategies. Likewise, this study was developed to characterize through geostatistics the spatial distribution pattern of bacterial blight in coffee tree seedlings in the nursery.
MATERIALS AND METHODS
The study was conducted in a commercial nursery of coffee tree seedlings located in the county of Nepomuceno – Minas Gerais State, Brazil, at geographical coordinates 21°14’05.64”S and 45°13’21.34”W. Coffee tree seedlings (Coffea arabica), cultivar Catuaí Vermelho IAC 99, were cultivated in polyethylene bags (0.065 m diameter and 0.20 m thickness) filled with substratum composed of 70% earth and 30% bovine manure. The seedlings received irrigation via sprinkling system, as well as the other crop treatments, including phytosanitary management and fertilization according to technical recommendations.
Quadrat Size The nursery bed tracking or quadrat size was delimited to 1.43 m
width and 2.08 m length (Figure 1), containing 704 seedlings displayed in lines and columns. Seedlings were in the stage of the first pair
Figure 1. Schematic representation of the quadrat size, or plot, and georeferencing points for assessment of the incidence of bacterial blight (Pseudomonas syringae pv. garcae) in seedlings of coffee tree (Coffea arabica) in the nursery. Each georeferenced sampling point is constituted of one seedling represented by black circles (image on the right); seedlings were cultivated in circular polyethylene bags of 0.065 m average diameter. Nursery bed at trial implementation, specifying experimental area dimensions (upper image on the left). Seedlings with symptoms of the disease (lower image on the left).
Georeferenced points

Summa Phytopathol., Botucatu, v. 44, n. 4, p. 317-325, 2018 319
of definite leaves. In this nursery bed, there was a small number of plants with symptoms of bacterial blight of coffee tree (P. syringae pv. garcae Young, Dye & Wilkie) naturally occurring at random. To prove the bacterial etiology of the disease, samples of injured leaves were subjected to exudation test. After a positive result, the etiologic agent was isolated in medium 523 of Kado & Heskett (23) and classified as P. syringae (8).
Assessments Five assessments were carried out for disease incidence, the first of
which was on 11/06/2012, and the other ones at 6, 22, 36 and 61 days after the first assessment (DAFA), respectively. In each assessment, the presence or absence of symptoms of bacterial blight of coffee tree in the leaves was verified for all coffee tree seedlings in the plot. Seedlings with and without the disease incidence received score 1 (one) and 0 (zero), respectively. These binary data (presence or absence of symptoms) were used for geostatistical analysis.
Geostatistical AnalysisSample GridSample grid was determined with 704 georeferenced points
distributed in the 0.065m x 0.065m spacing, occupying the whole experimental area (2.974 m2) (Figure 1). Considering the average diameter of polyethylene bags (0.065 m) used for seedling production, the georeferencing of seedlings in the beds was conducted in system of coordinates (x;y). Thus, one of the poles of the plot was considered a coordinate (0;0), and for the seedling placed in the first line and on the first column (0.033; 0.033) (Figure 1). The location of healthy and diseased plants in each assessment allowed the elaboration of maps representing the disease progress over time.
Exploratory analysis of data: spatial and nonspatial analysisThe disease incidence data initially underwent nonspatial
explanatory analysis. The following values were calculated: average, maximum and minimum, coefficient of variation and standard deviation. Analysis of kurtosis and asymmetry were also performed.
From the explanatory analysis of data, geostatistical analysis was done to characterize the spatial variation of the disease.
Model adjustmentThe theoretical model of spherical semivariogram (10) was
adjusted. The model adjustment was obtained with the method Restricted Maximum Likelihood (REML – restricted maximum likelihood). The criteria for selection of the semivariogram model adjustments were: cross validation, lower sum of squares of residues, higher coefficient of determination (R2), lower nugget effect (C0) and
estimated sill close to maximum data variance.From the mathematical model adjustment to the values calculated
from )ˆ h(γ , the parameters of theoretical model for the semivariogram were estimated; they were called nugget effect (C
0), sill (C
0+C) and
range (a). Semivariograms were represented by graphics of estimated semivariance ( )(ˆ hγ ) versus distance (h).
Mapping by krigingAfter the adjustment of semivariograms, data interpolation by
ordinary kriging was conducted to enable the visualization of the disease spatial distribution patterns over time. After that, the deviation mapping of kriging pattern was plotted.
For the statistics and geostatistical analyses in the plotting of maps, computer system “R” was used with the packages geoR, geoRglm and splancs (14)
RESULTS AND DISCUSSION
Exploratory analysis of data Bacterial blight of coffee tree was detected (Maximum value = 1)
in the first assessment, as well as temporary progress of the disease and variability in the spatial distribution of infected seedlings in the nursery (Table 1).
There was progress of the disease over time represented by a variation from 0.05 (5%) to 0.56 (56%) at 6 and 61 DAFA, respectively, in the average number of seedlings with symptoms, variance (s2) and standard deviation (s); the value of variation (CV) was lower in relation to the previous assessment (Table 1). At 61 DAFA, the mode value was equal to 1, i.e., more than 50% seedlings showed symptoms of the disease (Table 1).
The distribution of diseased seedlings in the nursery was heterogeneous. The lowest and the highest value of the observed coefficient of variation (CV), over the experimental period, was 88.0 and 437.5%, respectively, representing heterogeneity of the data (Table 1). The found CV values can be considered high according to the limits proposed by Warrick & Nielsen (42), who consider that CV < 12% indicate low variability; 12% < CV < 60% indicate average, and CV > 60% indicate high variability. According to Frogbrook et al. (17) and Gomes & Garcia (18), CV values > 10% can be considered the first indicators of heterogeneity of data or presence of diseased plants in different locations. For this study, the high CV value is justified by the binary pattern of the studied variable, presence or absence of the disease and rising gradient of the number of diseased plants over time. Nevertheless, the progression of the disease over time reduced the data heterogeneity due to the increased number of diseased plants in several
Table 1. Statistical summary for characterizing the occurrence and distribution of bacterial blight of coffee tree (Pseudomonas syringae pv. garcae) in the nursery of coffee tree seedlings (Coffea arabica) over time
Asses/a Average Median Mode Vmax/b Vmim/c s2 /d s/e CV/f Asymmetry Kurtosis
1st * 0.05 0.00 0.00 1.00 0.00 0.05 0.22 437.51 4.15 15.28
6 DAFA/g 0.07 0.00 0.00 1.00 0.00 0.06 0.25 365.87 3.39 9.52
22 DAFA 0.21 0.00 0.00 1.00 0.00 0.17 0.41 192.32 1.40 -0.03
36 DAFA 0.49 0.00 0.00 1.00 0.00 0.25 0.50 102.08 0.04 -2.00
61 DAFA 0.56 1.00 1.00 1.00 0.00 0.25 0.50 88.00 -0.26 -1.94a Assessment; b Maximum value; c Minimum value; d Variance; e Standard deviation; f Coefficient of variation (%), g DAFA: Days after the first assessment, *First assessment conducted at trial implementation.

320 Summa Phytopathol., Botucatu, v. 44, n. 4, p. 317-325, 2018
places of the nursery bed, homogenizing the disease distribution. Similarly to this study, data heterogeneity for spatial distribution
in the field has already been described (6, 7, 15, 24, 33). Leal et al. (24) compared the number of plants showing Greening (Candidatus Liberibacter sp.) among 46 plots of citrus with variable number of infected plants. These authors obtained coefficient of variation equal to 313.05%, characterizing variability of the disease in the study areas. In these cases, the greater heterogeneity of data can indicate less quality of the generated estimates (7, 27). According to Amaral et al. (7), geostatistical analyses must be carried out to analyze the phenomenon and decide, based on the obtained parameters, whether the estimates can be used or not.
Up to 22 DAFA, asymmetry of the data was verified (Table 1). However, for the largest number of diseased plants, symmetry was found. In relation to kurtosis or dispersion of data distribution to normal curve, a coefficient equal to 15.28 was obtained in the first assessment and decreased over time, i.e., there was homogenization of the data (Table 1). Furthermore, geostatistics does not demand the application of normality of the data (27); therefore, in the current study it was likely to be applied to quantify the spatial distribution of data and then provide maps to enable the adoption of management strategies.
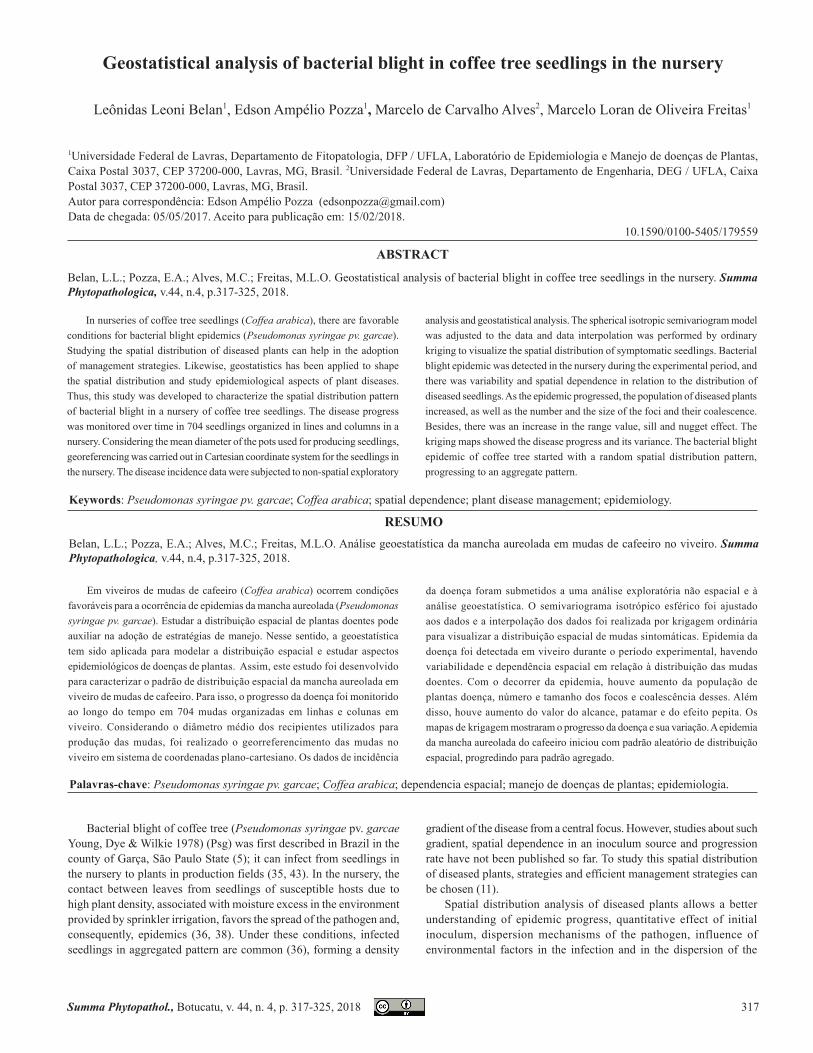
However, knowing this heterogeneity is not enough to identify the distribution pattern and dependence among diseased seedlings in the nursery, justifying the spatial exploratory analysis (Figure 2).
As regards spatial location of diseased plants, there was no concentration in specific sectors of the grid (Figure 2); however, secondary foci were detected over time.
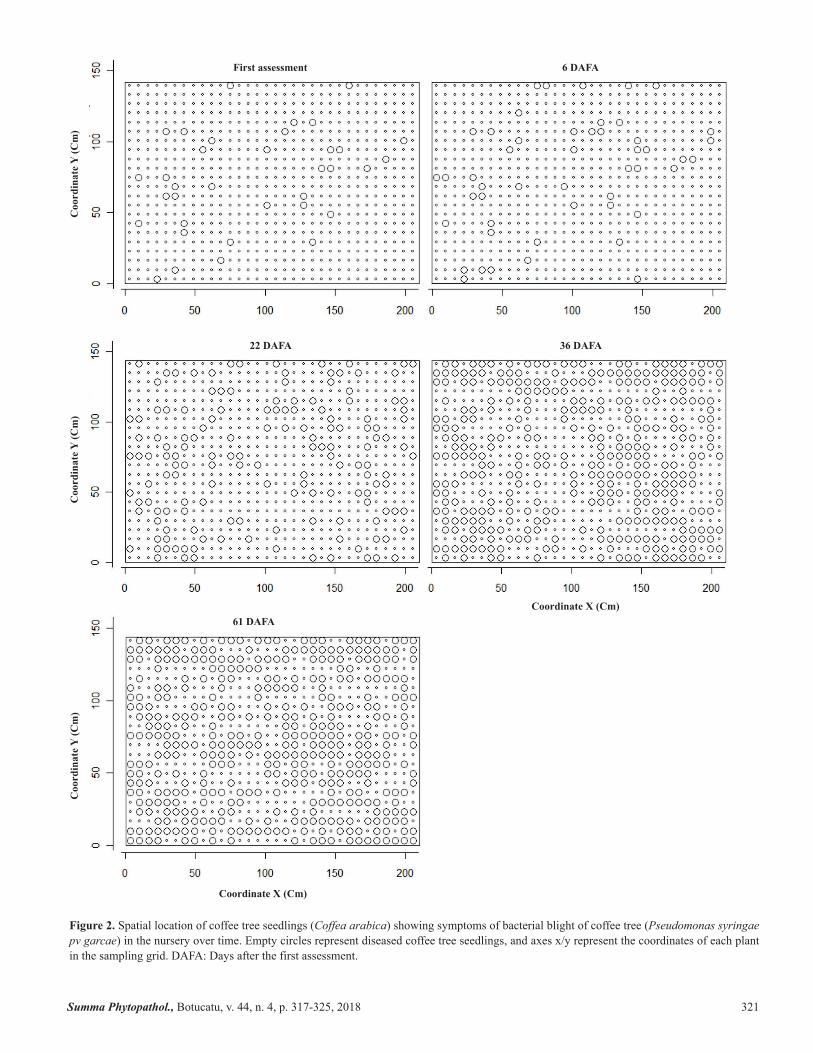
Assessment of spatial dependenceThe spherical isotropic model was adjusted to represent this
disease (Table 2; Figure 3). Therefore, the spatial dependence did not vary in relation to direction. This model was used for variographic representation and for plotted kriging maps. This model, adjusted with REML method (restricted maximum likelihood), had already been used to characterize the spatial structure of diseases of coffee trees (4, 28) and other cultures (3, 16, 25, 31, 32, 40, 41). This is related to the pathogen inoculum distribution generally in all directions, from the initial inoculum source. In the case of bacterial blight in a nursery of coffee tree seedlings, the dispersion of bacterial inoculum around an infected seedling is favored by sprinkler irrigation on the seedlings, disseminating the pathogen inoculum by splashing around the inoculum source.
Therefore, there was spatial dependence of bacterial blight in the nursery of coffee tree seedlings (Table 2; Figure 3). This fact is also justified by the lowest value of range (8.81 cm) at 6 DAFA (Table 2), increasing correspondingly to the number of diseased seedlings (Table 1) and the number of secondary foci (Figure 2). The sill value and nugget
effect also increased over time (Table 2). The increased number of foci of coffee tree seedlings with symptoms of bacterial blight of coffee tree over time provided higher semivariance value, as reported by Noetzold et al. (31) for the pathosystem Colletotrichum truncatum in the soybean culture (Glicyne max L.). However, these authors verified a reduction in the range value, which did not occur in this study due to the expansion of the focus size, as well as their coalescence, simultaneously to the occurrence of secondary foci.
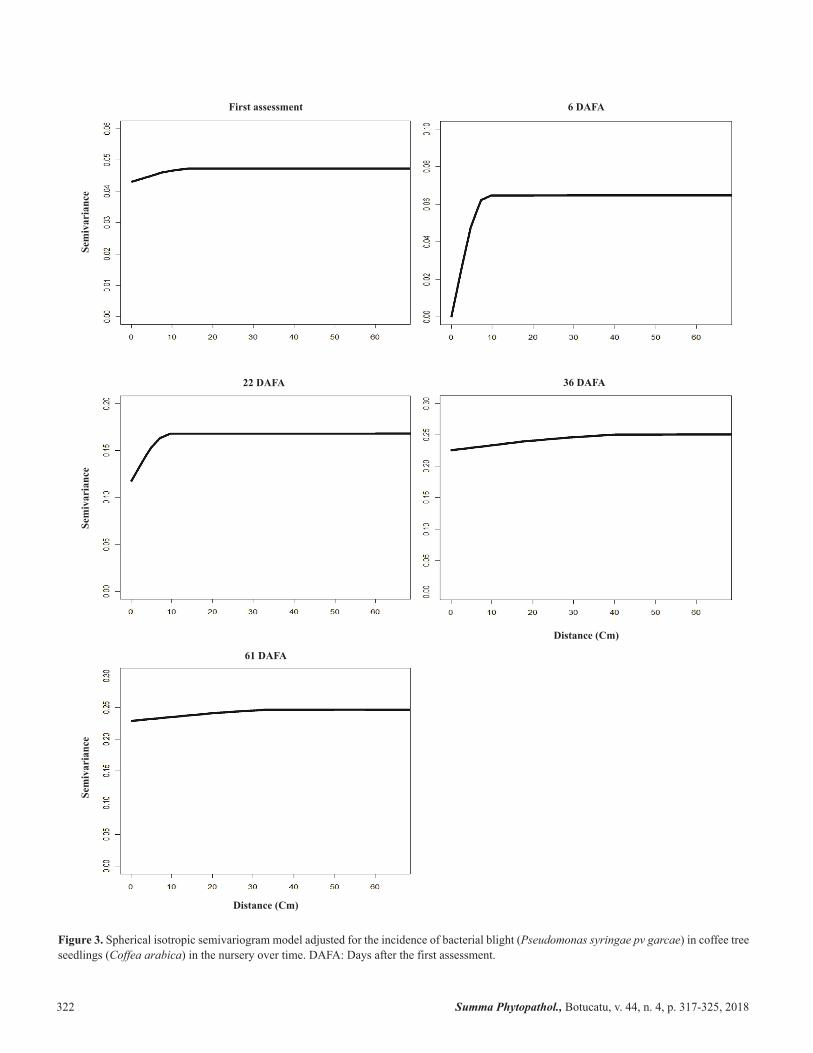
As there was spatial dependence, i.e., inoculum source for dissemination of the pathogen, interpolated grid or maps of spatial distribution of seedlings with symptoms of bacterial blight of coffee tree in the nursery could be generated (Figure 4). In this case, there was formation, lateral expansion and coalescence of foci. Gottwald et al. (20) and Alves et al. (3) also verified formation and coalescence of secondary foci for pathosystems Xanthomonas campestris pv. citri in citrus seedling nursery and C. lindemuthianum in the culture of beans (Phaseolus vulgaris L.) in the field, respectively. In these cases, the disease progress can be increased if the environment is favorable to the epidemic and the host susceptible to the infection (12, 13, 19, 20, 36, 38), especially in bacterial pathosystems, causing spatial and temporal expansion from diseased plant foci. In a nursery of coffee tree seedlings, both high plant density and sprinkling irrigation provide favorable conditions and environment for the occurrence, as well as high progress of bacterial blight of coffee tree. The direct contact among leaves of seedlings associated with the moisture excess in the environment favors the pathogen dissemination and occurrence of epidemics with high rates of progress of this disease.
Based on the maps of the disease, changes in the distribution pattern were verified initially at random and up to aggregate pattern with several plants per focus. Other researchers also observed these distribution patterns of diseases and pests of coffee trees (2, 4, 28, 29), as well as other cultures (3, 31, 34). In farming of Coffea arabica, Alves et al. (4) observed the kriging maps and found berry borer infestation (Hypothenemus hampei) in coffee beans through the space towards foci of various sizes all over the field. Likewise, Musoli et al. (29) used geostatistical techniques to study the space-temporal structure of coffee wilt disease (Fusarium xylarioides Steyaert (Gibberella xylarioides Heim and Saccas)) in C. canephora and also observed spatial aggregate pattern. These authors verified a small temporal progress, characteristic of this pathosystem, contrary to the temporal pattern of bacterial disease, such as bacterial blight of coffee tree.
In the beginning of the epidemic, there was random occurrence of diseased seedlings (Figure 4). This randomness of foci can be explained by the possibility of having seeds as the initial inoculum. Belan et al. (8) detected a viable inoculum of P. syringae pv. garcae in coffee tree seeds from plants with symptoms of bacterial blight of coffee tree. In this case, the initial distribution of seedlings with symptoms at random
Table 2 Parameters of spherical semivariogram model referring to the occurrence and distribution of bacterial blight of coffee tree (Pseudomonas syringae pv. garcae) in the nursery of coffee tree seedlings (Coffea arabica) over time.
Assessment Nugget effect Contribution Sill Range (Cm)
1st * 0.04 0.00 0.05 15.29
6 DAFAa 0.00 0.06 0.06 8.81
22 DAFA 0.12 0.05 0.17 9.59
36 DAFA 0.22 0.03 0.25 45.64
61 DAFA 0.23 0.02 0.25 38.71aDAFA: Days after the first assessment; *First assessment conducted at trial implementation.
Summa Phytopathol., Botucatu, v. 44, n. 4, p. 317-325, 2018 321
Figure 2. Spatial location of coffee tree seedlings (Coffea arabica) showing symptoms of bacterial blight of coffee tree (Pseudomonas syringae pv garcae) in the nursery over time. Empty circles represent diseased coffee tree seedlings, and axes x/y represent the coordinates of each plant in the sampling grid. DAFA: Days after the first assessment.
First assessment 6 DAFA
22 DAFA 36 DAFA
61 DAFACoordinate X (Cm)
Coordinate X (Cm)
Coo
rdin
ate Y
(Cm
)C
oord
inat
e Y (C
m)
Coo
rdin
ate Y
(Cm
)
322 Summa Phytopathol., Botucatu, v. 44, n. 4, p. 317-325, 2018
Figure 3. Spherical isotropic semivariogram model adjusted for the incidence of bacterial blight (Pseudomonas syringae pv garcae) in coffee tree seedlings (Coffea arabica) in the nursery over time. DAFA: Days after the first assessment.
First assessment 6 DAFA
22 DAFA 36 DAFA
61 DAFA
Distance (Cm)
Sem
ivar
ianc
eSe
miv
aria
nce
Sem
ivar
ianc
e
Distance (Cm)

Summa Phytopathol., Botucatu, v. 44, n. 4, p. 317-325, 2018 323
Figure 4. Kriging maps of the incidence of bacterial blight of coffee tree (Pseudomonas syringae pv garcae) in coffee tree seedlings (Coffea arabica) in the nursery over time. Axes x and y represent the coordinates of each plant in the sampling grid. DAFA: Days after the first assessment.
Coordinate X (Cm)
Coordinate X (Cm)
Coo
rdin
ate Y
(Cm
)C
oord
inat
e Y (C
m)
Coo
rdin
ate Y
(Cm
)First assessment 6 DAFA
36 DAFA22 DAFA
61 DAFA

324 Summa Phytopathol., Botucatu, v. 44, n. 4, p. 317-325, 2018
could be explained by seed contamination and sprinkler irrigation providing favorable conditions to the dissemination of the pathogen and random manifestation of disease symptoms among coffee tree seedlings. Thus, the management of bacterial blight in a nursery of coffee tree seedlings must be prevented based on the health of seeds and plant protection against initial infection; this is not applicable for the eradication of initial outbreaks of the disease because new foci appeared over time (Figures 3 and 4).
This relation between plant disease epidemics and randomness of initial inoculum has already been reported for fungal pathosystems. Scott et al. (39) verified, in epidemics of Sclerotinia crown rot (Sclerotinia sclerotiorum and S. minor) in cultures of pyrethrum (Tanacetum cinerariifolium (Trevir.) Sch. Bip.) in Australia, association with the presence and quantity of primary inoculum and other factors capable of favoring the epidemic progress.
There was variability in relation to the distribution of seedlings with symptoms of bacterial blight in the nursery of coffee tree seedlings and spatial dependence of the disease progress with initial inoculum. The spherical isotropic semivariogram was adjusted to the data to represent the spatial distribution of the disease. The epidemic of the disease started with random spatial distribution pattern of symptomatic seedlings, developing to the aggregate pattern with several plants per focus. The increase in the number foci of bacterial blight of coffee tree over time, simultaneously to size expansion and their coalescence, provided higher semivariance values and range.
ACKNOWLEDGMENTS
Thanks to the National Council for Scientific and Technological Development (CNPq), the National Institute for Science and Coffee Technology (INCT-Coffee), and the Research Supporting Foundation of Minas Gerais State (FAPEMIG) for contributing with this study. The authors also thank the farmers for the coffee tree seedlings and for contributing with the establishment of the experiment.
REFERENCES
1. Alves, M.C.; Pozza, E.A. Indicator kriging modeling epidemiology of common bean anthracnose. Applied Geomatics, Cham, v.2, n.2, p.65-72, 2010.
2. Alves, M.C.; Silva, F.M.; Pozza, E.A.; Oliveira, M.S. Modeling spatial variability and pattern of rust and brown eye spot in coffee agroecosystem. Journal of Pest Science, Heidelberg, v.82, n.2, p.137-148, 2009.
3. Alves, M.C.; Pozza, E.A.; Machado, J.C.; Araújo, D.V.; Talamini, V.; Oliveira, M.S. Geoestatística como metodologia para estudar a dinâmica espaço-temporal de doenças associadas a Colletotrichum spp. transmitidos por sementes. Fitopatologia Brasileira, Brasília, v.31, n.6, p.557-563, 2006.
4. Alves, M.C.; Silva, F.M.; Moraes, J.C.; Pozza, E.A.; Oliveira, M.S.; Souza, J.C.S.; Alves, L.S. Geostatistical analysis of the spatial variation of the berry borer and leaf miner in a coffee agroecosystem. Precision Agriculture, Cham, v.12, n.1, p.18-31, 2011.
5. Amaral, F.J.; Teixeira, C.; Pinheiro, E.D. A bacterium causing halo blight of coffee. Arquivos do Instituto Biológico, São Paulo, v.23, n.1 , p.151-155, 1956.
6. Amaral, L.P.; Ferreira, R.A.; Watzlawick, L.F.; Longhi, S.J.; Sebem, E. Influência da floresta alterada na distribuição espacial de três espécies da floresta ombrófila mista avaliada pela geoestatística. Revista Árvore, Viçosa, v.37, n.3, p.491-501, 2013.
7. Amaral, L.P.; Ferreira, R.A.; Santos Lisboa, G.; Longhi, S.J.; Watzlawick, L.F. Spatial variability of the Shannon-Wiener Diversity Index in a Mixed Ombrophilous Forest. Scientia Forestalis, Piracicaba, v.41, n.97, p.83-93, 2013.
8. Belan, L.L.; Pozza, E.A.; Freitas, M.L.O.; Raimundi, M.K.; Souza, R.M.;
Machado, J.C. Occurrence of Pseudomonas syringae pv. garcae in coffee seeds. Australian Journal of Crop Science, Brisbane, v.10, n.7, p.1015-1021, 2016.
9. Bergamin Filho, A.; Hau, B.; Amorim, L.; Laranjeira, F.F. Análise espacial de epidemias. Revisão Anual de Patologia de Plantas, Passo Fundo, v.10, n.1 , p.155-218, 2002.
10. Burrough, P.A.; Mcdonnell, R.A. Principles of geographical information systems. 2nd ed. London: Oxford University Press, 1998. 330p.
11. Campbell, C.L.; Madden, L.V. Introduction to plant disease epidemiology. New York: John Wiley & Sons, 1990. 532p.
12. Carmo, M.G.F.; Macagnan, D.; Carvalho, A.O. Progresso da mancha-bacteriana do pimentão a partir de diferentes níveis iniciais de inóculo e do emprego ou não do controle com oxicloreto de cobre. Horticultura Brasileira, Vitória da Conquista, v.19, n.3, p.210-215, 2001.
13. Carmo, M.G.F.; Kimura, O.; Maffia, L.A.; Carvalho, A.O.C. Progresso da pústula bacteriana do pimentão, causada por Xanthomonas campestris pv. vesicatoria em condições de viveiro. Fitopatologia Brasileira, Brasília, v.20, n.1, p.66-70, 1996.
14. Diggle, P.J.; Ribeiro Junior, P.J. Model-based geostatistics. New York: Springer, 2007. 228p.
15. Ferraz, G.; Silva, F.M.; Carvalho, L.C.C.; Alves, M.C.; Franco, B.C. Varia-bilidade espacial e temporal do fósforo, potássio e da produtividade de uma lavoura cafeeira. Engenharia Agrícola, Jaboticabal, v.32, n.1, p.140-150, 2012.
16. Freitas, A.S.; Pozza, E.A.; Alves, M.C.; Coelho, G.; Rocha, H.S.; Pozza, A.A.A. Spatial distribution of Yellow Sigatoka Leaf Spot correlated with soil fertility and plant nutrition. Precision Agriculture, Cham, v.17, n.1, p.93-107, 2016.
17. Frogbrook, Z.L.; Oliver, M.A.; Salahi, M.; Ellis, R.H. Exploring the spatial relations between cereal yield and soil chemical properties and the implica-tions for sampling. Soil Use and Management, Medford, v.18, n.1, p.1-9, 2002.
18. Gomes, F.P.; Garcia, C.H. Estatística aplicada a experimentos agronô-micos e florestais. Piracicaba: FEALQ, 2002. 305p.
19. Gottwald, T.R. Current Epidemiological Understanding of Citrus Huan-glongbing. Annual Review of Phytopathology, Palo Alto, v.48, n.1, p.119-139, 2010.
20. Gottwald, T.R.; Timmer, L.W.; Mcguire, R.G. Analysis of disease progress of Citrus canker in nurseries in Argentina. Phytopathology, St. Paul, v.79, n.11, p.1276-1283, 1989.
21. Jaime-Garcia, R.; Orum, T.V.; Felix-Gastelum, R.; Trinidad-Correa, R.; Vanetten, H.D.; Nelson, M.R. Spatial analysis of Phytophthora infestans genotypes and late blight severity on tomato and potato in the Del Fuerte Valley using geostatistics and geographic information systems. Phytopa-thology, St. Paul, v.91, n.12, p.1156-1165, 2001.
22. Jeger, M.J. Mathematical analysis and modeling of spatial aspects of plant disease epidemics. In: Kranz, J. Epidemics of Plant Diseases. Berlin: Springer, 1990. p.53-95.
23. Kado, C.I.; Heskett, M.G. Selective media for isolation of Agrobacterium, Corynebacterium, Erwinia, Pseudomonas and Xanthomonas. Phytopa-thology, St. Paul, v.60, n.6, p.969-976, 1970.
24. Leal, R.M.; Barbosa, J.C.; Costa, M.G.; Junior, J.B.; Yamamoto, P.T.; Dragone, J. Distribuição espacial de huanglongbing (greening) em citros utilizando a geoestatística. Revista Brasileira de Fruticultura, Jaboticabal, v.32, n.3, p.808-818, 2010.
25. Lung-Escarmant, B.; Guyon, D. Temporal and spatial dynamics of primary and secondary infection by Armillaria ostoyae in a Pinus pinaster plantation. Phytopathology, St. Paul, v.94, n.2, p.125-131, 2004.
26. Madden, L.V.; Hughes, G.; Van Den Bosch, F. The study of plant disease epidemics. St. Paul: American Phytopathological Society, 2007. 432p.
27. Mello, J.M.; Batista, J.L.F.; Oliveira, M.S., Ribeiro Junior, P.J. Estudo da dependência espacial de características dendrométricas para Eucalyptus grandis. Cerne, Lavras, v.11, n.2, p.113-126, 2005.
28. Mouen Bedimo, J.A.; Bieysse, D.; Cilas, C.; Nottéghem, J.L. Spatio-temporal dynamics of arabica coffee berry disease caused by Colletotrichum kahawae on a plot scale. Plant Disease, St. Paul, v.91, n.10, p.1229-1236, 2007.
29. Musoli, C.; Pinard, F.; Charrier, A.; Kangire, A.; Ten Hoopen, G.; Kabole, C.; Ogwang, J.; Bieysse, D.; Cilas, C. Spatial and temporal analysis of coffee wilt disease caused by Fusarium xylarioides in Coffea canephora. European Journal of Plant Pathology, Cham, v.122, n.4, p.451-460, 2008.
30. Nelson, M.R.; Orum, T.V.; Jaime-Garcia, R.; Nadeem, A. Applications of

Summa Phytopathol., Botucatu, v. 44, n. 4, p. 317-325, 2018 325
geographic information systems and geostatistics in plant disease epide-miology and management. Plant Disease, St. Paul, v.83, n.4, p.308-319, 1999.
31. Noetzold, R.; Alves, M.D.C.; Cassetari Neto, D.; Machado, A.Q. Spatial variability of Colletotrichum truncatum in soybean field under three seed health levels. Summa Phytopathologica, Botucatu, v.40, n.1, p.16-23, 2014.
32. Oliveira, F.J.; Farias, P.R.; Silva, A.G.; Rodrigues, K.C. Distribuicão espacial da leprose dos citros na Amazonia Oriental. Revista Ciência Agronômica, Fortaleza, v.47, n.1, p.56-68, 2016.
33. Ortiz, B.V.; Perry, C.; Goovaerts, P.; Vellidis, G.; Sullivan, D. Geostatistical modeling of the spatial variability and risk areas of southern root-knot nematodes in relation to soil properties. Geoderma, Amsterdam, v.156, n.3, p.243-252, 2010.
34. Pinto, A.; Pozza, E.A.; Talamini, V.; Machado, J.C.; Sales, N.L.P.; Garcia, D.; Santos, D.M. Análise do padrão espacial e do gradiente da antracnose do feijoeiro em duas épocas de cultivo. Summa Phytopatologica, Botucatu, v.27, n.4, p.392-398, 2001.
35. Pozza, E.A.; Carvalho, L.V.; Chalfoun, S.M. Sintomas e injúrias causadas por doenças em cafeeiro. In: Guimarães R.J.; Mendes, A.N.G.; Baliza, D.P. Semiologia do cafeeiro: sintomas de desordens nutricionais, fitossani-tárias e fisiológicas. Lavras: Editora UFLA, 2010. p.69-101.
36. Rodrigues, L.M.R.; Almeida, I.M.G.; Patrício, F.R.A.; Beriam, L.O.S.; Maciel, K.W.; Braghini, M.T.; Guerreiro Filho, O. Mancha aureolada do
cafeeiro causada por Pseudomonas syringae pv. garcae. . Boletim Técnico IAC, Campinas, v. 1, n. 212, p.1-24, 2013.
37. Roham, R.; Pirdashti, H.; Yaghubi, M.; Nematzadeh, G. Spatial distribu-tion of nutsedge (Cyperus spp. L.) seed bank in rice growth cycle using geostatistics. Crop Protection, Amsterdam, v.55, n.1 , p.133-141, 2014.
38. Romeiro, R.S. Bactérias fitopatogênicas. Viçosa: Imprensa Universitária/UFV, 2005. 417p.
39. Scott, J.B.; Gent, D.H.; Pethybridge, S.J.; Hay, F.S. Spatiotemporal charac-terization of sclerotinia crown rot epidemics in pyrethrum. Plant Disease, St. Paul, v.98, n.2, p.267-274, 2014.
40. Uchôa, C.D.N.; Pozza, E.A.; Pozza, A.A.A.; Moraes, W.D.S. Modelagem geoestatística da sigatoka-negra e sua relação com a fertilidade do solo. Bioscience Journal, Uberlandia, v.27, n.3, p.357-362, 2011.
41. Wallace, M.K.; Hawkins, D.M. Applications of geostatistics in plant nem-atology. Journal of Nematology, Rockville, v.26, n.4S, p.626, 1994.
42. Warrick, A.W.; Nielsen, D.R. Spatial variability of soil physical properties in the field. In: Hillel, D. Applications of soil physics. New York: Academic Press, 1980. p.319-344.
43. Zoccoli, D.M.; Takatsu, A.; Uesugi, C.H. Ocorrência de mancha aureolada em cafeeiros na Região do Triângulo Mineiro e Alto Paranaíba. Bragantia, Campinas, v.70, n.4, p.843-849, 2011.
44. Zucoloto, M.; Lima, J.S.S.; Coelho, R.I. Uso da geoestatística na probabi-lidade de ocorrência do Mal-do-Panamá em bananeira prata anã. Revista Facultad Nacional de Agronomía Medellín, Medellín, v.62, n.1, p.4793-4796, 2009.