Embed Size (px)
Citation preview

Attachment 1
Georgia Quality Management System
Year 4 Annual Report
July 2011 – June 2012
Produced by Delmarva Foundation
Submitted The Georgia Department of Developmental Disabilities
August 31, 2012

GQMS Year 4 Annual Report 1st Submission
July 2011 – June 2012
________________________________________________________________________________________________
Delmarva Foundation August 31, 2012 2
Table of Contents
Introduction .................................................................................................................................................................. 4 Section 1: Significant Review Activity and Accomplishments ............................................................................ 6
Training Updates ..................................................................................................................................................... 6 Quality Improvement (QI) Councils ................................................................................................................... 7
Joint Statewide and Regional QI Council Meeting ....................................................................................... 7 Region 1 ............................................................................................................................................................... 8 Region 2 ............................................................................................................................................................... 8 Region 3 ............................................................................................................................................................... 9 Region 4 ............................................................................................................................................................... 9 Region 5 .............................................................................................................................................................10 Region 6 .............................................................................................................................................................11 Statewide QI Council ......................................................................................................................................11
Person Centered Review (PCR) Updates ..........................................................................................................12 Quality Enhancement Provider Review (QEPR) Updates ............................................................................13 Critical Incident Reporting (ROCI) ...................................................................................................................13 Human Rights Council (HRC)............................................................................................................................13 Mortality Review Update .....................................................................................................................................14 Website Development and Updates ..................................................................................................................14 Follow up with Technical Assistance Consultation (FUTAC) ......................................................................16 Quality Assurance .................................................................................................................................................17
Status Meetings .................................................................................................................................................17 Staff Meetings/In-service ...............................................................................................................................17 Inter Rater Reliability (IRR) ...........................................................................................................................19 Report and Process Oversight .......................................................................................................................19 Data Correction Process .................................................................................................................................20
Feedback Surveys ..................................................................................................................................................20 HSRI Feedback Survey for NCI Consumer Survey Process ....................................................................20 QEPR and PCR Feedback Surveys ...............................................................................................................21
Miscellaneous Accomplishments........................................................................................................................21 Contract Amendment......................................................................................................................................21 New ISP Process and Template ....................................................................................................................21 Staffing Updates ...............................................................................................................................................22 Collaboration Efforts ......................................................................................................................................22 International Organization for Standardization (ISO) Audit ...................................................................23
Section 2: Data Analysis and Results .....................................................................................................................24
Samples ...................................................................................................................................................................24 Data Presentation ..................................................................................................................................................24 General Demographic Characteristics ...............................................................................................................26 PCR and QEPR Combined Results ...................................................................................................................28
Individual Interview Instrument (III) ...........................................................................................................28 Individual Support Plan Quality Assurance (ISP QA) Checklist .............................................................34 Provider Record Review (PRR) .....................................................................................................................42 Staff/Provider Interviews ...............................................................................................................................47 Observations .....................................................................................................................................................49
Person Centered Review Results ........................................................................................................................51 Support Coordinator Record Review (SCRR) ............................................................................................51

GQMS Year 4 Annual Report 1st Submission
July 2011 – June 2012
________________________________________________________________________________________________
Delmarva Foundation August 31, 2012 3
Comparison of PCR Components ................................................................................................................56 NCI Consumer Survey Results for Focused Outcome Areas .......................................................................57 Quality Enhancement Provider Review ............................................................................................................59
QEPR Administrative Review .......................................................................................................................60 Strengths and Barriers ..........................................................................................................................................62 Decline codes .........................................................................................................................................................64 Follow-Up Reviews ..............................................................................................................................................64
Follow-up with Technical Assistance ...........................................................................................................64 Follow Up with Technical Assistance Consultation (FUTAC) ................................................................66
Focused Outcome Recommendations ..............................................................................................................68 Individuals Recently Transitioned to the Community (IRTC) ......................................................................69
Section 3: Discussion and Recommendations .....................................................................................................71 Attachment 1: Overview of Delmarva Processes ................................................................................................76

GQMS Year 4 Annual Report 1st Submission
July 2011 – June 2012
________________________________________________________________________________________________
Delmarva Foundation August 31, 2012 4
Introduction
Delmarva Foundation provides quality assurance for services provided to individuals with developmental
disabilities, utilizing processes developed to meet the specific needs of each unique state program, and
adhering to Delmarva’s mission and vision.
Mission: Promoting a person directed service delivery system through collaborative quality
improvement strategies designed to enhance people’s lives.
Vision: A globally recognized leader in advancing the quality of people’s lives through
enhancement of community support systems.
July 1, 2011, marked the beginning of the fourth year of the contract with the Georgia Division of
Developmental Disabilities (Division of DD) to provide quality assurance for the system that provides
services to individuals with Developmental Disabilities served through the Medicaid Waivers and Grant
In Aid (GIA, state funding). Currently two Waivers are offered, the New Options Waiver (NOW) and
Comprehensive Supports Waiver (COMP), each of which includes an option for self directed services.
Delmarva subcontracts with the Human Services Research Institute (HSRI). HSRI was instrumental in
the development of the National Core Indicators (NCI) surveys used to interview individuals served
through the GA program, and the NCI mail-out surveys that are used to collect information from
families and guardians as well as administrative information from providers on staff turnover rates. The
NCI data are collected in over 25 states so national averages can be used to compare Georgia’s
performance with a national benchmark.1
Person Centered Reviews and Quality Enhancement Provider Reviews are used to assess the extent to
which individuals are satisfied with their services and achieve outcomes that are important to them, and
to monitor provider systems.2 This report details Delmarva activities for the fourth year of the contract
(July 2011 - June 2012) with overall trends compared to previous years as appropriate (July 2008 – June
2011). The first section presents Significant Review Activity and Accomplishments that occurred
during the quarter, including:
1 The number of participating states changes from year to year. 2 See Attachment 2 for a brief description of each review process. More complete information is available on the Georgia Quality Management System web site (http://www.dfmc-georgia.org/person_centered_reviews/index.html). See Appendix II for all tools.

GQMS Year 4 Annual Report 1st Submission
July 2011 – June 2012
________________________________________________________________________________________________
Delmarva Foundation August 31, 2012 5
Training Updates
Quality Improvement Councils
Person Center Review Updates
Quality Enhancement Provider Review Updates
Human Rights Committees
Web Development and Updates
Performance Measures
Quality Assurances
Feedback Surveys
The second section presents Data Analysis and Results including demographic characteristics of the
Person Centered Review participants and Quality Enhancement Provider Review sample, findings from
Person Center Reviews, findings from Quality Enhancement Provider Reviews and comparisons across
various review components. Results are presented Year to Date. The third section, Discussion and
Recommendations, is a discussion of key findings and interpretations of results, and recommendations
offered to the state.

GQMS Year 4 Annual Report 1st Submission
July 2011 – June 2012
________________________________________________________________________________________________
Delmarva Foundation August 31, 2012 6
Section 1: Significant Review Activity and Accomplishments
Training Updates
The training and education plan for 2011-2012 was approved in August 2011. Thirty training sessions
were presented throughout the State, on the following topics: Documentation 101, Health Risk
Indicators, Safety Beyond the Basics, and Communication Alternatives. A total of 1,110 participants
attended the sessions. A summary of each training module are identified below:
Documentation 101 Template training module was originally developed in December 2010 and
revised in June 2011 to assist providers in utilizing documentation templates designed to meet
various requirements in the waivers. The templates help providers capture daily notes, weekly
notes and monthly quality assurance tracking for services and supports provided to individuals
being served. Documentation 101 offered during Year 4 was a continuation of the 2010-2011
training plan module, as requested by stakeholders. Six sessions were completed and a total of
273 participants attended.
Health Risk Indicators’ module was presented by Linda Tupper, Delmarva’s RN, CDDN. The
goal of the training was to provide education on common health risks for individuals with
intellectual and developmental disabilities. It was designed to assist in the identification of health
concerns encountered to improve supports and the wellbeing of individuals served and the
quality of healthcare management in general. Medications, interactions and potential side effects
were covered as part of this training. This six session series had a total of 126 participants.
Safety Beyond the Basics’ module was designed to encourage participants to think beyond the
minimal requirements of keeping people safe. Tools, resources and supports in relation to safety
and self preservation were provided to enhance services and supports in this area. A total of
354 participants attended 12 sessions throughout the state.
Communication Alternatives’ module was designed to assist providers and support coordinators
in supporting people who have alternative communication styles. Information examined ways to
help people with alternative communication styles have a voice. There were six sessions of this
module and a total of 357 participants.
After each training session, evaluations were provided to the participants. The results below show the
vast majority of participants were pleased with the training provided and felt it was useful, worthwhile,
clear and concise.

GQMS Year 4 Annual Report 1st Submission
July 2011 – June 2012
________________________________________________________________________________________________
Delmarva Foundation August 31, 2012 7
GQMS Training Evaluation Survey
Results by Element (Number of Responses)
July 2011- June 2012
Quality Improvement (QI) Councils
Joint Statewide and Regional QI Council Meeting The statewide meeting was held September 27 and 28, 2011. On the morning of the first day there was a
pre-meeting attended by self advocates, family members, regional staff, providers, support coordinators,
and Delmarva staff. The agenda for the day was reviewed, including what to expect and everyone’s role.
The joint meeting opened with a welcome from Eddie Towson. Val Bradley presented 2009-2010 NCI
data and Sue Kelly presented information from Delmarva reviews.
QI Councils made a presentation of their improvement projects and members received recognition of
appreciation from the Division. Two special awards were presented to Region 1 and Region 2 for their
projects. The regional data packets were given to the Councils on the first day to provide them an
opportunity to review the data before meeting as a group the next day to begin work on new projects. A
tutorial was given on how to utilize the QI Council portal and the meeting was wrapped up by Eddie
Towson.
97.5%
98.1%
97.5%
99.4%
98.4%
99.2%
96.8%
96.2%
96.4%
88.7%
0% 25% 50% 75% 100%
Useful content (529)
Clear, concise (521)
Presentation style (519)
Presentation organized (526)
Discussion encouraged (515)
Ample time (517)
Better understanding (529)
Useful information (527)
Worthwhile experience (523)
Do not change or change (514)

GQMS Year 4 Annual Report 1st Submission
July 2011 – June 2012
________________________________________________________________________________________________
Delmarva Foundation August 31, 2012 8
The next Joint QI Council Meeting is scheduled for October 3 and 4, 2012, in Macon. The first planning
meeting is scheduled for August 21. A hotel and rooms have been reserved.
Region 1
The QI Council completed the 2011-2012 contract year with a full council membership and several
advisory members. They have a very dedicated membership, who has committed countless hours towards
their initiatives. Upon review of the annual data, the Council chose to develop a health forum to share
information to individuals and family members as their annual initiative/project. It was decided the
forum would be piloted in one county and if successful, would be offered throughout the region. The
focus of the forum is preventative healthcare, nutrition, dental services and eye care. Members solicited
health care professionals within the identified county to be involved and they also spread the word to
families, individuals and others who would benefit from participating. Regional staff were also solicited
to participate. The first health fair will be August 11, 2012 in Douglas County. Several partnerships have
been identified including: Douglas County (DC) Special Olympic Therapeutic Board, the DC Disabilities
Coalition, DC Schools, and Georgia Therapy Moms. The council has established a connection with the
local news Channel 23 and will also be working with the DC Church Coalition to ensure adequate
exposure for the event.
The council has also been addressing concerns about the HRST completion results and other
preventative healthcare not being completed within the region. Therefore, a request has been submitted
and approved for an ad-hoc report specific to health outcomes.
This year, the council continued its quarterly newsletter to communicate with stakeholders on specific
targeted topics, for instance nutrition. Also, the Council’s facebook page is up and running and is being
maintained by a self-advocate on the Council and his direct support staff.
The council’s next initiative is to focus on providing additional information to all stakeholders, on health
related needs throughout their region, in order to improve the quality of healthcare for individuals. This
will be accomplished through, provider meetings, the newsletter and their facebook page.
Region 2
During FY 2012, the Region 2 QI Council met each quarter. The Council focused on the next phase of
the My HELPS Profile, which entailed formatting the profile into a pocket sized card. Individuals will
have the opportunity to carry the profile in their pocket or wallet and enhance their safety in the
community. Along with reformatting the My HELPS Profile, a provider in Region 2 volunteered to pilot
the use of the My HELPS Profile along with a ―GO BAG.‖ The intent is to help individuals complete a
My HELPS Profile, obtain a GO BAG and have it ready to go with items necessary to assist them in an
emergency situation. Based on the provider’s feedback, the pilot was successful.
GQMS Year 4 Annual Report 1st Submission
July 2011 – June 2012
________________________________________________________________________________________________
Delmarva Foundation August 31, 2012 9
The QI Council’s next initiative involved the development of a training module on Abuse, Neglect and
Exploitation for individuals within the region and for possibly adopting throughout the state. This
project is titled the ―ANE‖ project. The Council has developed an interactive abuse, neglect and
exploitation training module that captures real life scenarios through storyboard videos and is planning to
premier the training during the joint regional and statewide QI Council meeting in October. The QI
Council will also present the final product of the My HELPS Profile and GO-BAGS at the statewide QI
Council meeting. The Council continues to support the Region and other regions in the state with
obtaining the My HELPS Profile and GO-BAGS.
Region 3
The Region 3 Council met 8 times this year. Based upon the annual data from 2010-2011, the Council
decided they wanted to tackle the issue of low scores related to community integration and connections.
One of the barriers they identified was the lack of awareness of the available resources in the Region for
individuals and families to tap into. Another barrier identified was the lack of money for community
outings. Therefore, the Council’s project focused on developing a community resource guide in an effort
to improve community integration throughout Region 3.
The Council spearheaded their initiatives by gathering provider, family and self advocate data related to
community interests via surveys which were distributed in various methods. Upon gathering the survey
data from various entities, the council compiled a comprehensive list of resources and created a resource
guide in a brochure format. The council distributed the resource guide at the Region 3 Provider Fair in
Duluth, Georgia and added the PDF version on the Region 3 DBHDD website. They also plan on
presenting at the Region 3 Provider meeting in September 2012 on how to use the resource guide in
order to enhance community integration using free to low cost resources.
The Region 3 council elected a new co-chairs and new members joined this year. Currently, there is one
vacant seat for a self advocate. The Council members are pursuing leads for the membership seat and will
review candidates in October 2012.
Region 4
At the beginning of this year, the Region 4 QI Council finished up the initiative to develop methods to
better support direct support staff, with the goal of improving morale and the quality of services. The
Council met on August 4, 2011, and prepared information on best practices related to improving morale
and presented this information at a provider meeting. The members also met on September 19, 2011, to
finalize this project and prepare to present it at the Statewide QI Council meeting held in September.

GQMS Year 4 Annual Report 1st Submission
July 2011 – June 2012
________________________________________________________________________________________________
Delmarva Foundation August 31, 2012 10
Based upon the annual data presentation at the joint statewide QI Council meeting in September, the
Council met in November and began to formulate a focus for the current year’s project. Several ideas
were discussed by the members but all centered around utilization of a person centered approach to
services and how providers could support one another in this area through the use of sharing best
practices and success stories. They met on January 5, 2012, and developed a quality improvement plan
with a focus on continuing to promote person centered practices through the use of person centered
thinking tools. In order to do so, the council decided to collaborate with the Regional office who was
conducting direct support staff training every other month and focusing on health and safety. The
Council felt this would be a perfect opportunity to target person centered thinking training using the
person centered thinking tools. In these training sessions, providers were shown how to use person
centered thinking tools to support and maintain a person’s health and safety in the community. They met
again on April 11, 2012 and to help measure the effectiveness of this project decided to develop a survey
to be presented to training participants. The survey was developed and once finalized will be distributed.
The data will be analyzed and presented at the next joint Regional and Statewide QI Council meeting
scheduled for October 2012.
Region 5
The fiscal year 2011-12 the Region 5 QI Council initiatives were the following:
Conduct a provider fair,
Develop a FaceBook social networking web-page,
Provide providers training to develop their own one-page profiles for their agencies, and
Develop a resource tool kit for regional stakeholders (individuals, families, providers and support
coordinators).
The Region 5 QI Council’s FaceBook page is up and running; however, there has been little activity
partially because state and provider employees’ information technology departments restrict access to
social networking sites. During May 2012, providers were trained to complete 1 page profiles for their
own organizations during a Region 5 Provider Meeting. It is hoped providers will be completing/
refining these profiles soon and sharing the results with the Region 5 QI Council so their profiles may be
added to the Region 5 QI Council FaceBook page. The Resource Tool kit is essentially complete;
however, the team has experienced challenges within the last quarter of fiscal year 2012; e.g., loss of the
council chair person, self advocates and a family advocate. Due to reallocation of social worker duties,
on-going Person Centered Thinking training planned for the region with providers who had received the
training the previous year did not occur. Finally, the council successfully sponsored the Region 5
Provider fair on 6/30/2012. Initially, due to difficulties securing a venue, the event had been postponed
to occur during FY 2012-13; but DBHDD then mandated the activity for all regions. Fortunately, this
new expectation allowed the council to secure space at Georgia Regional Hospital at Savannah.

GQMS Year 4 Annual Report 1st Submission
July 2011 – June 2012
________________________________________________________________________________________________
Delmarva Foundation August 31, 2012 11
The Region 5 Provider Fair was a success. Initial estimates are 30 providers participated along with 50 or
more individuals and family members. Individuals and families were afforded opportunities to speak to
Regional DBHDD staff and providers about the supports and services available and waiver application
packets were also made available.
Region 6
The Region 6 QI Council members decided that their goals and efforts for the new fiscal year would be
based on more community outreach and education. The Region 6 QI Council met on November 4, 2011
and decided that in addition to developing a list of organizations, businesses and institutions, a letter
advising of whom the Council is and its purpose should be drafted and presented to the Council for
approval. The approved letter would be dispersed to all applicable parties. Regional staff took on the
task of developing the letter and presenting a draft to the Council at the next scheduled meeting. The
Council also agreed to present the list of potential organizations, businesses and institutions at the next
scheduled meeting in February. An email ―blurb‖ for Council members to use when making phone
contact with organizations, businesses and institutions regarding advising who the Council is and its
purpose was developed. Each Council member took on a county to contact organizations in that area.
The Region 6 QI Council met on February 10, 2012 and the Council confirmed the letter advising of
whom the Council is and its purpose would be confirmed and ready for submission by March 2012. It
was not determined how the letter would be printed and distributed due to budgetary constraints. The
Council met again on June 15, 2012 in Columbus, GA. Participation for this meeting was very low so the
Council discussed the idea of conducting meetings virtually and on a monthly basis. Discussion around
the distribution of the letter was revisited. It was confirmed that the letter would follow the initial call to
identified community organizations, via email. It was decided that electronic submission of the letter was
most economical. The Council also discussed the sharing of community contacts to ensure there would
be no duplication of contacts occurring. The Council confirmed the initiation of monthly, virtual
meetings and quarterly face-to-face meetings which had already been implemented.
Statewide QI Council
The Statewide Council met August 9, 2011 and continued work from last year’s project on the Making It
Happen Blog. However, due to posting restrictions, it was decided to focus on developing a Facebook
page and therefore one was created to promote networking with Stakeholders. Later, the Statewide QI
Council met in December to discuss ideas developed at the joint statewide meeting in September. The
primary initiative focuses on supported employment and rates related to this and other community
services. Byron Sartin, the Provider and Employment Specialists for DBHDD, was asked to participate
and he shared several initiatives the state has related to becoming an Employment First state and possibly
applying to become a part of the Supported Employment Leadership Network, which provides technical

GQMS Year 4 Annual Report 1st Submission
July 2011 – June 2012
________________________________________________________________________________________________
Delmarva Foundation August 31, 2012 12
assistance. He also spoke about how the Georgia Council on Developmental Disabilities has a Business
Leadership Network and the Georgia Advocacy Office is utilizing an Employment First Grant.
The Statewide Council selected as a quality improvement initiative to work in supporting the Division of
DD’s employment initiatives. Council members met on February 7, 2012, and discussed some of the
major barriers and misconceptions about employment. In order to address some of the barriers related
to supported employment, several ideas including conducting an informational commercial on the topic
were discussed. A conference call was conducted on March 13, 2012, and based upon further discussion,
the council decided to develop a brochure and guide to be given to individuals and family members
regarding supported employment. In order to accomplish this goal, a sub-committee was formed to
develop these two informational tools.
The Council met on June 10th and was presented with draft versions of the brochure and supported
employment guide. They intend to continue working on these two resources into next year until
finalized.
Person Centered Review (PCR) Updates
Our contract for FY 2012 included 480 PCRs and the addition of 200 PCRs for people who recently
transitioned into the community from an institution. This type of PCR is titled Individuals who Recently
Transitioned into the Community (IRTC) PCRs and includes all of the same review activity of a PCR
with the exception of the National Core Indicator (NCI) Consumer Survey. This is not conducted
because the sample for the IRTC PCRs is not random. Also, in relation to the sample this year, in the
latter part of this year, the Division’s contract manager advised that individuals admitted into the hospital
on TICs should not be included in the IRTC sample. From that point forward, these individuals were
removed from the sample. At the end of the year, the Division’s contract manager requested all IRTC
reports be completed by June 30th so the reports can be reviewed as part of the DOJ Settlement
Agreement annual report. This was accomplished.
An internal PCR workgroup was developed this year. The focus of this work group will be on PCR
process and tool enhancement. The workgroup kicked off in February 2012. The group identified areas
where the PCR process could be streamlined, for example: possibly combining the III and Staff Provider
Interview tools, rewording the questions within the III to better capture more person centered
information and creating efficiencies within the PCR process. To better collaborate with providers a
large PCR sample selected, Delmarva implemented a new process which consisted of meeting with the
provider to develop a ―Delmarva‖ calendar to schedule out he PCRs for the year. This helps streamline
the process and eliminate any added complications. Additionally, the contract manager advised director
that he would like for follow up reviews to be completed on 20 randomly selected IRTC individuals. A

GQMS Year 4 Annual Report 1st Submission
July 2011 – June 2012
________________________________________________________________________________________________
Delmarva Foundation August 31, 2012 13
total of 480 PCRs, 480 NCI surveys and 203 IRTCs were completed, thus meeting the contract
deliverables for FY 2012.
Quality Enhancement Provider Review (QEPR) Updates
During the FY2012, the team successfully completed 40 Quality Enhancement Provider Reviews
(QEPR) and 34 Follow Up with Technical Assistance reviews based upon the QEPR. Three providers
originally selected as part of the sample were replaced due to Moratorium /Special Review status deemed
by the Division of DD.
An internal QEPR Workgroup worked this year on developing a strategic plan that encompassed
streamlining current processes and identifying additional supports for providers. New forms were
developed to enhance the QEPR process and to incorporate additional person centered practices into the
QEPR process. A ―What’s Working‖ tool was designed to assist providers with identifying specific
components of their service delivery system that are working, as well as, identifying areas of
improvement. Consultants began utilizing this tool as well as a strategic planning tool to support
providers to develop an action plan to enhance the quality of their service delivery system since
December 2011. In addition to the new tools, a PCR/QEPR initial contact letter was developed and
introduced to the process for FY 2013. The letter was designed to guide all stakeholders through the
PCR and QEPR process. Additionally, the QEPR Initial Contact Script was revised as well as the QEPR
policy and procedures. All modifications to procedures, tools and the letter were approved by the
Division of DD.
Critical Incident Reporting (ROCI)
This year, the contract manager decided that only 2 ROCI reports would be completed due to the limited
data generated on a quarterly basis. The first ROCI report was submitted on March 14, 2012. The
Critical Incident Report for incidents occurring between July 2011 and June 2012 will be completed in
September 2012. The Division now has the resources to analyze the ROCI data internally. Therefore,
the next report will be the final one completed by Delmarva.
Human Rights Council (HRC)
Several training sessions were facilitated by and/or developed by Delmarva Foundation in collaboration
with HSRI for the Human Rights Council (HRC) members and included the following topics:
Experimental Research Guidelines
Psychotropic Medication Guide
Navigating the HRC Portal

GQMS Year 4 Annual Report 1st Submission
July 2011 – June 2012
________________________________________________________________________________________________
Delmarva Foundation August 31, 2012 14
Review of Behavior Support Plans for Rights Violations
The GQMS Project Director provided guidance to the new HRC Coordinator for the Division on the
functionality of the HRC and how to utilize the forms developed for their work.
The Statewide HRC met November 5th, February 4th and June 6th to review human rights cases related to
multiple psychotropic medications to determine whether chemical restraints were being used. HSRI
developed the review protocol, and decision and recommendation forms which were used to gather
initial information about the individuals and used during the meeting to document the HRCs discussion,
findings and recommendations.
Mortality Review Update
The scope of work related to mortality reviews centered on the design and development of procedures to
guide a mortality review committee. The Division of DD had developed a workgroup (which Delmarva
and HSRI were members) to do this work but due to competing priorities this year, no meetings were
scheduled. Therefore, we were asked not to complete any formal work in this area. However, any
directives, guidelines or information generated from the Center for Medicaid and Medicare Services
(CMS) were shared with the Division of DD.
Website Development and Updates
Based upon the new Standards for All Providers FY 2012, updated PCR and QEPR tools (Administrative
Policy and Procedures, Administrative Review Qualifications and Training) were developed and
implemented on July 1, 2012. Also based upon a stakeholder workgroup’s recommendations, the ISP
Quality Assurance Checklist was revised and uploaded to the GQMS website and implemented. The
PCR, QEPR and FUTAC applications were also updated to include the new tools.
The GQMS website was updated with new postings and includes the following:
New training announcements
New meeting minutes from the Statewide and Regional QI Councils
Revised review tools and procedures
The My HELPs Profile
The 3rd Annual Report
Regional and Statewide QI Council quality improvement project presentations
Updated contact information
New website resources
New best practices

GQMS Year 4 Annual Report 1st Submission
July 2011 – June 2012
________________________________________________________________________________________________
Delmarva Foundation August 31, 2012 15
New Feedback Survey for the review processes
Training modules including PowerPoint presentation and handouts
E-bulletins were sent to subscribers when major updates were made to the site, which included all of the
bulleted items above, with the exception of the new feedback survey.
For the Georgia Developmental Disabilities Provider Information Website, discussions and meetings
took place regarding its re-design. Division representatives, HSRI and Delmarva staff to brainstormed
on ideas including identifying indicators in data sets that lead to desired outcomes. This lead to the
possible recommendation that key indicators that impact outcomes favorably could be utilized on
provider report cards and posted to the public reporting website. Results from the study will be brought
back to a stakeholder workgroup in the next fiscal year for consideration in including as part of a
provider report card, scheduled to be implemented in FY 2013.
A redesign of the website was also conducted this year. The redesign focused on the presentation of
information. The modifications will provide a more simplified means of sharing information about
services provided by the state to individuals and family members. It will also be more user friendly and
visually appealing. These modifications were ―mocked up‖ and presented to the Division who approved
the modifications which will take place in FY 2013.
This website continues to be maintained, particularly related to the login component. As of the end of
this year, 76 providers were registered on the site and had the capability of updating their information at
any time.
Delmarva also maintains several web-based portals used by external stakeholders such as the QI
Councils, the Human Rights Council, and the FUTAC workgroup. These are updated as necessary and
continue to be effective conduits for users to communicate.
A new Zoomerang feedback survey was created which combined each of the review types (PCR, QEPR,
and FUTAC) so these data could be presented aggregately. Also, the new survey was designed to be
more person-centered.
Several quality improvement updates were made to the review process applications including the
following:
Red Alert identifiers in the applications so they are more easily identified in the data.

GQMS Year 4 Annual Report 1st Submission
July 2011 – June 2012
________________________________________________________________________________________________
Delmarva Foundation August 31, 2012 16
Correction and Reconsideration functions were tested and added to the PCR application.
A checkbox to identify if a PCR was for an individual who had recently transitioned from the
institution was added to the identifying page.
A review ID number search function was added to the PCR and QEPR browser screen to access
reviews easier.
Modifications were made in the PCR browser screen to help easily identify PCRs that are
conducted for an Individual Recently Transitioned into the Community (IRTC).
Modifications were made in the FUTAC application to identify if an individual level FUTAC was
conducted with recently transitioned person. This information was also incorporated into the
FUTAC browser screen for easier identification.
Modifications regarding the FUTAC browser was revised to make it more user friendly for both
external (Regional Health Quality Managers) and internal users.
The report management system to track FUTAC production was also modified to include more
identifying information.
The system continued to generate the PCR, QEPR and FUTAC reports. Based upon feedback from
Regional staff, these reports were modified this year to include a legend and wording related to
recommendations were also changed.
Follow up with Technical Assistance Consultation (FUTAC)
It was learned early in the year the referral process required some adjusting and as a result an internal and
external FUTAC workgroups were created. The FUTAC workgroups consisted of stakeholders such as
Division staff, Providers (large and small), Support Coordination, Delmarva Consultants/Regional
Manager, Developmental Disability Regional Service Administrators, Health Quality Managers (HQM)
and Delmarva Technology staff. The workgroups evaluated the process, systems and reporting. Based
upon their discussions, recommendations on how to enhance the processes affording more efficiency but
still meeting the needs were developed. This external workgroup met several times first and their
recommendations and ideas were shared with the internal workgroup to develop solutions based upon
the new ideas and recommendations. The workgroup attained the goal of enhancing and/or improving
FUTAC reports and processes based on direct feedback from stakeholders. Direct outcomes included
modifications to the FUTAC criteria, the FUTAC reports generated and system/application upgrades. In
addition, quality assurance practices were adopted for the FUTAC reports and report writing process.
Further exploration of practices, revealed that FUTAC referrals based upon 3 and 4 support
coordination ratings should be ―triaged‖ by the HQMS to assess the appropriateness of the referral. As a
result, these FUTAC referrals are now submitted to Delmarva on a monthly basis, only after a Regional

GQMS Year 4 Annual Report 1st Submission
July 2011 – June 2012
________________________________________________________________________________________________
Delmarva Foundation August 31, 2012 17
HQM has determined that technical assistance is required. In addition, critical incident referrals are now
generated by the FUTAC Manager if there are within a six month time period three to six ―closed‖
critical incidents relating to the same issue(s) for the same provider or same individual.
Another change that took place as a result of the workgroup’s suggestions was for providers who wanted
technical assistance but had already received a QEPR and a 90 day Follow Up with Technical Assistance
would be eligible for a FUTAC. In addition, new providers, within the preceding 12 month period, who
had not gone through certification would also be eligible for FUTACs but only after verification of non
certification was confirmed by the Division of DD Certification Department. All changes were approved
by the Division within the fiscal year. These have streamlined practices and generated efficiencies within
the FUTAC process and system while still meeting the needs for remediation of issues and concerns
Quality Assurance
Delmarva uses various methods to help ensure provision of effective and efficient QA processes that
respond to the needs of the state while maintaining standards for providers that result in continuous
improvement to the service delivery system.
Status Meetings
Delmarva continues to facilitate monthly status meetings to bring together representatives of the state
(Eddie Towson and others as needed), HSRI, and the Delmarva Director, managers, scientist and IT
manager. These meetings are a forum to provide updates on the Delmarva processes and changes in the
Division of DD, progress reports on various components of the GQMS contract, as well as discussion
on any problems or issues that may need to be addressed. Status meetings were held on July 13, August
24, September 14, October 27, November 16, December 14, January 13, February 24, March 14, April
20, May 15 and June11.
Staff Meetings/In-service
Staff meetings are conducted every two weeks with consultants and managers. The meetings are used to
continue to enhance communication among the key Delmarva QA staff: the director, managers, QICs,
and the lead analyst for the project. The meetings provide an informal forum for discussion of best
practices and problems/challenges QICs encounter in the field. Training on different areas of need may
also be presented, as well as updates to policy and procedures. In addition, consultants may present on
external training they have attended. Consultants shared on following topics:
Assistive Technology and Environmental Accommodations,
Individual Service Planning for Persons with Developmental Disability Diagnosis: Incorporating
the New Waivers, Support Intensity Scale and Person Centered Action Planning,
Documentation 101

GQMS Year 4 Annual Report 1st Submission
July 2011 – June 2012
________________________________________________________________________________________________
Delmarva Foundation August 31, 2012 18
Functional Analysis and Treatment of Severe Behavior Disorders
Behavior 101 Seminar Series: Safety Planning and Staff Training for Developmental Disability
Behavioral Professionals,
Social Connections and Goals to Action
Division of Developmental Disabilities Statewide Behavior Analysis Conference
Psychotropic Medications Training
Families One Page Profile Training
Provider One Page Profile Training
Also, throughout the year, the Georgia GQMS staff attend face to face in-service training. These
sessions are based upon analysis and trends identified through internal quality assurance processes and
anecdotal data gathered from the consultants. This year’s in-service training topics included:
Implementation of Person Centered Practices,
Route Cause Analysis Training,
Quality Enhancement Provider Review,
Georgia Crisis Response System (DBHDD staff presenters),
Public Speaking,
ISO Policies,
ISO Core Corporate Procedures Overview:
o DFMC Control of Records,
o DFMC Control of Non-conforming Product,
o DFMC Corrective Action,
o DFMC Preventative Action,
o DFMC Internal Audit,
o DFMC New Procedure Development,
o DFMC Procedure Revision or Review,
o DFMC QMS Subcontractor Oversight,
o DFMC Contract Implementation,
o DFMC Customer Complaints, OPI, Non-conformity Tracking,
o DFMC Purchasing,
o DFMC Orientation and Training
o DFMC Control of Documents
Understanding Sample Selections,
Process Mapping (QEPR, PCR, FUTAC and Person Centered Tools),

GQMS Year 4 Annual Report 1st Submission
July 2011 – June 2012
________________________________________________________________________________________________
Delmarva Foundation August 31, 2012 19
Strategic Planning,
Confidentiality,
Individual Support Plan Quality Assurance Checklist
Team Building, Conflict Resolution and Communication Skills
Questions and answers regarding a wide variety of topics are regularly uploaded to the GQMS portal and
available for all consultants and managers to reference. This is designed to help consultants with
frequently asked questions, sharing updates on procedures and available resources.
Inter Rater Reliability (IRR)
During fiscal year 2011-2012, all regional mangers and eligible consultants successfully completed inter-
rater reliability (IRR) for the tools related to the PCR, QEPR and FUTAC activities. All consultants
achieved a passing score of 80 percent or better on their first test. Throughout the year, to help maintain
reliability among the consultants, Timothy Coons (Regional Manager) distributes trivia questions and
scenarios to Quality Improvement Consultants. Consultants score these independently and discussions
regarding the results occur during the staff meetings. Discrepancies in scoring are discussed, as well as
the technical assistance suggestions provided by the consultants. On average, consultants continue to
score scenarios in agreement with the management team.
In addition to formal reliability procedures, trivia and scenarios, as discussed above, are used to help
further ensure consistency in the processes. Scenarios consist of narratives about situations consultants
may face while conducting PCR, QEPR or FUTAC activities. The majority of results for each scenario
met expectations and was scored correctly.
Report and Process Oversight
All provider reports are reviewed by the Regional Manager before approved, posted, or sent to the
provider. Managers ensure determinations of the QICs are adequately supported with documentation
provided in the report as necessary. When questions arise, they are discussed with the QIC and
modifications made as necessary.
Regional managers continue to periodically accompany QICs on PCRs, QEPRs and FUTACs. They help
with the review process and also provide feedback, guidance, and training when appropriate.
On a monthly basis, the QA/QI regional manager reviews a list of all types of reports that have been
approved to ensure reports are correctly uploaded to the Regional Office portal site, the CIS (as
necessary) and on the Atlanta Office database. If any missing reports are identified, notification is sent to
the Administrative Assistant (AA) and posted to the appropriate site. The AA and QA/QI regional
manager determine the error to prevent it from occurring in the future. All reports for this year have
been posted accurately in the Georgia Reports portal (accessible to State and Regional staff) and to the
Consumer Information System (CIS).
GQMS Year 4 Annual Report 1st Submission
July 2011 – June 2012
________________________________________________________________________________________________
Delmarva Foundation August 31, 2012 20
Data Correction Process
Every 2 months, the analyst working with GQMS runs a report to identify any incorrect or missing data
from the database. This process generates a report from data collected as part of the PCR, QEPR and
FUTAC processes which is reviewed by managers, who correct any identified errors. In order to ensure
proper handling of possible missing data or data errors, a Data Correction Protocol has been developed
to track data errors and necessary correction. For approved reviews or reports, all changes in the data are
documented in the ―Reopen Review Log‖ section on the QIC portal. This information is reviewed
periodically by the QA/QI regional manager for possible trends. After the data in the report have been
corrected, a new report is generated and distributed as necessary.
These errors primarily consisted of discrepancies between the waiver identified on the demographics
page and the waiver indicated on the services page and demographic data for the individuals who
participated in the process, like missing home type or incorrect birth year (ex.: 2012). Total errors for the
year are as follows:
FUTAC – 5
QEPR – 11
PCR – 27
The majority of these errors did not require a new report to be generated for the review.
Feedback Surveys
HSRI Feedback Survey for NCI Consumer Survey Process
After each individual NCI interview, Delmarva provides the individual with a feedback survey. The
individual is encouraged to complete the feedback survey, which is mailed directly to HSRI. During the
Fiscal Year, July 2011 – June 2012, 70 surveys were returned to HSRI. A report of activity was submitted
to the Division of DD. A summary of findings indicates the following:
60 respondents (85.7%) participated in the Consumer Survey interview.
20 (28.6%) individuals filled out the feedback survey form and 37 (52.9%) forms were filled out
by a staff person at the service location.
46 interviews (65.7%) took place in the person’s home or day program and 40 individuals
(57.1%) indicated they had been asked where they would like to meet for the interview.
61 of the 67 respondents felt the interview was scheduled at a convenient time, 60 respondents
felt it took the right amount of time, and 57 of 66 respondents indicated they did not think the
questions were too difficult to answer.
59 of 67 respondents indicated the interviewer explained what the survey was about.
47 of 67 respondents (70.1%) indicated the reviewer explained they did not have to answer the
questions.

GQMS Year 4 Annual Report 1st Submission
July 2011 – June 2012
________________________________________________________________________________________________
Delmarva Foundation August 31, 2012 21
QEPR and PCR Feedback Surveys
After each QEPR, PCR, and FUTAC providers are given the opportunity to complete a survey about the
review process and the performance of the Delmarva consultant conducting the review. Delmarva
received 73 feedback surveys from providers who had participated in one of the review processes
between July 2011 and June 2012. Results are displayed in the following table, and are very positive.
Feedback Results
December 2011 –June 2012
Strongly
Agree/
Agree
Neither
Agree/
Disagree
Strongly
Disagree
/Disagree
The feedback you received will help you provide supports and services that meet desired outcomes of people supported. 66 2 0
The consultant(s) interacted with the people you support in a professional manner. 70 2 0
The consultant(s) interacted with you (and your staff) in a professional manner. 69 2 1
The consultation identified the strengths of your supports and services. 66 5 0
The consultation provided constructive feedback. 67 4 0
The consultation addressed the barriers, challenges, and/or needs of your supports and services. 68 3 0
You and your Delmarva consultant(s) brainstormed ways to enhance your services. 67 4 1
The consultant(s) facilitated an environment which was collaborative and positive. 69 2 0
You would contact your Delmarva consultant(s) for more brainstorming and technical assistance. 64 7 2
Miscellaneous Accomplishments
Contract Amendment
The Division of DD requested an amendment to reduce the funding for this year’s contract by $300,000.
This is to support the budget deficit for the State. The amended contract included a reduction in the
range of FUTACs to be completed from 300-500 to 200-400. Also, training and education sessions were
reduced to 30 per year. The contract amendment was submitted to the Division of DD approved on
May 17, 2012.
New ISP Process and Template
On January 4, 2012, members of the ISP Workgroup (consisting of 29 different stakeholder
representatives) presented the new ISP format and process to the Division of DD staff on. Some
suggestions and recommendations were made by the group regarding the new process and template. On
February 2 and March1 members of the ISP Workgroup reviewed and discussed the recommendations
and met face to face to finalize the new ISP procedures and template, recommendations for policy

GQMS Year 4 Annual Report 1st Submission
July 2011 – June 2012
________________________________________________________________________________________________
Delmarva Foundation August 31, 2012 22
change, functionality of the electronic record, and recommendations for training the new process. These
finalized documents were submitted to the Division of DD on March 31.
Staffing Updates
Due to the contract amendment, reducing the funding, four open positions are not going to be filled.
During the year, three consultants (two full-time and one part-time) and one Regional Manager left
Delmarva. The Regional Manager position was filled and efforts to replace the other positions are being
pursued.
Collaboration Efforts
This year steps were taken to support increased communication and collaboration efforts with the State
and Regional operations. This included establishing quarterly meetings with the Regional Health Quality
Managers. The first meeting was held on March 9, 2012 and another conference call was conducted on
April 18, 2012. The purpose and intent of these meetings is to increase communication, develop
processes related to remediation efforts based upon the review activities (results of FUTACs, QEPRs and
PCRs) being conducted by Delmarva staff. The meetings allowed for open discussion and education on
the review processes and education on the Regional Office procedures. It also provides an opportunity
to obtain feedback and recommendations from them on the processes and systems. These were very
successful and will therefore be continued into the next fiscal year.
Another collaboration that occurred involved the State’s Certification Unit director. During the year,
scheduling conflicts between the QEPR and Certification Unit arose. Further, complaints on the
duplication of review activities between the two processes were also identified. Therefore, collaborative
processes were put into place to eliminate scheduling conflicts. Also, plans were made to modify the
QEPR process to exclude policy and procedure as part of the review process in the next contract year.
Monthly contact was made thereafter with the Compliance Unit Director to maintain this communication
and ensure the processes implemented continued to be effective.
Other collaboration efforts included a conference call on 11/2/2011 and a web-based meeting on
12/6/2011 with the Department of Community Health’s Program Integrity Unit to train them on the
new documentation templates and provide a review of the training given to providers on the templates.
This was to ensure they understood the intent of and the implementation of the documentation
templates in the NOW/COMP waivers. This would help prevent mixed messages or misinterpretation
from occurring that contradicted the training given to providers.
Delmarva staff also met on several occasions with the Division’s training director and staff to coordinate
training and education efforts in the State. Meetings were held with Division staff taking over training
modules originally developed and trained by Delmarva to ensure a smooth transition and provide any

GQMS Year 4 Annual Report 1st Submission
July 2011 – June 2012
________________________________________________________________________________________________
Delmarva Foundation August 31, 2012 23
suggestions for modifications to the modules. Also, Delmarva provided onsite support for staff when
first training the modules. The training modules included Documentation 101, Goals to Action and
Social Connections.
International Organization for Standardization (ISO) Audit
The Georgia office was involved in their first onsite ISO internal audit in November 2011. The results
were positive and the auditors were complimentary regarding the processes and procedures developed by
the Georgia team. A few areas were identified that need improvement: ensuring the format for
procedures is uniform; ensuring we change our policy before changing our practices; and changing our
confidentiality procedures to include shredding documents and the use of thumb drives. We also need a
mechanism to document our review of website functionality. Since the audit, each of these areas were
addressed and ensure they are corrected.
As part of the ISO process, the Georgia team continuously looks for opportunities for improvement and
immediately addresses any issues or concerns brought to our attention by external or internal
stakeholders. These are all tracked to resolution.

GQMS Year 4 Annual Report 1st Submission
July 2011 – June 2012
________________________________________________________________________________________________
Delmarva Foundation August 31, 2012 24
Section 2: Data Analysis and Results
Samples
The Georgia Quality Management System (GQMS) contract mandates that each provider rendering
services through the Medicaid waivers to individuals with developmental disabilities has one annual
review over the course of five years. Therefore, 40 providers are reviewed each year through the Quality
Enhancement Provider Review (QEPR) process (39 service providers and one support coordinator
agency). Providers to receive the QEPR are randomly selected each year and 480 individuals for the
Person Center Reviews (PCR) are randomly selected from the caseloads of the 39 service providers. The
PCR sample is stratified by region and providers, meaning providers are first randomly selected
proportionately from each region, and then individuals are randomly selected from those providers,
excluding individuals who have had a PCR.
For the QEPR process, a sample of individuals, excluding individuals who have had a PCR, is randomly
selected from the 39 service providers, with at least one and a maximum of 34 individuals per provider.
The sample is stratified by service to ensure all services are represented. In addition to the sample of
individuals for the QEPR, staff personnel records are reviewed for each service offered by the provider.
A random sample of staff rendering supports and services, including sub-contractors, is selected from a
list of all staff working with the provider. A minimum of two staff per service is selected, or 25 percent,
whichever is greater. A maximum of 30 records is selected for review. For Support Coordination, up to
30 records are randomly sampled from the support coordinators rendering services.
Data Presentation
Individuals from both the PCR and QEPR samples participate in the Individual Interview Instrument
(III) activity and Individual Support Plan Quality Assurance Checklist (ISP QA). Both processes also
include a Provider Record Review (PRR), Staff/Provider Interview (SPI), and Onsite Observations of
day and/or residential programs.
The PCR and QEPR also have some components that are specific to the review type. During the PCR, a
Support Coordinator Record Review (SCRR) is completed for the Support Coordinator working with the
individual. During the QEPR, each provider receives one Administrative Review, which includes two
review instruments: Administrative Qualifications and Training (A Q&T) and Administrative Policy and
Procedures (A P&P). The A Q&T includes a review of a sample of personnel records to determine if
staff has the necessary qualifications, specific to services rendered, and if the training was received within
required timeframes. The A P&P includes a review of organizational records to determine if policies are
in place and if procedures are delineated that are in compliance with state regulations.
In this report, data from the III, ISP QA Checklist, PRR, SPI and Observations are presented using
aggregate information from individuals who participated in a PCR or QEPR process.

GQMS Year 4 Annual Report 1st Submission
July 2011 – June 2012
________________________________________________________________________________________________
Delmarva Foundation August 31, 2012 25
Demographic characteristics are also presented for the combined sample of individuals. ―PCR Only‖
results include findings from the SCRR, comparisons across the different PCR tools and comparisons
across Quality Focus Areas. ―QEPR Only‖ results include provider specific scores for each QEPR
review component as well as findings from the Administrative Reviews.
In addition to the PCRs completed for the sample of individuals, as described above, Delmarva has
implemented processes to complete PCRs for Individuals Recently Transitioned to the Community
(IRTC) from an institutional setting. Many of these transitions are the result of an agreement between
the State of Georgia and the United States Department of Justice to accommodate individuals with
developmental disabilities to live in the community and to provide services necessary for them to do so.
Individuals from this transition process participate in all aspects of the PCR with the exception of the
NCI interview. IRTC findings are analyzed and presented separately from the findings for individuals
already established in the community.

GQMS Year 4 Annual Report 1st Submission
July 2011 – June 2012
________________________________________________________________________________________________
Delmarva Foundation August 31, 2012 26
General Demographic Characteristics
Information in Table 1 provides a general description of the 961 individuals interviewed through a
Person Centered Review (PCR, N = 480) or Quality Enhancement Provider Review (QEPR, N= 481)
process between July 2011 and June 2012. Table 1 also presents the demographic information for the 203
Individuals Recently Transitioned to the Community (IRTC) as part of the Olmstead settlement
agreement. The largest proportion of individuals interviewed to date resides in Region 3 for both the
PCR/QEPR and IRTC samples, 25.7percent and 34.5 percent respectively. Males continue to represent
a larger proportion of the sample, and this is even more pronounced for the IRTC sample. A far greater
proportion of individuals who transitioned from an institution are diagnosed with a profound intellectual
disability, 43.8 percent compared to 7.7 percent.
Table 1: Demographic Characteristics
July 2011 - June 2012
Region
PCR and
QEPR IRTC
1 167 17.4% 53 26.1%
2 139 14.5% 37 18.2%
3 247 25.7% 70 34.5%
4 128 13.3% 14 6.9%
5 144 15.0% 15 7.4%
6 136 14.2% 14 6.9%
Gender
Female 394 41.0% 73 36.0%
Male 567 59.0% 130 64.0%
Age Group
18-25 94 9.8% 18 8.9%
26-44 508 52.9% 62 30.5%
45-54 218 22.7% 57 28.1%
55-64 97 10.1% 43 21.2%
65+ 44 4.6% 23 11.3%
Disability
Autism 13 1.4% 3 1.5%
Cerebral Palsy 3 0.3% 0 0.0%
Intellectual Disability 871 90.6% 111 54.7%
Profound Intellectual Disability 74 7.7% 89 43.8%
Total 961 203
There are several different types of residences available for individuals who receive services through the
waivers. These are grouped into five categories (four plus other) and the percent of individuals living in
each type of residence is displayed in Figure 1. The largest proportion of individuals already established

GQMS Year 4 Annual Report 1st Submission
July 2011 – June 2012
________________________________________________________________________________________________
Delmarva Foundation August 31, 2012 27
in the community (52.5%) lived with a parent and approximately 30 percent lived in a group home.
However, a majority of the 203 IRTC residents lived in a Group Home (69.5%).
Figure 1: Percent of Individuals by Residential Type July 2011 – June 2012
Figure 2 shows the waiver information among individuals already established in the community. Most
individuals receive either the Comprehensive Support Waiver (COMP, 48.9%) or the New Option
Waiver (NOW, 35.8%). Waiver information for IRTC is shown because almost all receive services
through the COMP waiver (98.5%).
Figure 2: Percent of Individuals by Waiver Type July 2011 – June 2012
With Parents
Group Home
Own Place Host
Home Other
PCR+QEPR (961)
52.5% 29.9% 10.1% 6.7% 0.8%
IRTC (203) 3.0% 69.5% 2.5% 24.6% 0.5%
0%
25%
50%
75%
100%
15.3%
35.8% 48.9%
GIA (147) NOW (344) COMP (470)

GQMS Year 4 Annual Report 1st Submission
July 2011 – June 2012
________________________________________________________________________________________________
Delmarva Foundation August 31, 2012 28
PCR and QEPR Combined Results3
The purpose of the PCR is to assess the effectiveness of and the satisfaction individuals have with the
service delivery system. Delmarva Quality Improvement Consultants (QIC) use interviews, observations
and record reviews to compile a well-rounded picture of the individual’s circle of supports and how
involved the person is in the decisions and plans laid out for that person. The purpose of the QEPR is to
monitor providers to ensure they meet requirements set forth by the Medicaid waiver and Division of
DD and to evaluate the effectiveness of their service delivery system. In this section results from the
combined data for the III, ISP QA Checklist, PRR, Staff Interview and Observations are presented.
The number of activities for each component, by region and statewide, is presented in the following
table. Throughout this section results from previous years are presented when appropriate.4
Table 2: All review activities (PCR +QEPR) by Region
July 2011 – June 2012
Region
III/ISP QA
Checklist
Support
Coordinator
Record
Review
Provider
Record
Review
Staff/
Provider
Interview OBS
Admin
Review
1 167 68 246 147 118 7
2 139 80 205 140 126 4
3 247 146 391 276 249 14
4 128 67 198 114 80 5
5 144 98 175 137 101 4
6 136 55 199 113 101 6
Total 961 514 1414 927 775 40
Individual Interview Instrument (III)
Two different interview tools are used to collect information from individuals: the NCI Consumer
Survey and the Individual Interview Instrument (III or I3). The focus of the NCI survey is on the
system—the unit of analysis is the service delivery system. The focus of the III is the individual, if
desired goals and outcomes are being addressed through the service delivery system, including both paid
and unpaid supports and services. Together they help provide a clear picture of service delivery systems
and provider performance.5 The person’s participation in this process is voluntary and the Quality
3 Results from the IRTC reviews are presented separately at the end of this section. 4 Modifications to the PPR make it inappropriate to make comparisons to Years 1 and 2. 5 NCI results are reported separately in the Annual Report.
GQMS Year 4 Annual Report 1st Submission
July 2011 – June 2012
________________________________________________________________________________________________
Delmarva Foundation August 31, 2012 29
Improvement Consultant confirms whether he/she would like to participate before beginning the
interview.
The Individual Interview Instrument is comprised of 15 elements designed to evaluate individuals’
services and well being through nine different Expectations—each scored as Present or Not Present.
Quality Improvement Consultants use the III tool as a guide to determine if the expectations are being
met for the person interviewed. These are summarized below, with the number of elements included in
each Expectation given in parentheses.6
1. Involvement in Planning (2): Is the person involved in the development of his/her annual plan
and identification of supports and services? Does the person direct the design of the service
plan, identifying needed skills and strategies to accomplish desired goals?
2. Involvement in Development and Evaluation (1): Is the person involved in the development
and ongoing evaluation of supports and services? Does the person participate in the routine
review of the service plan and direct changes as desired to assure outcomes are achieved?
3. Meeting Goals and Needs (2): Is a personal outcome approach used to design person-centered
supports and services and assist the person to achieve personal goals? Is the person achieving
desired outcomes and goals, or receiving supports that demonstrate progress toward these
outcomes and goals?
4. Choice (2): Is the person afforded choices related to supports and services (paid and unpaid)
and is the person involved in life decisions relating to the level of satisfaction? Does the person
actively participate in decisions concerning his or her life? Is the person satisfied with the
supports and services received?
5. Health (1): Does the person feel healthy and does the person get to see a doctor when needed?
Are there things about the person’s health that could be better?
6. Safety (2): Consultant identifies the person’s knowledge of self preservation, what is done in
case of an emergency. Included in this expectation is if the person is free from abuse, neglect
and exploitation.
7. Rights (1): Is the person educated and assisted by supports and services to learn about rights and
fully exercise them, particularly rights that are important to that person?
8. Privacy/Dignity/Respect (2): Is the person treated with dignity and respect and are the person’s
privacy preferences upheld?
6 Go to Delmarva’s GQMS website for a detailed description of each expectation and the type of probes used to determine the appropriate outcome (http://www.dfmc-georgia.org/person_centered_reviews/index.html).

GQMS Year 4 Annual Report 1st Submission
July 2011 – June 2012
________________________________________________________________________________________________
Delmarva Foundation August 31, 2012 30
9. Community Involvement and Access (Community) (2): Is the person provided with
opportunities to receive services in the most integrated settings that are appropriate to the needs
and according to the choices of that person? Is the person also developing desired social roles?
Results for the III are presented by Expectation in Figure 3. Findings by year, for each of the 15
elements, are shown in Exhibit 5 of the Appendix. For the 916 interviews completed during the contract
year, the following findings are indicated:
On average, the III score was 90.1 percent, showing an increase each year since Year 1.
Individuals were most likely to indicate they have privacy, dignity and respect and health
outcomes present in their lives compared to all other expectations, 97.1 percent and 96.4 percent
scored as present respectively.
Compared to a three year unweighted average for Years 1 – 3, Year 4 results show an
improvement of five percentage points or more on nine of the 15 Expectations:7
o Involved in the design of the service plan (up 6 pts)
o achieving desired outcomes/goals (up 7 pts)
o actively participating in decisions concerning his or her life (up 10 pts)
o satisfied with the supports and services received (up 6 pts)
o healthy (up 6 pts)
o safe or has self-preservation skills (up 11 pts)
o educated and assisted to learn about and exercise rights (up 7 pts)
o has opportunities to access and participate in community activities (up 6 pts)
Individuals were least likely to be involved in the review of their supports and services (80.0%)
or have community access and involvement (81.1%).
Results at the element level (Exhibit 5 of the Appendix) indicate over a quarter of the individuals
interviewed to date were not developing desired social roles.
7 The unweighted average is an average of the percent met for each year.

GQMS Year 4 Annual Report 1st Submission
July 2011 – June 2012
________________________________________________________________________________________________
Delmarva Foundation August 31, 2012 31
Figure 3: Individual Interview Instrument (III) Percent Present by Expectation (N=713)
July 2011 – June 2012
83.2%
85.7%
86.3%
90.1%
81.1%
97.1%
83.4%
94.6%
96.4%
95.4%
89.5%
80.0%
88.0%
0% 25% 50% 75% 100%
Year 1
Year 2
Year 3
Year 4
9. Community involvement and access
8. Privacy, Dignity, Respect
7. Rights
6. Safety; free from abuse and neglect
5. Health
4. Choice of supports and services, and life
decisions
3. Meeting goals, needs, and interests of the
person
2. Involved in routine review of supports and
sevices
1. Involved in developing annual plan

GQMS Year 4 Annual Report 1st Submission
July 2011 – June 2012
________________________________________________________________________________________________
Delmarva Foundation August 31, 2012 32
III results are shown in Figure 4, for individuals on the NOW versus the COMP waivers.8 Results across
the III expectations were similar for both waivers with two exceptions:
Individuals on the NOW waiver appear to be more likely to be involved in the routine review of
their supports and services; and,
More likely to have community access and involvement than individuals receiving services
through the COMP waiver.
Figure 4: Individual Interview Instrument (III) Percent Present by Expectation and Waiver
July 2011 – June 2012
8 Appendix 2 shows results separately in tabular format for NOW and COMP for each Delmarva review tool.
89.5%
78.0%
97.8%
81.9%
95.3%
96.8%
95.0%
90.0%
76.8%
87.0%
91.2%
85.0%
96.2%
85.5%
94.8%
97.1%
95.8%
89.8%
83.7%
89.5%
0% 25% 50% 75% 100%
Year 4 Average III
9. Community involvement and access
8. Privacy, Dignity, Respect
7. Rights
6. Safety; free from abuse and neglect
5. Health
4. Choice of supports and ervices and life's
decisions
3. Meeting goals, needs, and interests of the
person
2. Involved in routine review of supports and
sevices
1. Involved in developing annual plan
NOW (344) COMP (470)

GQMS Year 4 Annual Report 1st Submission
July 2011 – June 2012
________________________________________________________________________________________________
Delmarva Foundation August 31, 2012 33
The following four graphs provide results by Region, Residential Setting, Age Group, and Service
(Figures 5 – 8).9 Findings show little variation across regions, residential settings, age groups or services.
Figure 5: Individual Interview Instrument (III)
Percent Present by Region (N=961) July 2011 – June 2012
Figure 6: Individual Interview Instrument (III) Percent Present by Residential Setting (N=961)
July 2011 – June 2012
9 Individuals may receive more than one service.
88.5% 89.2% 91.6% 90.1% 89.5% 90.7% 90.1%
0%
25%
50%
75%
100%
1 (167)
2 (139)
3 (247)
4 (128)
5 (144)
6 (136)
State (961)
90.6% 89.0% 91.3% 91.0%
75.8%
90.1%
0%
25%
50%
75%
100%
With Parents
(505)
Group Home (287)
Own Place (97 )
Host Home (64)
Other (8)
State (961)

GQMS Year 4 Annual Report 1st Submission
July 2011 – June 2012
________________________________________________________________________________________________
Delmarva Foundation August 31, 2012 34
Figure 7: Individual Interview Instrument (III) Percent Present by Age Group (N=961)
July 2011 – June 2012
Figure 8: Individual Interview Instrument (III) Percent Present by Service (N=961)
July 2011 – June 2012
Individual Support Plan Quality Assurance (ISP QA) Checklist
Each individual’s team of supports should meet annually to develop an ISP that supports the individual’s
needs and desired goals. The ISP QA Checklist was initially developed by the state to ensure the ISP
includes all necessary requirements as dictated by the state, and that it helps ensure the individual has a
healthy, safe, and meaningful life. Last year, a stakeholder workgroup consisting of Support
Coordination Agency representatives, Delmarva staff, Regional Office and Division of DD made
modifications to the ISP QA Checklist, including clarification of the expectations within the ISP. These
changes were implemented at the beginning of this year. Delmarva Quality Improvement Consultants
88.1% 90.4% 89.7% 90.2% 91.9% 90.1%
0%
25%
50%
75%
100%
18-25 (94)
26-44 (508)
45-54 (218)
55-64 (97)
65+ (44)
State (961)
89.8%
97.8%
91.4%
88.8%
92.4%
0% 25% 50% 75% 100%
Supported Employment (126)
Respite (3)
Prevocational (266)
Community Residential Alternative
Services (237)
Community Living Support (79)

GQMS Year 4 Annual Report 1st Submission
July 2011 – June 2012
________________________________________________________________________________________________
Delmarva Foundation August 31, 2012 35
use the ISP QA Checklist form to evaluate the various sections of the ISP, rating them on the degree to
which they address all requirements.10
Delmarva QICs determine an overall rating for each individual reviewed, based upon the degree to which
the ISP is written to provide a meaningful life for the individual receiving services. There are three
different categories for each ISP.
1. Service Life: The ISP supports a life with basic paid services and paid supports. The person’s
needs that are ―important for‖ the person are addressed, such as health and safety. However,
there is not an organized effort to support a person in obtaining other expressed desires that are
―important to‖ the person, such as getting a driver’s license, having a home, or acting in a play.
The individual is not connected to the community and has not developed social roles, but
expresses a desire to do so.
2. Good but Paid Life: The ISP supports a life with connections to various supports and services
(paid and non-paid). Expressed goals that are ―important to‖ the person are present, indicating
the person is obtaining goals and desires beyond basic health and safety needs. The person may
go out into the community but with only limited integration into community activities. For
example, the person may go to church or participate in Special Olympics. However, real
community connections are lacking and the person indicates he or she wants to achieve more.
3. Community Life: The ISP supports a life with the desired level of integration in the community
and in various settings preferred by the person. The person has friends and support beyond
providers and family members. The person has developed social roles that are meaningful to
that person, such as belonging to a Red Hat club or a book club or having employment in a
competitive rather than segregated environment. Rather than just going to church the person
may be an usher at the church or sing in the choir. Relationships developed in the community
are reciprocal. The ISP is written with goals that help support people in moving toward a
Community Life, as the person chooses.
The distribution of the ISP rating for results to date this year is presented in Figure 9, with findings from
Year 1 through Year 3 provided for comparative purposes. Between Year 1 and Year 3 there was a
decline in the proportion of ISPs written to support a Community Life. At the same time, there had
been an increase in the proportion of ISPs written to support a Good But Paid Life. Year 4 data show a
slight increase in the Service Life and Community Life, with a decrease in the Good But Paid Life
categories.
10 Information is taken from Michael Smull’s training manual, ―Promoting Quality through Person Centered Thinking‖. Contact the Office of Developmental Disabilities for more information.

GQMS Year 4 Annual Report 1st Submission
July 2011 – June 2012
________________________________________________________________________________________________
Delmarva Foundation August 31, 2012 36
Figure 9: ISP QA Checklist Results
July 2008 – June 2012
Figure 10 shows the ISP results by waiver for the current contract year. Compared to receiving services
through the NOW waiver, individuals on the COMP waiver were much more likely to have an ISP
written to support a Service Life and less likely to have one written to support a Good But Paid Life.
Figure 10: ISP QA Checklist Results by Waiver July 2008 – June 2012
Service Life
Good But Paid Life
Community Life
Year 1 (1,283) 12.8% 72.4% 14.8%
Year 2 (1,260) 10.2% 81.0% 8.9%
Year 3 (1,160) 8.4% 86.9% 4.7%
Year 4 (961) 9.8% 82.7% 7.5%
0%
25%
50%
75%
100%
ISP written to support
Service Life
Good But Paid Life
Community Life
NOW (344) 4.7% 88.4% 7.0%
COMP (470) 12.1% 81.9% 6.0%
0%
25%
50%
75%
100%
ISP written to support

GQMS Year 4 Annual Report 1st Submission
July 2011 – June 2012
________________________________________________________________________________________________
Delmarva Foundation August 31, 2012 37
Information in Figure 11 shows the ISP QA Checklist results by region. Findings indicate support
coordinators in Regions 5 and 6 were much more likely to document ISPs written to support a
community life, 15 percent and 16 percent respectively. However, Region 5 also had the greatest
proportion of ISPs written to support a Service Life (15%).
Figure 11: ISP QA Checklist Results by Region July 2011 – June 2012
Results by residential setting and age groups are presented in the following two graphs, Figures 12 and
13.
Individuals in a group home were most likely to have an ISP written to support a Service Life.
Most all of the 64 individuals living in a Host Home had a plan written to support a Paid But
Good Life.
Individuals living in their Own Place were most likely to have an ISP supporting a Community
Life.
Older adults, age 65 and over, were least likely to have to have an ISP supporting a Community
Life.
0%
25%
50%
75%
100%
1 (167)
2 (139)
3 (247)
4 (128)
5 (144)
6 (136)
6% 7% 2% 3% 15% 16%
89% 79% 88% 88% 70%
77%
5% 14% 10% 9% 15%
7%
Community Life Good But Paid Life Service Life

GQMS Year 4 Annual Report 1st Submission
July 2011 – June 2012
________________________________________________________________________________________________
Delmarva Foundation August 31, 2012 38
Figure 12: ISP QA Checklist Results by Residential Setting
July 2011 – June 2012
Figure 13: ISP QA Checklist Results by Age Group July 2011 – June 2012
0%
25%
50%
75%
100%
With Parents
(505)
Group Home (287)
Own Place (97 )
Host Home (64)
Other (8)
State (961)
9% 5% 13%
2% 0% 7%
84% 80%
77% 91%
75%
83%
7% 15% 9% 8%
25% 10%
Community Life Good But Paid Life Service Life
0%
25%
50%
75%
100%
18-25 (94)
26-44 (508)
45-54 (218)
55-64 (97)
65+ (44)
State (961)
10% 7% 8% 9% 2% 7%
78% 85% 82% 77% 86% 83%
13% 8% 10% 13% 11% 10%
Community Life Good but paid life Service Life

GQMS Year 4 Annual Report 1st Submission
July 2011 – June 2012
________________________________________________________________________________________________
Delmarva Foundation August 31, 2012 39
The ISP QA Checklist is also used to monitor several other aspects of the support plan. This section of
the Checklist has changed somewhat since Year 3 and comparisons to previous years may not be
appropriate. Each criteria scored is presented in Table 3. Results indicate that when applicable (N=490),
approximately 75 percent of ISPs did not have the annual informed consent for psychotropic
medications present in the record. In over half of the plans, the HRST is often not updated within
required timeframes and half did not have the authorized medical support section fully completed.
Table 3: ISP QA Checklist Additional Criterion
July 2011 – June 2012
Criteria
Percent
Present
Number
Reviewed
Provider information on demographic page matches POC. 88.7% 955
Is the budget present? 98.4% 837
PA matches the service(s) and unit rates on the budget. 97.4% 799
ISP contains a minimum of three goals. 99.6% 961
ISP contains at least one goal/objective per DD service. 99.1% 961
All goals are person centered. 76.4% 959
At least one goal reflects the person’s hopes and dreams. 82.9% 960
Signature page is signed by the individual. 97.4% 961
Annual informed consent for psychotropic medications is present. 24.7% 490
Behavior Support Plan/Crisis Plan and/Safety Plan are signed. 54.3% 162
Signature page of the ISP is in place, identifying that rights have been reviewed with the person. 96.5% 959
All required and applicable assessments are completed: nursing assessment, psychosocial review, and physician summary. 81.8% 500
HRST is completed or updated at least 90-120 days prior to the ISP expiration date.
11 48.6% 959
The Health and Safety section includes discussion on HRST training considerations. 88.7% 951
Authorized medical support section is fully completed, including plans for an emergency. 50.6% 953
Delmarva Consultants check 12 different sections on the ISP with the Checklist, rating each on a scale
from zero (0) to four (4), zero meaning the section is blank or the section inadequately addresses the
11 Prior to August 2011, Expectation was: HRST is updated annually and within 90 days prior to the individual service plan expiration date.

GQMS Year 4 Annual Report 1st Submission
July 2011 – June 2012
________________________________________________________________________________________________
Delmarva Foundation August 31, 2012 40
requirements and four meaning 100 percent of the ―bullets‖ or requirements in the section are adequately
addressed in the ISP. Each section represents an Expectation and has four (4) bullets (ratings are 0, 25%,
50%, 75%, or 100% (0-4)).
Beginning July 2011, a revised ISP QA Checklist was implemented. Because many of the requirements
measured for each of the Expectations have changed, comparisons to previous years is not advised. The
Expectations are briefly described as follows:12
1. Relationship map and discussion on ways to develop relationships: The relationship map is a
map with four quadrants to identify people, paid and non-paid supports, friends or family
members, who are important to the person. In this section QICs check to determine if the ISP
has names of people, paid and unpaid supports and if there is documentation on how to build
relationships with non-paid supports.
2. Communication Chart: The communication chart should identify how the person
communicates, which may be with signs, gestures or phrases and what is happening in the
environment to cause the reaction/communication. Does the chart reflect the person’s
communication style, including what others think different gestures or phrases may mean? Does
it include how others should respond?
3. Person Centered Important To/For: Does the ISP reflect the person’s interests, capacities,
achievements, and visions that are important both to that person and also for the person? Does
it identify ways to further develop the person’s capacities and networks and does it include health
and safety risks as well as what others say is important for the person?
4. Dreams and Visions: This section of the ISP identifies the dream or vision the individual has
related to where he/she lives, daily activities, friendships, and community life.
5. Service Summary: Does the service section summary include all services received, including
staffing requirements and daily supports (paid and unpaid)? Does it provide an overview of
changes in needs/services, continued concerns, and review of what the person has accomplished,
barriers/opportunities to achieving hopes and dreams?
6. Rights Restriction/Psychotropic Medications/Behavior Support Sections: If indicated, are any
concerns described regarding rights restrictions, medications, challenges, informed consent, or a
need for a positive behavior support plan, crisis plan or safety plan?
12 See the Delmarva GQMS website for a list of items checked within each section of the ISP QA Checklist. (http://www.dfmc-georgia.org/person_centered_reviews/index.html)

GQMS Year 4 Annual Report 1st Submission
July 2011 – June 2012
________________________________________________________________________________________________
Delmarva Foundation August 31, 2012 41
7. Meeting Minutes: The ISP team should meet annually to update and modify the ISP. Meeting
minutes should reflect community presence, choices of supports and services, health and safety,
and goals and outcomes desired by the person.
8. Support Intensity Scale (SIS) completed and support needs are addressed in the ISP: SIS
information should be noted throughout the entire ISP. Has the team reviewed the SIS data?
Does the SIS support section identify needs that will be deferred and those that will be
developed, and why?
9. Health and Safety Review Section completed accurately and thoroughly: HRST information
should be noted throughout the ISP. Are medications section of health and safety section of ISP
complete? Are identified support needs included? Are required assessments appropriately
completed? Is the authorized medical support section fully completed?
10. Goals are Person Centered: Do new goals address and build on what is important to the person?
Are the person’s dreams and vision for home, family, and community involvement addressed?
Do new goals address changes the person wants to make?
11. Training Goal Action Plan: Does the plan have the desired outcome of the person, discussion
and rationale based on assessment information? Is the goal measureable and reflective of what is
important to and for the person?
12. Action Plans: Are all objectives reflective of the Action Plan with a definition of how the person
will know they are met? For each object are supports, frequency, and how progress will be
documented/identified?
Table 4: ISP QA Checklist Ratings by Expectation
July 2011 – June 2012 (N=961)
Ratings
ISP QA checklist description 0 1 2 3 4
Relationship Map/ how to develop relationships 0.3% 4.8% 18.9% 37.7% 38.3%
Communication Chart 1.4% 1.4% 4.5% 34.8% 57.9%
Person-centered Important To/For 0.3% 0.6% 5.6% 22.0% 71.5%
Dreams and Visions 12.6% 6.5% 12.3% 24.5% 44.0%
Service Summary 1.3% 6.3% 15.0% 33.2% 44.2%
Rights, Psychotropic Medications, Behavior Supports 0.0% 0.1% 1.1% 9.4% 89.3%
Meeting Minutes 1.7% 10.0% 23.8% 30.6% 33.9%
SIS completed; needs are addressed in the ISP 0.1% 1.3% 10.8% 35.5% 52.3%
Health and Safety Review section completed 0.1% 0.0% 1.7% 8.6% 89.6%
Goals are person centered 4.9% 10.8% 16.5% 24.4% 43.3%
Training Goal Action Plan 0.6% 4.1% 13.6% 30.7% 51.1%
Action Plans 0.3% 2.2% 16.8% 50.2% 30.4%
Average 2.0% 4.0% 11.7% 28.5% 53.8%
GQMS Year 4 Annual Report 1st Submission
July 2011 – June 2012
________________________________________________________________________________________________
Delmarva Foundation August 31, 2012 42
Information in Table 4 shows, for each of the 12 ISP expectations, the percent of ISPs that fall into each
rating. For the 961 ISPs reviewed this year:
On average, approximately 54 percent of ISP expectations were rated as 4, meaning all of the
four requirements listed were present, and approximately 81 percent with at least three present.
Close to 90 percent of ISPs scored all four requirements present for the sections covering rights,
psychotropic medications and behavioral supports, and completing the Health and Safety
Review.
Fewer than 40 percent of the plans met all four requirements ensuring, the relationship map was
adequately completed, the person’s dreams and visions are addressed, meeting minutes are
completed, goals are person centered, and action plans are adequately completed.
Over 90 percent of support coordinators scored 3 or more on several Expectations:
Communication Chart; Person Centered Important To/For; Rights, Medications and Behavioral
Supports; and completing the Health and Safety Review section.
Several Expectations showed only one or none of the requirements present: Person Centered
Goals (17.6%); Meeting Minutes (10.6%) and the Dreams and Visions section (22.5%), which is
where most goals are generated for the Goals and Action Plan section.
Provider Record Review (PRR)
During the Provider Record Review, Delmarva QICs assess the provider’s records on 15 different
Expectations:
1. A Person Centered focus is supported in the documentation.
2. Human and civil rights are maintained.
3. The personal funds of the individual are managed by the individual and protected.
4. The provider clearly describes services, supports, care and treatment of the individual.
5. The provider maintains a central record for the individual.
6. The provider manages potential risk to the individual, staff and others.
7. The provider maintains a system for information management that protects individual
information and that is secure, organized and confidential.
8. Providers with medication oversight or who administer medication follow Federal and State
laws, rules, regulations, and best practice guidelines.
9. The individual is afforded choice of services and supports.
10. The provider has means to identify current health status, health/behavioral safety needs and is
knowledgeable of individual’s ability to self preserve.
11. The provider has a means to evaluate the quality and satisfaction of services provided to the
individual.
12. The provider meets NOW and COMP documentation requirements.
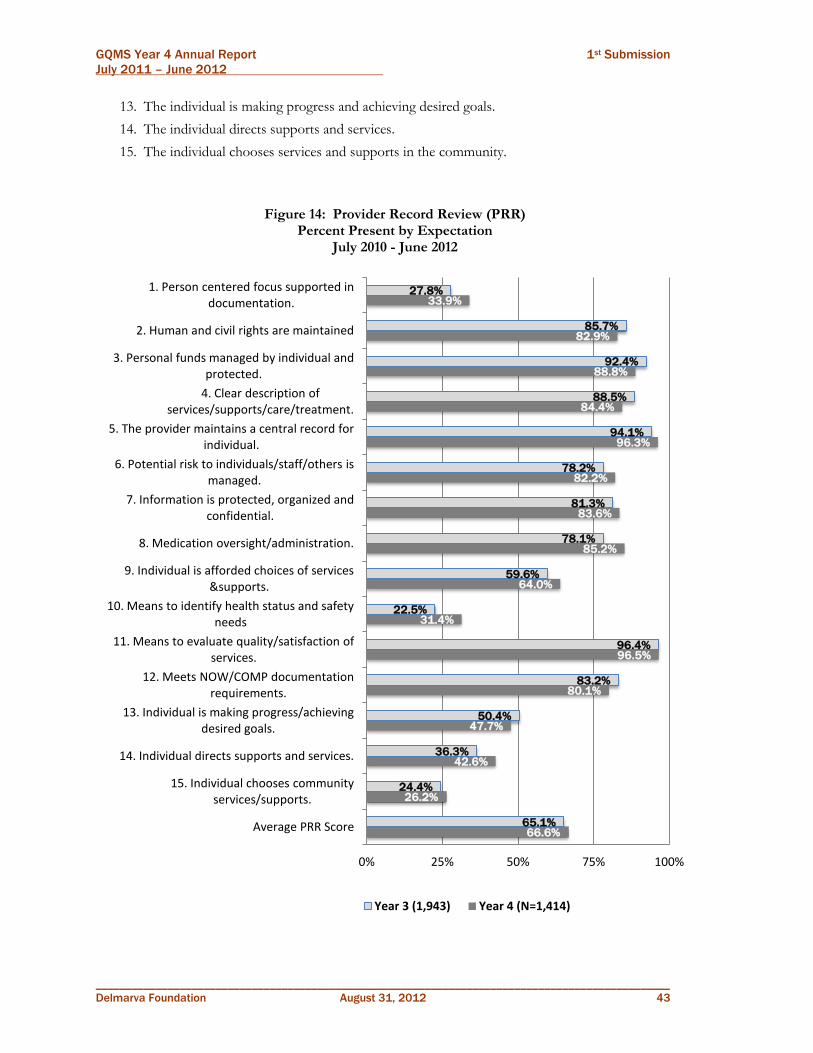
GQMS Year 4 Annual Report 1st Submission
July 2011 – June 2012
________________________________________________________________________________________________
Delmarva Foundation August 31, 2012 43
13. The individual is making progress and achieving desired goals.
14. The individual directs supports and services.
15. The individual chooses services and supports in the community.
Figure 14: Provider Record Review (PRR)
Percent Present by Expectation July 2010 - June 2012
66.6%
26.2%
42.6%
47.7%
80.1%
96.5%
31.4%
64.0%
85.2%
83.6%
82.2%
96.3%
84.4%
88.8%
82.9%
33.9%
65.1%
24.4%
36.3%
50.4%
83.2%
96.4%
22.5%
59.6%
78.1%
81.3%
78.2%
94.1%
88.5%
92.4%
85.7%
27.8%
0% 25% 50% 75% 100%
Average PRR Score
15. Individual chooses community services/supports.
14. Individual directs supports and services.
13. Individual is making progress/achieving desired goals.
12. Meets NOW/COMP documentation requirements.
11. Means to evaluate quality/satisfaction of services.
10. Means to identify health status and safety needs
9. Individual is afforded choices of services &supports.
8. Medication oversight/administration.
7. Information is protected, organized and confidential.
6. Potential risk to individuals/staff/others is managed.
5. The provider maintains a central record for individual.
4. Clear description of services/supports/care/treatment.
3. Personal funds managed by individual and protected.
2. Human and civil rights are maintained
1. Person centered focus supported in documentation.
Year 3 (1,943) Year 4 (N=1,414)

GQMS Year 4 Annual Report 1st Submission
July 2011 – June 2012
________________________________________________________________________________________________
Delmarva Foundation August 31, 2012 44
Figure 14 displays the percent present for each PRR Expectation for all providers working with the 916
individuals who participated in a PCR or QEPR between July 2010 and June 2012, and for record reviews
completed in Year 3. A record review is completed for each service received by the individual, with up to
1,414 reviews completed for each PRR Expectation in Year 4, and up to 1,943 in Year 3. Results are
presented for each from the Provider Record Reviews by year and indicate the following:
The average Provider Record Review score to date in Year 4 is approximately 67 percent present,
similar to Year 3.
Providers have shown compliance rate of close to 95 percent or greater in Year 3 and Year 4 on
two Expectations: maintaining a central record tor the person and having a means to evaluate
the quality of and satisfaction with services.
Since Year 3, providers have shown improvement documenting several Expectations:
o Person centered focus in documentation
o Medication oversight and administration
o Afford individuals choices of services and supports
o Means to identify health status and safety needs of individuals
o Individual directs supports and services
Compliance has remained fairly low, 50 percent or lower in both time periods, for
documentation that: supports a person centered focus; shows the provider has a means to
identify the person’s health status and safety needs; individuals are making progress toward goals;
individuals direct their supports and services; and individuals choose community services and
supports. With the exception of making progress towards goals, documentation did improve in
these areas in year 4.
Figure 15 provides results for the PRR Expectations for the current contract year. Comparison of NOW
and COMP waiver findings indicates variation across the Expectations:
Provider documentation for individuals on the NOW waiver was five percentage points or more
higher than for COMP waiver recipients on eight expectations, particularly having a person
centered focus in the documentation (11 points higher) and meeting NOW and COMP
documentation requirements (15 points higher).
However, provider documentation for NOW waiver recipients on medication oversight and
administration was 11 points lower than for individuals on the COMP waiver, and NOW
documentation was more likely to indicate providers did not have the means to identify the
health status and safety needs of individuals.

GQMS Year 4 Annual Report 1st Submission
July 2011 – June 2012
________________________________________________________________________________________________
Delmarva Foundation August 31, 2012 45
Figure 15: Provider Record Review (PRR) Percent Present by Expectation and Waiver
July 2011 - June 2012
Figure 16 provides results for the Provider Record Reviews by region. The numbers in parentheses
represent the total number of record reviews completed in each region. The number of elements scored
65.3%
24.2%
42.5%
45.2%
73.3%
94.1%
34.3%
60.7%
88.1%
79.1%
82.8%
94.5%
81.5%
87.5%
84.4%
29.8%
68.7%
26.5%
41.7%
51.5%
88.2%
99.4%
27.5%
69.6%
76.7%
88.1%
82.6%
98.2%
89.3%
96.2%
84.2%
40.8%
0% 25% 50% 75% 100%
Average PRR Scores
15. Individual chooses community services/supports.
14. Individual directs supports and services.
13. Individual is making progress/achieving desired goals.
12. Meets NOW/COMP documentation requirements.
11. Means to evaluate quality/satisfaction of services.
10. Means to identify health status and safety needs
9. Individual is afforded choices of services &supports.
8. Medication oversight/administration.
7. Information is protected, organized and confidential.
6. Potential risk to individuals/staff/others is managed.
5. The provider maintains a central record for individual.
4. Clear description of services/supports/care/treatment.
3. Personal funds managed by individual and protected.
2. Human and civil rights are maintained
1. Person centered focus supported in documentation.
NOW (N=507) COMP (N=752)

GQMS Year 4 Annual Report 1st Submission
July 2011 – June 2012
________________________________________________________________________________________________
Delmarva Foundation August 31, 2012 46
in each region ranged from 2,355 (Region 5) to 5,296 (Region 3). Findings suggest a range from 58
percent present in Region 2 to 74 percent in Region 6. Compared to Year 3, results for Regions 3 and 6
indicate an increase of 8.6 and 7.0 percentage points respectively. However, Region 1 showed a decrease
of approximately 6 points.
Figure 16: Provider Record Review (PRR) Percent Present by Region
July 2011 – June 2012
Provider Record Review results are presented by service in Figure 17. With the exception of the three
individuals who received Respite services, individuals receiving Supported Employment were somewhat
more likely to have provider documentation expectations Met. Findings on all services are similar to
Year 3.
Figure 16: Provider Record Review (PRR)
Percent Present by Service July 2011 – June 2012
61.9% 58.4%
65.9% 71.6% 69.9%
74.4%
0%
25%
50%
75%
100%
1
(246)
2
(205)
3
(391)
4
(198)
5
(175)
6
(199)
Region
72.1%
77.5%
67.6%
65.4%
66.4%
65.6%
0% 25% 50% 75% 100%
Supported Employment (126)
Respite (3)
Prevocational (266)
Community Residential …
Community Living Support (79)
Community Access Service (703)

GQMS Year 4 Annual Report 1st Submission
July 2011 – June 2012
________________________________________________________________________________________________
Delmarva Foundation August 31, 2012 47
Staff/Provider Interviews
Staff and/or provider interviews are conducted with all providers and/or staff who provide a specific
service for the individual participating in the PCR and for all services offered by the provider receiving a
QEPR. A total of 927 interviews were completed this year. Through the staff interview, Delmarva
Consultants score the provider/staff on 23 indicators that measure seven different Expectations:13
1. Implementation of Person Centered/Directed Supports and Services (7 indicators)
2. Health (2 indicators)
3. Safety (3 indicators)
4. Rights Upheld (3 indicators)
5. Privacy and Confidentiality (2 indicators)
6. Respect and Dignity (1 indicator)
7. Implementation of the Plan’s Identified Supports and Services (5 indicators)
The percent present on each of these Expectations is based on the number of indicators reviewed and is
presented in Figure 17. Findings to date indicate:
Staff Interview performance appears to be relatively good, with six of seven Expectations scored
at or above 90 percent, an average score of 95.0 percent.
Staff scored lowest on the indicators measuring if staff is aware of the person’s health needs and
medications taken and their possible side effects.
The statewide average score has increased somewhat since Year 1, from 92.4 percent to 94.8
percent.
Results on each Expectation were approximately the same or slightly higher in Year 4 compared
to Year 3, but differences were small (less than 2.5 percentage points).
13 See the Delmarva GQMS website to review the tool used during the staff interview and a description of each indicator used to measure the expectations. (http://www.dfmc-georgia.org/person_centered_reviews/index.html)
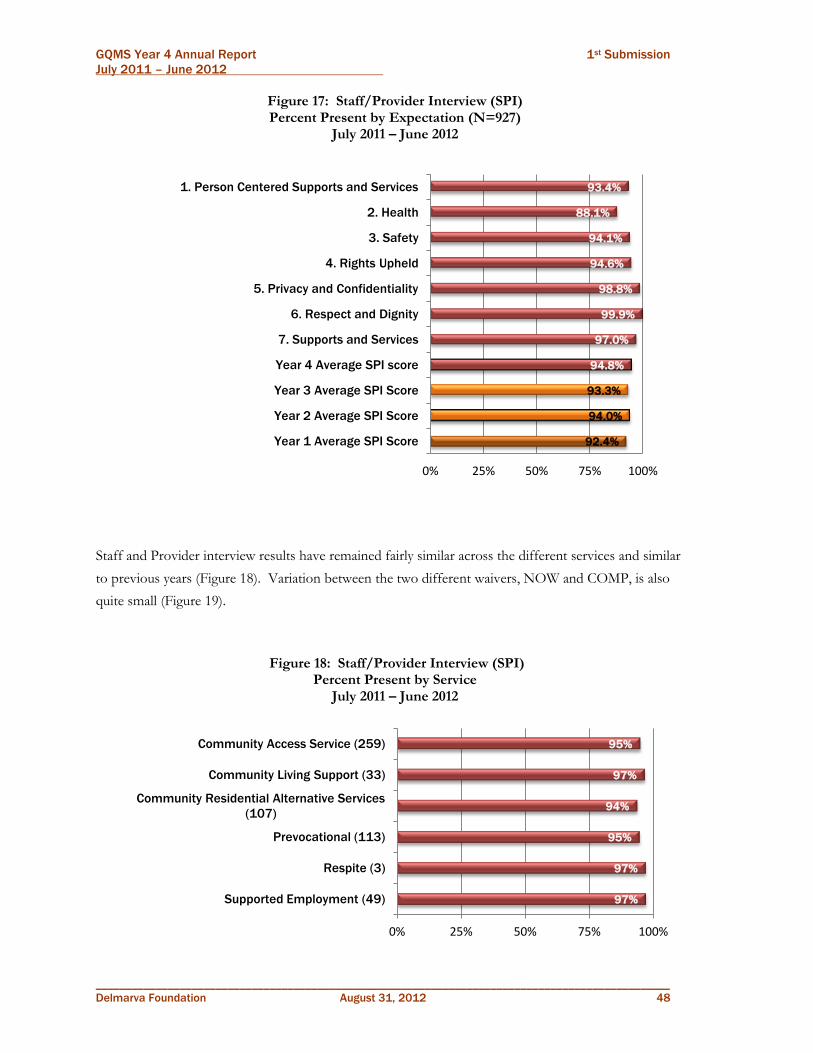
GQMS Year 4 Annual Report 1st Submission
July 2011 – June 2012
________________________________________________________________________________________________
Delmarva Foundation August 31, 2012 48
Figure 17: Staff/Provider Interview (SPI) Percent Present by Expectation (N=927)
July 2011 – June 2012
Staff and Provider interview results have remained fairly similar across the different services and similar
to previous years (Figure 18). Variation between the two different waivers, NOW and COMP, is also
quite small (Figure 19).
Figure 18: Staff/Provider Interview (SPI) Percent Present by Service
July 2011 – June 2012
92.4%
94.0%
93.3%
94.8%
97.0%
99.9%
98.8%
94.6%
94.1%
88.1%
93.4%
0% 25% 50% 75% 100%
Year 1 Average SPI Score
Year 2 Average SPI Score
Year 3 Average SPI Score
Year 4 Average SPI score
7. Supports and Services
6. Respect and Dignity
5. Privacy and Confidentiality
4. Rights Upheld
3. Safety
2. Health
1. Person Centered Supports and Services
97%
97%
95%
94%
97%
95%
0% 25% 50% 75% 100%
Supported Employment (49)
Respite (3)
Prevocational (113)
Community Residential Alternative Services
(107)
Community Living Support (33)
Community Access Service (259)

GQMS Year 4 Annual Report 1st Submission
July 2011 – June 2012
________________________________________________________________________________________________
Delmarva Foundation August 31, 2012 49
Figure 19: Staff/Provider Interview (SPI) Percent Present by Waiver
July 2011 – June 2012
Observations
Onsite observations are completed for all individuals participating in the PCR who go to a day program
or live in a paid residential setting such as a Personal Care Home or Host Home. During the QEPR, up
to 20 residential and all day activity sites are visited per provider. Observations completed during the
PCR are incorporated into the QEPR process and different sites are visited. Therefore, if the provider
has 20 residential programs, four may be observed during the PCR process for individuals receiving
services from the provider. An additional 16 will be observed during the QEPR process, for up to a total
of 20 per provider.
Observations are made to determine how supports are being rendered to the person and how the person
responds to those supports and services. Any health and safety issues, including suspected or observed
abuse, are included as part of this observation guide. During the current time period, 775 locations were
part of the Observation process. The Observation Guide, available on the Delmarva website
94.3%
96.2%
99.8%
98.5%
93.9%
93.1%
89.2%
93.0%
95.7%
98.0%
100.0%
99.3%
95.6%
95.7%
87.9%
94.4%
0% 25% 50% 75% 100%
Average SPI Score
7. Supports and Services
6. Respect and Dignity
5. Privacy and Confidentiality
4. Rights Upheld
3. Safety
2. Health
1. Person Centered Supports/Services
NOW (N=303) COMP (N=495)

GQMS Year 4 Annual Report 1st Submission
July 2011 – June 2012
________________________________________________________________________________________________
Delmarva Foundation August 31, 2012 50
(http://www.dfmc-georgia.org/person_centered_reviews/index.html), is used to assess the following
Expectations for the individual in the facility.
1. Health: Observe the individual’s physical well being, medication needs/effects, air quality and if
any signs of illness are apparent.
2. Safety: Are there any safety issues, signs of abuse or neglect, and is the environment safe?
3. Rights and Self Advocacy: Look for rights restrictions, access to personal possessions, any
privacy issues.
4. Community Life: Individual decides where to go and when, helps make choices, and staff
support helping individual develop different social roles.
5. My Life, My Choice: Individual has information to make informed choices, chooses own
routine, and is able to expand opportunities as desired.
6. Celebrating Achievements: Individual is acknowledged for accomplishments, and staff support
person using a person centered approach and in making progress.
The following graph shows the Percent Present for the Observation Checklist by expectation (Figure 20).
A total of 775 Observation Checklists were completed but not every expectation is scored for each one.
Results indicate providers perform very well on this portion of the reviews, with very little variation
across expectations. Results by service are not displayed and reflect a compliance score of approximately
97 percent or higher for each service. Figure 21 reflects OBS findings by waiver, showing only slight
differences between the NOW and COMP results.
Figure 20: Onsite Observations (OBS)
Percent Present by Expectation July 2011 – June 2012
(N=775)
96.0%
98.6%
97.2%
98.2%
98.1%
97.9%
94.4%
98.6%
98.0%
99.0%
0% 25% 50% 75% 100%
Year 1 Average OBS score
Year 2 Average OBS score
Year 3 Average OBS score
Year 4 Average OBS score
6. Celebrating Achievements
5. My Life and My Choice
4. Community Life
3. Rights and Self Advocacy
2. Safety
1. Health

GQMS Year 4 Annual Report 1st Submission
July 2011 – June 2012
________________________________________________________________________________________________
Delmarva Foundation August 31, 2012 51
Figure 20: Onsite Observations (OBS)
Percent Present by Expectation July 2011 – June 2012
(N=775)
Person Centered Review Results
Support Coordinator Record Review (SCRR)
Each individual who is eligible for services through one of the waivers selects a support coordinator to
act as an advocate and help identify, coordinate, and review the delivery of appropriate services, based on
specific goals, needs and requirements of the individual. During each PCR, the Quality Improvement
Consultants review the individual’s record that is maintained by the individual’s support coordinator.
Information from the record is used to score the support coordinator on nine different Expectations
(scored as Present or Not Present):14
14 Go to Delmarva’s GQMS website for a detailed description of each expectation and the type of probes used to determine the appropriate outcome. (http://www.dfmc-georgia.org/person_centered_reviews/index.html)
97.8%
98.4%
97.6%
93.8%
98.0%
97.8%
98.7%
98.6%
97.0%
97.7%
98.1%
99.6%
98.3%
100.0%
0% 25% 50% 75% 100%
Average Observation Score
6. Celebrating Achievements
5. My Life and My Choice
4. Community Life
3. Rights and Self Advocacy
2. Safety
1. Health
NOW (n=240) COMP (n=450)

GQMS Year 4 Annual Report 1st Submission
July 2011 – June 2012
________________________________________________________________________________________________
Delmarva Foundation August 31, 2012 52
1. A person centered focus is supported in the documentation.
2. Human and civil rights are maintained.
3. Documentation describes available services, supports, care, and treatment of the individual.
4. Support coordinator monitors services and supports according to the ISP.
5. Support coordinator continuously evaluates supports and services.
6. The support coordinator has an effective approach for assessing and making recommendations
to the provider for improving supports and services related to risk management.
7. The support coordinator maintains a system of information management that protects the
confidentiality of the individual’s information.
8. Individuals are afforded choices of services and supports.
9. Individuals are included in the larger community.
Information in Figure 21 reflects support coordinator record review results for the 480 PCRs completed
in Year 4 and 34 additional SCRRs completed as part of the support coordinator’s QEPR process. Data
indicate the following:
A slow decrease in SC compliance since the first year of the contract, from an average of 78
percent to 73 percent
Improvement has been reflected on one standard; compliance with monitoring services and
supports according to the ISP has increased by almost six percentage points since Year 1.
Showing a person-centered focus in the documentation has decreased by eight points, a greater
decline rate than for any other Expectation.

GQMS Year 4 Annual Report 1st Submission
July 2011 – June 2012
________________________________________________________________________________________________
Delmarva Foundation August 31, 2012 53
Figure 21: Support Coordinator Record Review Results (SCRR) Percent Present by Expectation (N=514)
July 2011 – June 2012
Figure 22 presents the Support Coordinator Record Review results by waiver for Year 4 (July 2011 – June
2012). The difference between results for NOW versus COMP recipients varied across the SCRR
Expectations:
Average SCRR scores for NOW and COMP were the essentially the same for the year.
78.0%
75.2%
72.9%
72.6%
42.4%
66.3%
96.9%
90.5%
73.9%
87.5%
64.1%
85.4%
46.9%
0% 25% 50% 75% 100%
Year 1 Average SCRR Scroe
Year 2 Average SCRR Score
Year 3 Average SCRR Score
Year 4 Average SCRR Score
9. Individuals are included in larger community.
8. Individuals are afforded choices of services and
supports.
7. Confidentiality of the individual’s information is
protected.
6. SC has effective approach to assess and make
recommendations related to risk management.
5. SC continuously evaluates supports and
services.
4. SC monitors services and supports according to
the ISP.
3. Documentation describes available services,
supports & care of the individual.
2. Human and civil rights are maintained.
1. A person-centered focus is shown in the
documentation.

GQMS Year 4 Annual Report 1st Submission
July 2011 – June 2012
________________________________________________________________________________________________
Delmarva Foundation August 31, 2012 54
Compared to NOW recipients, records for individuals on the COMP waiver showed higher
compliance in maintaining a person-centered focus in the documentation (8 points higher) and
showing that human and civil rights are maintained (6 points higher).
Compared to NOW results, COMP records showed lower compliance (6 points lower)
documenting that individuals are afforded choice of services and supports and/or that
individuals are included in the larger community (4 points lower).
Figure 22: Support Coordinator Record Review Results (SCRR)
Percent Present by Expectation and Waiver July 2011 – June 2012
73.8%
39.6%
67.5%
96.5%
91.2%
74.6%
88.6%
67.1%
86.8%
52.2%
73.5%
43.2%
73.5%
97.8%
92.7%
76.6%
87.5%
65.6%
81.1%
43.8%
0% 25% 50% 75% 100%
Average SCRR Score
9. Individuals are included in larger
community.
8. Individuals are afforded choices of services
and supports.
7. Confidentiality of the individual’s
information is protected.
6. SC has effective approach to assess and
make recommendations related to risk
management.
5. SC continuously evaluates supports and
services.
4. SC monitors services and supports
according to the ISP.
3. Documentation describes available
services, supports & care of the individual.
2. Human and civil rights are maintained.
1. A person-centered focus is shown in the
documentation.
NOW (N=185) COMP (N=228)

GQMS Year 4 Annual Report 1st Submission
July 2011 – June 2012
________________________________________________________________________________________________
Delmarva Foundation August 31, 2012 55
Support Coordinator Record Review results are displayed by Region, Residential Setting and Age Group
in the following graphs (Figures 23 – 25).
Results by Region range from a low of 70 percent in Region 2 to 78 percent in Region 6.
Compared to Year 3, SCRR compliance has increased by 10 points in Region 6 but decreased by
10 points in Region 4 from 86 percent.
SCRR results are similar across the different residential settings.
Records for younger individuals, age 18 to 25, show higher compliance than for individuals in
other age groups.
Figure 23: Support Coordinator Record Review Results (SCRR) Percent Present by Region
July 2011 – June 2012
Figure 24: Support Coordinator Record Review Results (SCRR) Percent Present by Residential Setting
July 2011 – June 2012
73.1% 69.9% 70.9% 76.1% 71.7%
78.1%
0%
25%
50%
75%
100%
1 (68)
2 (80)
3 (146)
4 (67)
5 (98)
6 (55)
Region
72.2% 73.9% 72.7% 70.6% 83.3%
72.6%
0%
25%
50%
75%
100%
With Parents
(296)
Group Home (137)
Own Place (42 )
Host Home (37)
Other (2)
State (514)
Residential Status

GQMS Year 4 Annual Report 1st Submission
July 2011 – June 2012
________________________________________________________________________________________________
Delmarva Foundation August 31, 2012 56
Figure 25: Support Coordinator Record Review Results (SCRR) Percent Present by Age Group
July 2011 – June 2012
Comparison of PCR Components
Almost every indicator within the different components of the PCR targets one of six quality
improvement Focused Outcome Areas important to the success of any service delivery system:
Health
Safety
Choices
Community Life
Person Centered Practices
Rights
Each element from the various components of the PCR has been categorized within one of the Focused
Outcome Areas (FOA). The Percent Present for each FOA is presented in Table 5, for reviews
completed between July 2011 and June 2012. Results to date are consistent with previous findings and
indicate some variation across the different components, but are similar to previous years:
Choice and Health, measured from the perspective of the individual (III) and through the
Provider Record Reviews, have both increased somewhat since Year 3 (4 to 7 points).
Providers and Support Coordinators continue to score relatively low in documenting Person
Centered Practices (Achieving and Celebrating Results), Choice, and particularly issues
surrounding Community Integration.
77.4% 72.6% 70.1% 73.7% 72.1% 72.6%
0%
25%
50%
75%
100%
18-25 (53)
26-44 (271)
45-54 (111)
55-64 (55)
65+ (24)
State (514)
Agre Group

GQMS Year 4 Annual Report 1st Submission
July 2011 – June 2012
________________________________________________________________________________________________
Delmarva Foundation August 31, 2012 57
Providers did not document issues surrounding health very well (PRR), with only 45.8 percent
compliance.
Provider documentation of Community Integration was very low, 26.2 percent.
Approximately 81 percent of individuals (III) indicated they were connected to the Community
as they desire, the lowest score from the individual’s perspective. However, SCRRs and PRRs
were very low scoring in this area. On the other hand, onsite observations resulted in scores for
this area that were considerably higher (94.4%). It should be noted this area of the observation
is only scored when the person is observed in his/her community which explains the high score.
Table 5: PCR and QEPR Comparison Across Focused Outcome Area
July 2011 – June 2012
Focused
Outcome III SCRR PRR SPI OBS
N=961 N=514 N=1414 N=927 N=775
Celebrating /Achieving 88.2% 60.4% 55.2% 96.6% 98.1%
Choices 92.3% 65.2% 64.0% 96.5% 97.9%
Health 96.4% 90.5% 45.8% 88.1% 99.0%
Safety 94.6% 90.5% 82.2% 94.1% 98.0%
Rights 92.5% 91.1% 86.9% 97.7% 98.6%
Community 81.1% 42.4% 26.2% 84.9% 94.4%
NCI Consumer Survey Results for Focused Outcome Areas
To examine individual responses on the Focused Outcome Areas, results from several questions in the
NCI Consumer Survey were grouped and analyzed. Each question grouped within the Focused
Outcome Areas is provided in the Exhibit 5 of the Appendix. The following table displays a summary of
results within each Focused Outcome Area for the four contract years of the GQMS program. The
percent positive for each question is given. The ―positive‖ response may actually be a negative answer.
For example, ―Are you ever afraid or scared when you are at home?‖ This is positive if answered as
―No‖. These types of questions are reverse coded for the analysis. Findings from the NCI analysis
indicate the following:
Individuals were least likely to report they have choice in their lives, and this was true for each
year, the same in Year 4 as in Year 3.
The average score for Community Inclusion was 69 percent, up somewhat since Year 3. While
individuals do report they can go out to go shopping (92%), to see family (89%), or to a
restaurant or café (91%), only 22 percent have a job in the community and 43 percent have a
volunteer position somewhere, and approximately half appear to get regular exercise or go on

GQMS Year 4 Annual Report 1st Submission
July 2011 – June 2012
________________________________________________________________________________________________
Delmarva Foundation August 31, 2012 58
vacation. The Community Integration score has actually increased to levels shown in Year 1 and
2.
Approximately 98 percent of individuals reported having excellent or fairly good health, about
the same as in Year 3.
Approximately 79 percent of individuals indicated they are Achieving Results or that a person
centered approach to services is used. This is up from Year 3 and similar to results in Year 1.
Each year, results indicate individuals are most likely to be healthy, safe and have rights honored.
NCI Results by Focused Outcome Areas
Consumer Survey 08-09 thru 11-12
Focus Outcome Area Year 4 Year 3 Year 2 Year 1
Achieving / Person Centered 79.3% 76.9% 74.8% 78.9%
Choice 40.1% 40.6% 43.2% 36.4%
Health 97.9% 97.5% 96.2% 94.8%
Safety 90.7% 90.4% 93.3% 88.8%
Right 89.3% 88.8% 90.1% 88.5%
Community 69.0% 66.5% 70.3% 68.1%
Total N 480 481 480 480

GQMS Year 4 Annual Report 1st Submission
July 2011 – June 2012
________________________________________________________________________________________________
Delmarva Foundation August 31, 2012 59
Quality Enhancement Provider Review
The Quality Enhancement Provider Review (QEPR) has been completed for 39 service providers and
one support coordinator agency, randomly selected from the list of providers who had not yet received a
QEPR. The QEPR is comprised of six distinct components and the number of cases for each
component is dependent upon the number of individuals receiving services, number of services provided,
and the number of residential and/or day programs the provider offered at the time of the review.
Results have been reported for the III, ISP QA Checklist, Provider Record Reviews, Staff/Provider
Interviews, and Onsite Observations. Provider demographic information and results from the
Administrative Review are presented here.
A summary of information for each provider reviewed during the year is presented in Table 5, and
includes the number of individuals served (ranging from 2 to 2,717), the number of individuals who
participated in an III (ranging from 1 to 67), the number of services the provider offers (ranging from 1
to 116) and the number of staff members working with the organization (ranging from 1 to 105).
Table 6: QEPR Provider Information July 2011 - June 2012
Provider Name Region #
Served # of III
# of Services
# of Staff
AmericanWork Inc 2 21 15 1 67
Another Chance 3 58 35 3 9
Art of Living CLA LLC 3 3 3 1 2
Aspirations 2B 3 4 3 1 3
B and O Services Inc 6 5 4 1 6
Bobbi Personal Care Home Inc 6 3 4 1 8
Carroll County Training Center 6 73 39 9 24
Changes of Choice Inc 3 3 1 1 5
Choices of Change Llc 5 13 9 2 13
Coastal Center for Developmental Services Inc 5 300 116 7 75
Comfort Community Center 1 56 41 4 8
Diversified Enterprises 4 88 63 7 105
Douglas County Retardation Association Inc 1 27 15 3 25
Encare Personal Care Home 5 6 4 2 7
First Born Outreach Center Inc 6 19 17 3 38
First Paths Inc 3 4 4 1 2
Foundation of Exceptional Achievers 3 68 50 2 18
Georgia Pals Inc 1 21 17 5 25
Good Samaritian 6 3 1 1 5
Hand-n-Hand PCH 4 3 1 1 5
Innovative Housing Residential Services Inc 3 3 2 1 2
Jones-Cody PCH Inc 3 4 4 1 4
Key Foundation 1 25 17 4 21
Lifetime PCH 2 13 13 3 29
Lynndale Inc 2 202 102 8 61

GQMS Year 4 Annual Report 1st Submission
July 2011 – June 2012
________________________________________________________________________________________________
Delmarva Foundation August 31, 2012 60
Table 6: QEPR Provider Information July 2011 - June 2012
Provider Name Region #
Served # of III
# of Services
# of Staff
McDougle Personal Care Home 4 3 3 1 3
Metro Community Services 3 5 5 1 1
Network Day Service Center Inc 1 71 55 10 27
Professional Case Management 4 2,717 34 2 96
Reach For The Moon Inc 2 7 7 1 6
Reprah Enterprise Llc 3 2 2 1 5
Rutledge Center Inc 6 74 68 7 20
Southern Community Services Inc 5 8 9 1 8
Spectrum Habilitation Services Inc 3 9 9 1 8
Sunnydale Service Center 4 56 49 11 41
Supported Employment Specialists Inc 1 23 12 5 4
Tranquility Personal Care Home 3 2 2 1 3
We Speak for Ourselves LLC 1 3 64 7 8
WOW In-Sync Tucker 3 97 3 1 23
Younique Total Care Inc 3 2 1 1 4
QEPR Administrative Review
Each provider receives one Administrative Review, which includes two review instruments:
Administrative Qualifications and Training (A Q&T) and Administrative Policy and Procedures (A P&P).
The A Q&T includes a review of a sample of personnel records to determine if staff has the necessary
qualifications, specific to services rendered, and if the training was received within required timeframes.
The A P&P includes a review of organizational records to determine if policies are in place and if
procedures are delineated that are in compliance with state regulations. Due to the degree of revisions to
the Standards for All Providers warranting revisions implemented in the Administrative tools,
procedures, comparisons to previous years are not appropriate.
The Administrative Policy and Procedure review instrument measures 11 different Expectations. Each
Expectation is comprised of a different number of elements/questions, ranging from one to 45, with a
total of 149 questions scored for each provider. A P&P Expectations are listed in Table 6, showing the
average percent present for the 40 providers reviewed to date this contract year. Results indicate:
Providers reviewed to date this contract year have scored approximately 80 percent.
All providers had policy and procedures regarding infection control practices for their service
systems.
Faith based provider organizations that receive federal or state monies were in compliance with
only half of applicable regulations for all providers (68 records reviewed).

GQMS Year 4 Annual Report 1st Submission
July 2011 – June 2012
________________________________________________________________________________________________
Delmarva Foundation August 31, 2012 61
Table 7: Administrative Policy and Procedure Elements
Average Percent Present July 2011 – June 2012
N = 40
# of
Questions Policy Pct Met
5 Strong operational procedures support the organization, staff and individuals served. 81.7%
4 Holistic Services, supports, care and treatment to the individual that enhances the individual’s capacity for a meaningful life are available. 75.2%
26 Human and civil rights are maintained. 85.0%
19 The personal funds of an individual are managed by the individual and are protected. 72.0%
24 The services environment demonstrates respect for the persons served and is appropriate to the services provided. 83.3%
2 Quality improvement processes and management of risk to individual, staff and others are a priority. 85.0%
3 The organization maintains a system of information management system that protects individual information and is secure, organized and confidential. 83.3%
45 Organizations with oversight for medications or administer medications follow federal/ state laws, rules, regulations and best practice guidelines. 76.3%
15 Individuals are provided services, supports, care and treatment by staff who are properly licensed, credentialed, trained and who are competent. 80.8%
1 Infection control practices are evident in service settings. 100.0%
5 Faith or denominationally based organizations who receive federal or state monies follow applicable regulations in the standards for all providers. 50.0%
149 Average Policy and Procedure Score 79.8%
The Administrative Qualification and Training Checklist is used to score providers on 11 Expectations
pertaining to service specific qualifications and receiving training within appropriate timeframes. Each
Expectation, the number of elements/questions used to score each Expectation, and results for the forty
providers reviewed this year are listed in Table 7. The number of records reviewed for each A Q&T
standard varies, depending upon the number of employees working for the organization.
The average compliance score for the 40 providers reviewed in Year 4 was 69 percent, somewhat
higher than the average in Year 3.
Provider compliance for Q & T was 10 percentage points lower than compliance on the Policies
and Procedures.
Providers scored 65 percent or less maintaining documentation of job descriptions, training
requirements, and medication administration.
14 of 80 records reviewed (17.5%) did not show documented evidence the national criminal
records check was completed according to guidelines.

GQMS Year 4 Annual Report 1st Submission
July 2011 – June 2012
________________________________________________________________________________________________
Delmarva Foundation August 31, 2012 62
Table 8: Administrative Qualifications and Training Elements
Average Percent Present July 2011 – June 2012
N = 40
Number
Questions Expectations Pct Met
2 The type and number of professional staff attached to the organization are properly licensed, credentialed, experienced and competent. 87.8%
2 The type and number of all other staff attached to the organization are properly licensed, credentialed, experienced and competent. 81.1%
5 Job descriptions are in place for all personnel. 63.0%
2 There is evidence that a national criminal records check (NCIC) is completed for all employees. 82.5%
4
Orientation requirements are specified for all staff. Prior to direct contact with consumers, all staff and volunteer staff shall be trained and show evidence of competence. 72.8%
15 Within the first sixty days, and annually thereafter, all staff having direct contact with consumers shall have all required annual training 65.1%
6 Provider ensures that staff receives a minimum of 16 hours of annual training. 58.2%
1 Organizations with oversight for medication or that administer medication follow federal and state laws, rules, regulations and best practices. 62.9%
1 Provider has a current certification from MHDDAD Division (receives less than $250,000 waiver dollars per year) 78.9%
1 Provider has current accreditation if required (receives $250,000 or more waiver dollars per year). 87.5%
3 The organization has internal structures that support good business practices. 78.3%
42 Average Qualifications and Training Score 69.0%
Strengths and Barriers
During the QEPR, Delmarva works with each provider to identify strengths and best practices as well as
barriers providers face in developing optimal service delivery systems. Quality Improvement
Consultants have a list of strengths and barriers in a ―drop down‖ menu. However, when ―other‖ is
listed, a comment is included in the data. The top strengths and barriers noted during the reviews are
listed in Table 9, as well as the number of times each is noted and the percent this represents of the total
number documented.15
15 See Appendix 1, Exhibits 1 and 2 for a complete list of strengths and barriers used this year.

GQMS Year 4 Annual Report 1st Submission
July 2011 – June 2012
________________________________________________________________________________________________
Delmarva Foundation August 31, 2012 63
Table 9: Provider Strengths and Barriers
Top Results, July 2011 - June 2012
Strengths
Times
Noted Pct
Customer's satisfaction with supports and services 29 4%
Provider's demonstration of concern for individuals served 29 4%
Trust built with the individual(s) served 26 4%
Provider is flexible 25 4%
Provider's attitude of putting the persons served first 25 4%
Provider's accessibility to individuals served 24 4%
Provider's receptiveness to improving the quality of supports and services 24 4%
The provider is well-liked by the individuals served 24 4%
Provider's emphasis on health 22 3%
Provider's relationship with individuals served 22 3%
Provider's responsiveness to the individuals' needs 21 3%
Provider's teamwork approach 20 3%
Total Number of strengths Documented 659
Barriers
Times
Noted Pct
Cost of doing business vs. reimbursement rates 22 7%
Excessive paperwork requirements 19 6%
Support plan not driven by the person 17 5%
Lack of financial resources 15 5%
Conflicting messages - licensing verses person centered approach 12 4%
Lack of consistency in implementation of state policy and procedures 11 3%
Needed services not approved/funded 11 3%
Workload 11 3%
Ineffective or lack of training for provider/staff 10 3%
Changing priorities 9 3%
Competing priorities 9 3%
Transportation/Commuting 9 3%
Total Number of Barriers Documented 324
A total of 659 strengths were identified, and a total of 324 barriers were documented during the reviews
completed between July 2011 and June 2012. Providers may identify more than one strength or barrier,
but each will be recorded only one time per provider. Information in Table 9 indicates:
For 29 providers, customer satisfaction and/or a demonstration of concern for individuals were
listed as strengths of the organization.
Trust, flexibility, accessibility and attitude were also areas of strength for many providers.
Barriers noted by many of the providers include excessive paperwork and financial issues, and
problems surrounding not having the support plan driven by the person.

GQMS Year 4 Annual Report 1st Submission
July 2011 – June 2012
________________________________________________________________________________________________
Delmarva Foundation August 31, 2012 64
Decline codes
Individuals selected to take part in the interview have the right to decline to participate. During Year 4,
53 individuals were recorded as a decline for the process: 24 declined, eight had moved out of the state,
two were deceased and 19 were no longer receiving services.
Follow-Up Reviews
Follow-up with Technical Assistance
Delmarva conducts two types of Follow-up reviews: Follow up with Technical Assistance (FU w/ TA)
and the FUTAC (Follow-up with Technical Assistance Consultation). The FU w/ TA is conducted 90
days after completion of the QEPR. Using findings from the QEPR, technical assistance is provided to
support providers and to offer suggestions and guidance to help improve their service delivery systems.
During the fourth contract year, Delmarva completed 35 FU w/ TA reviews. Results are displayed in
Table 10. The percent of Expectations scored as Met at the Follow-up is based on the number of
Expectations scored as Not Met at the QEPR and the number scored Met at the Follow-up. For
example, Allegiant had all Expectations scored Met during the QEPR for the Administrative Policies and
Procedures as well as the Qualifications and Training; and four Expectations scored Not Met during the
PRR, of which three were scored Met at the Follow-up (75%). Owl’s Retreat FU score indicates all 94
Expectations scored Not Met during the QEPR were scored Met at the FU. Cells with NA indicate there
were no Expectations scored as Not Met during the QEPR and none scored during the FU review.
Table 10: Follow Up with Technical Assistance
July 2011-June 2012
Provider Region
Policy and Procedure
Training and Qualification
Provider Record Review
% Met (N) % Met (N) % Met (N)
Allegiant Service LLC 3 NA NA NA NA 75.0% 4
AmericanWork Inc 2 16.4% 67 31.3% 16 25.2% 107
Another Chance 3 92.3% 13 100.0% 18 65.2% 155
ARC of Macon 2 100.0% 25 100.0% 17 17.1% 362
Art of Living CLA LLC 3 85.0% 80 100.0% 23 0.0% 2
Avita Community Partners 1 87.5% 16 53.8% 26 4.3% 232
B and O Services Inc 6 100.0% 4 100.0% 1 100.0% 6
Christ The King Day Habilitation 3 NA NA 100.0% 2 52.7% 55
Comfort Community Center 1 17.5% 40 0.0% 25 60.9% 266
Creative Consulting Services** 1 NA NA 100.0% 5 52.7% 91
Diversified Enterprises 4 97.8% 91 40.0% 35 20.1% 219
Encare Personal Care Home 5 NA NA 100.0% 6 75.0% 16

GQMS Year 4 Annual Report 1st Submission
July 2011 – June 2012
________________________________________________________________________________________________
Delmarva Foundation August 31, 2012 65
Table 10: Follow Up with Technical Assistance
July 2011-June 2012
Provider Region
Policy and Procedure
Training and Qualification
Provider Record Review
% Met (N) % Met (N) % Met (N)
First Born Outreach Center Inc 6 100.0% 5 100.0% 4 100.0% 120
Frazer Center 3 0.0% 43 60.9% 23 5.4% 316
Generations Adult Day Services 2 18.8% 16 100.0% 15 20.4% 54
Georgia Pals Inc 1 81.6% 76 47.2% 36 27.1% 107
Good Samaritan 6 100.0% 33 60.0% 5 42.9% 7
Lifetime PCH 2 46.7% 60 60.0% 20 55.6% 54
McDougle Personal Care Home 4 100.0% 3 50.0% 24 0.0% 1
McIntosh Trail CSB 6 NA NA 100.0% 2 37.6% 149
Network Day Service Center Inc 1 0.0% 88 0.0% 29 16.7% 246
New Domus Personal Care Llc 3 42.9% 7 NA NA NA NA
Normal Life of Georgia 4 100.0% 4 100.0% 11 29.6% 206
Owls Retreat 3 NA NA 100.0% 14 100.0% 80
Pineland CSB 5 NA NA 100.0% 1 15.9% 258
Reach For The Moon Inc* 2 NA NA NA NA NA NA
Reprah Enterprise Llc 3 100.0% 22 80.0% 5 0.0% 4
Serenity Behavioral Health System 2 NA NA NA NA 35.6% 298
Southern Community Services Inc 5 100.0% 32 0.0% 10 0.0% 21
Southern Resources Consultants 3 NA NA NA NA 25.0% 12
Spectrum Habilitation Services 3 66.7% 48 60.0% 5 2.2% 46
Sunnydale Service Center 4 52.6% 19 36.7% 30 55.7% 235
We Speak for Ourselves LLC 1 100.0% 7 0.0% 3 0.0% 7
WOW In-Sync Tucker 3 NA NA 100.0% 1 58.2% 282
Younique Total Care Inc 3 100.0% 7 25.0% 4 50.0% 8
* Reach For The Moon Inc was no longer in business at the time of the FU. ** Support Coordination Agency had SC Record Reviews instead of Provider Record Reviews.

GQMS Year 4 Annual Report 1st Submission
July 2011 – June 2012
________________________________________________________________________________________________
Delmarva Foundation August 31, 2012 66
Follow Up with Technical Assistance Consultation (FUTAC)
Providers are tagged to receive a FUTAC through a referral system. The review process utilizes a
consultative approach to assist providers in their efforts to increase the effectiveness of their service
delivery systems. The focus is to help improve systems to better meet the needs, communicated choices,
and preferences of the individuals receiving services.16
The FUTAC also supplements the PCR and QEPR processes by affording the State of Georgia and
contracted providers the opportunity to solicit technical assistance for specific needs within the service
delivery milieu. During the contract year, 368 FUTAC were completed. The following series of tables
provides information about the region, the Focused Outcome Area addressed, type and referral reason,
and technical assistance provided.
The greatest proportion of FUTAC has been completed in Region 3 (25%)
Health, Safety and Provider Record Review documentation were most often the Focused
Outcome Area addressed.
Most of the reviews were onsite (84%), referred at the individual level (81%), the source of the
referral from one of the Regional Office HQMs (72%), or with the Support Coordinator
monthly score of a 3 or 4 as the primary reason for the referral (72%).
Technical assistance most often included discussion with the provider and brainstorming.
Table 11: FUTAC Number and Percent by Region
July 2011 – June 2012
Region Number Percent
1 86 23.4%
2 35 9.5%
3 92 25.0%
4 43 11.7%
5 29 7.9%
6 83 22.6%
Total 368 100%
16 Recommendations provided by Delmarva Consultants during the FUTAC are presented in Appendix 1, Exhibit 3.

GQMS Year 4 Annual Report 1st Submission
July 2011 – June 2012
________________________________________________________________________________________________
Delmarva Foundation August 31, 2012 67
Table 12: FUTAC by Focused Outcome Area
July 2011 - June 2012
Type Number Percent
Health 223 28.9%
Safety 166 21.5%
Rights 58 7.5%
Choice 12 1.6%
Community Life 12 1.6%
Person Centered 25 3.2%
Administrative Policies and Procedures 24 3.1%
Administrative Qualifications & Training 12 1.6%
Documentation Support Coordinator Record Review 20 2.6%
Documentation Provider Record Review 215 27.9%
Table 13: Follow Up with Technical Assistance Consultation
Number and Percent by Type and Referral Information
July 2011 - June 2012
Type Number Percent
Desk 59 16.0%
Onsite 309 84.0%
Referral Level Number Percent
Individual 299 81.3%
Provider 69 18.8%
Referral Source Number Percent
Division 68 18.5%
Health Quality Manager (HQM) 265 72.0%
Internal 24 6.5%
Other Regional Office Staff 2 0.5%
Provider 9 2.4%
Referral Reason Number Percent
SC Monthly Monitoring Scores of 3 & 4 266 72.3%
Corrective Action Plan (CAP)/Critical Incident 67 18.2%
Provider Self Request 16 4.3%
Complaints/Grievance 8 2.2%
QEPR Alert 5 1.4%
PCR Alert 4 1.1%
Compliance Review 3 0.8%
Support Plan Needing Improvement 0 0.0%
Level of Care Registered Nurse (LOC RN) Review 0 0.0%

GQMS Year 4 Annual Report 1st Submission
July 2011 – June 2012
________________________________________________________________________________________________
Delmarva Foundation August 31, 2012 68
Table 14: Follow Up with Technical Assistance Consultation
Type of Technical Assistance Provided
July 2011 - June 2012
Type Number Percent
1:1 Training 61 7.8%
Brainstorming 197 25.1%
Group Training 20 2.5%
Individual Discussion with Provider 285 36.3%
Strategic Planning 42 5.4%
CAP Development 15 1.9%
Resources-Hard Copy 31 3.9%
Group Discussion 74 9.4%
Resources-web-based 41 5.2%
Role Play 0 0.0%
Skill Building 19 2.4%
Focused Outcome Recommendations
As part of the QEPR process, Delmarva captures specific recommendations for each Focused Outcome
Area (FOA): Celebrating Achievements, Community Life, Health, My Life My Choice, Rights, and Safety.
Information is collected through drop down menus during the QEPR and the FUTAC, and is available
to further analyze areas in which the service delivery system for the provider may need the most
attention.
Recommendations may help offer insight into areas providers can focus to improve their organizational
systems and practices and are listed by Focused Outcome Area in Appendix 1, Exhibit 4.17 A total of
1,065 recommendations have been provided, with 145 to 221 per FOA. Of the 40 providers reviewed,
19 or more were given the following recommendation:
Document that information is reviewed with the individual
Review progress with individuals regularly
Identify ways to expose individuals to new opportunities in the community
Ensure documentation reflects the individuals’ interactions and responses to outings
17 The FOA recommendations from the 199 FUTAC completed this year are included as Exhibit 4 in the Appendix.
GQMS Year 4 Annual Report 1st Submission
July 2011 – June 2012
________________________________________________________________________________________________
Delmarva Foundation August 31, 2012 69
Support individuals with greater challenges to develop social roles and presence in their
community
Improve documentation of choices made by the person and the person’s response
Consistently document efforts related to offering choice
Discuss and provide education about the consequences/responsibilities associated with making
choices and exercising rights
Individuals Recently Transitioned to the Community (IRTC)
A total of 203 individuals who transitioned from an institution to the community participated in a Person
Centered Review with a Delmarva consultant. The following table shows Expectations from the
Delmarva Reviews that indicate a five percentage point difference, or more, between IRTC responses
and individuals already established in the community.
Individuals recently transitioned to the community were less likely to have choice or help with
the design or review of their service plan, and much less likely to be developing desired social
roles (III results).
IRTC results indicated a much greater proportion of ISPs written to support a service life and
smaller proportion written to support a Good But Paid Life.
ISP QA criteria indicate the IRTC records showed better compliance in areas of health and
medication management
PRR and SCRR results show lower compliance for the IRTC sample in areas of choice and
community inclusion but higher compliance in describing service, medication administration,
meeting NOW/COMP documentation requirements and describing and evaluation supports and
services.

GQMS Year 4 Annual Report 1st Submission
July 2011 – June 2012
________________________________________________________________________________________________
Delmarva Foundation August 31, 2012 70
Results by Expectation: PCR+QEPR v IRTC
July 2011 - June 2012
Individual Interview Instrument PCR +
QEPR IRTC Difference
The person is afforded choice of services and supports. 90.9% 76.7% 14.2%
The person is involved in the design of the service plan. 85.1% 70.6% 14.5%
The service plan is reviewed with the person, who can make changes. 80.0% 72.3% 7.7%
The person is developing desired social roles. 72.8% 44.6% 28.2%
ISP Written to support Service Life 9.8% 27.1% -17.3%
Good But Paid Life 82.7% 68.5% 14.3%
Community Life 7.5% 4.4% 3.1%
ISP QA Criteria Provider info on demographic page matches POC? 88.7% 74.4% 14.3%
Are all goals person centered? 76.4% 64.0% 12.4%
Annual informed consent for psychotropic medications is present? 24.7% 46.5% -21.8%
Behavior Support Plan/Crisis Plan and/Safety Plan is signed? 54.3% 70.3% -16.0%
All required and applicable assessments are completed: Nursing assessment, Psychosocial review, and Physician summary? 81.8% 87.6% -5.8%
HRST is updated annually and within 90 days prior to the individual service plan expiration date? 48.6% 25.0% 23.6%
The Health and Safety section includes discussion on HRST training consideration. 88.7% 94.5% -5.8%
Authorized medical support section is fully completed, including plans in an emergency. 50.6% 59.1% -8.5%
Provider Record Review Clear description of services/supports/care/treatment. 84.4% 92.1% -7.6%
Medication oversight/administration. 85.2% 92.0% -6.8%
Individual is afforded choices of services &supports. 64.0% 54.8% 9.2%
Means to evaluate quality/satisfaction of services. 96.5% 89.5% 7.1%
Meets NOW/COMP documentation requirements. 80.1% 89.3% -9.2%
Individual chooses community services/supports. 26.2% 16.7% 9.5%
Support Coordinator Record Review Documentation describes available services, supports & care of
individual 64.1% 70.3% -6.2%
Support coordinator monitors services/supports according to the ISP 87.5% 79.8% 7.7%
Support coordinator continuously evaluates supports and services 73.9% 81.8% -7.9%
Individuals are afforded choices of services and supports 66.3% 60.1% 6.2%
Individuals are included in larger community. 42.4% 30.5% 11.8%

GQMS Year 4 Annual Report 1st Submission
July 2011 – June 2012
________________________________________________________________________________________________
Delmarva Foundation August 31, 2012 71
Section 3: Discussion and Recommendations
During Year 4 of the Georgia Quality Management Systems (GQMS) contract (July 2011 – June 2012),
Delmarva has continued a successful partnership with the Georgia Division of Developmental
Disabilities, Regional Offices, and other Stakeholders to improve on the effectiveness and quality of the
Quality Assurance (QA) system in Georgia. The joint statewide meeting held in September demonstrated
the effectiveness of the quality management system built through the work of each Quality Improvement
(QI) Council which presented information on the progress of their QI projects, implemented last year
based upon data collected and presented through GQMS. QI Councils have worked on new initiatives
for this contract, supporting the development of community connections and supported employment
initiatives. Project updates will be presented at the next joint meeting in October, 2012.
In addition to facilitating the regional and statewide QI Council meetings, Delmarva developed four
training modules and completed 30 training sessions across the state, attended by approximately 1,114
individuals, families and providers. Delmarva has also updated the public reporting website, completed
reliability testing on all consultants and managers, and completed a quality improvement study identifying
components of a provider service delivery system that best predict outcomes for individuals.18
Delmarva Quality Improvement Consultants (QIC) completed 480 Person Centered Reviews (PCR) and
40 Quality Enhancement Provider Reviews. As part of these reviews, Delmarva consultants completed
961 interviews with individuals that utilized Delmarva’s Individual Interview Instrument and included a
random sample of 480 individuals who participated in the National Core Interview using the NCI
consumer survey. Consultants also completed 514 Support Coordinator Record Reviews, 1,414 Provider
Record Reviews, 927 Staff/Provider Interviews, 775 onsite observations of residential and day program
facilities, and 40 Administrative Reviews.
An additional 203 individuals who were recently transitioned to the community (IRTC) from an
institution participated in a PCR. Compared to individuals already established in the community, IRTC
results indicate recently transitioned individuals were much more likely to have a profound intellectual
disability, much more likely to live in a group home, and more likely to have an ISP written to support a
Service Life. They were much less likely to be developing desired social roles, have choice of services and
supports or be involved in the design of their service plan. Support Coordinator and provider records
were much less likely to show they are included in the larger community or given choice of community
18 The QI study is currently under review by the Division.

GQMS Year 4 Annual Report 1st Submission
July 2011 – June 2012
________________________________________________________________________________________________
Delmarva Foundation August 31, 2012 72
services. In addition, IRTC results indicate goals on the ISP are less likely to be person centered and the
HRST information is less likely to be updated as required.
Recommendation 1: The Division of DD should explore how the transition planning process is
implemented for individuals transitioning from an institution. The planning process should ensure the
person has input and is being connected to the community as desired even prior to the transition.
Recommendation 2: Support Coordinators should review the ISP for each person transitioned from an
institution and update the plan as necessary to ensure goals are person centered and ensure the HRST is
adequately and appropriately completed as required or necessary.
Recommendation 3: Because outcome scores for people living in host homes tend to be higher, the
Division should help ensure a variety of residential settings, specifically host homes, are available and
presented as an option for newly transitioned individuals. This will help support the person in making an
informed choice related to supports and services available.
III results across various demographics were similar to previous years, and results are fairly positive on
average (90.2 %), an increase since Year 1 of the contract (83.2%). Year 4 results reflect a higher percent
of outcomes met than the combined average for the previous three years, particularly in key areas of
choice, having input into the design of the service plan and life’s decisions, achieving outcomes and
satisfaction with supports and services, health and safety, education about exercising rights, and
community participation. In addition, although the previous two years ISP QA checklist results indicated
a decline in the proportion of ISP written to support a Community Life, data for Year 4 indicate a shift
up.
Provider documentation has shown improvement since Year 3 in some critical areas: a person centered
focus in provider documentation; medication oversight and management; offering individuals a choice of
services and supports and allowing them to direct their services and supports; and identifying health and
safety needs of individuals served. Support coordinator documentation has also improved in key areas
such as showing a person centered focus in the documentation and ensuring human and civil rights for
the person are maintained.
Extensive statistical analysis has not been completed to determine all the factors that may be positively
impacting outcomes for individuals. However, the recently completed QI study suggests that adequately
implementing policies and procedures (measured though the Provider Record) improves outcomes. In
addition, conducting person centered reviews to help determine how well the provider systems are
responding to individuals raises awareness of person centered practices for individuals, families and
providers. Furthermore, the QEPR and FUTAC processes focus on improving practices for the
provider’s service delivery system.

GQMS Year 4 Annual Report 1st Submission
July 2011 – June 2012
________________________________________________________________________________________________
Delmarva Foundation August 31, 2012 73
Recommendation 4: People will perform to the test. Therefore, a continued focus on person centered
practices and a person centered quality assurance/improvement process as well as continuing to include
individual interviews as part of the Quality Enhancement Provider Review are recommended.
Administrative review of employee records reflected relatively low provider compliance on required
qualifications and training. Approximately 17 percent of employees reviewed did not have adequate
background screening documentation in place; 42 percent of staff did not receive the minimum of 16
hours of annual training; and 27 percent with oversight for medication did not follow rules, regulations or
best practices.
Recommendation 5: Maintaining proper background screening practices and documentation are critical
when working with a vulnerable population. The Division should consider a stricter policy and/or
sanctions for noncompliance if appropriate.
Recommendation 6: A workgroup including Delmarva, the Division, and provider representation should
be convened to develop a training curriculum providers can use to ensure staff receives the annual
training as required by the Division. The workgroup should also develop a training curriculum for
medication administration that providers can use for staff who monitor the self administration of
medications for individuals and/ or develop best practice guidelines providers can use to develop internal
quality assurance checks to ensure accuracy of the implementation of these procedures.
Findings continue to show that individuals who receive supported employment have better outcomes
than individuals who receive any other service. Community integration and development of social roles
are improved when individuals are employed in integrated settings.
Recommendation 7: The state should continue to emphasize supported employment initiatives
(becoming an Employment First state, the Alliance for Full Participation) and access to community
resources. Develop a stakeholder workgroup to identify barriers to this with the outcome being a plan
and recommendations to the State to overcome the barriers.
Recommendation 8: Support the Statewide QI Council’s initiative to try and educate individuals and
families regarding the employment supports and services available. This could include an initiative
requiring support coordination to educate individuals and family members not already involved with
employment services using the supported employment brochure and guide.
Other findings are similar to results reported in previous years. Results continue to reflect possible issues
surrounding health and/or safety, Community Access/Integration, and Person Centered Practices.

GQMS Year 4 Annual Report 1st Submission
July 2011 – June 2012
________________________________________________________________________________________________
Delmarva Foundation August 31, 2012 74
Health and Safety:
HRST is not updated in the ISP as needed (48.6% present in ISP QA Checklist).
Annual informed consent for psychotropic medications is present (24.7% present in ISP QA
Checklist).
Behavior support plan, crisis plan, and safety plan are signed (54.3% present in ISP QA
Checklist).
Medical support section of the ISP is fully completed including plans for an emergency (50.6%
present in ISP QA Checklist).
Although higher than in Year 3, only 31 percent of provider records reviewed documented a
means to identify health status and safety needs.
Approximately 37 percent of providers scored not met on the Qualification and Training
element: indicating employees are educated on medication administration and proper laws and
regulations related to medication oversight were followed, or best practices were used.
Health and Safety represented over 50 percent of the FUTAC Focused Outcome Areas
addressed during the consultation.
Community Access:
19 percent of individuals interviewed were not developing or being supported to maintain
desired social roles (III).
The proportion of ISPs written to support a Community Life has increased since Year 3 but
remains low, at 7.5 percent.
Only 26 percent of provider records indicated the person had choice of community services and
supports.
Approximately 52 percent of support coordinator records documented how individuals are
included in the larger community.
QEPR recommendations for half of the 40 providers reviewed to date this year indicated a need
to identify ways to expose individuals to new opportunities in the community.
Person Centered Practices:
Over 190 individuals (20 percent) were not involved in the routine review of their supports and
services (III).
Approximately 24 percent of ISPs did not contain goals that were all person centered and 32
percent of the service plans had two or fewer expectations met in the checklist section indication
goals are person centered.
Provider Record Reviews often do not use a person centered focus in documentation (33.9%
present).
Less than half (47%) of the Support Coordinator Record Reviews showed person centered
documentation.

GQMS Year 4 Annual Report 1st Submission
July 2011 – June 2012
________________________________________________________________________________________________
Delmarva Foundation August 31, 2012 75
Several recommendations provided during the QEPR address person centered practices such as
regularly reviewing progress with the person, documenting that information is reviewed by the
person, and document how individuals are being included in the planning process for outings.
Recommendation 9: The training developed by Delmarva on social roles and community connections
should be a mandatory training for all staff, and should be competency based.
Recommendation 10: With the development of the new ISP process and template submitted to the
Division of DD, it is recommended the State begin developing strategies to implement this new system
which by design ensures the person’s goals and needs change as the person desires and/or as necessary.
Recommendation 11: The Delmarva Nurse provided training across the state specific to medications,
possible reactions to medications, and medication administration. These standards should be tracked
through the next reporting period and a new and possibly revised training session offered if necessary.
The data appears to reflect some differences in outcomes and results for individuals receiving services
through the NOW versus the COMP waivers. The COMP waiver is designed for people who need
residential services and these individuals showed better health and safety outcomes than NOW recipients.
However, they were less likely to be involved in the review of their supports and services, less likely to be
educated on and exercise their rights, and less likely to have community access and involvement. In
addition, they were more likely to have an ISP written to support a Service Life and provider
documentation was less likely to have a person centered focus or to show the individuals was offered a
choice of supports and services. An assumption might be made that because COMP services include
Community Residential Alternative services which include more restrictive group home residential
settings may be impacting the scores.
Recommendation 12: It is not clear why differences exist between NOW and COMP waiver results.
Perhaps the Division should revise the standards for the COMP waiver and ensure they more explicitly
define how areas of choice and rights should be addressed.

GQMS Year 4 Annual Report 1st Submission
July 2011 – June 2012
________________________________________________________________________________________________
Delmarva Foundation August 31, 2012 76
Attachment 1: Overview of Delmarva Processes
The Georgia Quality Management System consists of two main processes, the Person Centered Review
(PCR) and the Quality Enhancement Provider Review (QEPR). The PCR is designed to assess the
overall quality of the supports and services a particular person receives though interviews with the
individual and his or her provider(s), record reviews, and observations. The process explores the extent
to which the system enhances the person’s ability to achieve self-described goals and outcomes, as well as
individuals’ satisfaction with the service delivery system. Each PCR includes a face to face interview with
a randomly selected individual using the National Core Indicator (NCI) individual survey tool and
additional interview questions using Delmarva’s Individual Interview Instrument (III).19
In addition to the interview, records of the most recent twelve (12) months of services received by the
person are reviewed and used to help determine the person’s achievement of goals that matter most.
Onsite observations are conducted for individuals who receive day supports or residential services to
observe the person in these environments, the individual’s reaction to supports, and how well supports
interact with the person. Interviews with the individual’s support coordinator and provider/staff further
assist the consultant in gathering information to help determine how the person is being supported and
the person’s knowledge of the supports and services being provided. A review of the person’s central
record is also part of this process and includes a review of how well the person’s Individual Support Plan
(ISP) reflects the person, including goals, talents, strengths and needs. A total of 480 PCRs will be
completed each year of the contract.
The QEPR is used to evaluate the effectiveness of the provider’s supports and services, organizational
systems, records, and compliance with Division of DD standards for policy and procedures, as well as
staff training and qualifications. The intent of the GQMS contract is for Delmarva to complete a QEPR
with all providers at least one time over the course of five years. During the each contract year, 39
providers and one support coordinator agency will participate in a QEPR. For each provider, a
representative sample of individuals is chosen to participate in an interview using the III, which begins
the QEPR process and helps determine what individuals receiving services perceive as strengths and/or
areas needing improvement within the provider’s service delivery system.
Other resources used during the QEPR to gather information regarding the provider’s supports and
services are individual record reviews, onsite observations for individuals receiving day supports and/or
19 Individual participation in any interview as part of the QA process is voluntary. Individuals may refuse to participate for any reason and may also have anyone present at the interview they choose to have present.

GQMS Year 4 Annual Report 1st Submission
July 2011 – June 2012
________________________________________________________________________________________________
Delmarva Foundation August 31, 2012 77
residential services, and administrative review of the organization’s policies and procedures, as well as
staff training and qualifications, and provider/staff interviews. Information from the PCR interviews will
be used to enhance the QEPR findings, as appropriate, to help support the provider in identifying trends,
strengths, and areas needing improvement. The QEPR was implemented in January 2009.
The FUTAC (Follow Up with Technical Assistance Consultation) review was implemented during the
third contract year. This process utilizes a consultative approach to assist providers in their efforts to
increase the effectiveness of their service delivery systems in order to meet the needs, communicated
choices, and preferences of individuals they serve, and to comply with the standards set forth by the State
of Georgia that govern all providers. By implementing the FUTAC, the State of Georgia and contracted
providers are given the opportunity to solicit technical assistance for specific needs in the service delivery
milieu. This process provides resources to mitigate barriers that impact service delivery while identifying
organizational strengths.
Through various avenues, providers are referred to Delmarva for a FUTAC, and certain criteria are used
to determine if the referral will result in a FUTAC:
PCR & QEPR Alerts
o Generated from Red Alerts (according to the guidelines) identified during a PCR or
QEPR.
o Based upon the results of the QEPR 90 Day Follow Up with Technical Assistance
where the provider continues not to have elements in the Administrative Review Policy
and Procedures and Staff Training and Qualifications tools present.
3 & 4 SC monitoring
o Generated from the HQM monthly report which identifies when a provider has more
than three, 3 or 4 ratings within a three month period. HQM’s evaluate and assess 3 and
4 rating report to determine FUTAC appropriateness. Not all 3 and 4 ratings with more
than 3 in a three month period will require a FUTAC. Determination is based on HQM
decision.
Corrective Action Plans based upon critical incidents
o Generated by FUTAC Manager for 3-6 closed critical incidents relating to the same
issue(s) for the same provider or same individual within the last 6 months.
Complaints and grievances
o Generated by HQMs that have determined Delmarva is the best resource to complete
the technical assistance.
Provider Request
o Providers who have been identified by the Division or Region who need assistance.

GQMS Year 4 Annual Report 1st Submission
July 2011 – June 2012
________________________________________________________________________________________________
Delmarva Foundation August 31, 2012 78
o Providers who would like to receive technical assistance and have already received a
QEPR and a 90 day Follow Up with Technical Assistance.
o Providers that are new providers within the preceding 12 month period that have not
gone through certification. Verification of non certification confirmed by the Division
of DD Certification Department.