Embed Size (px)
Citation preview

GEORGIA EDUCATION, TRAINING AND EMPLOYMENT DEVELOPMENTS 2016

The contents of this paper are the sole responsibility of the ETF and do not necessarily reflect the views of the EU institutions.
© European Training Foundation, 2017 Reproduction is authorised provided the source is acknowledged.
GEORGIA 2016 | 03
KEY EDUCATION, TRAINING AND EMPLOYMENT DEVELOPMENTS
IN GEORGIA
Georgia’s vocational education and training (VET) system suffers from a lack of attractiveness, as VET
is considered a second choice compared with academic pathways that lead to higher education.
Although enrolment in VET programmes has been increasing, the overall participation rate remains
very low. Both public and private providers need authorisation from the National Centre for
Educational Quality Enhancement (NCEQE), but only public providers are eligible to receive
government funding. The number of authorised private providers is substantially higher than the
number of authorised public providers (around 70 and 22, respectively).
Reforms in VET are under way in line with the National VET Development Strategy (2013–2020), and
a new VET law has been drafted, though its submission to parliament has been postponed until the
post-election period (after October 2016). In the course of implementing the new strategy, the Ministry
of Education and Science has doubled the staff of the VET department (from five to twelve). Although
the overall capacity of staff working on VET and skills policies at the national level has increased, high
staff turnover and a lack of experience and expertise remain huge challenges.
Georgia is taking its first steps towards rehabilitating labour market institutions and policies. After a
decade of laissez-faire employment policy, and following a change of government in 2013, Georgia
adopted a number of employment and labour market policy documents in 2014 and 2015, and
relaunched its public employment services, labour market information system and active labour market
policies (ALMPs). The first actions have been launched, namely a Labour Demand Survey,
establishment of a labour market information system, pilot retraining courses and a review of reports
on institutional arrangements in both VET and employment.
The limited (human) capacity of government agencies, particularly in the area of employment and the
labour market, is a significant shortcoming that could hamper the implementation of government
strategies. Georgia needs continuous donor support and capacity development to sustain the labour
market and employment reforms in the years to come. In the future, the skills development actions
should be better aligned with the economic development of the country and the prospective sectors
that are able to create employment opportunities for the population. Social partnerships exist, but the
dialogue is still not sufficiently effective. Entrepreneurship development also remains an important
aspect for the future owing to the lack of wage employment and jobs in general.
The European Union (EU) supports the implementation of the employment and VET strategies
through the Sector Reform Contract (budget support) for the Employment and VET Support
Programme (2014–2017).
1. Key demographic and economic characteristics
The 2014 census revealed that Georgia’s population was 3 729 635 as of January 2015, representing
a drop of 14.7% since 2002, when the population was 4 371 535. The decrease is mainly explained by
the high level of emigration over the past 12 years and by the exclusion from the census of Georgia’s
breakaway regions, Abkhazia and Tskhinvali (South Ossetia). Some 57.4% of the population currently
lives in urban areas; Tbilisi – where 30% of the population lives – has the highest population density.
Men constitute 47.7% and women 52.3% of the total population. Trends in the age structure of the
population from 2010 to 2014 show slight increases in the shares of the age groups 0–14 years (from
17.05% to 17.13%), 25–34 years (from 14.89% to 15.48%), 35–44 years (from 13.57% to 13.78%)
and 55–64 years (from 10.18% to 11.70%). The share of the youth population (aged 15–24 years) was
20.2% in 2015, having decreased from 22.3% in 2011.
Georgia is a lower middle-income country with a growing gross domestic product (GDP) per capita –
$7 315 in 2011 increasing to $9 379 in 2015 (purchasing power parity (PPP), current international
dollars). Its economy stabilised after the severe crisis of 2008, when GDP contracted by 6.3% in a

GEORGIA 2016 | 04
single year (2009). From 2010 to 2013, the average GDP growth rate was 5.7%. The recession in
Russia and slower growth among other trade partners affected Georgia through lower exports and
reduced remittances, particularly from Russia and Greece. The trade sector suffered the most, with
industrial production contracting by 1% in 2015. As a result, growth declined from 4.6% in 2014 to
2.8% in 2015. With parliamentary elections scheduled for October 2016 and the weakness in external
markets likely to persist, growth is projected to be 3% in 2016. The government has adopted the
Social-Economic Development Strategy of Georgia (Georgia 2020), which sets the main priorities and
issues to be addressed in the Georgian economy and society.
The Georgian economy is dominated by small and medium-sized enterprises (SMEs), which in 2010
constituted 96% of all active enterprises, 43.6% of employment and 19.3% of GDP value added. In
2014, SMEs’ contribution to GDP had increased to 21.1%, and to employment to 43.8%. In recent
years, Georgia has improved the business environment for all enterprises (including SMEs) by
simplifying administrative regulations, reducing the tax burden, fighting corruption, facilitating free
trade, promoting privatisation and initiating a policy partnership platform to build a national lifelong
entrepreneurial learning concept. During the past five years, there have been no significant changes in
the relative contribution of the various sectors to GDP. For the period 2011–2015, the industrial
sector’s contribution to GDP increased slightly, from 23.1% to 24.5%. In the same period, there was a
slight decrease in the contribution of the agricultural sector, from 9.3% to 9.2%, and in that of the
services sector, from 67.6% to 66.3%. Tourism is one of the fastest growing economic sectors in
Georgia: total contributions accounted for 23.5% of GDP and 20.1% of total direct and indirect
employment in 2015. The sector also currently provides 36.4% of total export earnings.
Georgia’s Small Business Act (SBA) for Europe assessment shows high scores for responsive
administration and access to finance. However, a lack of data compromises Georgia’s performance,
particularly for indicators addressing start-up and SME growth and training. In 2015 the Georgian
Entrepreneurship Development Agency (under the Ministry of the Economy) initiated a pilot project
(with support from the ETF) to identify SME skills needs in two sectors through enterprise surveys.
In the World Economic Forum (WEF) Global Competitiveness Report 2015–2016, Georgia scored 4.2
and ranked 66 out of 144 countries. An inadequately skilled workforce and the poor quality of
education and training remain key issues to be addressed.
2. Education and training
2.1 Trends and challenges
Education is mandatory for all children aged 6–14 years in Georgia and illiteracy is minimal (0.3% in
2010). The school system is divided into elementary (six years; ages 6–12), basic (three years; ages
12–15) and secondary (three years; ages 15–18), or, alternatively, VET (two years). Only students
with a secondary school diploma have access to higher education, and they have to pass unified
national examinations to enrol in a state-accredited higher education institution. The country has a
high rate of enrolment in upper secondary education (92% in 2014) and a low rate of early school
leavers (8% in 2014). The educational attainment level of the labour force remains relatively high:
in 2014, 62.1% of workers had secondary education and 30.4% higher education.
However, the quality of education remains an issue in Georgia’s general education system. In the
OECD 2009 Programme for International Student Assessment (PISA), Georgian students scored
below the OECD average in all fields. Only 38% of students were proficient in reading literacy, 34%
were proficient in science, and only 31% were proficient in mathematics at or above the functional
GEORGIA 2016 | 05
threshold1. Georgia’s VET system also faces challenges in terms of relevance to labour market needs
and a lack of attractiveness, as VET is considered a second choice compared with academic
pathways leading to higher education. Although enrolment in VET programmes has been increasing,
the overall participation rate remains very low. VET programmes are currently ‘dead ends’ and do not
permit students to continue their studies in higher education. This issue is addressed in the new VET
law that is under preparation.
Currently, 86 VET institutions, 29 higher educational institutions and 12 secondary general schools run
1 440 vocational education programmes based on 252 occupational standards. Although around 70 of
these institutions are private VET providers, the number of students enrolled in them is lower than the
number enrolled in public institutions. Overall, 18 752 individuals are registered as students in the
education management information system (EMIS) database and only 3% of all students enrolled in
2014 were VET students. If students wish to enrol in publicly financed VET programmes, they have to
pass the unified national examination to be eligible for voucher funding. The private accredited VET
providers do not currently receive government funding, even though they are, in some cases, the only
providers of VET in certain fields, such as nursing and medical care.
The current funding arrangements and the obligation to pass the unified national examination can be
considered discriminatory for private providers and for the vulnerable groups in most need (young
people aged 15–19), who have reduced access to enrolment in VET programmes. An analysis of the
current enrolment figures shows that almost 80% of students who are enrolled in publicly financed
VET courses are actually adults (over the age of 20), who in some cases may study in both higher
education and VET programmes free of charge. Increasing the enrolment in VET courses to 10% by
2020 is one of three specific Georgia 2020 targets for developing a workforce that meets labour
market needs; the other two are reaching 80% enrolment in preschool education and reducing the
unemployment rate to 12%.
2.2 Education and training policy and institutional setting
Important steps were taken in 2010 when the VET legislation of 2007 was substantially amended, a
comprehensive national qualifications framework was adopted, an education quality assurance
framework was implemented and multi-stakeholder governance (National VET Council) was
established. The amended VET law (2010) defines the levels of vocational education: levels 1–3 at
upper secondary level and levels 4–5 at post-secondary level. From 2013, students wishing to enrol in
VET with a public provider must pass the unified VET admission test (passing an examination is not
required for entry to private VET institutions unless defined in their internal regulations). According to
Georgian legislation, no distinction is made between initial VET and continuing VET. The Ministry of
Education and Science has drafted a new VET law that aims to make the necessary changes inspired
by ongoing reforms and pilot initiatives, but it has been delayed owing to the elections in October
2016.
The approval of the VET Development Strategy for 2013–2020 reflects the priority given to VET
development at national level and the push for a more coherent and holistic approach to VET aimed at
high quality and flexibility. The National VET Council – the main tripartite advisory and consultative
body for VET policy – operates nine thematic working groups, and has activated its work through
regular meetings and working groups. The ETF carried out a review of the efficiency and effectiveness
of the council and its current modus operandi as part of the Torino Process. Feedback from the
council members is positive in general, but there is still a long way to go to make the National VET
Council a real platform for VET policy debate and formulation. Some 27 sector committees have been
created under the NCEQE, but they suffer from an underrepresentation of enterprises and
1 Georgia also participated in the 2015 PISA, but the results are not available yet.
GEORGIA 2016 | 06
professional associations and from the corresponding predominance of education institutions and
experts.
Legislation on education quality enhancement that was passed in 2010 brought in a quality assurance
framework for all VET providers, implemented by the Ministry of Education and Science and the
NCEQE. The framework envisages two instruments for assuring quality in VET system performance,
namely authorisation (educational institution licensing) and accreditation (quality assurance at the
programme level). By 2014, 86 VET institutions were authorised and 145 of the 1 440 VET
programmes were accredited. Since 2012, the NCEQE has also used the Developing a Curriculum
(DACUM) methodology to revise its occupational standards, and some 252 occupational standards
have so far been completed. New modular VET curricula will be introduced by the end of 2017.
Georgia 2020 highlighted the low level of spending on education as a core problem. In 2013 total
expenditure on education represented 2.5% of GDP and total expenditure on VET was 0.05% of GDP.
Despite rising education spending in recent years, it remains significantly below the average levels in
the region. The physical infrastructure of education has suffered from this low expenditure level, while
VET teachers continue to be poorly paid. New funding rules came into force in September 2013, with
three types of funding for public VET providers put in place:
1. voucher-based funding (for individual students who successfully pass the unified VET admission
test and fulfil minimum standards of competence);
2. programme-based funding (covering administrative expenditure on public VET schools, including
wages, operational expenses, etc.);
3. targeted funding (particular need-based programmes according to individual applications for
funds).
In 2013 and 2014, the proportion of VET expenditure doubled. In 2016, the Ministry of Education and
Science, together with experts from the National Centre for Teacher Professional Development,
drafted a new regulation on VET teachers’ remuneration and career development. If the document is
adopted, it is expected to improve teachers’ status and salary, as well as to motivate young people to
choose a VET teaching career.
The Ministry of Education and Science carried out a review of institutional arrangements with the
support of the EUVEGE project (technical assistance component of the EU Sector Reform Contract)
using an ETF-developed methodology. The review report aimed to assess how the current institutional
setting and distribution of functions support the ongoing VET reform and implementation of the VET
strategy. One of the outcomes of the report is a proposal to establish a National Skills Agency under
the ministry that would be an operational arm for assisting the ministry in VET strategy implementation
and, in particular, in the day-to-day guidance and management of VET providers. The idea of creating
another (new) agency in the current VET system requires caution, since most of the functional
problems stem primarily from the staff limitations in the existing institutions, rather than from the type
of institutions. The EUVEGE project plans to carry out a feasibility study on the proposed agency with
its pros and cons and the cost implications for the overall management of the Georgian VET system;
this seems to be a good way forward in assessing its costs and benefits.
GEORGIA 2016 | 07
3. Labour market and employment
3.1 Trends and challenges
Despite the economic growth during the past decade, the Georgian labour market features a number
of structural problems.
■ Economic growth has not translated to employment growth.
■ Self-employment accounts for a large proportion of the labour market, especially in subsistence
agriculture in rural areas.
■ There is a high level of urban unemployment.
Agriculture continues to be the largest source of employment, with a share of 50.9% in 2014 (down
from 53.0% in 2011), followed by services, with a 39.1% share (up from 37.1% in 2011) and, finally,
industry, with a 10.0% share. The share of self-employment in the Georgian labour market was 57.2%
of the workforce in 2015 (down from 61.6% in 2011), in low-value-added and low-paid jobs, primarily
in subsistence agriculture, accounting for a significant proportion of the underemployment in the
country.
Georgia’s activity rate (aged 15+) is comparable with that in some EU countries (67.8% in 2015),
although there is almost a 20 percentage point difference between the rates for men (78%) and
women (59%). The total employment rate reached 60% in 2015, while the unemployment rate (aged
15+) has been declining, from 15% in 2011 to 12% in 2015. Both youth unemployment and total
unemployment are much higher than average in some regions of the country; for example, in the
Semegrelo and Zemo Svaneti regions, the rates are 43% and 12.5% respectively, in Ajara region
41.5% and 15.1%, and in Tbilisi 39% and 21.4% (Geostat, 2015). This is explained by the
predominance of subsistence agriculture as the main source of employment in other regions, pointing
to severe underemployment. Unemployment affects all Georgians, irrespective of their standard of
living. According to the 2013 welfare monitoring survey, 58% of the poorest quintile and 30% of the
richest quintile reported unemployment to be the main problem for households. Nearly 45% of all
unemployed individuals had been searching for a job for more than one year. The problem is more
severe for young people transitioning from school (World Bank, 2014).
In both 2013 and 2014, the unemployment rate for those with higher education was almost twice as
high as for those with VET education. This can be explained by a marginal participation rate in VET
programmes among the population. Since 2014, the unemployment rate among the population with
higher education has slightly decreased, whereas among those with VET it has slightly increased. The
high rate of unemployment among university graduates reflects the relative scarcity of jobs requiring
tertiary-level education in Georgia; in agriculture and trade (the two largest sectors) the demand for
graduates is limited. Furthermore, many Georgian employers complain about the difficulties of finding
workers with the required skills (see, for example, World Bank-EBRD Business Environment and
Enterprise Performance (BEEP) surveys and WEF Global Competitiveness reports). Innovative and
growing firms in particular suffer most from skill shortages. Despite the large supply of highly educated
workers, a lack of specific skills and a vertical mismatch seem to be major constraints on employment
(World Bank, 2013).
The youth unemployment rate is much higher than the overall unemployment rate, although it
decreased from 35.6% in 2011 to 30.8% in 2015. The unemployment rate for young people (15–
24 years) with a VET background decreased by 11.5%, from 47.1% in 2013 to 35.6% in 2015
(Geostat, 2015). The unemployment rate for those with VET is still higher than for those with higher
education (30.8% in 2015). This can be explained by the vicious cycle of a lack of work-based
practical experience and the fact that companies tend to employ individuals with higher levels of

GEORGIA 2016 | 08
education than are actually required by the job. In addition, the rate of individuals not in employment,
education or training (NEET) for the 15–24 age group is 30%, rising to 35% for those aged 15–
29 years (ETF, 2015). This means that one-third of young people in Georgia neither work nor are in
education or training. The NEET rate for women is higher than for men and increases with age: the
rate for women in the 15–24 age group is 36%, rising to 43% in the 15–29 age group, while it remains
at almost the same rate for men in both these groups (around 26%). Overall, women constitute almost
61% of all NEETs aged 15–29 years. Less educated people are less likely to become NEETs; rather,
it is young people with an intermediate education (especially VET graduates) and university graduates
who face the highest risk of becoming NEETs.
The Ministry of Labour, Health and Social Affairs launched the first labour market demand survey in
2015. The pilot research was designed to reveal employment by economic sectors and by
geographical territories in order to identify labour shortages as well as other labour market indicators.
The research covered 240 companies in the qualitative component and 6 000 in the quantitative
component, these having been identified through a nationally representative stratified random sample.
The survey results showed that the overall demand for labour remains very low owing to a limited
number of vacancies and job openings (ETF, 2016). The companies interviewed identified the skills
mismatch (lack of relevant skills for a job), the lack of applicants, and salary requirements as the
biggest obstacles to hiring.
The survey revealed that the number of jobs has significantly increased in commerce (+12 002) and in
the education sector (+6 198), while it has substantially declined in the construction sector (−11 595).
However, the construction sector remains the leader in terms of employment (74 397). The qualitative
component of the survey revealed a number of positions that were considered hard-to-fill vacancies,
including marketing manager, sales manager, food technologist, project manager, financial specialist
and risk analyst. The survey results were used to prepare the list of occupations in most demand,
which would be a priority for the first government-financed retraining programme for jobseekers. The
employment services of the Social Service Agency launched the first pilot retraining programme at the
end of 2015 and around 400 jobseekers were reportedly retrained. There is no information or data
available on the effectiveness of the programme or on the placement rate of the unemployed
individuals retrained.
3.2 Employment policy and institutional setting
The Georgia 2020 strategy, which sets out an overall policy framework for employment and the labour
market, recognises the need to improve labour market functioning. It defines several activities to be
carried out in order to institutionalise labour market research, develop labour market intelligence,
ensure effective communication between employers and jobseekers, develop public and private job
mediation services, create a system for retraining unemployed individuals and jobseekers, and launch
programmes to promote self-employment and entrepreneurial activities. Moreover, the EU–Georgia
Association Agreement including the Deep and Comprehensive Free Trade Area signed in 2014
requires labour and employment legislation to be adapted to European standards (for example, on
decent work, employment policy, ALMPs, health and safety at work, social dialogue, social protection,
social inclusion of people with disabilities and from minority groups, gender equality and anti-
discrimination laws).
After a decade of laissez-faire employment policy between 2003 and 2013, the new Georgian
government amended the Labour Code in 2013 and adopted a new Labour Market Strategy 2013–
2014 and associated action plan, aimed at the re-establishment of labour market institutions.
GEORGIA 2016 | 09
Five main actions were set out:
■ establishment/improvement of the legal base;
■ formation/development of labour market institutions to enhance the range and quality of services
available to jobseekers;
■ improved labour market information system;
■ greater synergy between the needs of the labour market and VET provision;
■ support for legal, temporary migration.
Accordingly, the Ministry of Labour, Health and Social Affairs created a new Employment and Labour
Policy Department that comprises a Labour Migration Unit, Social Partnership Unit and Labour Market
Information and Employment Promotion Unit2. In 2015 the Employment Promotion Unit started an
annual labour market review, including, for the first time, qualitative and quantitative analyses of
macroeconomic and labour force survey and employer survey data. Following the renewed Labour
Market Strategy (2015–2018) and the related action plan (Resolution No 732, December 2014), the
government also adopted:
■ the development of lifelong vocational counselling and career planning service and action plan for
2015–2017 (Resolution No 721, December 2014);
■ the development of the labour market information system and action plan for 2015–2018
(Resolution No 733, December 2014);
■ the State Strategy on ALMP and Action Plan for 2016–2018 (adopted on 21 March 2016).
The Programme for Employment Support Services Development and associated action plan 2015–
2018 (Ministerial Order, December 2014) defines the employment support services to be provided by
the Social Service Agency, including job counselling and placement services, ALMPs and labour
market intelligence. The agency has launched a job portal called WorkNet (www.worknet.gov.ge) to
register jobseekers and job vacancies. Jobseekers can now access and register online, but the
components on vacancies and education and training opportunities have not yet been activated.
Automatic job matching between jobseekers and employers will be possible through the website, but
there is, as yet, no tracking of online matches nor any analysis of existing registers.
Georgia receives substantial donor support for reforming its VET and labour market systems. The
major international donor is the EU with an Employment and VET Sector Reform Contract (2014–
2017): EUR 20 million in direct budget support and EUR 7 million in complementary measures
(technical assistance, twinning and a grant scheme). This started in November 2014 and is a follow-up
to the previous EU VET Sector Support Programme (EUR 21 million for 2009–2012). The project
includes three main components:
■ effective labour market management (labour market information system, public employment
services, ALMPs, occupational health and safety);
■ improved quality in the VET system (curricula for VET occupations, occupational standards,
teacher training, the national qualifications framework, validation of non-formal/informal learning);
■ efficient transition from training to employment (career guidance and counselling, tracer studies,
work-based learning, education management information system).
2 Based on information obtained in bilateral meetings, the ministry has a total permanent staff of 238 and an additional 59 contracted employees. The Employment and Labour Policy Department, however, still has fewer than 20 employees.

GEORGIA 2016 | 10
It will end in November 2017, with a possible extension of the technical assistance component for one
more year.
In September 2015, within the framework of the EU Sector Contract, the EU twinning team started
work for 18 months in the Social Service Agency, with five support components:
■ transposition of the EU acquis on anti-discrimination and gender equality legislation;
■ a functional analysis on how to set up a public employment service;
■ improving the WorkNet system;
■ human resource and training planning;
■ public relations and visibility.
The twinning team has mapped the current situation and has made recommendations for an
independent agency under the Ministry of Labour, Health and Social Affairs. The proposal on the
restructuring of the Social Service Agency and the deployment of several hundred staff to employment
services has been submitted, but political and funding decisions have been postponed owing to the
parliamentary elections in October 2016.
In spite of the efforts made by the government to reinvigorate the labour market institutions and their
operations, the lack of professionals and limited capacity remain major concerns for the
implementation and sustainability of reform actions. More support is required for capacity development
and institution building in employment and the labour market, not only in the capital, Tbilisi, but also
throughout the country. Skills development actions should be better linked to the economic
development agenda and to prospective sectors that can create employment opportunities, and
should target vulnerable groups such as young people, the rural population and long-term unemployed
individuals.

GEORGIA 2016 | 11
ANNEXES
Statistical annex
This annex reports annual data from 2011 and 2015 or the last available year.
Indicator 2011 2015
1 Total population (000) 4 469.2 3 729.5
2 Relative size of youth population (age group 15–24) (%) 22.3 20.2
3 Youth dependency ratio (%) 24.8 25.2
4 Old-age dependency ratio (%) 20.8 20.4
5 Global Competitiveness Index Rank 88 66
Score 4.0 4.2
6 GDP growth rate (%) 7.2 2.8
7 GDP per capita (PPP) (current international $) 7 315.1 9 379.2
8 GDP by sector (%) Agriculture added value 9.3 9.2
Industry added value 23.1 24.5
Services added value 67.6 66.3
9 Poverty headcount ratio at $3.10 a day (2011 PPP) (%) 36.8 28.6 (2013)
10 Gini index (%)(6) 46.0 42.0
11 Educational attainment of adult population (aged 15+) (%)(1) (3)
Low(4) 4.7 4.4 (2014)
Medium 62.0 62.1 (2014)
High 33.3 33.5 (2014)
12 Gross enrolment rates in secondary education (%) 88.1 (2009)
99.4 (2014)
13 Share of VET students in secondary education (%) 1.5 (2009)
5.0 (2014)
14 Gross enrolment rates in upper secondary education (%) 83.1 (2009)
91.5 (2014)
15 Share of VET students in upper secondary education (%) 2.9 (2009)
10.0 (2014)
16 Low achievement in reading, mathematics and science – PISA (%)
Reading N.A. N.A.
Mathematics N.A. N.A.
Science N.A. N.A.
17 Participation in training/lifelong learning (age group 25–64) by sex (%)
Total M.D. M.D.
Male M.D. M.D.
Female M.D. M.D.
18 Early leavers from education and training (age group 18–24) by sex (%)(1)
Total 8.7 7.6 (2014)
Male 9.7 8.3 (2014)
Female 7.7 6.8 (2014)
GEORGIA 2016 | 12
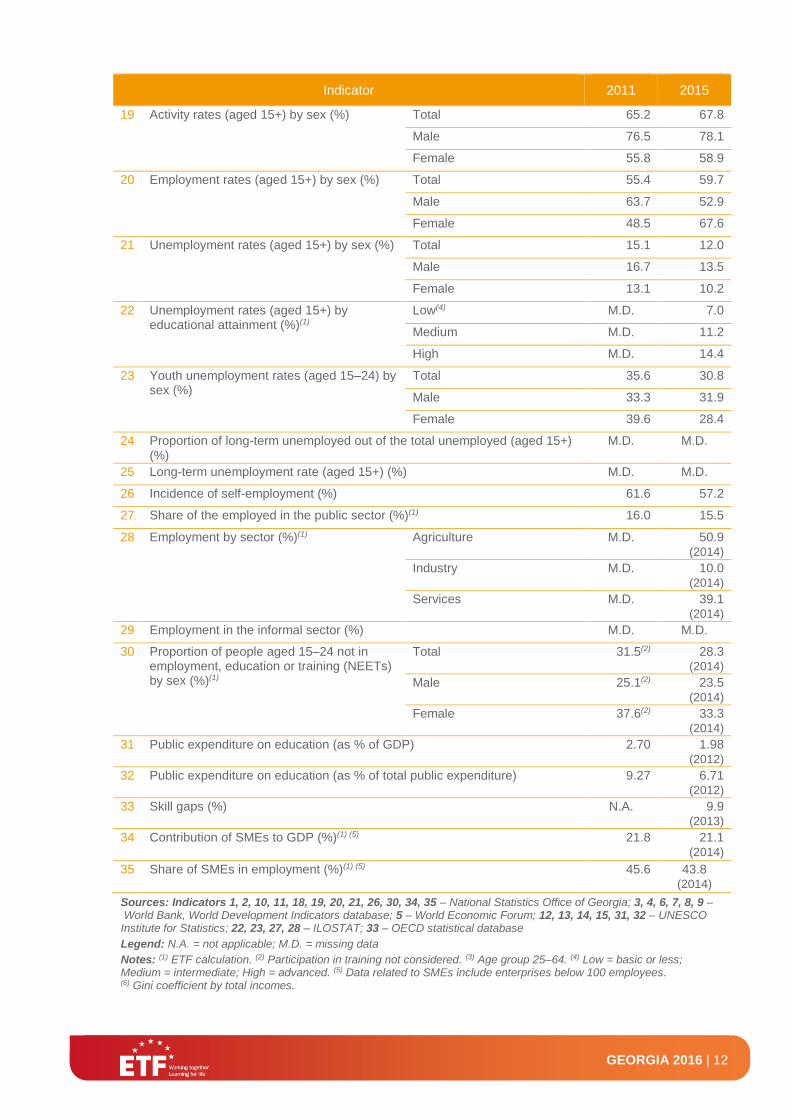
Indicator 2011 2015
19 Activity rates (aged 15+) by sex (%) Total 65.2 67.8
Male 76.5 78.1
Female 55.8 58.9
20 Employment rates (aged 15+) by sex (%) Total 55.4 59.7
Male 63.7 52.9
Female 48.5 67.6
21 Unemployment rates (aged 15+) by sex (%) Total 15.1 12.0
Male 16.7 13.5
Female 13.1 10.2
22 Unemployment rates (aged 15+) by educational attainment (%)(1)
Low(4) M.D. 7.0
Medium M.D. 11.2
High M.D. 14.4
23 Youth unemployment rates (aged 15–24) by sex (%)
Total 35.6 30.8
Male 33.3 31.9
Female 39.6 28.4
24 Proportion of long-term unemployed out of the total unemployed (aged 15+) (%)
M.D. M.D.
25 Long-term unemployment rate (aged 15+) (%) M.D. M.D.
26 Incidence of self-employment (%) 61.6 57.2
27 Share of the employed in the public sector (%)(1) 16.0 15.5
28 Employment by sector (%)(1) Agriculture M.D. 50.9 (2014)
Industry M.D. 10.0 (2014)
Services M.D. 39.1 (2014)
29 Employment in the informal sector (%) M.D. M.D.
30 Proportion of people aged 15–24 not in employment, education or training (NEETs) by sex (%)(1)
Total 31.5(2) 28.3 (2014)
Male 25.1(2) 23.5 (2014)
Female 37.6(2) 33.3 (2014)
31 Public expenditure on education (as % of GDP) 2.70 1.98 (2012)
32 Public expenditure on education (as % of total public expenditure) 9.27 6.71 (2012)
33 Skill gaps (%) N.A. 9.9 (2013)
34 Contribution of SMEs to GDP (%)(1) (5) 21.8 21.1 (2014)
35 Share of SMEs in employment (%)(1) (5) 45.6 43.8 (2014)
Sources: Indicators 1, 2, 10, 11, 18, 19, 20, 21, 26, 30, 34, 35 – National Statistics Office of Georgia; 3, 4, 6, 7, 8, 9 – World Bank, World Development Indicators database; 5 – World Economic Forum; 12, 13, 14, 15, 31, 32 – UNESCO Institute for Statistics; 22, 23, 27, 28 – ILOSTAT; 33 – OECD statistical database
Legend: N.A. = not applicable; M.D. = missing data
Notes: (1) ETF calculation. (2) Participation in training not considered. (3) Age group 25–64. (4) Low = basic or less; Medium = intermediate; High = advanced. (5) Data related to SMEs include enterprises below 100 employees. (6) Gini coefficient by total incomes.

GEORGIA 2016 | 13
Definition of indicators
Description Definition
1 Total population (000) The total population is estimated as the number of persons having their usual residence in a country on 1 January of the respective year. When information on the usually resident population is not available, legal or registered residents can be considered.
2 Relative size of youth population (age group 15–24) (%)
The ratio of the youth population (aged 15–24) to the working-age population (usually aged 15–64 or 15–74).
3 Youth dependency ratio (%) The ratio of younger dependents (people younger than 15) to the working-age population (those in the 15–64 age group).
4 Old-age dependency ratio (%) The ratio of older dependents (people older than 64) to the working-age population (those in the 15–64 age group).
5 Global Competitiveness Index The Global Competitiveness Index assesses the competitiveness landscape, providing insight into the drivers of countries’ productivity and prosperity. It is expressed as a score on a 1 to 7 scale, with 7 being the most desirable outcome.
6 GDP growth rate (%) The annual percentage growth rate of GDP at market prices based on constant local currency.
7 GDP per capita (PPP) (current international $)
The market value of all final goods and services produced within a country in a given period of time (GDP), divided by the total population and converted into international dollars using purchasing power parity (PPP) rates.
8 GDP by sector (%) The share of value added from agriculture, industry and services.
9 Poverty headcount ratio at $2 a day (PPP) (%)
The percentage of the population living on less than $2.00 a day at 2005 international prices.
10 Gini index (%) A Gini index measures the extent to which the distribution of income (or, in some cases, consumption expenditure) among individuals or households within an economy deviates from a perfectly equal distribution. A Gini index of 0 represents perfect equality, while an index of 100 implies perfect inequality.
11 Educational attainment of adult population (aged 25–64 or 15+) (%)
Educational attainment refers to the highest educational level achieved by individuals expressed as a percentage of all persons in that age group.
12 Gross enrolment rates in secondary education (%)
The number of students enrolled in a given level of education, regardless of age, expressed as a percentage of the official school-age population corresponding to the same level of education.
13 Share of VET students in secondary education (%)
The proportion of VET students in secondary education out of the total number of pupils and students in secondary education (general + VET).
14 Gross enrolment rates in upper secondary education (%)
The number of students enrolled in a given level of education, regardless of age, expressed as a percentage of the official school-age population corresponding to the same level of education.
15 Share of VET students in upper secondary education (%)
The proportion of VET students in upper secondary education out of the total number of pupils and students in upper secondary education (general education + VET).
16 Low achievement in reading, mathematics and science – PISA (%)
The share of 15-year-olds failing to reach level 2 in reading, mathematics and science.
17 Participation in training/lifelong learning (age group 25–64) by sex (%)
The share of persons aged 25–64 who stated that they had received education or training in the four weeks preceding the (LFS) survey.

GEORGIA 2016 | 14
Description Definition
18 Early leavers from education and training (age group 18–24) by sex (%)
The percentage of the population aged 18–24 with at most lower secondary education who were not in further education or training during the four weeks preceding the (LFS) survey. Lower secondary education refers to ISCED 1997 levels 0–3C short for data up to 2013 and to ISCED 2011 levels 0–2 for data from 2014 onwards.
19 Activity rates (aged 15+) by sex (%)
Activity rates represent the labour force as a percentage of the working-age population.
20 Employment rates (aged 15+) by sex (%)
Employment rates represent persons in employment as a percentage of the working-age population.
21 Unemployment rates (aged 15+) by sex (%)
Unemployment rates represent unemployed persons as a percentage of the labour force.
22 Unemployment rates (aged 15+) by educational attainment (%)
Educational levels refer to the highest educational level successfully completed. Three levels are considered: low (ISCED levels 0–2); medium (ISCED levels 3–4); and high (ISCED 1997 levels 5–6 and ISCED 2011 levels 5–8).
23 Youth unemployment rates (aged 15–24) by sex (%)
Youth unemployment rates represent young unemployed persons (aged 15–24) as a percentage of the labour force (15–24).
24 Proportion of long-term unemployed out of the total unemployed (aged 15+) (%)
The number of unemployed persons aged 15+ who are long-term unemployed (12 months or more) as a percentage of unemployed persons aged 15+.
25 Long-term unemployment rate (aged 15+) (%)
The number of unemployed persons aged 15+ who are long-term unemployed (12 months or more) as a percentage of the labour force aged 15+.
26 Incidence of self-employment (%) The share of self-employed as a proportion of the total employed. Self-employment includes employers, own-account workers, members of producers’ cooperatives and contributing family workers.
27 Share of the employed in the public sector (%)
The share of those employed in the public sector as a proportion of the total employed.
28 Employment by sector (%) The share of those employed in agriculture, industry and services.
29 Employment in the informal sector The share of persons employed in the informal sector in total non-agricultural employment.
30 Proportion of people aged 15–24 not in employment, education or training (NEETs) (%)
The percentage of the population of a given age group who are not employed and not involved in further education or training.
31 Public expenditure on education (as % of GDP)
Public expenditure on education expressed as a percentage of GDP. Generally, the public sector funds education either by directly bearing the current and capital expenses of educational institutions, or by supporting students and their families with scholarships and public loans, as well as by transferring public subsidies for educational activities to private firms or non-profit organisations. Both types of transactions together are reported as total public expenditure on education.
32 Public expenditure on education (as % of total public expenditure)
Public expenditure on education expressed as a percentage of total public expenditure. Generally, the public sector funds education either by directly bearing the current and capital expenses of educational institutions, or by supporting students and their families with scholarships and public loans as well as by transferring public subsidies for educational activities to private firms or non-profit organisations. Both types of transactions together are reported as total public expenditure on education.
33 Skill gaps (%) The percentage of firms identifying an inadequately educated workforce as a major constraint.
34 Contribution of SMEs to GDP (%) The share of value added from small and medium-sized businesses.
35 Share of SMEs in employment (%)
The share of persons employed in small and medium-sized businesses.

GEORGIA 2016 | 15
ABBREVIATIONS AND ACRONYMS
ALMPs Active labour market policies
ETF European Training Foundation
EU European Union
EUVEGE EU Technical Assistance to VET and Employment Reforms in Georgia project
GDP Gross domestic product
LFS Labour force survey
NCEQE National Centre for Educational Quality Enhancement
NEET Not in employment, education or training
PISA Programme for International Student Assessment
PPP Purchasing power parity
SMEs Small and medium-sized enterprises
VET Vocational education and training
WEF World Economic Forum
REFERENCES
ETF (European Training Foundation), Young people not in employment, education or training (NEET):
An overview in ETF partner, 2015. Last accessed 13 February 2017 at:
www.etf.europa.eu/web.nsf/pages/NEET_ETF_partner_countries
ETF (European Training Foundation), ‘Torino Process 2016–17: Georgia’, Draft, 2016.
World Bank, Georgia Skills mismatch and unemployment: Labour market challenges, Report
No 72824-GE, 2013. Last accessed 13 February 2017 at:
http://documents.worldbank.org/curated/en/999371468242985088/pdf/728240ESW0Geor00Box37737
4B00PUBLIC0.pdf
World Bank, Georgia: Winds of optimism, Georgia Economic Report No 6, 2014. Last accessed
13 February 2017 at:
http://documents.worldbank.org/curated/en/417251468251451738/pdf/916970NWP0Georgia0ER0Box
385342B00PUBLIC0.pdf

FOR FURTHER INFORMATION ABOUT OUR ACTIVITIES PLEASE CONTACT:
COMMUNICATION DEPARTMENT EUROPEAN TRAINING FOUNDATION VIALE SETTIMIO SEVERO 65I - 10133 TORINO
E: [email protected] T: +39 011 6302222 F: +39 011 6302200 WWW.ETF.EUROPA.EU


![LWK 0-11 B4 - Startseite - [WSA Berlin] · ugm tca tem sba acm smm smm acm aam aam sba agm agm cbm qrm sbm sba sbm tma sba psm tma tca tma tcm sba pda sba sbm sbm sba tcm ara tmm](https://img.dokumen.tips/doc/110x75/5e04232e2810341c1c798ad3/lwk-0-11-b4-startseite-wsa-berlin-ugm-tca-tem-sba-acm-smm-smm-acm-aam-aam.jpg)